Protein Structural Dynamics of Wild-Type and Mutant Homodimeric Hemoglobin Studied by Time-Resolved X-Ray Solution Scattering

 ,
,
Abstract
:1. Introduction
2. Structural Dynamics of HbI studied by TRXSS
2.1. Data Acquisition of TRXSS Data
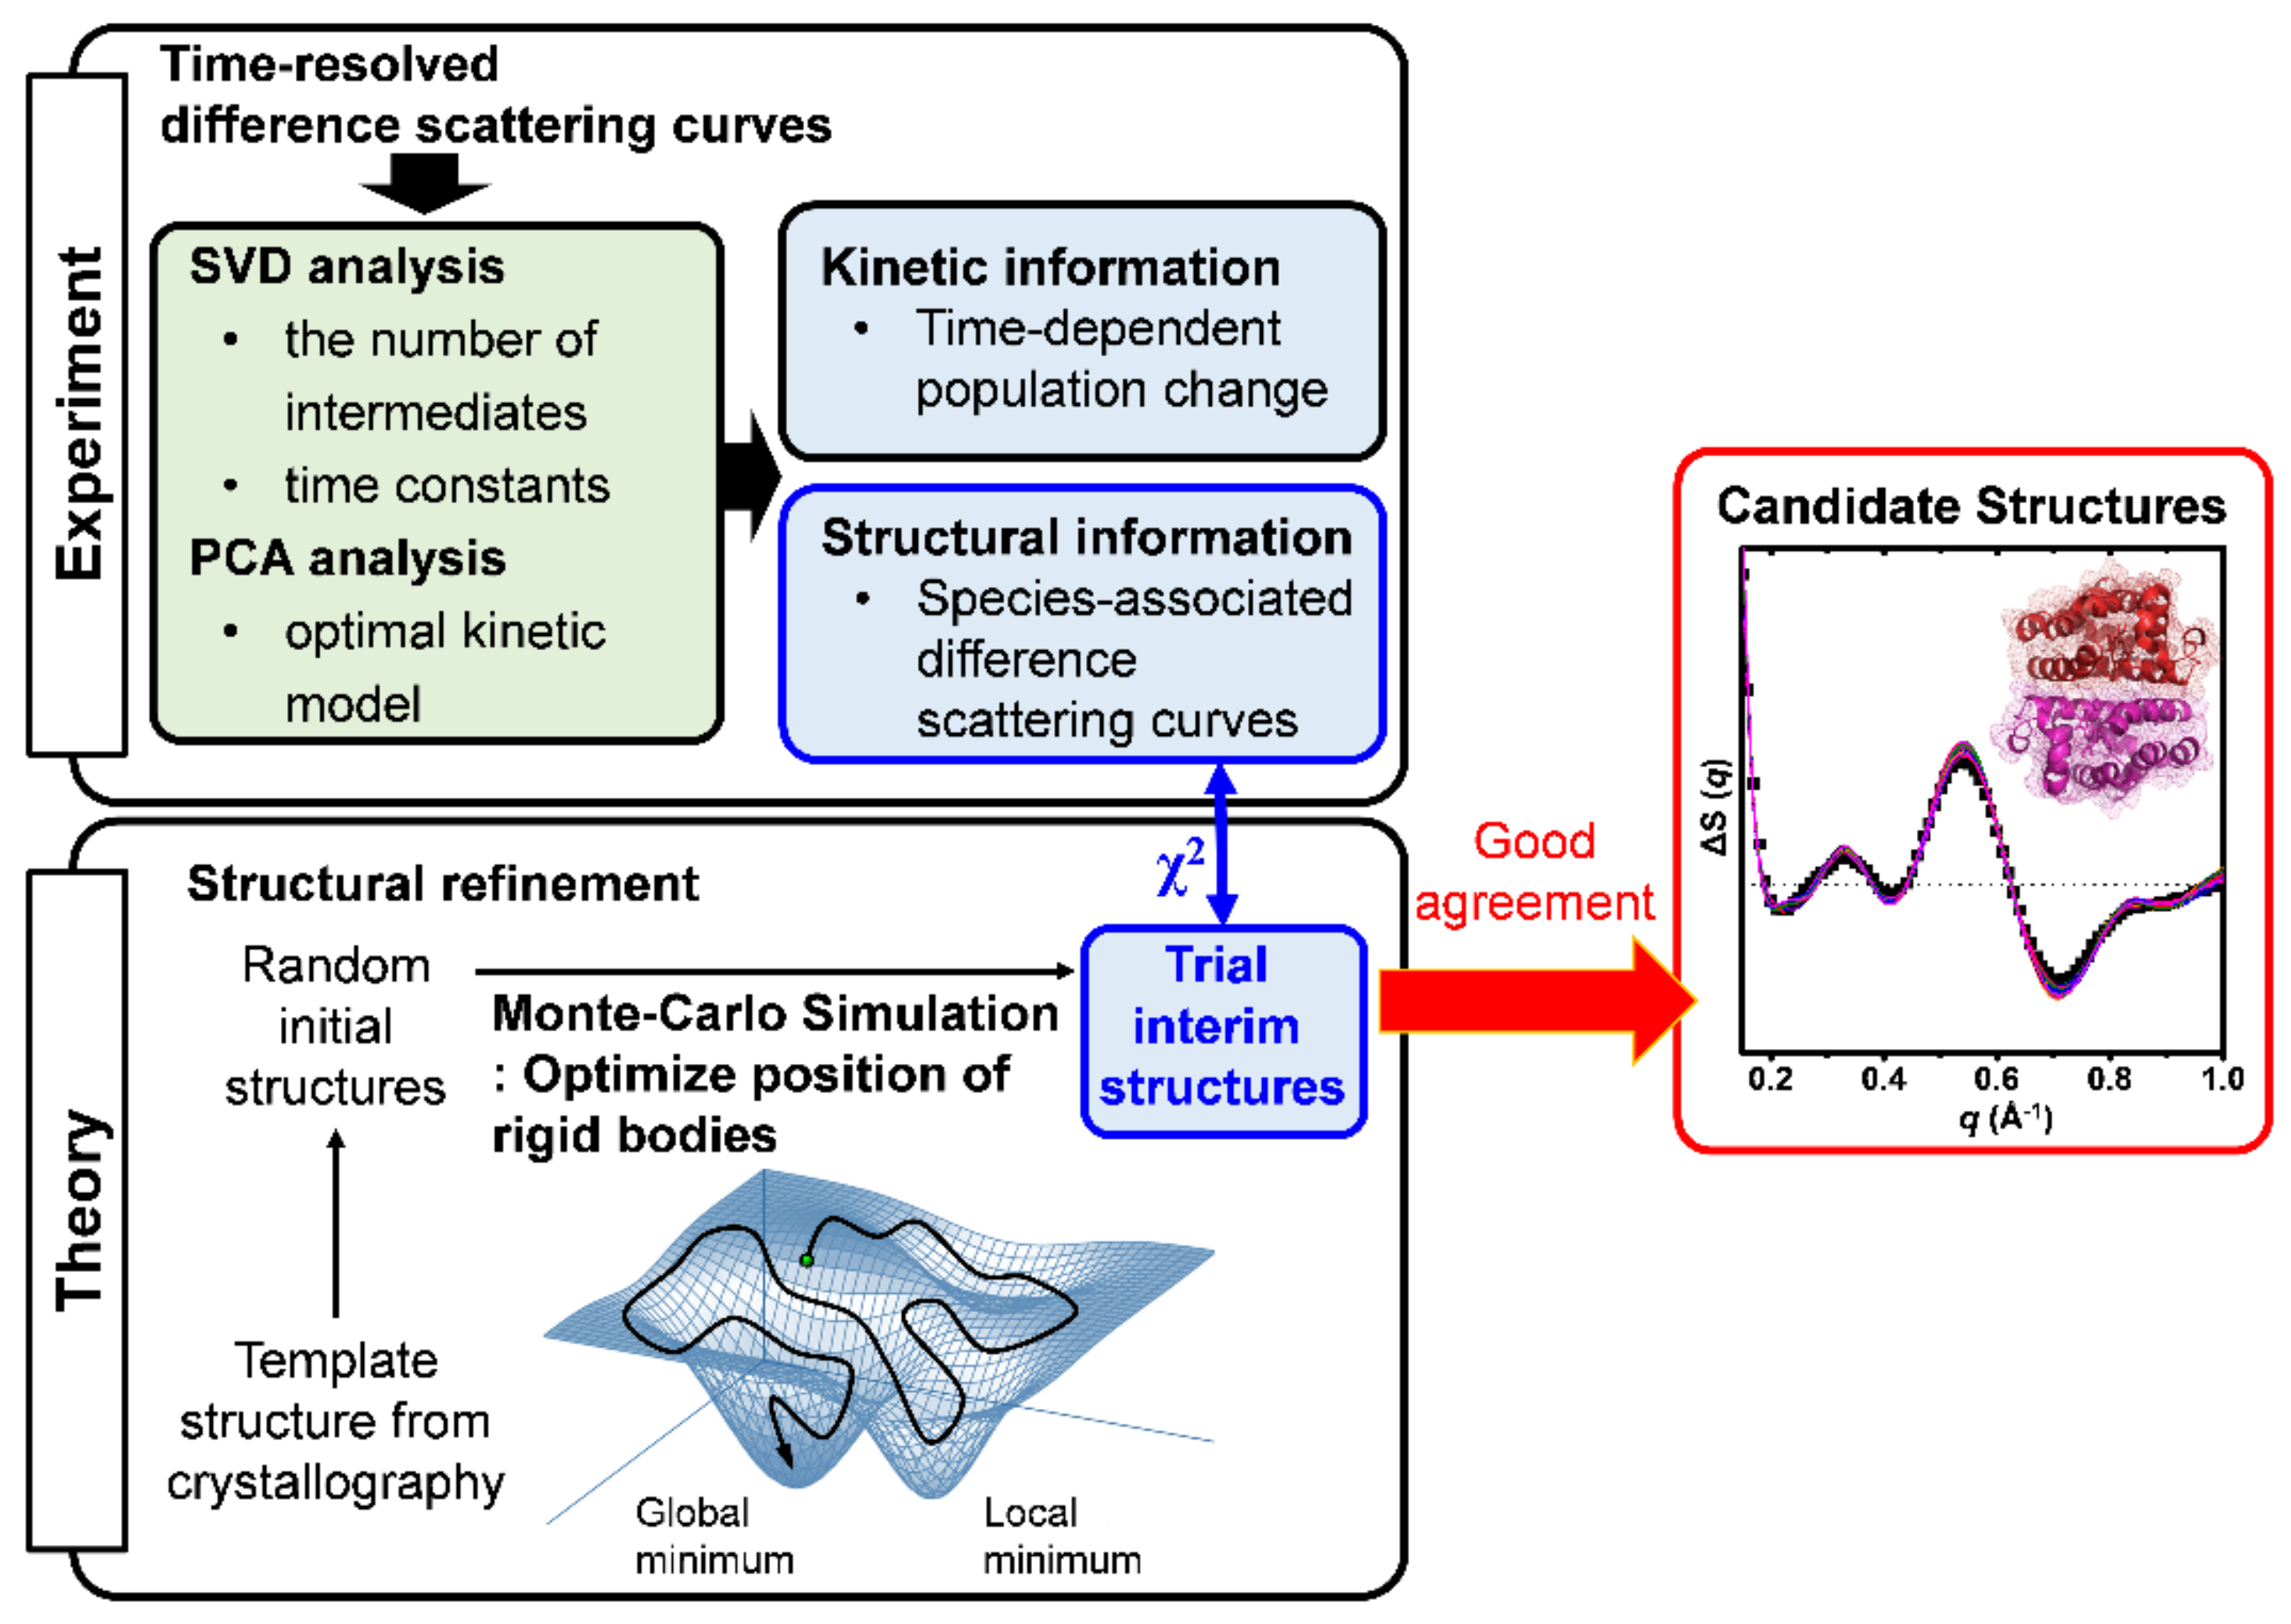
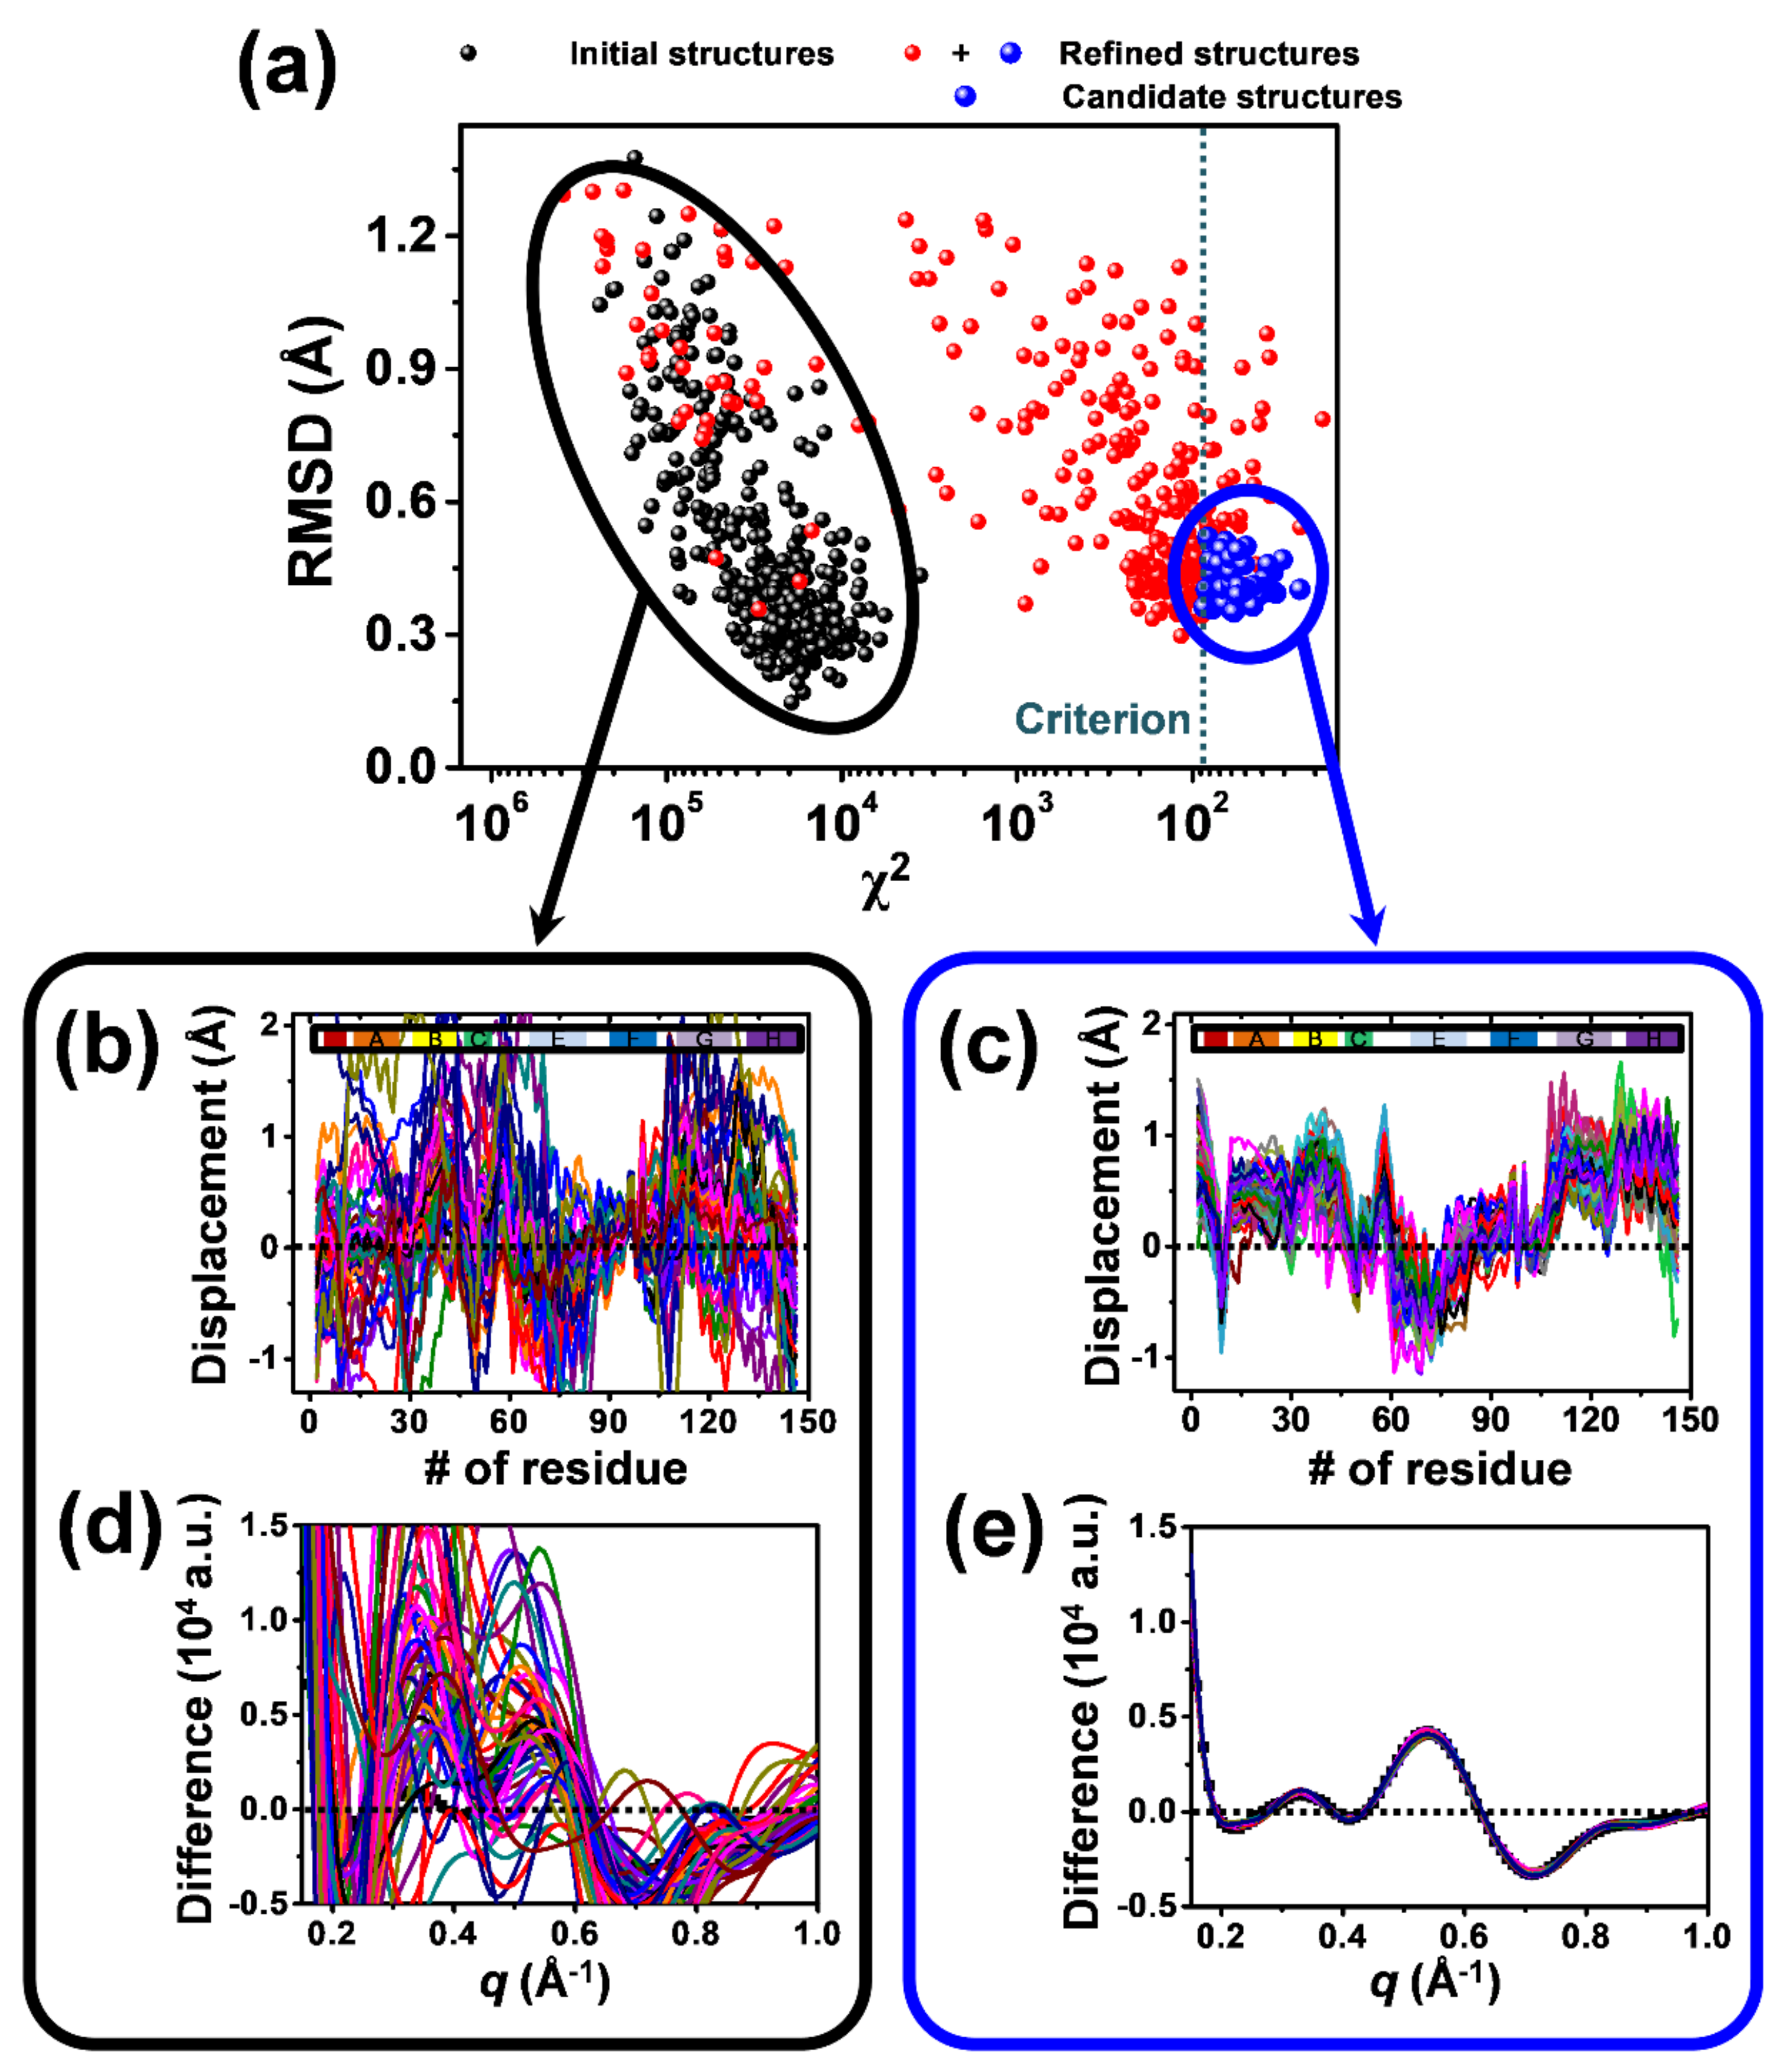
2.2. Structure Refinement Used for the Analysis of TRXSS Data
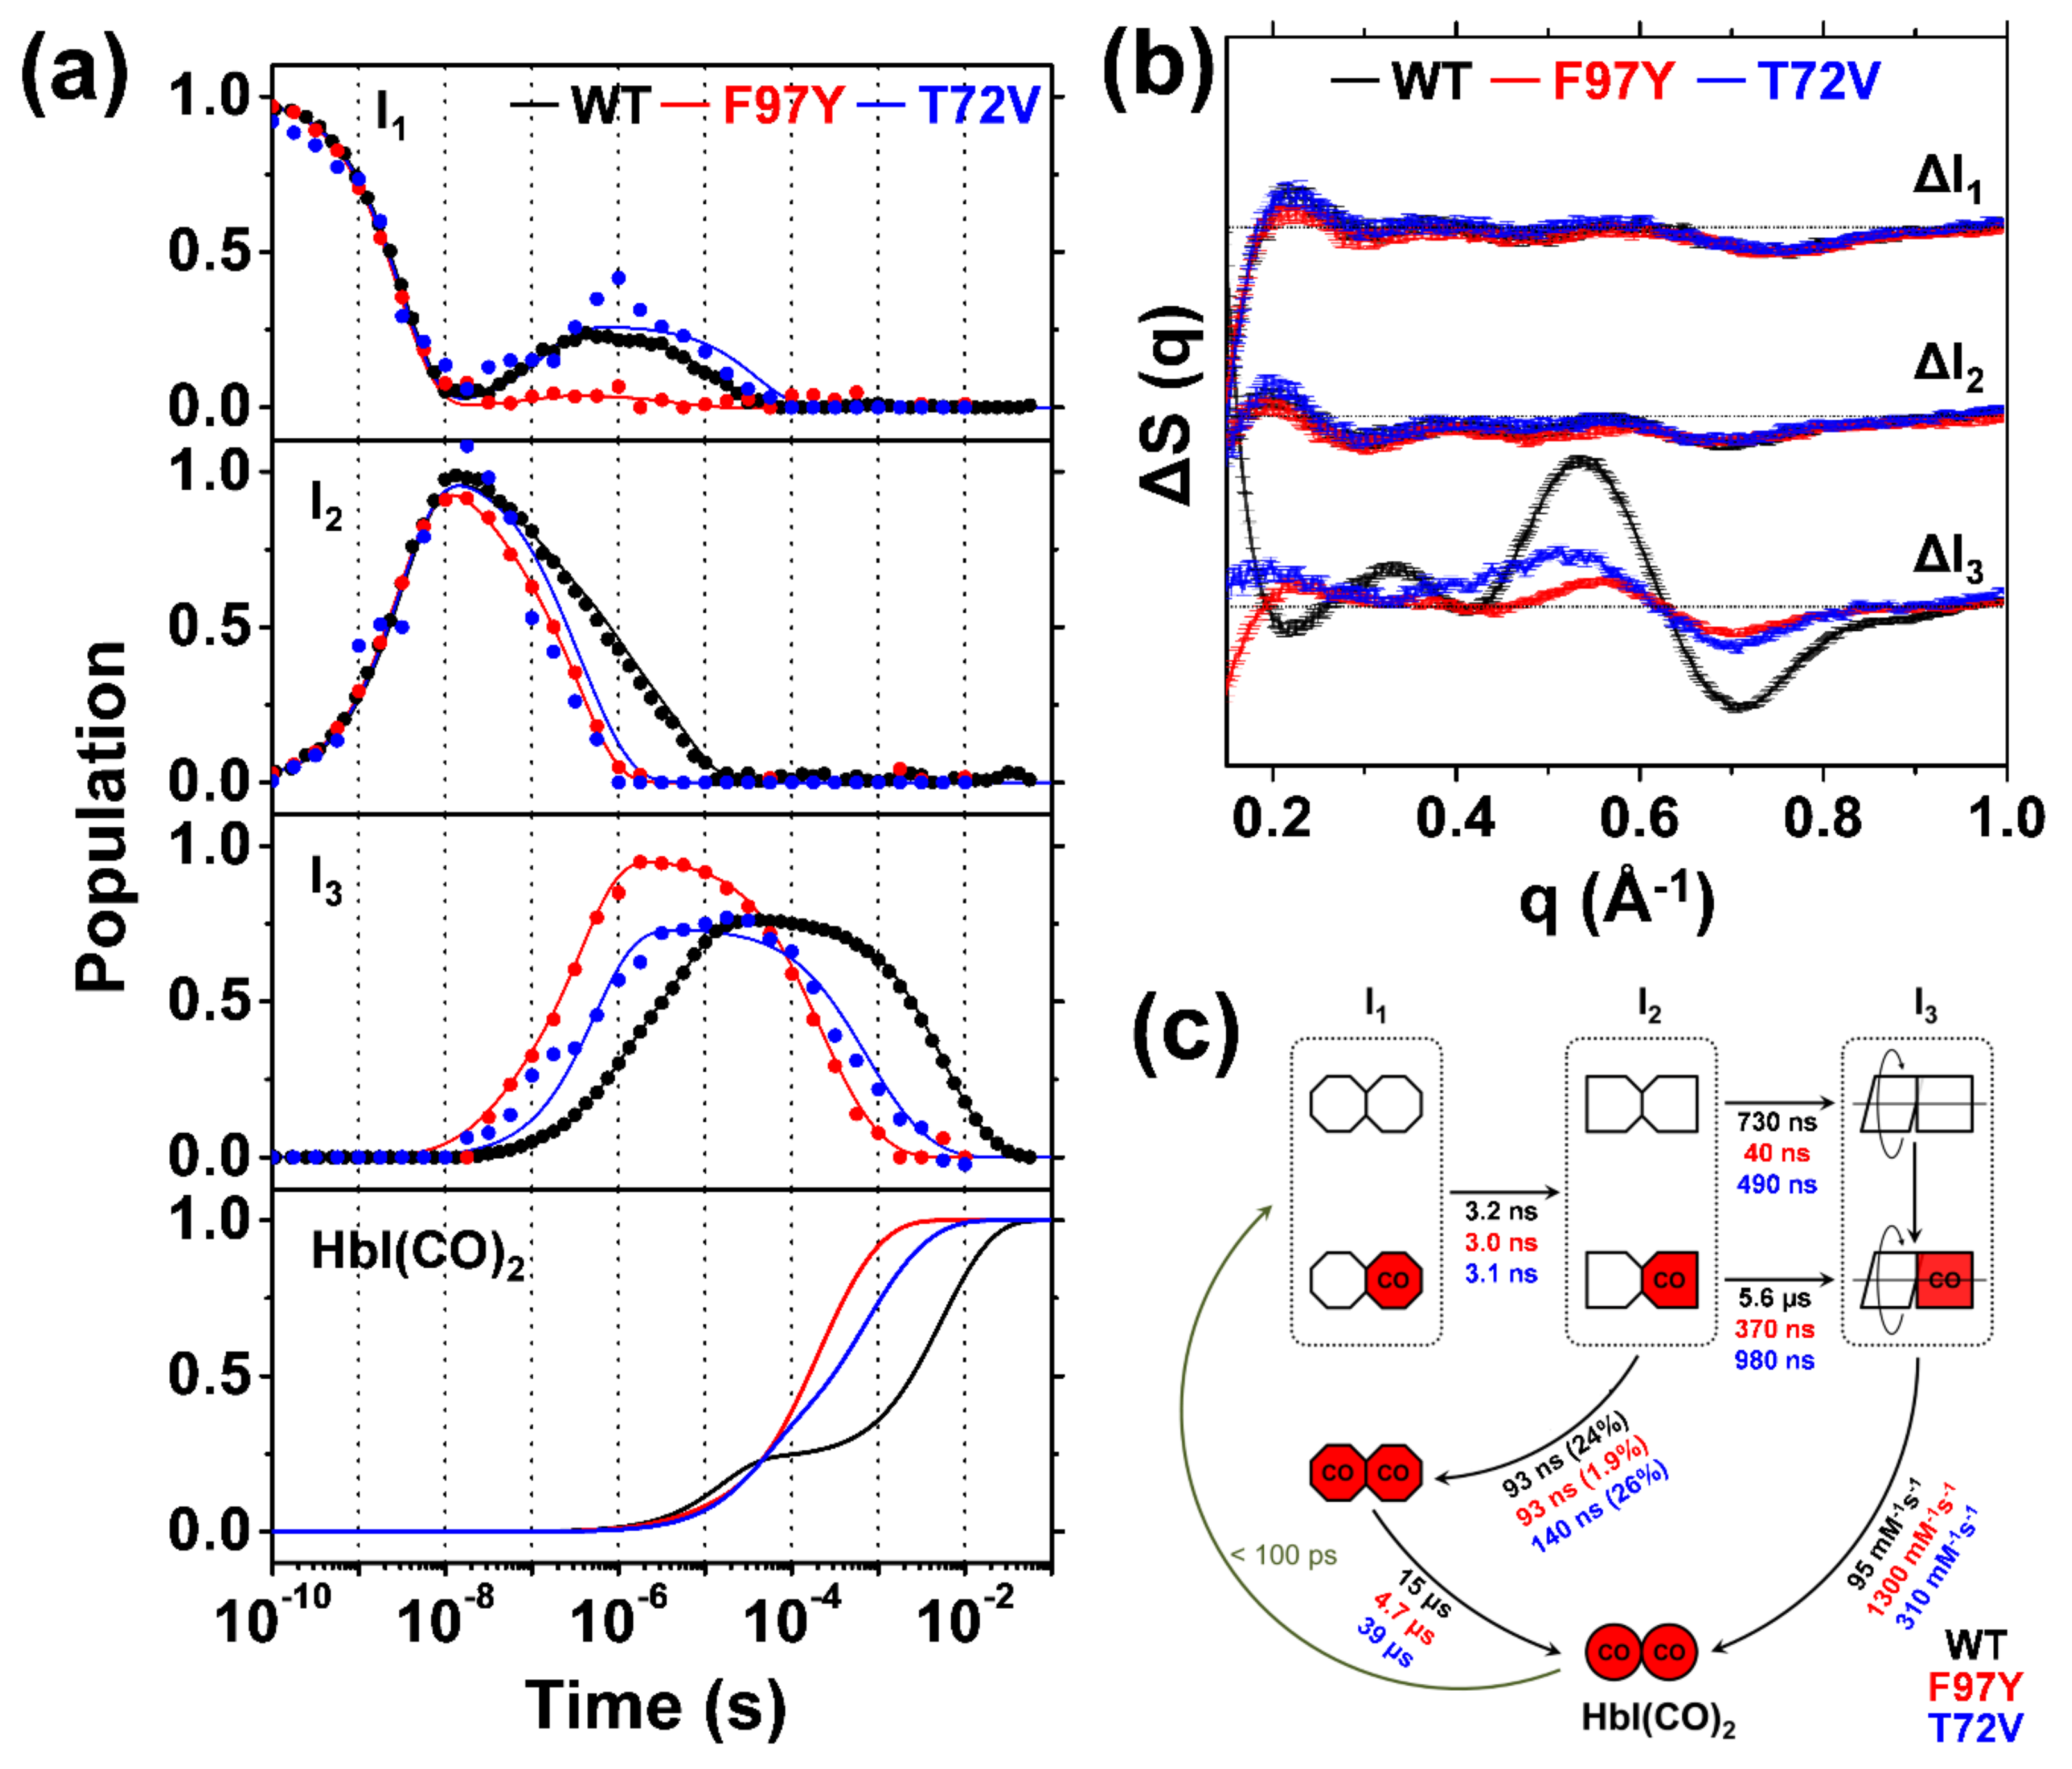
2.3. TRXSS Results of WT HbI
2.4. TRXSS Results of F97Y HbI
2.5. TRXSS Results of T72V HbI
3. Discussion
4. Conclusions
Author Contributions
Funding
Acknowledgments
Conflicts of Interest
Abbreviations
| Hb | Human hemoglobin |
| HbI | Homodimeric hemoglobin from Scapharca inaequivalvis |
| R state | Relaxed state |
| T state | Tense state |
| WT | Wild-type |
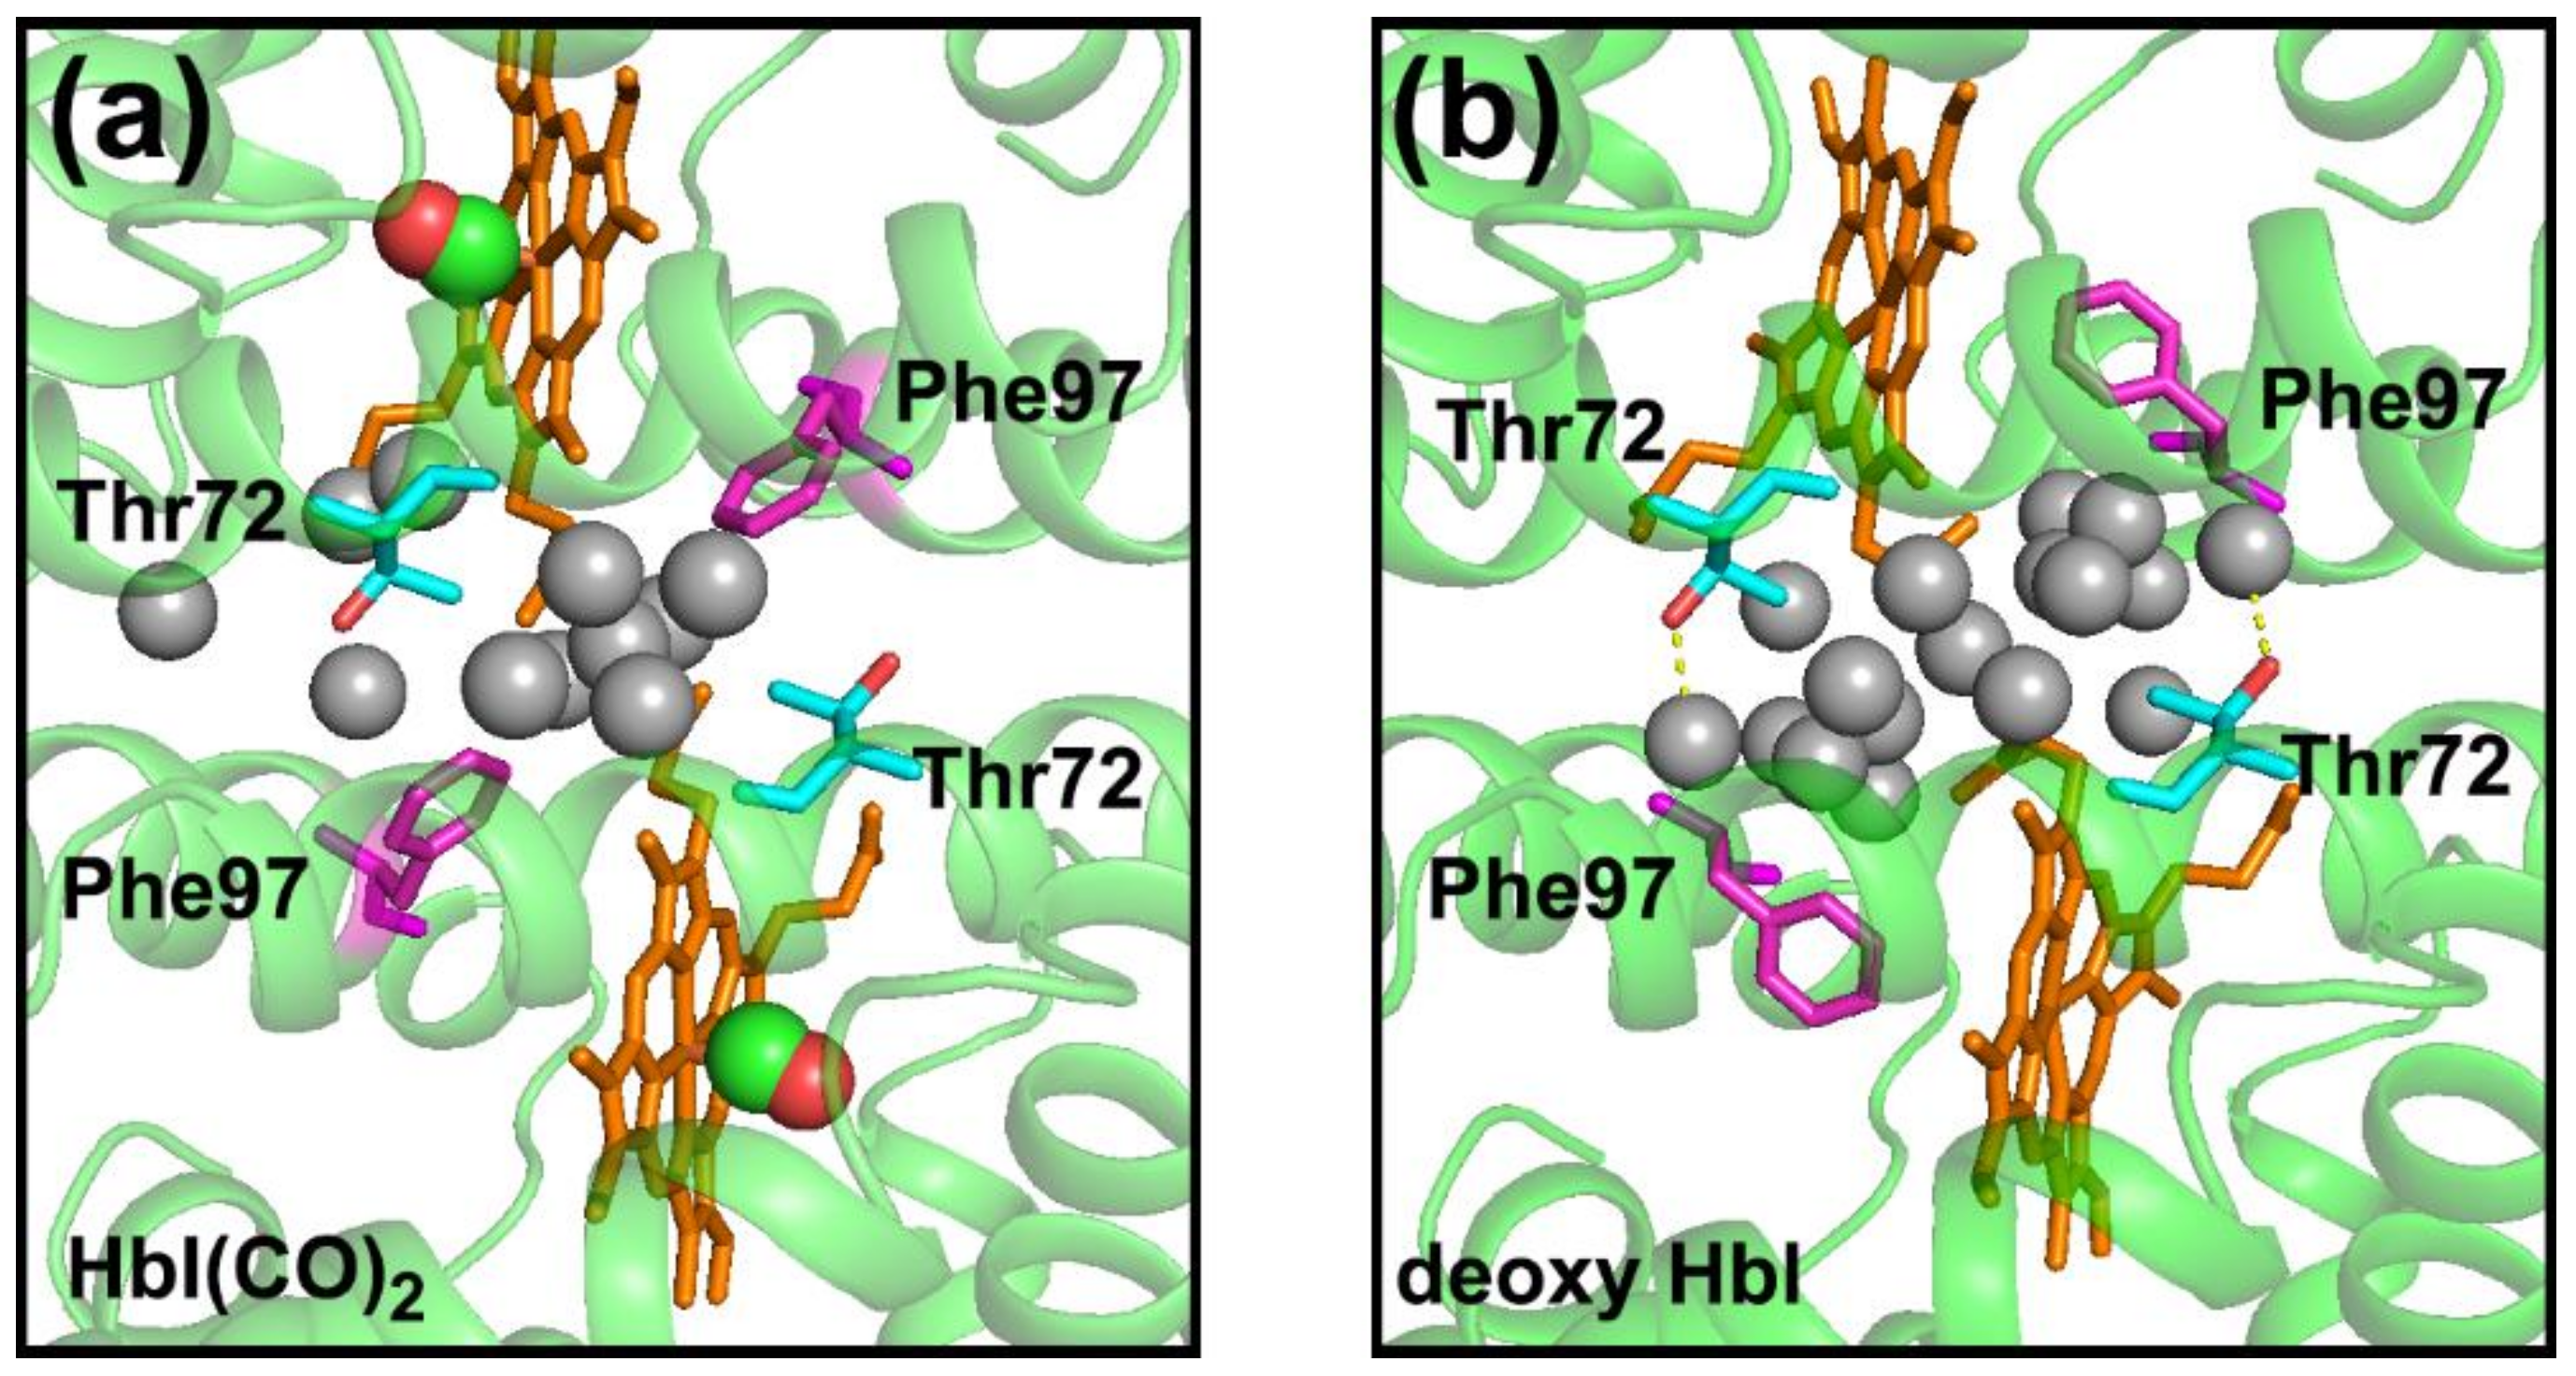
| T72 | Thr72 |
| F97 | Phe97 |
| TRXSS | Time-resolved X-ray solution scattering |
| TRXL | time-resolved X-ray liquidography |
| XFEL | X-ray free-electron laser |
| RMSD | Root-mean square deviation |
| TA | Transient absorption |
| SVD | Singular value decomposition |
| PCA | Principle component analysis |
| F97Y HbI | HbI mutant construct of Phe97 to Tyr |
| T72V HbI | HbI mutant construct of Thr72 to Val |
| I3WT | I3 intermediate for wild-type HbI |
| I3F97Y | I3 intermediate for F97Y HbI |
| I3WT | I3 intermediate for T72V HbI |
| cryo-EM | Cryo-electron microscopy |
| NMR | Nuclear magnetic resonance |
| MD | Molecular dynamics |
| TG | Transient grating |
| HbI(CO)2 | HbI ligated with CO ligands |
References
- Perutz, M.F. Stereochemistry of cooperative effects in haemoglobin. Nature 1970, 228, 726–739. [Google Scholar] [CrossRef] [PubMed]
- Baldwin, J.; Chothia, C. Haemoglobin: The structural changes related to ligand binding and its allosteric mechanism. J. Mol. Biol. 1979, 129, 175–220. [Google Scholar] [CrossRef]
- Shaanan, B. Structure of human oxyhaemoglobin at 2.1 a resolution. J. Mol. Biol. 1983, 171, 31–59. [Google Scholar] [CrossRef]
- Fermi, G.; Perutz, M.F.; Shaanan, B.; Fourme, R. The crystal structure of human deoxyhaemoglobin at 1.74 a resolution. J. Mol. Biol. 1984, 175, 159–174. [Google Scholar] [CrossRef]
- Perutz, M.F. Mechanisms of cooperativity and allosteric regulation in proteins. Q. Rev. Biophys. 1989, 22, 139–237. [Google Scholar] [CrossRef] [PubMed]
- Eaton, W.A.; Henry, E.R.; Hofrichter, J.; Mozzarelli, A. Is cooperative oxygen binding by hemoglobin really understood? Nat. Struct. Biol. 1999, 6, 351–358. [Google Scholar] [CrossRef] [PubMed]
- Adachi, S.; Park, S.Y.; Tame, J.R.; Shiro, Y.; Shibayama, N. Direct observation of photolysis-induced tertiary structural changes in hemoglobin. Proc. Natl. Acad. Sci. USA 2003, 100, 7039–7044. [Google Scholar] [CrossRef] [PubMed] [Green Version]
- Chiancone, E.; Vecchini, P.; Verzili, D.; Ascoli, F.; Antonini, E. Dimeric and tetrameric hemoglobins from the mollusc scapharca inaequivalvis. Structural and functional properties. J. Mol. Biol. 1981, 152, 577–592. [Google Scholar] [CrossRef]
- Antonini, E.; Ascoli, F.; Brunori, M.; Chiancone, E.; Verzili, D.; Morris, R.J.; Gibson, Q.H. Kinetics of ligand binding and quaternary conformational change in the homodimeric hemoglobin from scapharca inaequivalvis. J. Biol. Chem. 1984, 259, 6730–6738. [Google Scholar] [PubMed]
- Mozzarelli, A.; Bettati, S.; Rivetti, C.; Rossi, G.L.; Colotti, G.; Chiancone, E. Cooperative oxygen binding to scapharca inaequivalvis hemoglobin in the crystal. J. Biol. Chem. 1996, 271, 3627–3632. [Google Scholar] [CrossRef] [PubMed]
- Condon, P.J.; Royer, W.E., Jr. Crystal structure of oxygenated scapharca dimeric hemoglobin at 1.7-a resolution. J. Biol. Chem. 1994, 269, 25259–25267. [Google Scholar] [PubMed]
- Royer, W.E., Jr. High-resolution crystallographic analysis of a co-operative dimeric hemoglobin. J. Mol. Biol. 1994, 235, 657–681. [Google Scholar] [CrossRef] [PubMed]
- Royer, W.E., Jr.; Pardanani, A.; Gibson, Q.H.; Peterson, E.S.; Friedman, J.M. Ordered water molecules as key allosteric mediators in a cooperative dimeric hemoglobin. Proc. Natl. Acad. Sci. USA 1996, 93, 14526–14531. [Google Scholar] [CrossRef] [PubMed] [Green Version]
- Royer, W.E., Jr.; Hendrickson, W.A.; Chiancone, E. The 2.4-crystal structure of scapharca dimeric hemoglobin. Cooperativity based on directly communicating hemes at a novel subunit interface. J. Biol. Chem. 1989, 264, 21052–21061. [Google Scholar] [PubMed]
- Royer, W.E., Jr.; Hendrickson, W.A.; Chiancone, E. Structural transitions upon ligand binding in a cooperative dimeric hemoglobin. Science 1990, 249, 518–521. [Google Scholar] [CrossRef] [PubMed]
- Pardanani, A.; Gibson, Q.H.; Colotti, G.; Royer, W.E., Jr. Mutation of residue phe97 to leu disrupts the central allosteric pathway in scapharca dimeric hemoglobin. J. Biol. Chem. 1997, 272, 13171–13179. [Google Scholar] [CrossRef] [PubMed]
- Knapp, J.E.; Bonham, M.A.; Gibson, Q.H.; Nichols, J.C.; Royer, W.E., Jr. Residue f4 plays a key role in modulating oxygen affinity and cooperativity in scapharca dimeric hemoglobin. Biochemistry 2005, 44, 14419–14430. [Google Scholar] [CrossRef] [PubMed]
- Boffi, A.; Guarrera, L.; Giangiacomo, L.; Spagnuolo, C.; Chiancone, E. Proximal and distal effects on the coordination chemistry of ferric scapharca homodimeric hemoglobin as revealed by heme pocket mutants. Biochemistry 2000, 39, 3500–3504. [Google Scholar] [CrossRef] [PubMed]
- Laine, J.M.; Amat, M.; Morgan, B.R.; Royer, W.E., Jr.; Massi, F. Insight into the allosteric mechanism of scapharca dimeric hemoglobin. Biochemistry 2014, 53, 7199–7210. [Google Scholar] [CrossRef] [PubMed]
- Nienhaus, K.; Knapp, J.E.; Palladino, P.; Royer, W.E., Jr.; Nienhaus, G.U. Ligand migration and binding in the dimeric hemoglobin of scapharca inaequivalvis. Biochemistry 2007, 46, 14018–14031. [Google Scholar] [CrossRef] [PubMed]
- Kim, K.H.; Muniyappan, S.; Oang, K.Y.; Kim, J.G.; Nozawa, S.; Sato, T.; Koshihara, S.Y.; Henning, R.; Kosheleva, I.; Ki, H.; et al. Direct observation of cooperative protein structural dynamics of homodimeric hemoglobin from 100 ps to 10 ms with pump-probe X-ray solution scattering. J. Am. Chem. Soc. 2012, 134, 7001–7008. [Google Scholar] [CrossRef] [PubMed]
- Nichols, J.C.; Royer, W.E., Jr.; Gibson, Q.H. An optical signal correlated with the allosteric transition in scapharca inaequivalvis hbi. Biochemistry 2006, 45, 15748–15755. [Google Scholar] [CrossRef] [PubMed]
- Pardanani, A.; Gambacurta, A.; Ascoli, F.; Royer, W.E., Jr. Mutational destabilization of the critical interface water cluster in scapharca dimeric hemoglobin: Structural basis for altered allosteric activity. J. Mol. Biol. 1998, 284, 729–739. [Google Scholar] [CrossRef] [PubMed]
- Kim, J.G.; Muniyappan, S.; Oang, K.Y.; Kim, T.W.; Yang, C.; Kim, K.H.; Kim, J.; Ihee, H. Cooperative protein structural dynamics of homodimeric hemoglobin linked to water cluster at subunit interface revealed by time-resolved X-ray solution scattering. Struct. Dyn. 2016, 3, 023610. [Google Scholar] [CrossRef] [PubMed] [Green Version]
- Knapp, J.E.; Pahl, R.; Srajer, V.; Royer, W.E., Jr. Allosteric action in real time: Time-resolved crystallographic studies of a cooperative dimeric hemoglobin. Proc. Natl. Acad. Sci. USA 2006, 103, 7649–7654. [Google Scholar] [CrossRef] [PubMed]
- Knapp, J.E.; Pahl, R.; Cohen, J.; Nichols, J.C.; Schulten, K.; Gibson, Q.H.; Srajer, V.; Royer, W.E., Jr. Ligand migration and cavities within scapharca dimeric hbi: Studies by time-resolved crystallo-graphy, xe binding, and computational analysis. Structure 2009, 17, 1494–1504. [Google Scholar] [CrossRef] [PubMed]
- Ren, Z.; Srajer, V.; Knapp, J.E.; Royer, W.E., Jr. Cooperative macromolecular device revealed by meta-analysis of static and time-resolved structures. Proc. Natl. Acad. Sci. USA 2012, 109, 107–112. [Google Scholar] [CrossRef] [PubMed]
- Chiancone, E.; Elber, R.; Royer, W.E., Jr.; Regan, R.; Gibson, Q.H. Ligand binding and conformation change in the dimeric hemoglobin of the clam scapharca inaequivalvis. J. Biol. Chem. 1993, 268, 5711–5718. [Google Scholar] [PubMed]
- Knapp, J.E.; Gibson, Q.H.; Cushing, L.; Royer, W.E., Jr. Restricting the ligand-linked heme movement in scapharca dimeric hemoglobin reveals tight coupling between distal and proximal contributions to cooperativity. Biochemistry 2001, 40, 14795–14805. [Google Scholar] [CrossRef] [PubMed]
- Oang, K.Y.; Yang, C.; Muniyappan, S.; Kim, J.; Ihee, H. Svd-aided pseudo principal-component analysis: A new method to speed up and improve determination of the optimum kinetic model from time-resolved data. Struct. Dyn. 2017, 4, 044013. [Google Scholar] [CrossRef] [PubMed]
- Zhou, Y.Q.; Zhou, H.Y.; Karplus, M. Cooperativity in scapharca dimeric hemoglobin: Simulation of binding intermediates and elucidation of the role of interfacial water. J. Mol. Biol. 2003, 326, 593–606. [Google Scholar] [CrossRef]
- Gnanasekaran, R.; Xu, Y.; Leitner, D.M. Dynamics of water clusters confined in proteins: A molecular dynamics simulation study of interfacial waters in a dimeric hemoglobin. J. Phys. Chem. B 2010, 114, 16989–16996. [Google Scholar] [CrossRef] [PubMed]
- Gnanasekaran, R.; Agbo, J.K.; Leitner, D.M. Communication maps computed for homodimeric hemoglobin: Computational study of water-mediated energy transport in proteins. J. Chem. Phys. 2011, 135, 065103. [Google Scholar] [CrossRef] [PubMed]
- Guarrera, L.; Colotti, G.; Boffi, A.; Chiancone, E.; Das, T.K.; Rousseau, D.L.; Gibson, Q.H. The apolar distal histidine mutant (his69->val) of the homodimeric scapharca hemoglobin is in an R-like conformation. Biochemistry 1998, 37, 5608–5615. [Google Scholar] [CrossRef] [PubMed]
- Guarrera, L.; Colotti, G.; Chiancone, E.; Boffi, A. Ligand-linked changes at the subunit interfaces in scapharca hemoglobins probed through the sulfhydryl infrared absorption. Biochemistry 1999, 38, 10079–10083. [Google Scholar] [CrossRef] [PubMed]
- Choi, J.; Muniyappan, S.; Wallis, J.T.; Royer, W.E., Jr.; Ihee, H. Protein conformational dynamics of homodimeric hemoglobin revealed by combined time-resolved spectroscopic probes. ChemPhysChem 2010, 11, 109–114. [Google Scholar] [CrossRef] [PubMed]
- Knapp, J.E.; Royer, W.E., Jr. Ligand-linked structural transitions in crystals of a cooperative dimeric hemoglobin. Biochemistry 2003, 42, 4640–4647. [Google Scholar] [CrossRef] [PubMed]
- Rousseau, D.L.; Song, S.; Friedman, J.M.; Boffi, A.; Chiancone, E. Heme-heme interactions in a homodimeric cooperative hemoglobin. Evidence from transient raman scattering. J. Biol. Chem. 1993, 268, 5719–5723. [Google Scholar] [PubMed]
- Royer, W.E., Jr.; Knapp, J.E.; Strand, K.; Heaslet, H.A. Cooperative hemoglobins: Conserved fold, diverse quaternary assemblies and allosteric mechanisms. Trends Biochem. Sci. 2001, 26, 297–304. [Google Scholar] [CrossRef]
- Mitchell, D.T.; Kitto, G.B.; Hackert, M.L. Structural analysis of monomeric hemichrome and dimeric cyanomet hemoglobins from caudina arenicola. J. Mol. Biol. 1995, 251, 421–431. [Google Scholar] [CrossRef] [PubMed]
- Royer, W.E., Jr.; Sharma, H.; Strand, K.; Knapp, J.E.; Bhyravbhatla, B. Lumbricus erythrocruorin at 3.5 a resolution: Architecture of a megadalton respiratory complex. Structure 2006, 14, 1167–1177. [Google Scholar] [CrossRef] [PubMed]
- Khoshouei, M.; Radjainia, M.; Baumeister, W.; Danev, R. Cryo-em structure of haemoglobin at 3.2 angstrom determined with the volta phase plate. Nat. Commun. 2017, 8, 16099. [Google Scholar] [CrossRef] [PubMed]
- Khoshouei, M.; Danev, R.; Plitzko, J.M.; Baumeister, W. Revisiting the structure of hemoglobin and myoglobin with cryo-electron microscopy. J. Mol. Biol. 2017, 429, 2611–2618. [Google Scholar] [CrossRef] [PubMed]
- Rodgers, K.R.; Spiro, T.G. Nanosecond dynamics of the r-->t transition in hemoglobin: Ultraviolet raman studies. Science 1994, 265, 1697–1699. [Google Scholar] [CrossRef] [PubMed]
- Jayaraman, V.; Rodgers, K.R.; Mukerji, I.; Spiro, T.G. Hemoglobin allostery: Resonance raman spectroscopy of kinetic intermediates. Science 1995, 269, 1843–1848. [Google Scholar] [CrossRef] [PubMed]
- Balakrishnan, G.; Case, M.A.; Pevsner, A.; Zhao, X.; Tengroth, C.; McLendon, G.L.; Spiro, T.G. Time-resolved absorption and uv resonance raman spectra reveal stepwise formation of t quaternary contacts in the allosteric pathway of hemoglobin. J. Mol. Biol. 2004, 340, 843–856. [Google Scholar] [CrossRef] [PubMed]
- Plech, A.; Wulff, M.; Bratos, S.; Mirloup, F.; Vuilleumier, R.; Schotte, F.; Anfinrud, P.A. Visualizing chemical reactions in solution by picosecond X-ray diffraction. Phys. Rev. Lett. 2004, 92, 125505. [Google Scholar] [CrossRef] [PubMed]
- Ihee, H.; Lorenc, M.; Kim, T.K.; Kong, Q.Y.; Cammarata, M.; Lee, J.H.; Bratos, S.; Wulff, M. Ultrafast X-ray diffraction of transient molecular structures in solution. Science 2005, 309, 1223–1227. [Google Scholar] [CrossRef] [PubMed]
- Lee, J.H.; Kim, J.; Cammarata, M.; Kong, Q.; Kim, K.H.; Choi, J.; Kim, T.K.; Wulff, M.; Ihee, H. Transient X-ray diffraction reveals global and major reaction pathways for the photolysis of iodoform in solution. Angew. Chem. Int. Ed. 2008, 47, 1047–1050. [Google Scholar] [CrossRef] [PubMed]
- Cammarata, M.; Levantino, M.; Schotte, F.; Anfinrud, P.A.; Ewald, F.; Choi, J.; Cupane, A.; Wulff, M.; Ihee, H. Tracking the structural dynamics of proteins in solution using time-resolved wide-angle X-ray scattering. Nat. Methods 2008, 5, 881–886. [Google Scholar] [CrossRef] [PubMed] [Green Version]
- Ahn, S.; Kim, K.H.; Kim, Y.; Kim, J.; Ihee, H. Protein tertiary structural changes visualized by time-resolved X-ray solution scattering. J. Phys. Chem. B 2009, 113, 13131–13133. [Google Scholar] [CrossRef] [PubMed]
- Andersson, M.; Malmerberg, E.; Westenhoff, S.; Katona, G.; Cammarata, M.; Wohri, A.B.; Johansson, L.C.; Ewald, F.; Eklund, M.; Wulff, M.; et al. Structural dynamics of light-driven proton pumps. Structure 2009, 17, 1265–1275. [Google Scholar] [CrossRef] [PubMed]
- Christensen, M.; Haldrup, K.; Bechgaard, K.; Feidenhans’l, R.; Kong, Q.; Cammarata, M.; Lo Russo, M.; Wulff, M.; Harrit, N.; Nielsen, M.M. Time-resolved X-ray scattering of an electronically excited state in solution. Structure of the 3a(2u) state of tetrakis-mu-pyrophosphitodiplatinate(ii). J. Am. Chem. Soc. 2009, 131, 502–508. [Google Scholar] [CrossRef] [PubMed]
- Ihee, H. Visualizing solution-phase reaction dynamics with time-resolved X-ray liquidography. Acc. Chem. Res. 2009, 42, 356–366. [Google Scholar] [CrossRef] [PubMed]
- Vincent, J.; Andersson, M.; Eklund, M.; Wohri, A.B.; Odelius, M.; Malmerberg, E.; Kong, Q.; Wulff, M.; Neutze, R.; Davidsson, J. Solvent dependent structural perturbations of chemical reaction intermediates visualized by time-resolved X-ray diffraction. J. Chem. Phys. 2009, 130, 154502. [Google Scholar] [CrossRef] [PubMed]
- Cammarata, M.; Levantino, M.; Wulff, M.; Cupane, A. Unveiling the timescale of the r-t transition in human hemoglobin. J. Mol. Biol. 2010, 400, 951–962. [Google Scholar] [CrossRef] [PubMed] [Green Version]
- Cho, H.S.; Dashdorj, N.; Schotte, F.; Graber, T.; Henning, R.; Anfinrud, P. Protein structural dynamics in solution unveiled via 100-ps time-resolved X-ray scattering. Proc. Natl. Acad. Sci. USA 2010, 107, 7281–7286. [Google Scholar] [CrossRef] [PubMed]
- Kong, Q.; Lee, J.H.; Kim, K.H.; Kim, J.; Wulff, M.; Ihee, H.; Koch, M.H. Ultrafast X-ray solution scattering reveals different reaction pathways in the photolysis of triruthenium dodecacarbonyl (Ru3(CO)12) after ultraviolet and visible excitation. J. Am. Chem. Soc. 2010, 132, 2600–2607. [Google Scholar] [CrossRef] [PubMed]
- Konuma, T.; Kimura, T.; Matsumoto, S.; Goto, Y.; Fujisawa, T.; Fersht, A.R.; Takahashi, S. Time-resolved small-angle X-ray scattering study of the folding dynamics of barnase. J. Mol. Biol. 2011, 405, 1284–1294. [Google Scholar] [CrossRef] [PubMed]
- Malmerberg, E.; Omran, Z.; Hub, J.S.; Li, X.; Katona, G.; Westenhoff, S.; Johansson, L.C.; Andersson, M.; Cammarata, M.; Wulff, M.; et al. Time-resolved waxs reveals accelerated conformational changes in iodoretinal-substituted proteorhodopsin. Biophys. J. 2011, 101, 1345–1353. [Google Scholar] [CrossRef] [PubMed]
- Kim, T.W.; Lee, J.H.; Choi, J.; Kim, K.H.; van Wilderen, L.J.; Guerin, L.; Kim, Y.; Jung, Y.O.; Yang, C.; Kim, J.; et al. Protein structural dynamics of photoactive yellow protein in solution revealed by pump-probe X-ray solution scattering. J. Am. Chem. Soc. 2012, 134, 3145–3153. [Google Scholar] [CrossRef] [PubMed]
- Arnlund, D.; Johansson, L.C.; Wickstrand, C.; Barty, A.; Williams, G.J.; Malmerberg, E.; Davidsson, J.; Milathianaki, D.; de Ponte, D.P.; Shoeman, R.L.; et al. Visualizing a protein quake with time-resolved X-ray scattering at a free-electron laser. Nat. Methods 2014, 11, 923–926. [Google Scholar] [CrossRef] [PubMed] [Green Version]
- Kim, J.G.; Kim, K.H.; Oang, K.Y.; Kim, T.W.; Ki, H.; Jo, J.; Kim, J.; Sato, T.; Nozawa, S.; Adachi, S.; et al. Rotational dephasing of a gold complex probed by anisotropic femtosecond X-ray solution scattering using an X-ray free-electron laser. J. Phys. B Atomic Mol. Opt. Phys. 2015, 48, 244005. [Google Scholar] [CrossRef]
- Kim, K.H.; Kim, J.G.; Nozawa, S.; Sato, T.; Oang, K.Y.; Kim, T.W.; Ki, H.; Jo, J.; Park, S.; Song, C.; et al. Direct observation of bond formation in solution with femtosecond X-ray scattering. Nature 2015, 518, 385–389. [Google Scholar] [CrossRef] [PubMed]
- Levantino, M.; Schiro, G.; Lemke, H.T.; Cottone, G.; Glownia, J.M.; Zhu, D.; Chollet, M.; Ihee, H.; Cupane, A.; Cammarata, M. Ultrafast myoglobin structural dynamics observed with an X-ray free-electron laser. Nat. Commun. 2015, 6, 6772. [Google Scholar] [CrossRef] [PubMed] [Green Version]
- Kim, J.; Kim, K.H.; Oang, K.Y.; Lee, J.H.; Hong, K.; Cho, H.; Huse, N.; Schoenlein, R.W.; Kim, T.K.; Ihee, H. Tracking reaction dynamics in solution by pump-probe X-ray absorption spectroscopy and X-ray liquidography (solution scattering). Chem. Commun. 2016, 52, 3734–3749. [Google Scholar] [CrossRef] [PubMed]
- Kim, K.H.; Kim, J.G.; Oang, K.Y.; Kim, T.W.; Ki, H.; Jo, J.; Kim, J.; Sato, T.; Nozawa, S.; Adachi, S.; et al. Femtosecond X-ray solution scattering reveals that bond formation mechanism of a gold trimer complex is independent of excitation wavelength. Struct. Dyn. 2016, 3, 043209. [Google Scholar] [CrossRef] [PubMed] [Green Version]
- Kim, T.W.; Yang, C.; Kim, Y.; Kim, J.G.; Kim, J.; Jung, Y.O.; Jun, S.; Lee, S.J.; Park, S.; Kosheleva, I.; et al. Combined probes of X-ray scattering and optical spectroscopy reveal how global conformational change is temporally and spatially linked to local structural perturbation in photoactive yellow protein. Phys. Chem. Chem. Phys. 2016, 18, 8911–8919. [Google Scholar] [CrossRef] [PubMed] [Green Version]
- Van Driel, T.B.; Kjaer, K.S.; Hartsock, R.W.; Dohn, A.O.; Harlang, T.; Chollet, M.; Christensen, M.; Gawelda, W.; Henriksen, N.E.; Kim, J.G.; et al. Atomistic characterization of the active-site solvation dynamics of a model photocatalyst. Nat. Commun. 2016, 7, 13678. [Google Scholar] [CrossRef] [PubMed] [Green Version]
- Ki, H.; Oang, K.Y.; Kim, J.; Ihee, H. Ultrafast X-ray crystallography and liquidography. Annu. Rev. Phys. Chem. 2017, 68, 473–497. [Google Scholar] [CrossRef] [PubMed]
- Ahn, C.W.; Ki, H.; Kim, J.; Kim, J.; Park, S.; Lee, Y.; Kim, K.H.; Kong, Q.; Moon, J.; Pedersen, M.N.; et al. Direct observation of a transiently formed isomer during iodoform photolysis in solution by time-resolved X-ray liquidography. J. Phys. Chem. Lett. 2018, 9, 647–653. [Google Scholar] [CrossRef] [PubMed]
- Kim, J.; Lee, J.H.; Kim, J.; Jun, S.; Kim, K.H.; Kim, T.W.; Wulff, M.; Ihee, H. Structural dynamics of 1,2-diiodoethane in cyclohexane probed by picosecond X-ray liquidography. J. Phys. Chem. A 2012, 116, 2713–2722. [Google Scholar] [CrossRef] [PubMed]
- Kim, K.H.; Kim, J.; Oang, K.Y.; Lee, J.H.; Grolimund, D.; Milne, C.J.; Penfold, T.J.; Johnson, S.L.; Galler, A.; Kim, T.W.; et al. Identifying the major intermediate species by combining time-resolved X-ray solution scattering and X-ray absorption spectroscopy. Phys. Chem. Chem. Phys. 2015, 17, 23298–23302. [Google Scholar] [CrossRef] [PubMed]
- Kim, K.H.; Oang, K.Y.; Kim, J.; Lee, J.H.; Kim, Y.; Ihee, H. Direct observation of myoglobin structural dynamics from 100 picoseconds to 1 microsecond with picosecond X-ray solution scattering. Chem. Commun. 2011, 47, 289–291. [Google Scholar] [CrossRef] [PubMed] [Green Version]
- Oang, K.Y.; Kim, J.G.; Yang, C.; Kim, T.W.; Kim, Y.; Kim, K.H.; Kim, J.; Ihee, H. Conformational substates of myoglobin intermediate resolved by picosecond X-ray solution scattering. J. Phys. Chem. Lett. 2014, 5, 804–808. [Google Scholar] [CrossRef] [PubMed]
- Oang, K.Y.; Kim, K.H.; Jo, J.; Kim, Y.; Kim, J.G.; Kim, T.W.; Jun, S.; Kim, J.; Ihee, H. Sub-100-ps structural dynamics of horse heart myoglobin probed by time-resolved X-ray solution scattering. Chem. Phys. 2014, 422, 137–142. [Google Scholar] [CrossRef] [PubMed]
- Kim, J.; Kim, K.H.; Kim, J.G.; Kim, T.W.; Kim, Y.; Ihee, H. Anisotropic picosecond X-ray solution scattering from photoselectively aligned protein molecules. J. Phys. Chem. Lett. 2011, 2, 350–356. [Google Scholar] [CrossRef] [PubMed]
- Kim, T.W.; Kim, J.G.; Yang, C.; Ki, H.; Jo, J.; Ihee, H. Pump-probe X-ray solution scattering reveals accelerated folding of cytochrome c upon suppression of misligation. Bull. Korean Chem. Soc. 2014, 35, 697–698. [Google Scholar] [CrossRef] [PubMed]
- Ramachandran, P.L.; Lovett, J.E.; Carl, P.J.; Cammarata, M.; Lee, J.H.; Jung, Y.O.; Ihee, H.; Timmel, C.R.; van Thor, J.J. The short-lived signaling state of the photoactive yellow protein photoreceptor revealed by combined structural probes. J. Am. Chem. Soc. 2011, 133, 9395–9404. [Google Scholar] [CrossRef] [PubMed]
- Takala, H.; Bjorling, A.; Berntsson, O.; Lehtivuori, H.; Niebling, S.; Hoernke, M.; Kosheleva, I.; Henning, R.; Menzel, A.; Ihalainen, J.A.; et al. Signal amplification and transduction in phytochrome photosensors. Nature 2014, 509, 245–248. [Google Scholar] [CrossRef] [PubMed]
- Kikhney, A.G.; Svergun, D.I. A practical guide to small angle X-ray scattering (saxs) of flexible and intrinsically disordered proteins. FEBS Lett. 2015, 589, 2570–2577. [Google Scholar] [CrossRef] [PubMed]
- Summerford, C.M.; Pardanani, A.; Betts, A.H.; Poteete, A.R.; Colotti, G.; Royer, W.E., Jr. Bacterial expression of scapharca dimeric hemoglobin: A simple model system for investigating protein cooperatively. Protein Eng. 1995, 8, 593–599. [Google Scholar] [CrossRef] [PubMed]
- Choi, J.; Terazima, M. Denaturation of a protein monitored by diffusion coefficients: Myoglobin. J. Phys. Chem. B 2002, 106, 6587–6593. [Google Scholar] [CrossRef]
- Monod, J.; Wyman, J.; Changeux, J.P. On the nature of allosteric transitions: A plausible model. J. Mol. Biol. 1965, 12, 88–118. [Google Scholar] [CrossRef]


| WT HbI | F97Y HbI | T72V HbI | |
|---|---|---|---|
| HbI(CO)2 | 11 a | 9 c | 11 e |
| Deoxy HbI | 17 b | 6 d | 15 f |
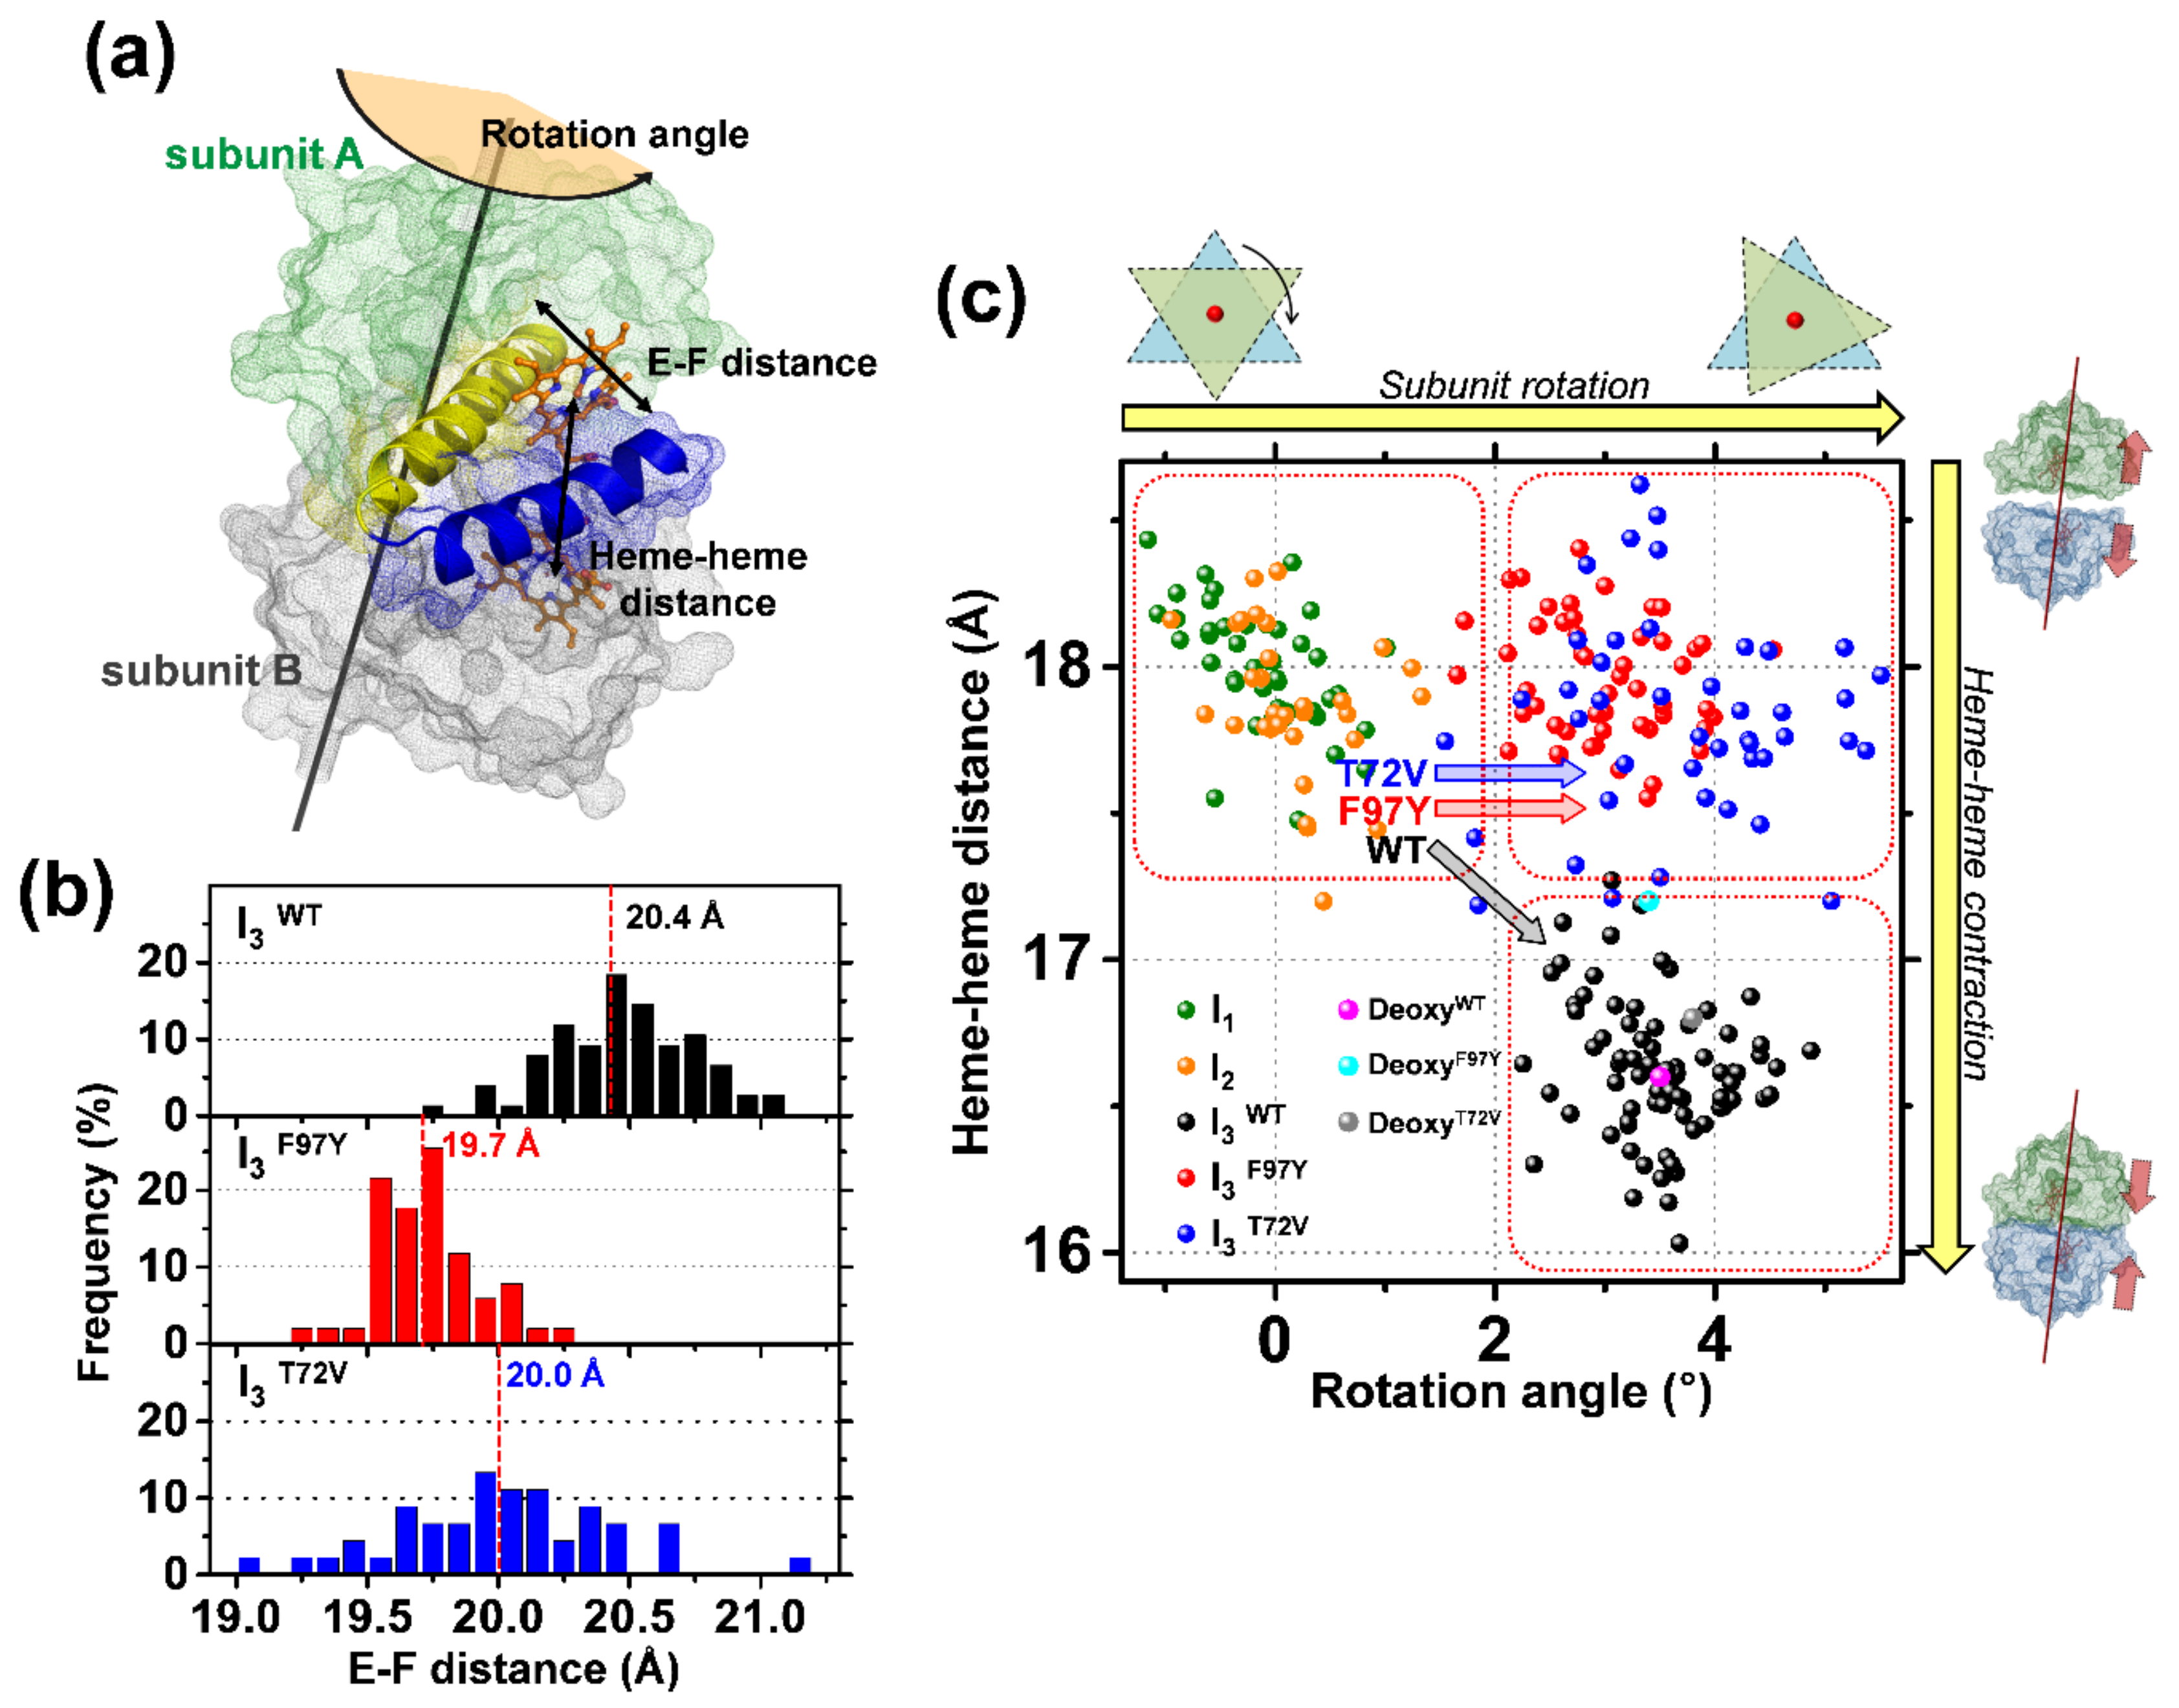
| RMSD (Å) | Iron−Iron Distance (Å) | Number of Interface Water Molecules | Rotation Angle (deg) | |
|---|---|---|---|---|
| HbI(CO)2 (3sdh) | − | 18.4 | 11 | − |
| deoxy-HbI (4sdh) | 0.6 | 16.6 | 17 | 3.5 |
| I1 | 0.4 (±0.05) | 18.0 (±0.2) | 9 (fixed) b | −0.1 (±0.5) |
| I2 | 0.4 (±0.06) | 17.9 (±0.3) | 9 (fixed) b | 0.1 (±0.5) |
| I3WT | 0.7 (±0.05) | 16.6 (±0.2) | 17 (fixed) b | 3.5 (±0.6) |
| I3F97Y | 0.8 (±0.04) | 18.0 (±0.2) | 6 (fixed) b | 3.0 (±0.6) |
| I3T72V | 0.8 (±0.06) | 17.8 (±0.4) | 15 (fixed) b | 3.7 (±1.0) |
© 2018 by the authors. Licensee MDPI, Basel, Switzerland. This article is an open access article distributed under the terms and conditions of the Creative Commons Attribution (CC BY) license (http://creativecommons.org/licenses/by/4.0/).
Share and Cite
Yang, C.; Choi, M.; Kim, J.G.; Kim, H.; Muniyappan, S.; Nozawa, S.; Adachi, S.-i.; Henning, R.; Kosheleva, I.; Ihee, H. Protein Structural Dynamics of Wild-Type and Mutant Homodimeric Hemoglobin Studied by Time-Resolved X-Ray Solution Scattering. Int. J. Mol. Sci. 2018, 19, 3633. https://doi.org/10.3390/ijms19113633
Yang C, Choi M, Kim JG, Kim H, Muniyappan S, Nozawa S, Adachi S-i, Henning R, Kosheleva I, Ihee H. Protein Structural Dynamics of Wild-Type and Mutant Homodimeric Hemoglobin Studied by Time-Resolved X-Ray Solution Scattering. International Journal of Molecular Sciences. 2018; 19(11):3633. https://doi.org/10.3390/ijms19113633
Chicago/Turabian StyleYang, Cheolhee, Minseo Choi, Jong Goo Kim, Hanui Kim, Srinivasan Muniyappan, Shunsuke Nozawa, Shin-ichi Adachi, Robert Henning, Irina Kosheleva, and Hyotcherl Ihee. 2018. "Protein Structural Dynamics of Wild-Type and Mutant Homodimeric Hemoglobin Studied by Time-Resolved X-Ray Solution Scattering" International Journal of Molecular Sciences 19, no. 11: 3633. https://doi.org/10.3390/ijms19113633