Phylogenomic and Comparative Analyses of Complete Plastomes of Croomia and Stemona (Stemonaceae)

Key Laboratory of Conservation Biology for Endangered Wildlife of the Ministry of Education, and College of Life Sciences, Zhejiang University, Hangzhou 310058, China
*
Author to whom correspondence should be addressed.
†
These authors have contributed equally to this work.
Int. J. Mol. Sci. 2018, 19(8), 2383; https://doi.org/10.3390/ijms19082383
Submission received: 4 July 2018
/
Revised: 3 August 2018
/
Accepted: 3 August 2018
/
Published: 13 August 2018
(This article belongs to the Special Issue Chloroplast)
Abstract
:The monocot genus Croomia (Stemonaceae) comprises three herbaceous perennial species that exhibit EA (Eastern Asian)–ENA (Eastern North American) disjunct distribution. However, due to the lack of effective genomic resources, its evolutionary history is still weakly resolved. In the present study, we conducted comparative analysis of the complete chloroplast (cp) genomes of three Croomia species and two Stemona species. These five cp genomes proved highly similar in overall size (154,407–155,261 bp), structure, gene order and content. All five cp genomes contained the same 114 unique genes consisting of 80 protein-coding genes, 30 tRNA genes and 4 rRNA genes. Gene content, gene order, AT content and IR/SC boundary structures were almost the same among the five Stemonaceae cp genomes, except that the Stemona cp genome was found to contain an inversion in cemA and petA. The lengths of five genomes varied due to contraction/expansion of the IR/SC borders. A/T mononucleotides were the richest Simple Sequence Repeats (SSRs). A total of 46, 48, 47, 61 and 60 repeats were identified in C. japonica, C. heterosepala, C. pauciflora, S. japonica and S. mairei, respectively. A comparison of pairwise sequence divergence values across all introns and intergenic spacers revealed that the ndhF–rpl32, psbM–trnD and trnS–trnG regions are the fastest-evolving regions. These regions are therefore likely to be the best choices for molecular evolutionary and systematic studies at low taxonomic levels in Stemonaceae. Phylogenetic analyses of the complete cp genomes and 78 protein-coding genes strongly supported the monophyly of Croomia. Two Asian species were identified as sisters that likely diverged in the Early Pleistocene (1.62 Mya, 95% HPD: 1.125–2.251 Mya), whereas the divergence of C. pauciflora dated back to the Late Miocene (4.77 Mya, 95% HPD: 3.626–6.162 Mya). The availability of these cp genomes will provide valuable genetic resources for further population genetics and phylogeographic studies on Croomia.
1. Introduction
Croomia Torr. ex Torr. et Gray belongs to the monocot family Stemonaceae Engl (Pandanales, Liliidae) and comprises three herbaceous perennial species: C. pauciflora (Nutt.) Torr., C. japonica Miq. and C. heterosepala (Bak.) Oku. Of these three species, C. japonica and C. heterosepala are endemic to warm-temperate deciduous forests in East Asia, while C. pauciflora grows in temperate-deciduous forests in North America [1,2,3]. There is a considerable difference in morphological traits among this genus. For example, the four tepals of C. japonica are homomorphic with a re-curved edge, while those of C. heterosepala have a flat edge, and one outside tepal is much larger than the other three [4,5]. Compared to two Asian species, C. pauciflora has a smaller flower, shorter petiole, denser underground stem nodes and a more obvious heart-shape leaf base [1]. As the roots of Croomia species contain compounds such as pachysamine, didehydrocroomine and croomine groups, they are used as folk medicine to treat cough and injuries [6,7]. Croomia can reproduce sexually through seed formation via cross-pollination and asexually through underground rhizomes [1,8]. Due to their limited distribution and small population sizes, the three extant species of Croomia are listed as “threatened” or “endangered” in China, Japan and the Americas [9,10,11]. The other three genera of Stemonaceae are Pentastemona, Stemona and Stichoneuron. The species of Stichoneuron are located in India, Thailand and Peninsular Malaysia, while those of Pentastemona are only in Sumatra [3,8]. The genus Stemona comprises ca. 25 species with the widest distribution from Northeast Asia to Southeast Asia and Australia. The roots of Stemona species contain similar medicine compounds as Croomia [7]. Although Croomia and Stemona species have important pharmacological and ecological value, limited molecular markers were available for the utilization, conservation and breeding of these species in the context of population genetics and phylogenetic studies [12].
Croomia exhibits a well-known classic intercontinental disjunct distribution between Eastern Asia (EA) and Eastern North America (ENA) [1,8,13,14]. This continental disjunction pattern was suggested to have resulted from fragmentation of the mid-Tertiary mesophytic forest flora throughout a large part of the Northern Hemisphere, as global temperature cooled down in the late Tertiary and Quaternary [15,16]. For the two East Asian endemics, C. japonica is distributed in East China and southern Japan, while C. heterosepala is in northern Japan, and they have adjacent ranges in South Japan [17,18]. Therefore, Croomia is well suited for testing biogeographic hypotheses about the evolution of both the eastern Asian–eastern North American and eastern Asian–Japanese Archipelago floristic disjunctions. Based on previous molecular phylogenetic analyses using cpDNA sequence variation of the trnL-F region, the two Asian species were identified as sister species that likely diverged in the Mid-to-Late Pleistocene (0.84–0.13 million years ago, Mya), whereas the divergence of C. pauciflora dates back to the Late Plio-/Pleistocene (<2.6 Mya) [12]. However, the previous cpDNA analysis based on a few parsimony informative sites yielded low bootstrap values for the majority of clades [12]. Thus, it is necessary to develop more highly variable genetic markers for determining the phylogenetic relationships and divergence times for Croomia. Nowadays, many phylogenetic relationships that remained unresolved with few loci have been clarified by using whole cp genome sequences [19,20,21]. Thus, whole cp genome sequences are increasingly being used in phylogeny reconstruction and providing hypervariable genetic markers for population genetic studies, especially in a group of recently-diverged species [22,23].
Here, we sequenced three Croomia and two Stemona cp genomes using the next-generation Illumina genome analyzer platform. We compared the cp genomes of two Stemonaceae genera to characterize their structural organization and variations and identify the most variable regions. This information on interspecific variability of each region will help guide further systematic and evolutionary studies of Stemonaceae. In addition, we used the whole cp genomes to resolve the phylogenetic relationships of Croomia and infer the historical biogeography of the genus.
2. Results and Discussion
2.1. Genome Assembly and Features
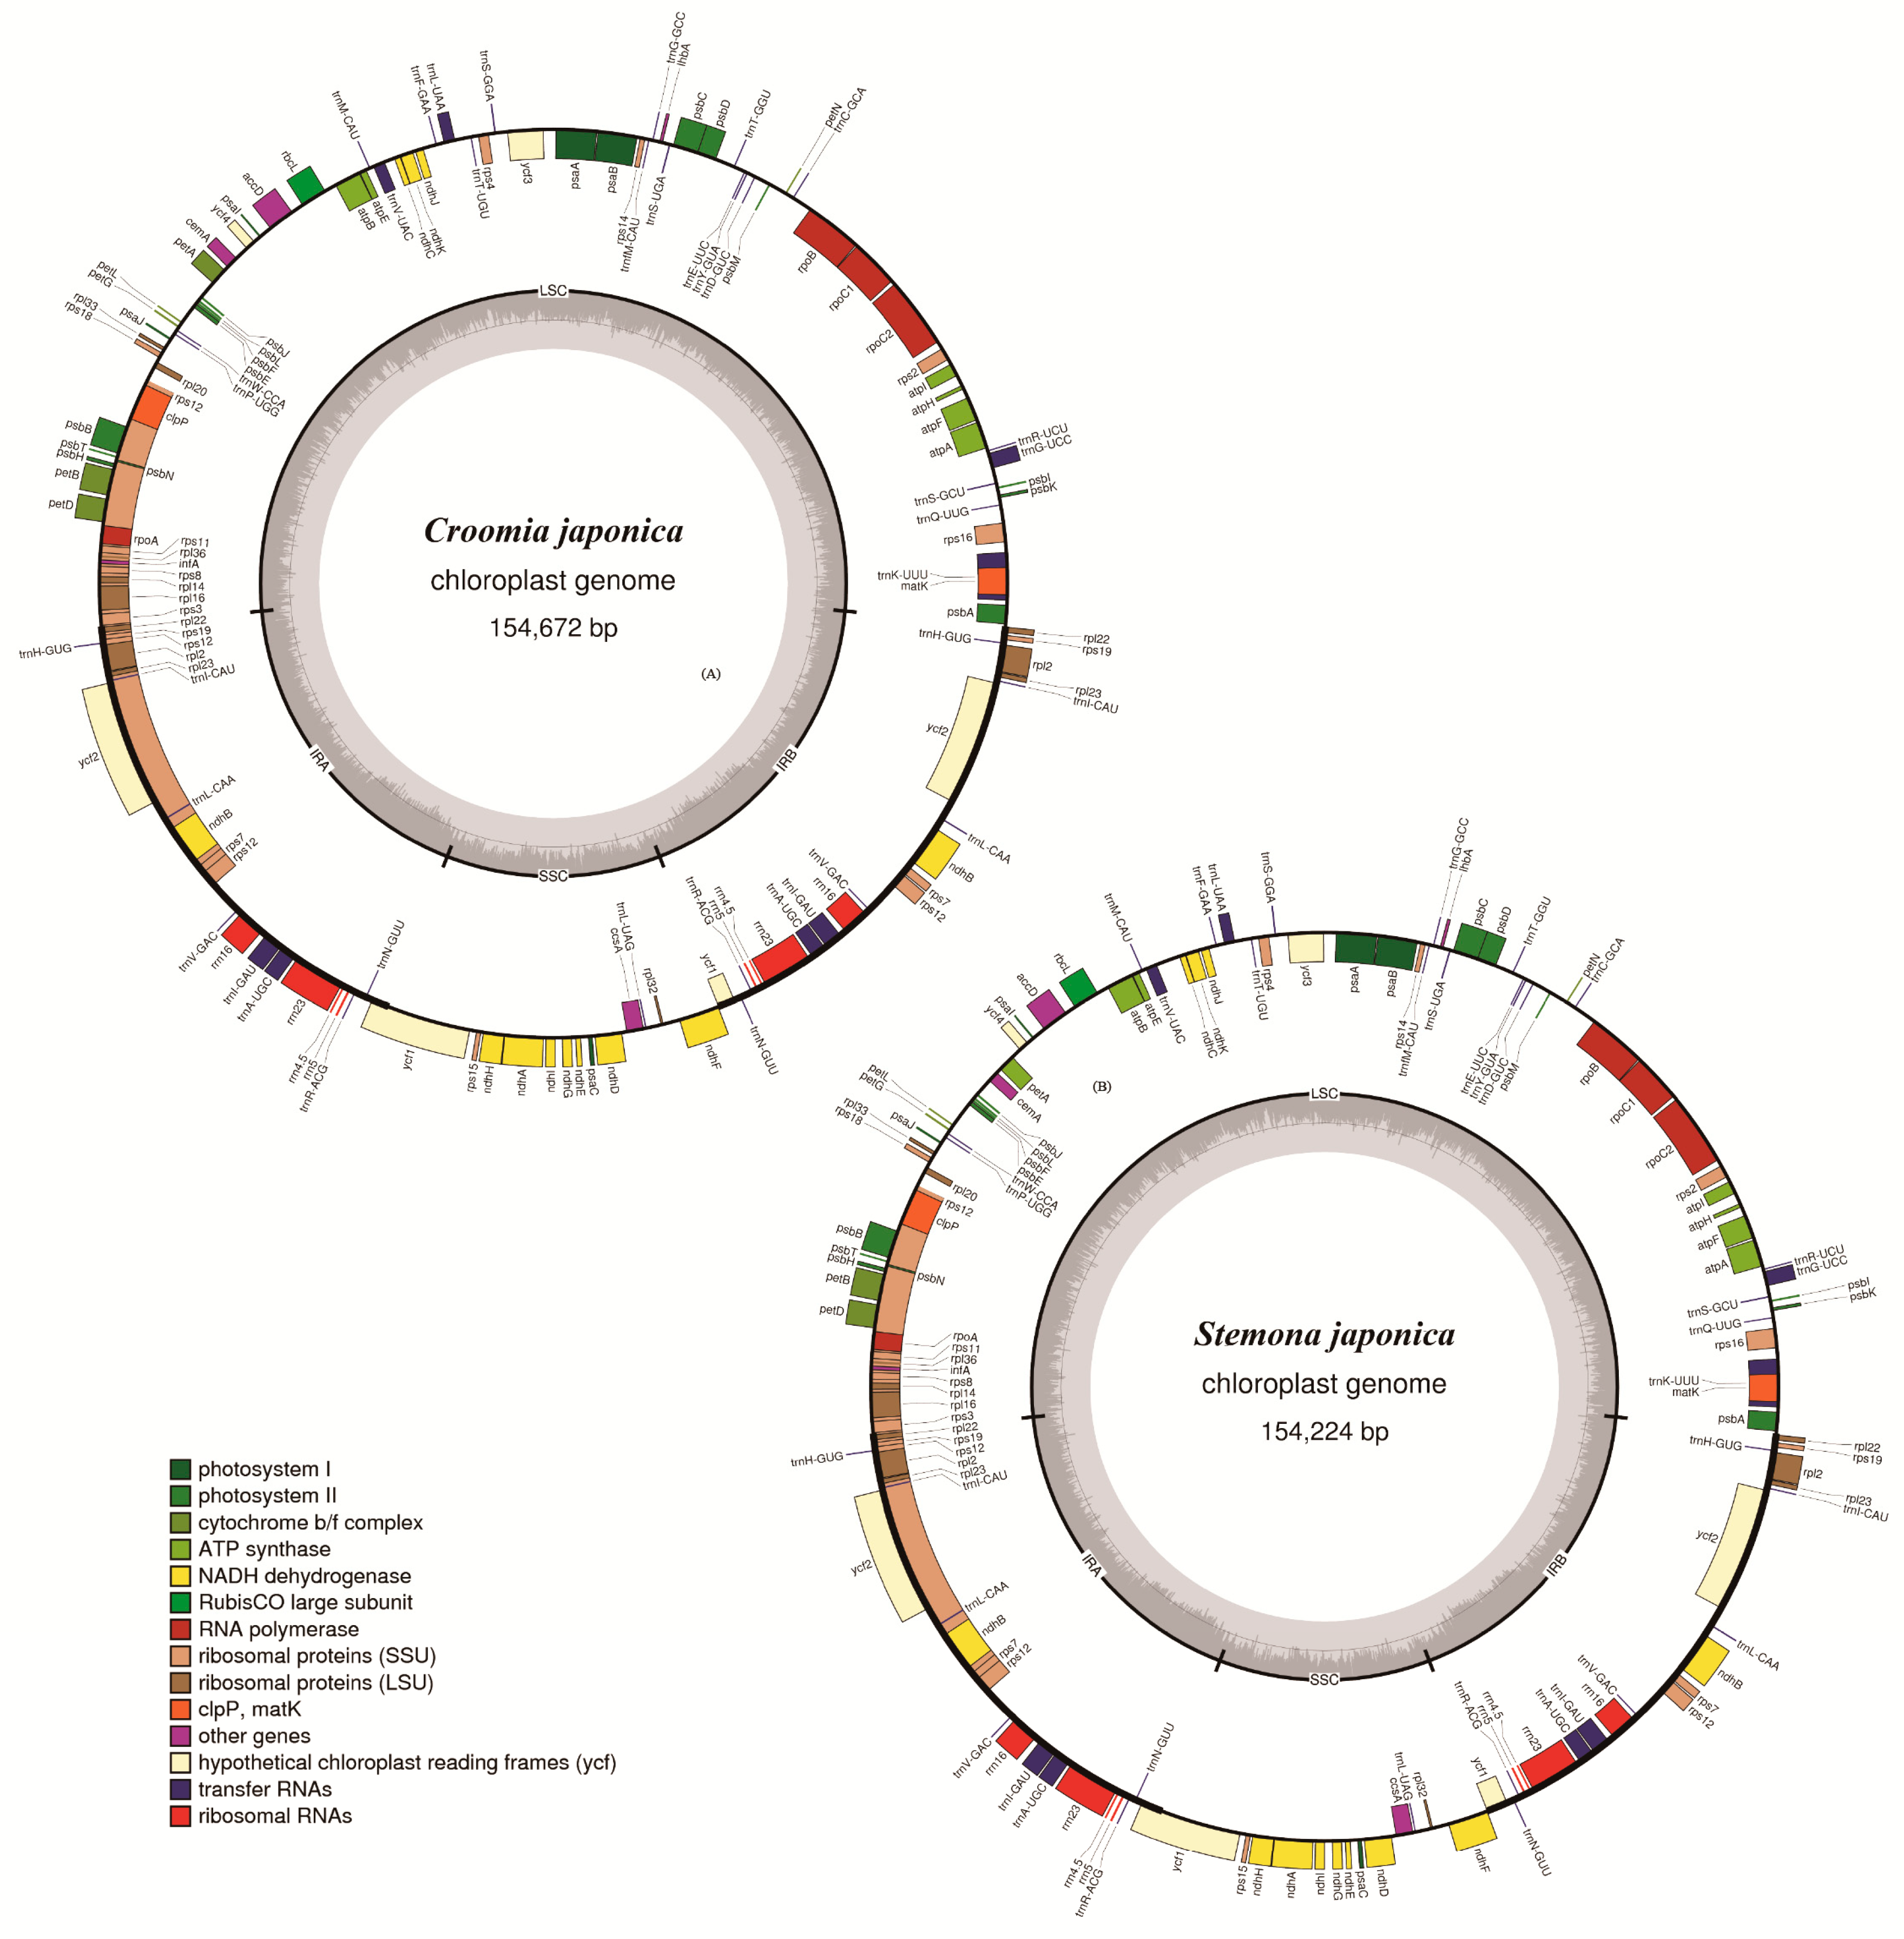
Illumina paired-end sequencing yielded 14,163,520–31,094,272-bp clean reads after trimming, and the de novo assembly generated 50,369–123,479 contigs for five Stemonaceae species. With the cp genome of C. palmata as a reference, contigs were combined to generate the draft cp genome for each species. The lengths of determined nucleotide sequences were 154,672, 154,407, 155,261, 154,224 and 154,307 bp for C. japonica, C. heterosepala, C. pauciflora, S. japonica and S. mairei, respectively. (Figure 1, Table S1). All five cp genomes exhibited the typical quadripartite structure of angiosperms, consisting of a pair of IR regions (27,082–27,243 bp) separated by an LSC region (81,844–82,429 bp) and an SSC region (17,889–18,346 bp). The cp genomes of three Croomia species and two Stemona species were deposited in GenBank (MH177871, MH191379–MH191382).
These five cp genomes contained 134 genes identically, of which 114 were unique and 20 were duplicated in IR regions (Table S1). Those 134 genes were arranged almost in the same order except cemA and petA, which were inverted at the LSC region of two Stemona species. Gene inversions at LSC were also reported in other angiosperm, such as Silene [24], Cymbidium [19] and Acacia dealbata [25]. The 114 unique genes included 80 protein-coding genes, 30 tRNA genes and 4 rRNA genes. In Croomia species, the overall GC content was 38.3%, and the GC contents of the LSC, SSC and IR regions were 36.6%, 32.3–32.5% and 42.8–42.9%, respectively, while those of Stemona were 38.0%, 36.2%, 32.1% and 42.7% (Table S1). In all five genomes, nine of the protein-coding genes and six of the tRNA genes possessed a single intron, while three genes (rps12, clpP and ycf3) contained two introns (Table 1). The rps12 gene was trans-spliced; the 5′ end exon was located in the LSC region, and the 3′ end exon and intron were located in the IR regions. Compared to many other species, such as Salvia miltiorrhiza [26] and Cornales [27], the SSC region of the five studied species was found to have a different (reverse) orientation. The reverse orientation of the SSC region has also been reported in a wide variety of plant species [28,29,30]. This phenomenon is sometimes interpreted as a major inversion existing within the species [29,31,32]. In fact, the two orientations of the SSC region have been found to occur regularly during the course of chloroplast DNA replication within individual plant cells [33,34]. Thus, the reverse orientation of the SSC region found in the five Stemonaceae cp genomes may represent a form of plastid heteroplasmy [30,35].
2.2. Contraction and Expansion of Inverted Repeats
Length variation in angiosperm cp genomes is due most typically to the expansion or contraction of the IR into or out of adjacent single-copy regions and/or changes in sequence complexity due to insertions or deletions of novel sequences [36,37]. Compared to reference cp genome C. palmata, all five species exhibited IR expansion at the IRb/LSC border, leading to entire rpl22 duplication. In a previous study, a partial duplication of the rpl22 gene was reported in some monocot species of Asparagales and Commelinales [38]. Although the gene number and gene order were conserved across these five Stemonaceae species, minor differences were still observed at the boundaries (Figure 2). At the IRa/LSC border, the spacer from rpl22 to this border of Stemona (65 bp) was longer than that of Croomia (24–25 bp), except C. pauciflora. As for the ycf1 gene, there were 4580–4662-bp sequences located at SSC in Croomia and 4374–4383 bp in Stemona, while the pseudogene fragment duplications in IRb were 970 bp and 1206 bp in Croomia and Stemona, respectively. The ndhF gene exhibited variable sequences in SSC of Croomia (2215–2226 bp), while invariable in Stemona with a 2190-bp length. At the border of IRb/LSC, the spacer from psbA to this border of Croomia ranged from 91 bp–99 bp, while it ranged from 94 bp–104 bp in Stemona. These differences between the five cp genomes led to the length variation of their whole genome sequences.
2.3. Divergence Hotspot Regions
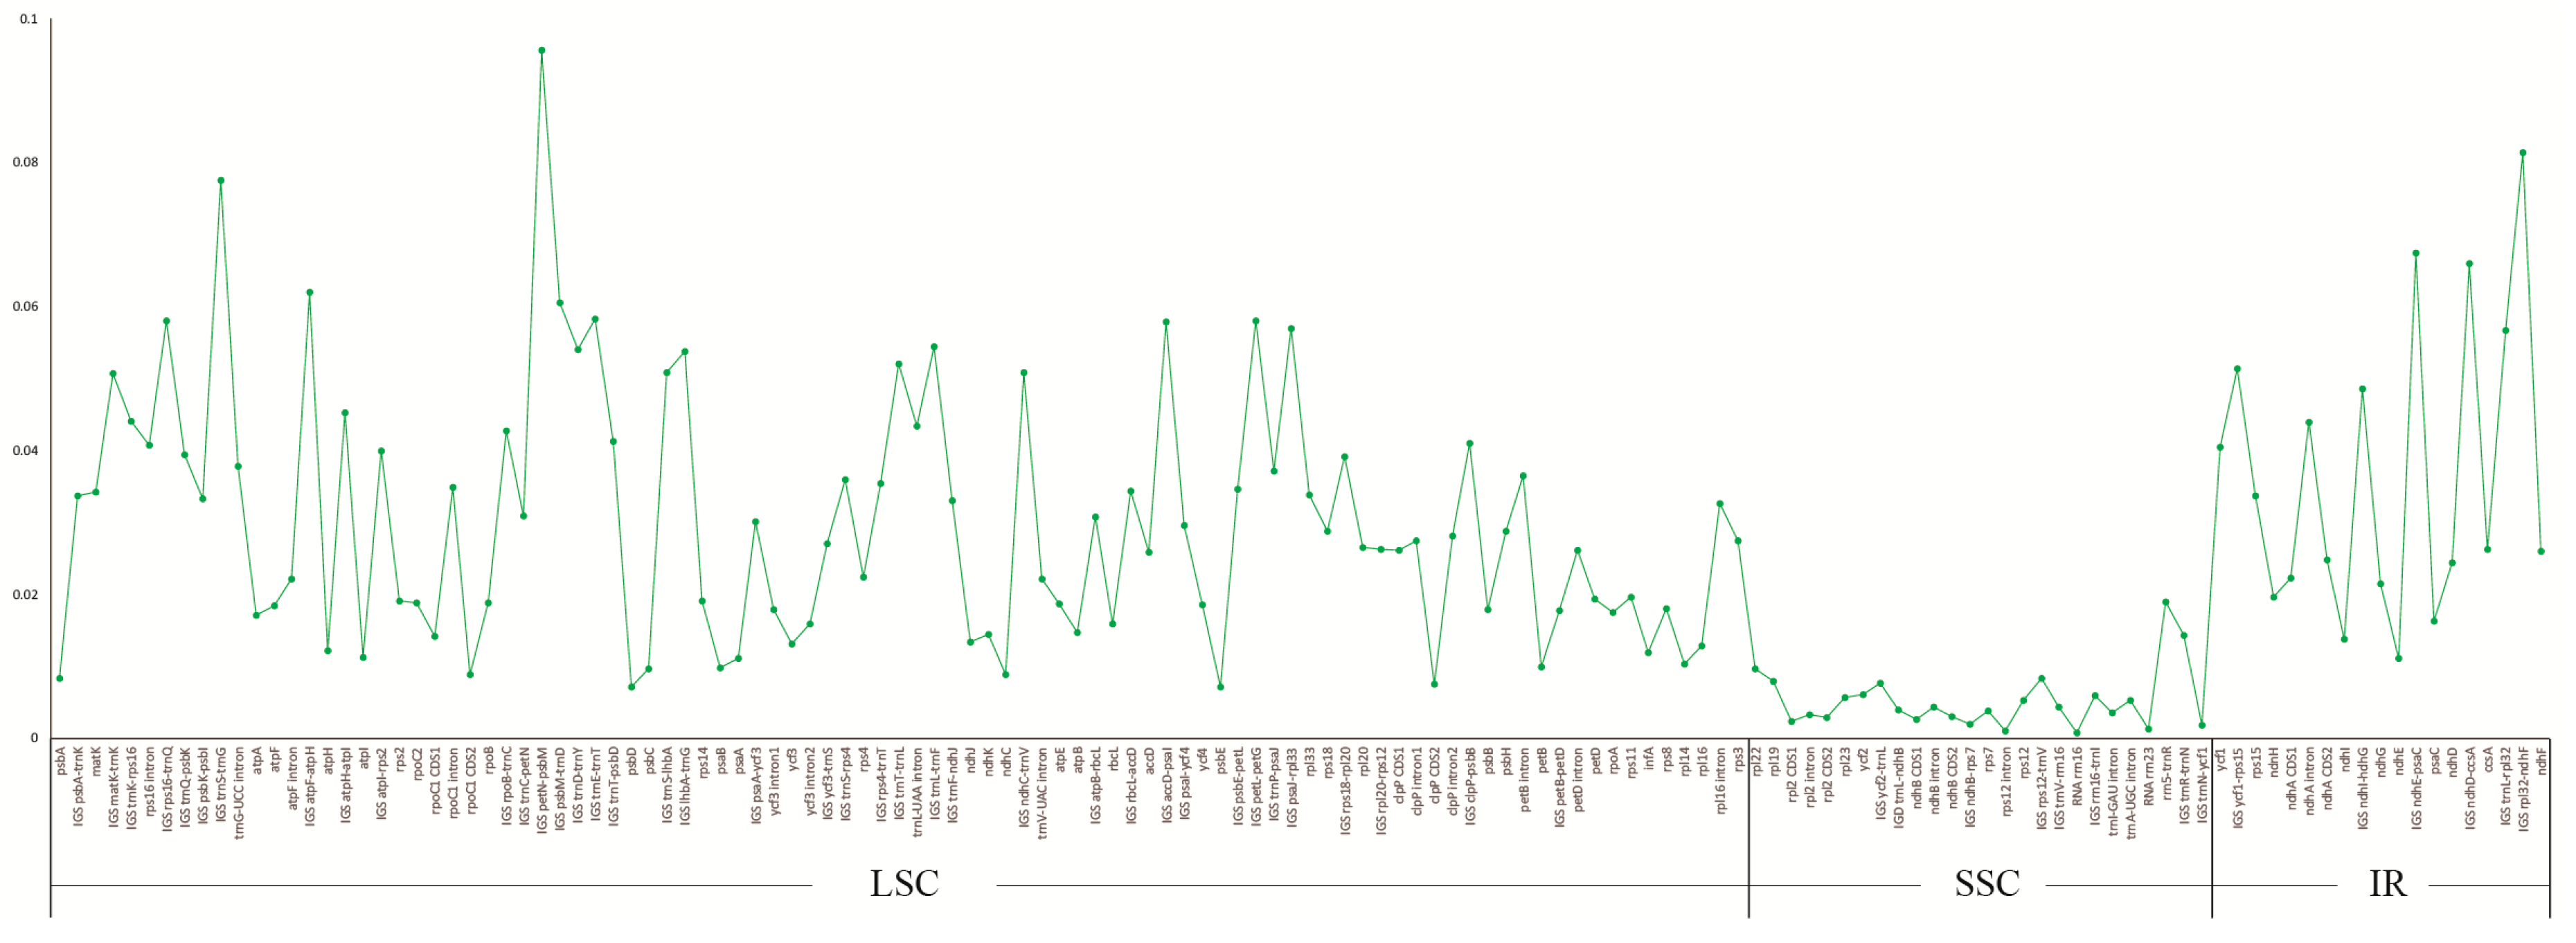
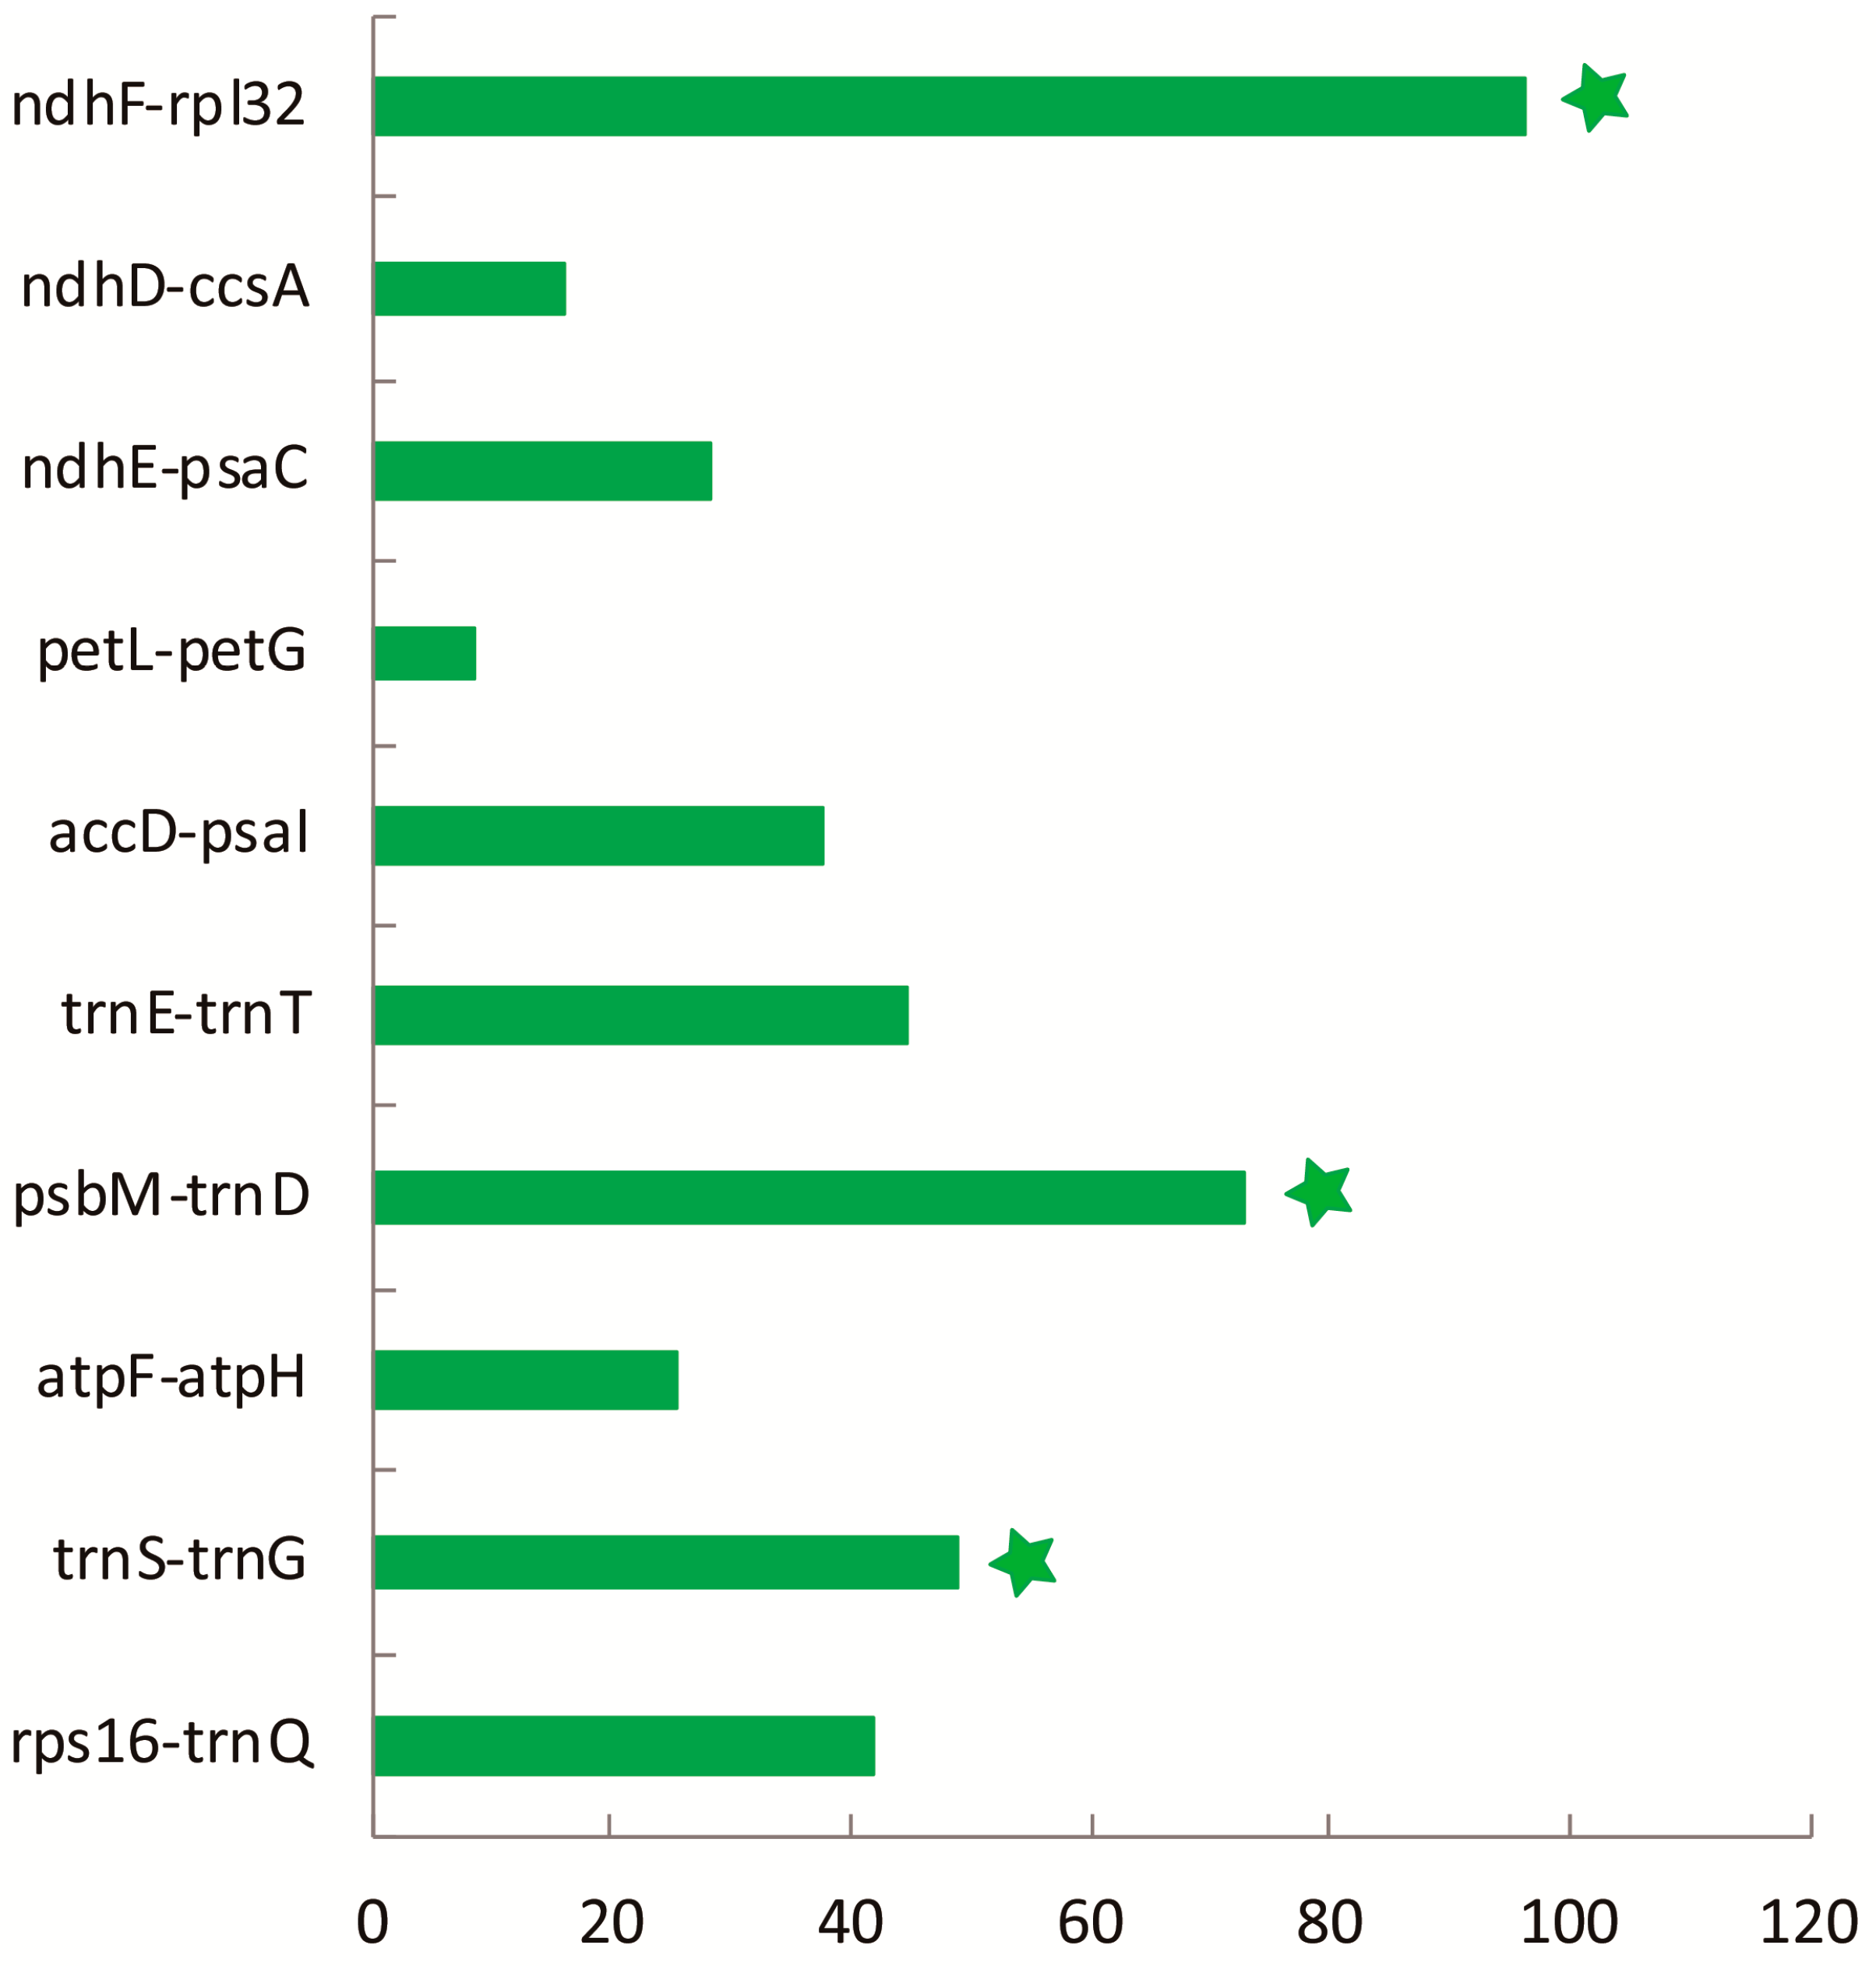
To elucidate the level of sequence divergence, the three Croomia and two Stemona cp genome sequences were compared and plotted using the mVISTA program (Figure 3). Like most angiosperms, the sequence divergence of IR regions was lower than that of the LSC and SSC region [39,40], which may involve copy correction of IRs as a mechanism [41]. We identified 140 regions in total with more than a 200-bp length (68 protein-coding regions (CDS), 53 Intergenic Spacers (IGS) and 19 introns). The nucleotide variability (Pi) of these 140 regions ranged from 0.080% (rrn16) to 9.565% (IGS petN–psbM) among the five cp genomes. The average Pi of the non-coding region was 3.644%, much higher than coding regions (1.587%), as found in most angiosperms [42,43]. For the 68 CDS, the Pi values for each region ranged from 0.231% (rpl2 CDS1) to 4.047% (ycf1), whereby 10 regions (i.e., matK, rpl33, rps15, psbH, rps18, rps3, rpl20, ccsA, ndhF, accD) had remarkably high values (pi > 2.5%). For the 53 IGS regions, Pi values ranged from 0.185% (trnN–ycf1) to 9.565% (petN–psbM). Again, ten of those regions showed considerably high values (pi > 5.7%; i.e., rpl32–ndhF, trnS–trnG, ndhE–psaC, ndhD–ccsA, atpF–atpH, psbM–trnD, trnE–trnT, petL–petG, rps16–trnQ, accD–psaI; see Figure 4). A comparison of DNA sequence divergence revealed that three of these ten noncoding regions, ndhF–rpl32 (PICs = 96), psbM–trnD (PICs = 73) and trnS–trnG (PICs = 49), are the most variable regions across Stemonaceae (Figure A1). Thus, these three regions may be good candidates for resolving future low-level phylogeny and phylogeography in Stemonaceae. In a previous study, the availability of plastid noncoding regions was compared across 10 major lineages of angiosperms (such as Nymphaeales, monocots, eurosids) [44]. However, only five families of monocots represented by five species pairs were included, without Stemonaceae. The three variable regions predicted here are among the top 13 regions of monocots in the research by Shaw et al. [44], with ndhF–rpl32, psbM–trnD and trnS–trnG ranked first, third and 11th, respectively. Of these regions, ndhF–rpl32 has long been a popular region in phylogenetic studies of angiosperms [44,45]. Meanwhile, psbM–trnD and trnS–trnG are also noted as highly variable in Liliaceae [46] and occasionally used in low-level phylogenetic analyses (Scabiosa: [47]; Solms-laubachia: [48]). The resolution of recent divergences in monocots would benefit considerably by the inclusion of any or all of these highly variable regions.
2.4. Repetitive Sequences and SSR Polymorphisms
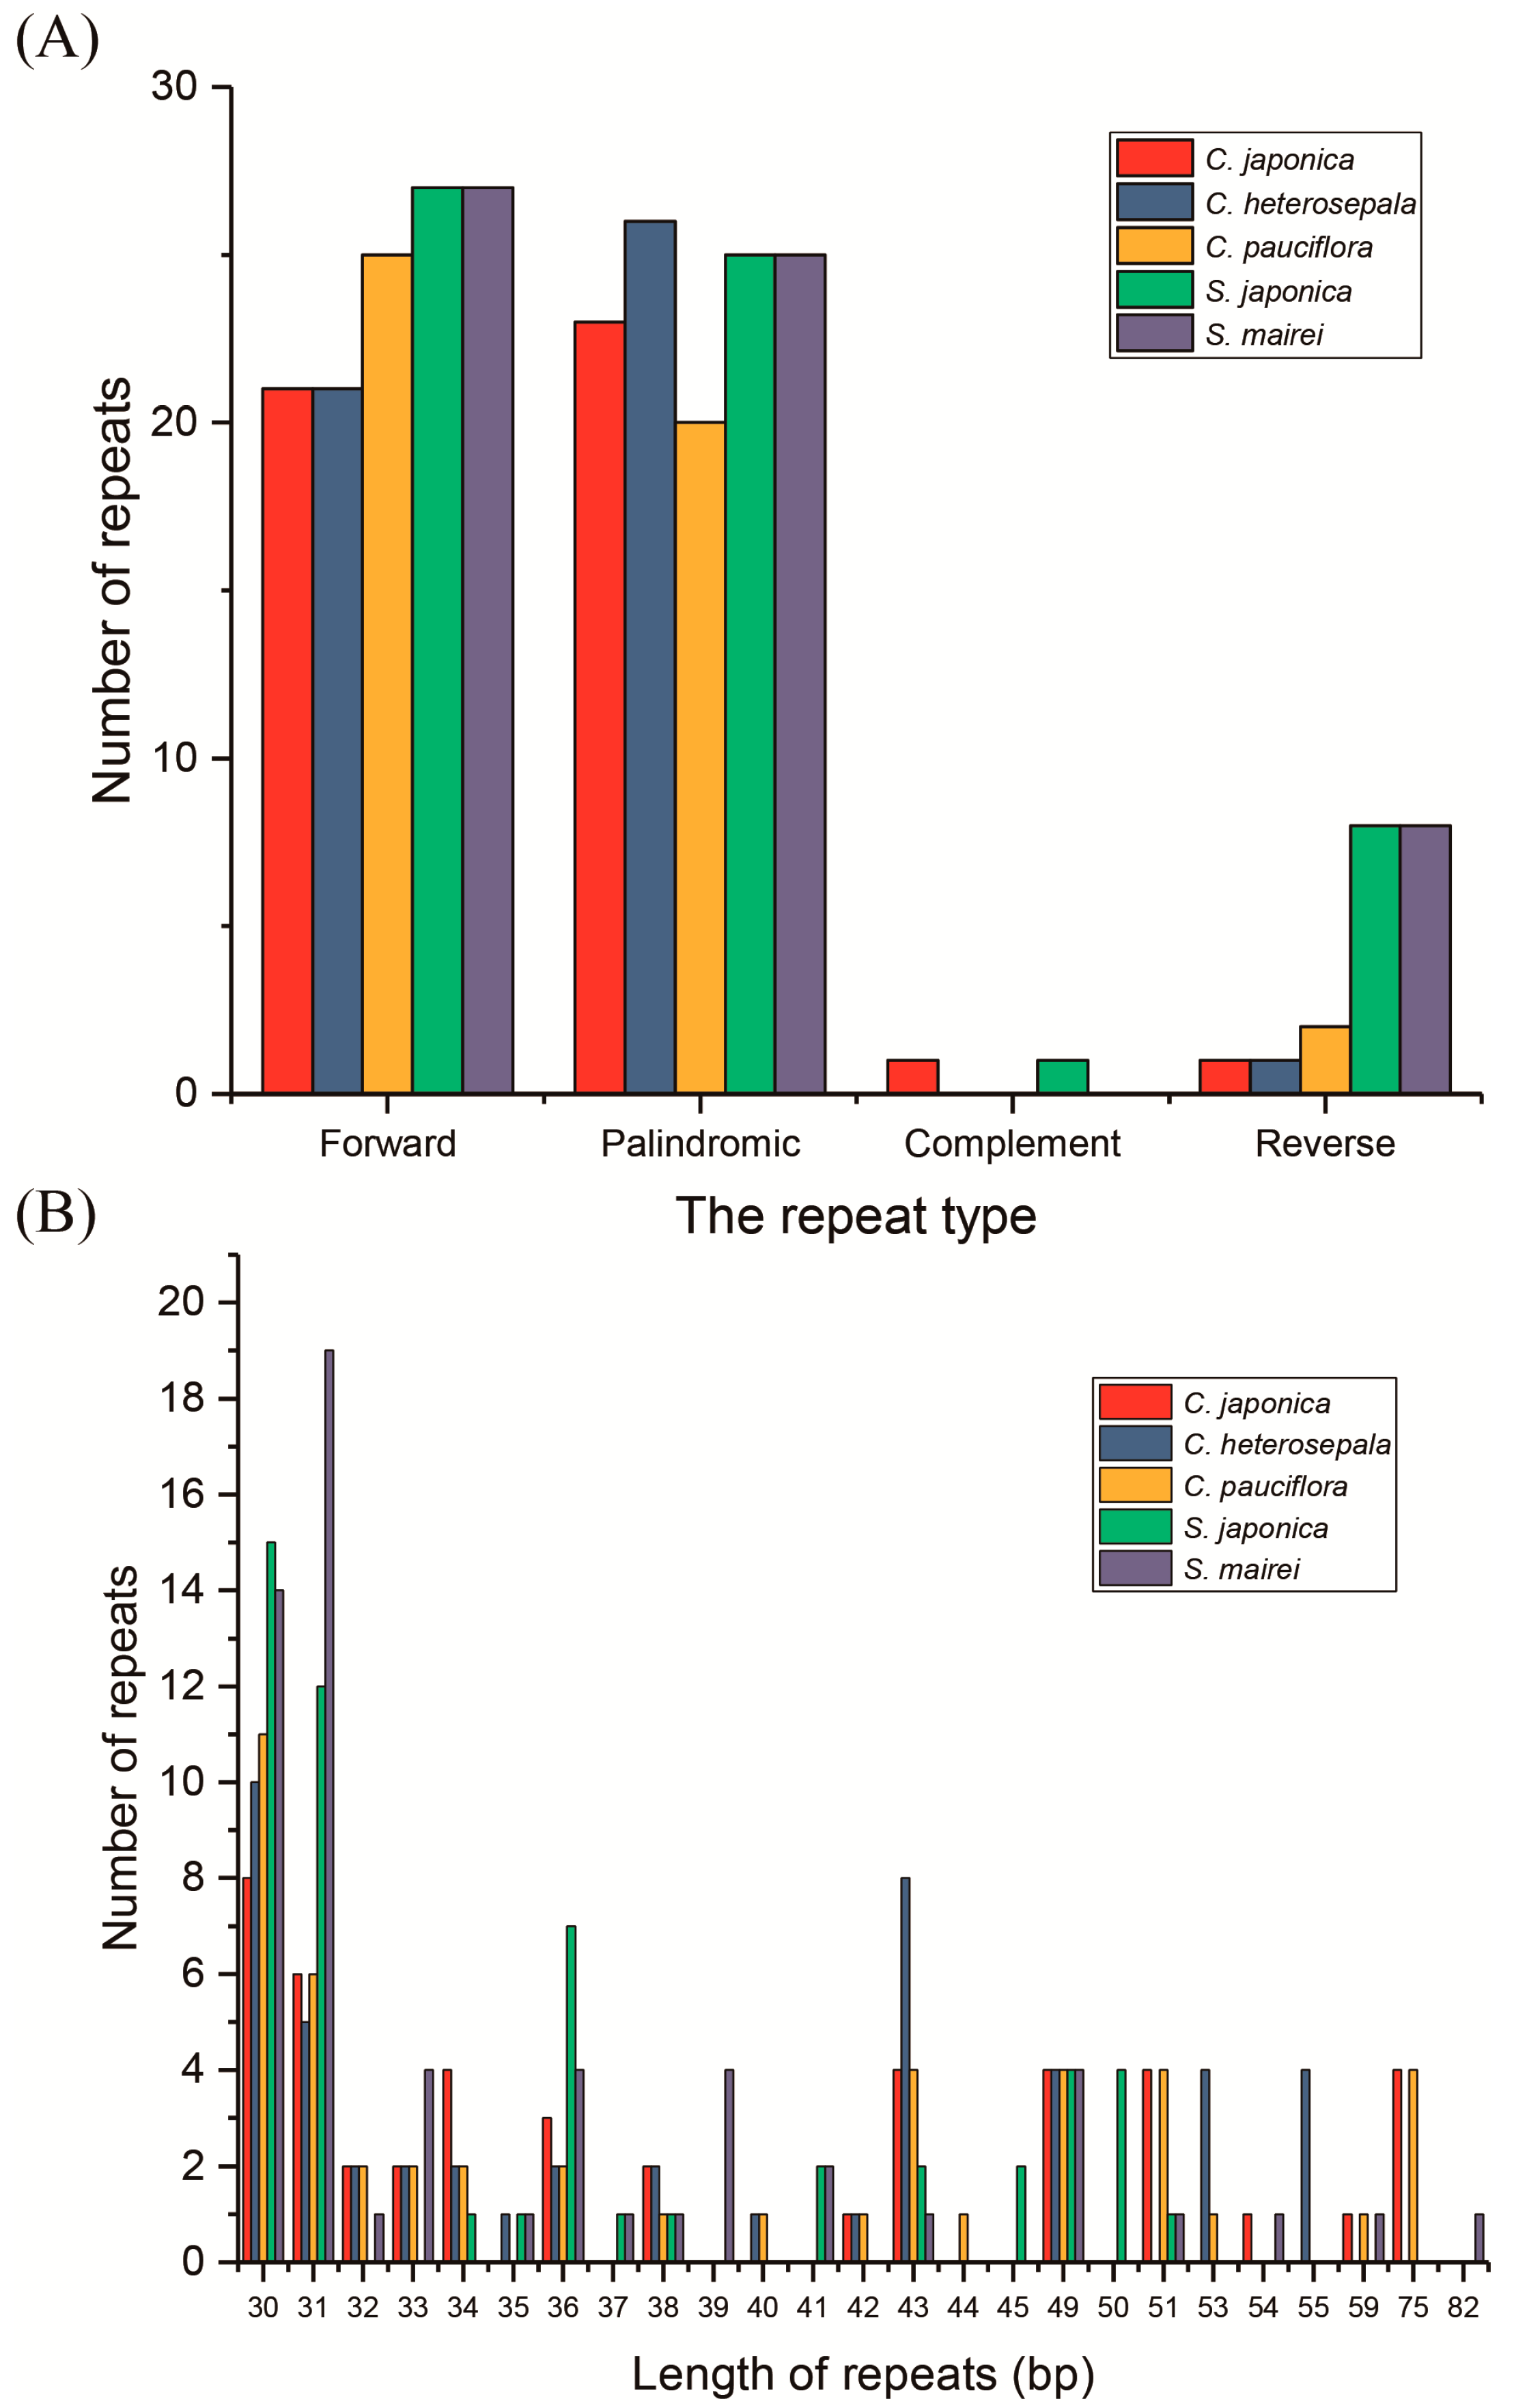
With the criterion of a copy size of 30 bp or longer and a sequence identity >90%, REPUTER [49] identified 47, 49, 48, 61 and 60 repeats (including forward, palindromic, complement and reverse repeats) in five cp genome sequences of C. japonica, C. heterosepala, C. pauciflora, S. japonica and S. mairei, respectively (Figure 5A). C. japonica contained 21 forward repeats, 24 palindromic repeats, 1 complement repeat and 1 reverse repeat, and S. japonica contained 27, 25, 1 and 8 repeats, correspondingly. The other two Croomia species and S. mairei contained no complement repeats. The numbers of forward repeats, palindromic and reverse repeats were, respectively, 21, 27 and 1 in C. japonica, 25, 21 and 2 in C. heterosepala and 27, 25 and 8 in S. mairei (Figure 5A). The lengths of majority repeats were 30, 31 and 43 bp in size (Figure 5B). For Croomia, the repeats were mainly located in ycf2 (46.8–58.3%) and non-coding regions (27.1–38.3%). As for Stemona, the repeats were mostly located in non-coding regions (58.3–59.0%) and ycf2 (33.3–34.4%). Only one repeat was across IGS (psbC–trnS) and CDS (trnSUGA). The remaining repeats were found located in genes such as ccsA, ycf1, trnGUGA, trnSGGA, trnSGCU and psaB.
SSRs in the cp genome present high diversity in copy numbers, and they are important molecular markers for plant population genomics and evolutionary history [50,51]. SSRs (≥10 bp) were detected in these five Stemonaceae cp genomes by MIcroSAtellite (MISA) analysis [52], ranging from 90–116 in total. Among these SSRs, the mononucleotide repeat unit (A/T) occupied the highest proportion, with 71.2% in C. japonica, 70.9% in C. heterosepala, 63.3% in C. pauciflora, 64.0% in S. japonica and 62.4% in S. mairei (Figure 6A). SSR loci were mainly located in IGS (71.4%) (Figure 6B) and were also detected in introns (16.5%) and CDS (12.1%), such as matK, atpA, rpoC2, rpoB, cemA, psbF, ycf2, ycf1 and ndhD. In general, the SSRs of these five cp genomes showed great variation, which can be used in population genetic studies of Croomia and Stemona species.
2.5. Phylogenetic Analysis, Divergence Time and Ancestral Area Reconstruction
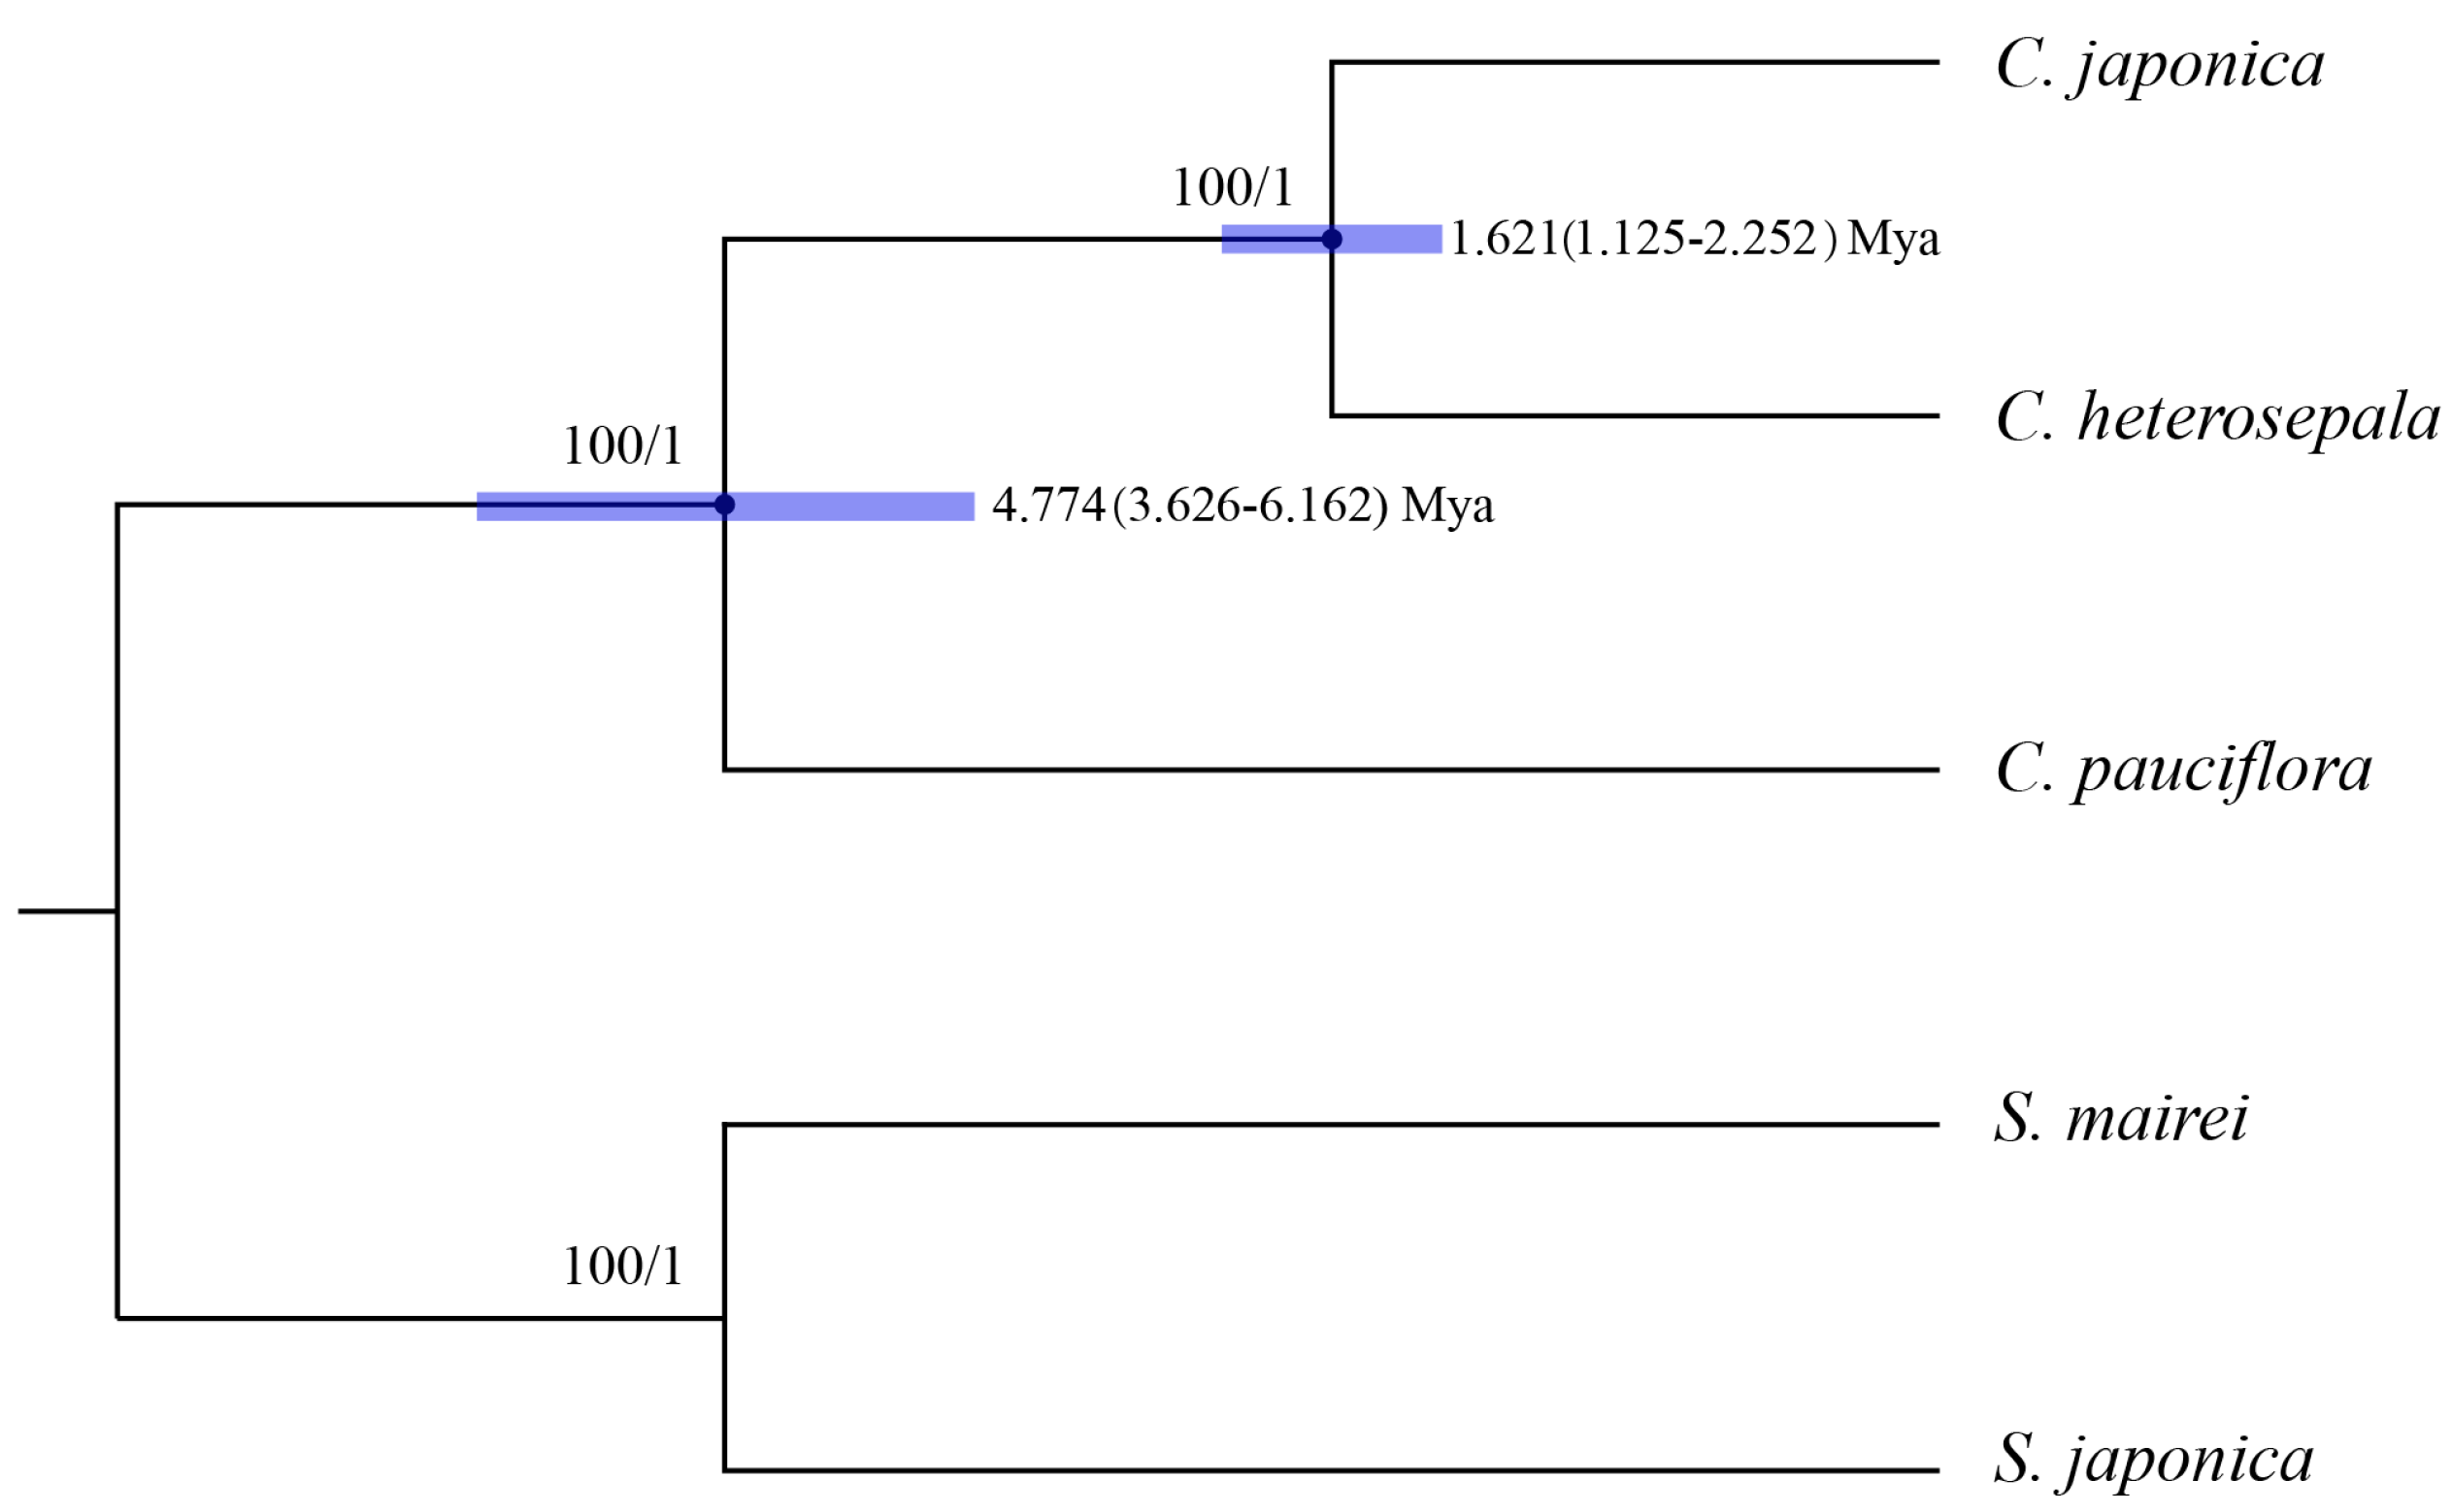
CP genome sequences have been successfully used in angiosperm phylogenetic studies [22,53]. The Maximum Likelihood (ML) and Bayesian Inference (BI) analyses of both whole sequences and protein-coding region of three Croomia and two Stemona cp genomes yielded nearly identical tree topologies, with 100% bootstrap and 1.0 Bayesian posterior probabilities at each node (Figure 7). This phylogenetic tree supports the monophyly of Croomia. Two Asian species C. japonica and C. heterosepala formed a clade, being strongly recovered as sisters of the North American species C. pauciflora. This tree topology is largely congruent with that inferred from trnL–F [12], but obtained much higher bootstrap support values. Using average substitution rates of whole cp genomes, the divergence time between the two Asian species, C. japonica and C. heterosepala, was estimated as ca. 1.621 Mya (1.125–2.251 Mya) and, thus, compatible with the early-Pleistocene event. By contrast, the divergence time between North American C. pauciflora and Asian species was estimated as ca. 4.774 Mya (3.626–6.162 Mya) (i.e., the Late Miocene). The divergence times estimated in this paper are much older than that estimated by the strict molecular clock method (C. pauciflora/the East Asian lineage: ca. 2.61–0.41 Mya; C. japonica/C. heterosepala: ca. 0.84–0.13 Mya) [12].
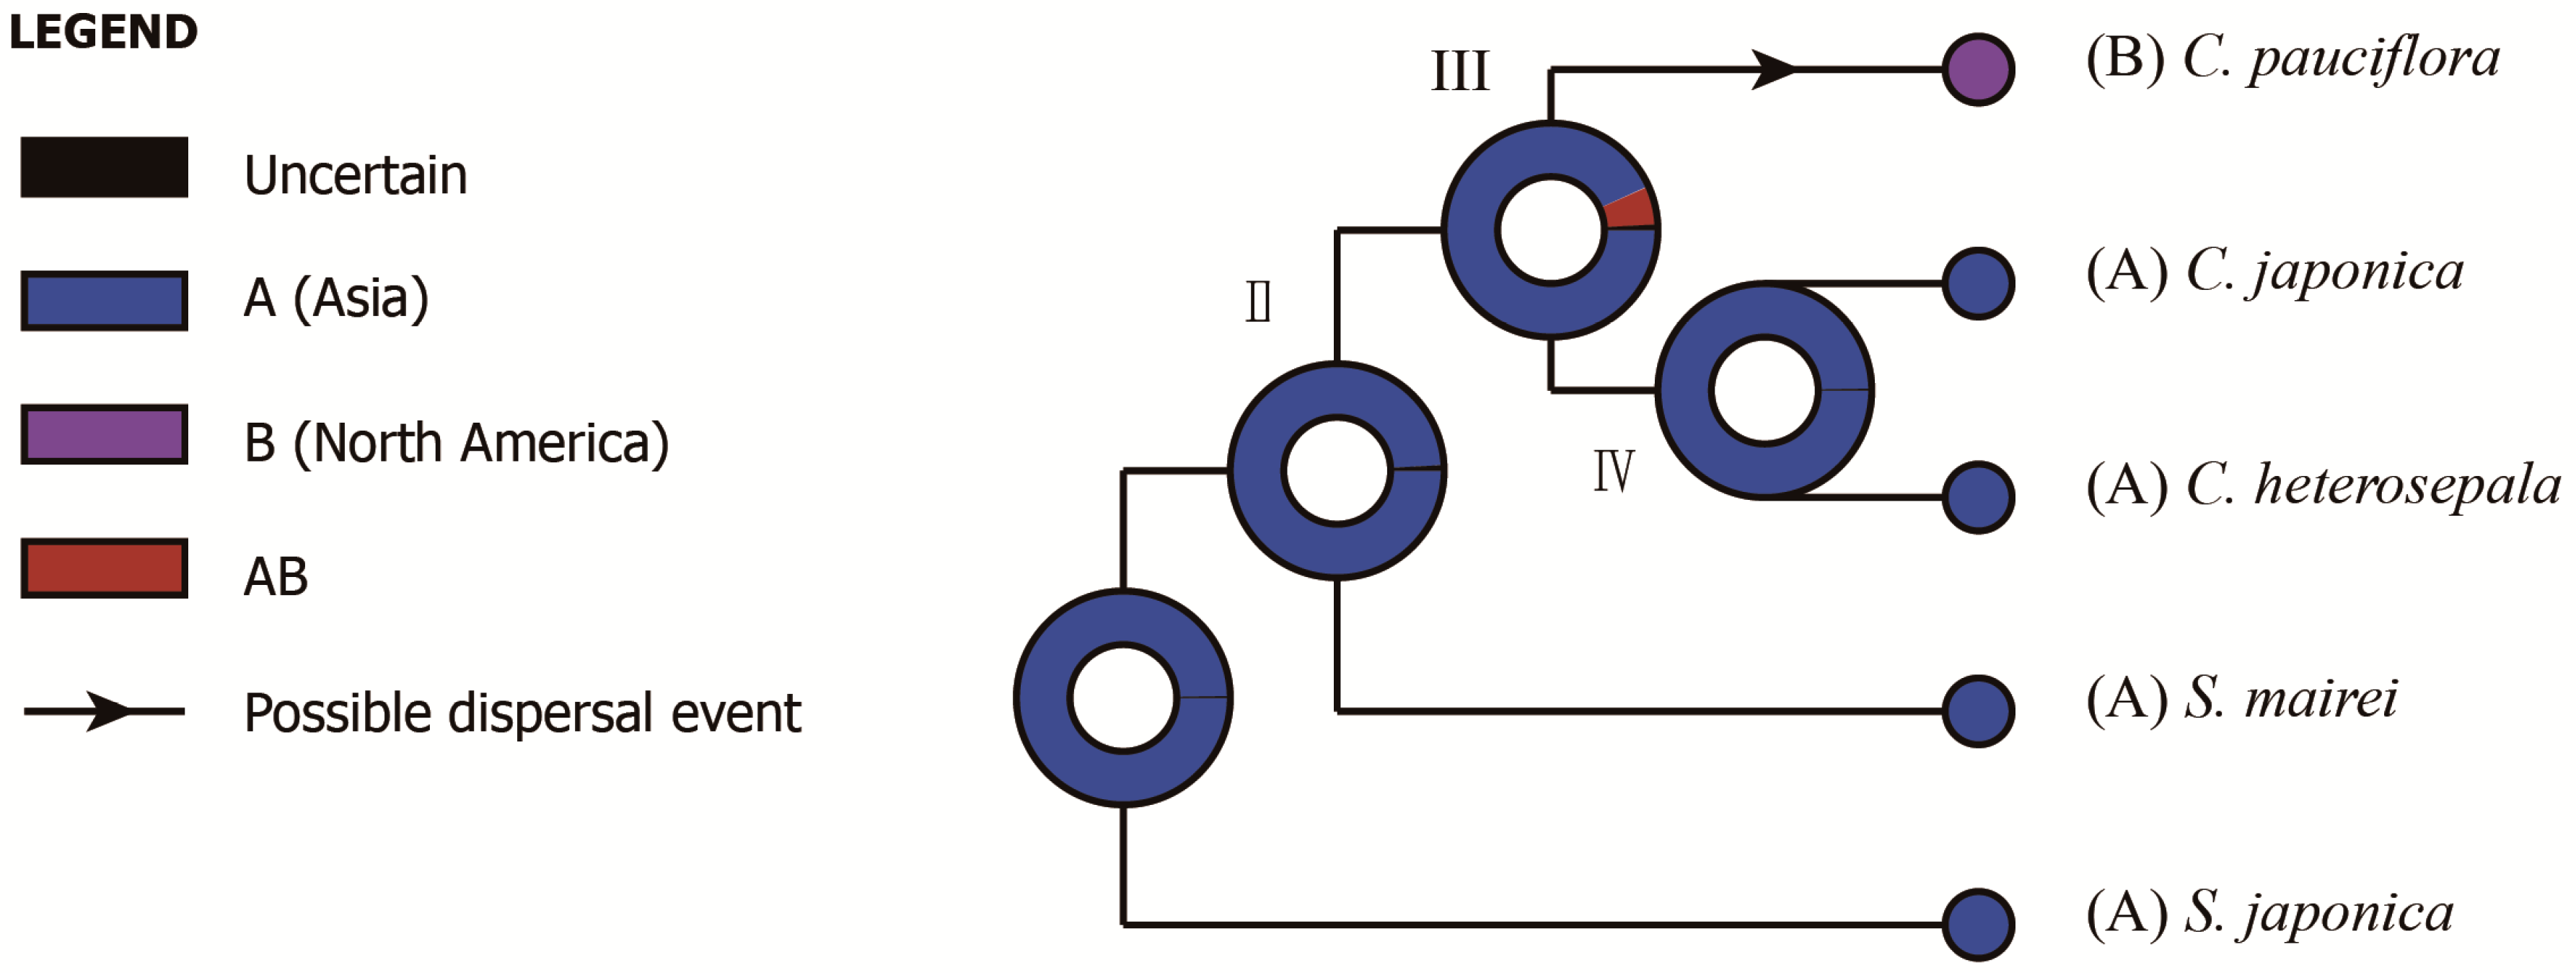
The divergence between C. pauciflora and two Asian species coincides with the first sundering of the Bering Land Bridge (BLB) between the late Miocene and early Pliocene, most approximately at 5.4–5.5 Mya (Milne and Abbott, 2002) [54]. The Bayesian Binary MCMC (BBM) analysis of ancestral area reconstruction identified Asia as the most likely ancestral range (Node III, marginal probability: 0.93; Figure A2), indicating a possible intercontinental plant migration from Asia to North America. Indeed, the BLB served as an important route for temperate floristic exchanges between Asia and North America from the Eocene to the early Pliocene [55,56]. Subsequently, as a member of the Tertiary relict flora [15], Croomia species on the two continents experienced disjunct distribution and evolved separately after the Late Miocene. Thus, we conclude that the current distribution and differentiation of Croomia species in eastern Asia and eastern North America likely resulted from a combination of ancient migration and vicariant events. The divergence time between C. japonica and C. heterosepala fell into the Early Pleistocene. Habitat fragmentation resulting from the climatic vicissitudes of the (Late) Quaternary likely led to the speciation of C. japonica and C. heterosepala [12]. The above inferences seem to be consistent with the palaeovegetational and climatic history of eastern Asia and eastern America. However, considering that the cp genome is a haploid, uniparentaly-inherited and single locus [57], a nuclear (biparental) marker is also needed to elucidate the diversification process and demography history of Croomia species.
3. Materials and Methods
3.1. Sample Preparation, Sequencing, Assembly and Validation
Fresh leaves of C. japonica from China, C. heterosepala from Japan, C. pauciflora from North America and two outgroup species Stemona japonica (Bl.) Miq. and S. mairei (Levl.) Krause from China were sampled and dried with silica gel. The voucher specimens were deposited in the Herbarium of Zhejiang University (HZU). Total genomic DNA was extracted from ~3 mg materials using DNA Plantzol Reagent (Invitrogen, Carlsbad, CA, USA) following the manufacturer’s protocol. The quality and concentration of the DNA were detected using agarose gel electrophoresis. Purified DNA was sheared into ~500-bp fragments, and the fragmentation quality was checked on a Bioanalyzer 2100 (Agilent Technologies, Santa Clara, CA, USA). Paired-end sequencing libraries were constructed according to the Illumina standard protocol (Illumina, San Diego, CA, USA). Genomic DNAs of five species were sequenced using an Illumina HiSeqTM 2000 (Illumina, San Diego, CA, USA) at Beijing Genomics Institute (BGI; Shenzhen, China). Plastome sequences were assembled using a combination of de novo and reference-guided assembly [58]. Firstly, to obtain clean reads, the CLC-quality trim tool was used to remove low-quality bases (Q < 20, 0.01 probability error). Secondly, we assembled the clean reads into contigs on the CLC de novo assembler. Thirdly, all the contigs were aligned with the reference cp genome of Carludovica palmate Ruiz. & Pav. (NC_026786.1) using local BLAST (http://blast.ncbi.nlm.nih.gov/) (27 December 2016), and aligned contigs were ordered according to the reference cp genome with ≥90% similarity and query coverage. Then, to construct the draft cp genome of each species, the ordered contigs usually representing the whole reconstructed genome were imported into GENEIOUS v9.0.5 software (http://www.geneious.com) (18 March 2017), where the clean reads were remapped onto the contigs.
3.2. Genome Annotation and Whole Genome Comparison
The annotation of five species was performed using the Dual Organellar GenoMe Annotator (DOGMA) [59]. The start and stop codons and intron/exon boundaries were manually corrected by comparison to homologous genes from the reference genome of C. palmate. We also verified the transfer RNAs (tRNAs) using tRNAscan-SE v1.21 with default settings [60]. The circular genome maps were drawn using the OrganellarGenome DRAW tool (OGDRAW) [61], followed by manual modification.
Genome comparison among the five Stemonaceae cp genomes was analyzed using mVISTA [62] with C. palmate as a reference. Six genome sequences were aligned in Shuffle-LAGAN mode with default parameters, and the conservation region was visualized in an mVISTA plot. To identify the divergence hotspot regions in the five Stemonaceae cp genomes, the nucleotide variability of protein coding genes, introns and intergenic spacer sequences of five species were evaluated using DNASP v5.10 [63]. The above regions were extracted following two criteria: (a) total number of mutation (Eta) >0; and (b) the aligned length >200 bp. The inverted regions in cemA, cemA–petA and petA were excluded. The top ten most variable noncoding regions with a high Pi value were counted by Potentially Informative Characters (PICs) across species pair of C. japonica and S. japonica following Shaw et al. [64]. Any large structural event of the cp genome, such as gene order rearrangements or IR expansion/contractions, were recorded.
3.3. Characterization of Repeat Sequence and SSRs
REPUTER [49] was used to find the location and length of repeat sequences, including forward, palindrome, complement and reverse repeats in the five cp genomes. The minimum repeat size was set to 30 bp, and the sequence identity of repeats was no less than 90% or greater sequence identity with the Hamming distance equal to 3. The MISA perl script was used to detect simple sequence repeats (SSRs) [52] with thresholds of 10 bp in length for mono-, di-, tri, tetra-, penta- and hexa-nucleotide SSRs.
3.4. Phylogenetic Analysis, Divergence Time and Ancestral Area Reconstruction
The five cp genome sequences were aligned using MAFFT v7 [65]. Two Stemona species were used as outgroups. ML and BI analysis were used to reconstruct the phylogenetic trees. In order to examine the phylogenetic utility of different regions, two datasets were used: (1) the complete cp genome sequences; (2) 78 protein-coding genes shared by the five cp genomes (two inverted genes of cemA and petA in Stemona species were excluded). Gaps (indels) were treated as missing data. The Akaike Information Criterion (AIC) in JMODELTEST v2.1.4 [66] was used to determine the best-fitting model of nucleotide substitutions. The GTR + I + G model was used for two datasets. The ML tree was constructed using RAXML-HPC v8.2.10 with 1000 replicates on the Cyberinfrastructure for Phylogenetic Research (CIPRES) Science Gateway website (http://www.phylo.org/) (10 May 2017) [67]. BI analysis was conducted in MRBAYES v3.2 [68]. The Markov chain Monte Carlo (MCMC) was set to run 1,000,000 generations and sampled every 1000 generations. The first 25% of generations was discarded as burn-in.
Due to the lack of fossil records, we used the average substitution rate 0.51952 × 10⁻⁹ per site per year (s/s/y) of the whole cp genome in Brassicaceae [69,70] to estimate interspecific divergence time of Croomia. The Bayesian analysis was implemented in BEAST v1.8.4 [71] using the GTR + I + G substitution model. MCMC analysis of 20,000,000 generations was implemented, in which every 1000 generations were sampled, under an uncorrelated lognormal relaxed clock approach using the Yule speciation tree prior with the substitution rate. TRACER v1.6 [72] was used to check the effective population size (ESS) >200. TREEANNOTATOR v.1.8.4 [73] was used to produce maximum clade credibility trees from the trees after burning-in of 25%. The final tree was visualized in FIGTREE v1.4.3 (http://tree.bio.ed.ac.uk/software/figtree/) (13 May 2017).
To reconstruct the historical biogeography of Croomia, we performed Bayesian Binary MCMC (BBM) analysis as implemented in RASP v3.1 [74] using trees retained from the BI analysis (see above). According to the distribution of Croomia, we defined the following two areas: A, Asia (East Asia/South Asia); and B, North America. Accounting for phylogenetic uncertainty, we used 500 trees randomly chosen across all post-burn-in trees generated from BEAST analysis and ran the BBM analysis. A fixed JC + G (Jukes–Cantor + Gamma) model was chosen with a null root distribution. The MCMC chains were run for 500,000 generations, and every 100 generations were sampled. The ancestral ranges obtained were projected onto the MCC tree.
4. Conclusions
Here, we sequenced the first five complete cp genomes in Stemonaceae. Each genome possesses the typical structure shared with other angiosperm species. Several highly variable noncoding cpDNA regions were identified, which should be the best choices for future phylogenetic, phylogeographic and population-level genetic studies in Stemonaceae. The phylogenomic and biogeographic analyses of Croomia reveal that ancient migration and vicariance-driven allopatric speciation resulting from historical climate oscillations most likely played roles in the formation of the disjunct distributions and divergence of these three Croomia species.
Supplementary Materials
Supplementary materials can be found at https://www.mdpi.com/1422-0067/19/8/2383/s1.
Author Contributions
Y.Q. conceived of the idea. R.L. contributed to the sampling. Q.L. performed the experiment. Q.L., W.Y., R.L. and W.X. analyzed the data. The manuscript was written by Q.L., W.Y. and Y.Q.
Funding
This research was funded by the International Cooperation and Exchange of the National Natural Science Foundation of China (Grant Nos. 31561143015, 31511140095) and the National Natural Science Foundation of China (Grant Nos. 31570214, 31700321).
Acknowledgments
The authors thank Shota Sakaguchi from Kyoto University for collecting plant materials in Japan.
Conflicts of Interest
The authors declare that the research was conducted in the absence of any commercial or financial relationships that could be construed as a potential conflict of interest.
Abbreviations
| cp | Complete chloroplast |
| IR | Inverted Repeat |
| lSC | Large Single Copy |
| SSC | Small Single Copy |
| Pi | Nucleotide variability |
| SSR | Simple Sequence Repeat |
| PIC | Potentially Informative Character |
| ML | Maximum likelihood |
| BI | Bayesian Inference |
| MCMC | Markov chain Monte Carlo |
Appendix A
Figure A1.
PIC values of the top ten most variable noncoding regions in Stemonaceae.

Figure A2.
The Bayesian Binary MCMC (BBM) analysis of ancestral area reconstruction.

References
- Rogers, G.K. The Stemonaceae in the southeastern United States. J. Arnold Arboretum 1982, 63, 327–336. [Google Scholar]
- Whetstone, R.D. Notes on Croomia pauciflora (Stemonaceae). Rhodora 1984, 25, 131–137. [Google Scholar]
- Li, E.X. Studies on Phylogeography of Croomia and Phylogeny of Croomia and Its Allies. Ph.D. Thesis, Zhejiang University, Hangzhou, China, 2006. [Google Scholar]
- Okuyama, S. On the Japanese species of Croomia. J. Jpn. Bot. 1944, 20, 31–32. [Google Scholar]
- Ohwi, J. Croomia. In Flora of Japan; Smithsonian Institution: Washington, DC, USA, 1965; p. 279. [Google Scholar]
- Lin, W.; Cai, M.; Ying, B.; Feng, R. Studies on the chemical constituents of Croomia japonica Miq. Yao Xue Xue Bao 1993, 28, 202–206. [Google Scholar] [PubMed]
- Pilli, R.A.; Ferreira, M.C. Recent progress in the chemistry of the Stemona alkaloids. Nat. Prod. Rep. 2000, 17, 117–127. [Google Scholar] [CrossRef] [PubMed]
- Ji, Z.H.; Duyfjes, B.E. “Stemonaceae”, in Flora of China, Flagellariaceae through Marantaceae. In Flora of China; Wu, Z.Y., Raven, P.H., Eds.; Missouri Botanical Garden Press: Beijing, China, 2000; Volume 24, pp. 70–72. [Google Scholar]
- Patrick, T.S.; Allison, J.; Krakow, G. Protected plants of Georgia. Georgia Department of Natural Resources, Natural Heritage Program. Soc. Circ. 1995, 25, 36–38. [Google Scholar]
- Estill, J.C.; Cruzan, M.B. Phytogeography of rare plant species endemic to the southeastern United States. Castanea 2001, 36, 3–23. [Google Scholar]
- Sung, W.; Yan, X. China Species Red List; Higher Education Press: Beijing, China, 2004. [Google Scholar]
- Li, E.; Yi, S.; Qiu, Y.; Guo, J.; Comes, H.P.; Fu, C. Phylogeography of two East Asian species in Croomia (Stemonaceae) inferred from chloroplast DNA and ISSR fingerprinting variation. Mol. Phylogenet. Evol. 2008, 49, 702–714. [Google Scholar] [CrossRef] [PubMed]
- Xiang, Q.Y.; Soltis, D.E.; Soltis, P.S. The eastern Asian and eastern and western North American floristic disjunction: Congruent phylogenetic patterns in seven diverse genera. Mol. Phylogenet. Evol. 1998, 10, 178–190. [Google Scholar] [CrossRef] [PubMed]
- Wen, J. Evolution of eastern Asian and eastern North American disjunct distributions in flowering plants. Annu. Rev. Ecol. Syst. 1999, 30, 421–455. [Google Scholar] [CrossRef]
- Wolfe, J.A. Some aspects of plant geography in the Northern Hemisphere during the late Cretaceous and Tertiary. Ann. Mo. Bot. Gard. 1975, 62, 264–279. [Google Scholar] [CrossRef]
- Tiffney, B.H.; Manchester, S.R. The use of geological and paleontological evidence in evaluating plant phylogeographic hypotheses in the Northern Hemisphere Tertiary. Int. J. Plant Sci. 2001, 162, 48–52. [Google Scholar] [CrossRef]
- Li, H.L. Floristic relationships between eastern Asia and eastern North America. Trans. Am. Philos. Soc. 1952, 42, 371–429. [Google Scholar] [CrossRef]
- Fukuoka, N.; Kurosaki, N. Phytogeographical notes on some species of west Honshu, Japan 5. Shoei Jr. Col. Ann. Rep. Stud. 1985, 17, 61–71. [Google Scholar]
- Yang, J.B.; Tang, M.; Li, H.T.; Zhang, Z.R.; Li, D.Z. Complete chloroplast genome of the genus Cymbidium: Lights into the species identification, phylogenetic implications and population genetic analyses. BMC Evol. Boil. 2013, 13, 84–98. [Google Scholar] [CrossRef] [PubMed]
- Ruhsam, M.; Rai, H.S.; Mathews, S.; Ross, T.G.; Graham, S.W.; Raubeson, L.A.; Mei, W.; Thomas, P.I.; Gardner, M.F.; Ennos, R.A. Does complete plastid genome sequencing improve species discrimination and phylogenetic resolution in Araucaria? Mol. Ecol. Res. 2015, 15, 1067–1078. [Google Scholar] [CrossRef] [PubMed]
- Firetti, F.; Zuntini, A.R.; Gaiarsa, J.W.; Oliveira, R.S.; Lohmann, L.G.; Van Sluys, M.A. Complete chloroplast genome sequences contribute to plant species delimitation: A case study of the Anemopaegma species complex. Am. J. Bot. 2017, 104, 1493–1509. [Google Scholar] [CrossRef] [PubMed]
- Jansen, R.K.; Cai, Z.; Raubeson, L.A.; Daniell, H.; Claude, W.; Leebensmack, J.; Guisingerbellian, M.; Haberle, R.C.; Hansen, A.; Chumley, T.W. Analysis of 81 genes from 64 plastid genomes resolves relationships in angiosperms and identifies genome-scale evolutionary patterns. Proc. Natl. Acad. Sci. USA 2007, 104, 19369–19374. [Google Scholar] [CrossRef] [PubMed] [Green Version]
- Cai, J.; Ma, P.; Li, H.; Li, D. Complete plastid genome sequencing of four Tilia species (Malvaceae): A comparative analysis and phylogenetic implications. PLoS ONE 2015, 10, e0142705. [Google Scholar] [CrossRef] [PubMed]
- Sloan, D.B.; Alverson, A.J.; Wu, M.; Palmer, J.D.; Taylor, D.R. Recent acceleration of plastid sequence and structural evolution coincides with extreme mitochondrial divergence in the angiosperm genus Silene. Genome Biol. Evol. 2012, 4, 294–306. [Google Scholar] [CrossRef] [PubMed]
- Wang, Y.; Qu, X.; Chen, S.; Li, D.; Yi, T. Plastomes of Mimosoideae: Structural and size variation, sequence divergence, and phylogenetic implication. Tree Genet. Genom. 2017, 13, 41–56. [Google Scholar] [CrossRef]
- Qian, J.; Song, J.; Gao, H.; Zhu, Y.; Xu, J.; Pang, X.; Yao, H.; Sun, C.; Li, X.E.; Li, C. The complete chloroplast genome sequence of the medicinal plant Salvia miltiorrhiza. PLoS ONE 2013, 3, e57607. [Google Scholar] [CrossRef] [PubMed]
- Fu, C.; Li, H.; Milne, R.I.; Zhang, T.; Ma, P.; Yang, J.; Li, D.; Gao, L. Comparative analyses of plastid genomes from fourteen Cornales species: Inferences for phylogenetic relationships and genome evolution. BMC Genom. 2017, 18, 956–963. [Google Scholar] [CrossRef] [PubMed]
- Hansen, D.R.; Dastidar, S.G.; Cai, Z.; Penaflor, C.; Kuehl, J.V.; Boore, J.L.; Jansen, R.K. Phylogenetic and evolutionary implications of complete chloroplast genome sequences of four early-diverging angiosperms: Buxus (Buxaceae), Chloranthus (Chloranthaceae), Dioscorea (Dioscoreaceae), and Illicium (Schisandraceae). Mol. Phylogenet. Evol. 2007, 45, 547–563. [Google Scholar] [CrossRef] [PubMed]
- Liu, Y.; Huo, N.; Dong, L.; Wang, Y.; Zhang, S.; Young, H.A.; Feng, X.; Gu, Y.Q. Complete chloroplast genome sequences of mongolia medicine Artemisia frigida and phylogenetic relationships with other plants. PLoS ONE 2013, 8, e57533. [Google Scholar] [CrossRef] [PubMed]
- Walker, J.F.; Zanis, M.J.; Emery, N.C. Comparative analysis of complete chloroplast genome sequence and inversion variation in Lasthenia burkei (Madieae, Asteraceae). Am. J. Bot. 2014, 101, 722–729. [Google Scholar] [CrossRef] [PubMed]
- Yang, M.; Zhang, X.; Liu, G.; Yin, Y.; Chen, K.; Yun, Q.; Zhao, D.G.; Almssallem, I.S.; Yu, J. The complete chloroplast genome sequence of date palm (Phoenix dactylifera L.). PLoS ONE 2010, 5, e12762. [Google Scholar] [CrossRef] [PubMed]
- Wang, M.; Cui, L.; Feng, K.; Deng, P.; Du, X.; Wan, F.; Weining, S.; Nie, X. Comparative analysis of asteraceae chloroplast genomes: Structural organization, RNA editing and evolution. Plant Mol. Biol. Rep. 2015, 33, 1526–1538. [Google Scholar] [CrossRef]
- Palmer, J.D. Chloroplast DNA exists in two orientations. Nature 1983, 301, 92–93. [Google Scholar] [CrossRef]
- Wolfe, A.D.; Randle, C.P. Recombination, heteroplasmy, haplotype polymorphism, and paralogy in plastid genes: Implications for plant molecular systematics. Syst Bot. 2004, 29, 1011–1020. [Google Scholar] [CrossRef]
- Walker, J.F.; Jansen, R.K.; Zanis, M.J.; Emery, N.C. Sources of inversion variation in the small single copy (SSC) region of chloroplast genomes. Am. J. Bot. 2015, 102, 1751–1752. [Google Scholar] [CrossRef] [PubMed] [Green Version]
- Kim, K.J.; Lee, H.L. Complete chloroplast genome sequences from Korean ginseng (Panax schinseng Nees) and comparative analysis of sequence evolution among 17 vascular plants. DNA Res. 2004, 11, 247–261. [Google Scholar] [CrossRef] [PubMed]
- Downie, S.R.; Jansen, R.K. A comparative analysis of whole plastid genomes from the apiales: Expansion and contraction of the inverted repeat, mitochondrial to plastid transfer of DNA, and identification of highly divergent noncoding regions. Sys. Bot. 2015, 40, 336–351. [Google Scholar] [CrossRef]
- Wang, R.J.; Cheng, C.L.; Chang, C.C.; Wu, C.L.; Su, T.M.; Chaw, S. Dynamics and evolution of the inverted repeat-large single copy junctions in the chloroplast genomes of monocots. BMC Evol. Biol. 2008, 8, 6–8. [Google Scholar] [CrossRef] [PubMed]
- Nazareno, A.G.; Carlsen, M.; Lohmann, L.G. Complete chloroplast genome of tanaecium tetragonolobum: The first Bignoniaceae plastome. PLoS ONE 2015, 10, e0129930. [Google Scholar] [CrossRef] [PubMed]
- Yao, X.; Tang, P.; Li, Z.; Li, D.; Liu, Y.; Huang, H. The first complete chloroplast genome sequences in Actinidiaceae: Genome structure and comparative analysis. PLoS ONE 2015, 10, e0129347. [Google Scholar] [CrossRef] [PubMed]
- Khakhlova, O.; Bock, R. Elimination of deleterious mutations in plastid genomes by gene conversion. Plant J. 2006, 46, 85–94. [Google Scholar] [CrossRef] [PubMed] [Green Version]
- Zhang, Y.; Ma, P.; Li, D. High-throughput sequencing of six bamboo chloroplast genomes: Phylogenetic implications for temperate woody bamboos (Poaceae: Bambusoideae). PLoS ONE 2011, 6, e20596. [Google Scholar] [CrossRef] [PubMed]
- Choi, K.S.; Chung, M.G.; Park, S. The Complete Chloroplast Genome Sequences of Three Veroniceae Species (Plantaginaceae): Comparative Analysis and Highly Divergent Regions. Front. Plant Sci. 2016, 7, 355–394. [Google Scholar] [CrossRef] [PubMed]
- Shaw, J.; Shafer, H.L.; Leonard, O.R.; Kovach, M.J.; Schorr, M.S.; Morris, A.B. Chloroplast DNA sequence utility for the lowest phylogenetic and phylogeographic inferences in angiosperms: The tortoise and the hare IV. Am. J. Bot. 2014, 101, 1987–2004. [Google Scholar] [CrossRef] [PubMed] [Green Version]
- Shaw, J.; Lickey, E.B.; Schilling, E.E.; Small, R.L. Comparison of whole chloroplast genome sequences to choose noncoding regions for phylogenetic studies in angiosperms: The tortoise and the hare III. Am. J. Bot. 2007, 94, 275–288. [Google Scholar] [CrossRef] [PubMed]
- Li, P.; Lu, R.; Xu, W.; Ohitoma, T.; Cai, M.; Qiu, Y.; Cameron, K.M.; Fu, C. Comparative genomics and phylogenomics of east Asian tulips (amana, Liliaceae). Front. Plant Sci. 2017, 8, 35–39. [Google Scholar] [CrossRef] [PubMed]
- Carlson, S.E.; Linder, H.P.; Donoghue, M.J. The historical biogeography of Scabiosa (Dipsacaceae): Implications for Old World plant disjunctions. J. Biol. 2012, 39, 1086–1100. [Google Scholar] [CrossRef]
- Yue, J.; Sun, H.; Baum, D.A.; Jianhua, L.I.; Alshehbaz, I.A.; Ree, R.H. Molecular phylogeny of Solms-laubachia (Brassicaceae) s.l., based on multiple nuclear and plastid DNA sequences, and its biogeographic implications. J. Syst. Evol. 2009, 47, 402–415. [Google Scholar] [CrossRef]
- Kurtz, S.; Schleiermacher, C. REPuter: Fast computation of maximal repeats in complete genomes. Bioinformatics 1999, 15, 426–427. [Google Scholar] [CrossRef] [PubMed]
- Huang, H.; Shi, C.; Liu, Y.; Mao, S.Y.; Gao, L.Z. Thirteen Camellia chloroplast genome sequences determined by high-throughput sequencing: Genome structure and phylogenetic relationships. BMC Evol. Biol. 2014, 14, 151–162. [Google Scholar] [CrossRef] [PubMed]
- Zhao, Y.; Yin, J.; Guo, H.; Zhang, Y.; Xiao, W.; Sun, C.; Wu, J.; Qu, X.; Yu, J.; Wang, X. The complete chloroplast genome provides insight into the evolution and polymorphism of Panax ginseng. Front. Plant Sci. 2015, 5, 696–698. [Google Scholar] [CrossRef] [PubMed]
- Thiel, T.; Michalek, W.; Varshney, R.; Graner, A. Exploiting EST databases for the development and characterization of gene-derived SSR-markers in barley (Hordeum vulgare L.). Theor. Appl. Genet. 2003, 106, 411–422. [Google Scholar] [CrossRef] [PubMed]
- Kim, K.; Lee, S.C.; Lee, J.; Yu, Y.; Yang, K.; Choi, B.S.; Koh, H.J.; Waminal, N.E.; Choi, H.I.; Kim, N.H. Complete chloroplast and ribosomal sequences for 30 accessions elucidate evolution of Oryza AA genome species. Sci. Rep. 2015, 5, 15–16. [Google Scholar] [CrossRef] [PubMed]
- Milne, R.I.; Abbott, R.J. The origin and evolution of tertiary relict floras. Adv. Bot. Res 2002, 38, 281–314. [Google Scholar]
- Tiffney, B.H. Perspectives on the origin of the floristic similarity between eastern Asia and eastern North America. J. Arn. Arb. 1985, 66, 73–94. [Google Scholar] [CrossRef]
- Xiang, Q.; Soltis, D.E.; Soltis, P.S.; Manchester, S.R.; Crawford, D.J. Timing the eastern Asian-eastern North American floristic disjunction: Molecular clock corroborates paleontological estimates. Mol. Phylogenet. Evol. 2000, 15, 462–472. [Google Scholar] [CrossRef] [PubMed]
- Birky, C.W. Uniparental inheritance of mitochondrial and chloroplast genes: Mechanisms and evolution. Proc. Natl. Acad. Sci. USA 1995, 92, 11331–11338. [Google Scholar] [CrossRef] [PubMed]
- Cronn, R.; Liston, A.; Parks, M.; Gernandt, D.S.; Shen, R.; Mockler, T. Multiplex sequencing of plant chloroplast genomes using Solexa sequencing-by-synthesis technology. Nucleic Acids Res. 2008, 36, 122–125. [Google Scholar] [CrossRef] [PubMed]
- Wyman, S.K.; Jansen, R.K.; Boore, J.L. Automatic annotation of organellar genomes with DOGMA. Bioinformatics 2004, 20, 3252–3255. [Google Scholar] [CrossRef] [PubMed] [Green Version]
- Schattner, P.; Brooks, A.N.; Lowe, T.M. The tRNAscan-SE, snoscan and snoGPS web servers for the detection of tRNAs and snoRNAs. Nucleic Acids Res. 2005, 33, 686–689. [Google Scholar] [CrossRef] [PubMed]
- Lohse, M.; Drechsel, O.; Bock, R. OrganellarGenomeDRAW (OGDRAW): A tool for the easy generation of high-quality custom graphical maps of plastid and mitochondrial genomes. Curr. Genet. 2007, 52, 267–274. [Google Scholar] [CrossRef] [PubMed]
- Frazer, K.A.; Pachter, L.; Poliakov, A.; Rubin, E.M.; Dubchak, I. VISTA: Computational tools for comparative genomics. Nucleic Acids Res. 2004, 32, 273–279. [Google Scholar] [CrossRef] [PubMed]
- Librado, P.; Rozas, J. DnaSP v5. Bioinformatics 2009, 25, 1451–1452. [Google Scholar] [CrossRef] [PubMed]
- Shaw, J.; Lickey, E.B.; Beck, J.T.; Farmer, S.B.; Liu, W.; Miller, J.; Siripun, K.C.; Winder, C.T.; Schilling, E.E.; Small, R.L. The tortoise and the hare II: Relative utility of 21 noncoding chloroplast DNA sequences for phylogenetic analysis. Am. J. Bot. 2005, 92, 142–166. [Google Scholar] [CrossRef] [PubMed]
- Katoh, K.; Standley, D.M. MAFFT multiple sequence alignment software version 7: Improvements in performance and usability. Mol. Bio. Evol. 2013, 30, 772–780. [Google Scholar] [CrossRef] [PubMed]
- Posada, D. jModelTest: Phylogenetic model averaging. Mol. Biol. Evol. 2008, 25, 1253–1256. [Google Scholar] [CrossRef] [PubMed]
- Miller, M.A.; Pfeiffer, W.; Schwartz, T. Creating the CIPRES Science Gateway for inference of large phylogenetic trees. Gatew. Comput. Environ. Workshop 2010, 3, 1–8. [Google Scholar]
- Ronquist, F.; Huelsenbeck, J.P. MrBayes 3: Bayesian phylogenetic inference under mixed models. Bioinformatics 2003, 19, 1572–1574. [Google Scholar] [CrossRef] [PubMed] [Green Version]
- Hohmann, N.; Wolf, E.M.; Lysak, M.A.; Koch, M.A. A time-calibrated road map of Brassicaceae species radiation and evolutionary history. Plant Cell 2015, 27, 2770–2784. [Google Scholar] [CrossRef] [PubMed]
- Hu, H.; Hu, Q.; Alshehbaz, I.A.; Luo, X.; Zeng, T.; Guo, X.; Liu, J. Species delimitation and interspecific relationships of the genus Orychophragmus (Brassicaceae) inferred from whole chloroplast genomes. Front. Plant Sci. 2016, 7, 1826–2884. [Google Scholar] [CrossRef] [PubMed]
- Drummond, A.J.; Suchard, M.A.; Xie, D.; Rambaut, A. Bayesian phylogenetics with BEAUti and the BEAST 1.7. Mol. Biol. Evol. 2012, 29, 1969–1973. [Google Scholar] [CrossRef] [PubMed]
- Rambaut, A.; Drummond, A.J. Tracer v.1.4. Encycl. Atmos. Sci. 2007, 141, 2297–2305. [Google Scholar]
- Bouckaert, R.R.; Heled, J.; Kuhnert, D.; Vaughan, T.G.; Wu, C.H.; Xie, D.; Suchard, M.A.; Rambaut, A.; Drummond, A.J. BEAST 2: A software platform for bayesian evolutionary analysis. PLoS Computat. Biol. 2014, 10, 38–49. [Google Scholar] [CrossRef] [PubMed]
- Yu, Y.; Harris, A.J.; Blair, C.; He, X. RASP (Reconstruct Ancestral State in Phylogenies): A tool for historical biogeography. Mol. Phylogenet. Evol. 2015, 87, 46–49. [Google Scholar] [CrossRef] [PubMed]
Figure 1.
Gene maps of Croomia and Stemona chloroplast genomes. (A) Croomia japonica; (B) Stemona japonica.
Figure 1.
Gene maps of Croomia and Stemona chloroplast genomes. (A) Croomia japonica; (B) Stemona japonica.

Figure 2.
Comparison of LSC, IR and SSC junction positions among five Stemonaceae chloroplast genomes.
Figure 2.
Comparison of LSC, IR and SSC junction positions among five Stemonaceae chloroplast genomes.

Figure 3.
Sequence identity plots among five Stemonaceae chloroplast genomes, with Stemona japonica as a reference. CNS: conserved non-coding sequences; UTR: untranslated region.
Figure 3.
Sequence identity plots among five Stemonaceae chloroplast genomes, with Stemona japonica as a reference. CNS: conserved non-coding sequences; UTR: untranslated region.

Figure 4.
The nucleotide variability (Pi) values were compared among five Stemonaceae species.

Figure 5.
Analysis of repeated sequences in five Stemonaceae chloroplast genomes. (A) Frequency of repeats by length; (B) frequency of repeat types.
Figure 5.
Analysis of repeated sequences in five Stemonaceae chloroplast genomes. (A) Frequency of repeats by length; (B) frequency of repeat types.

Figure 6.
Simple Sequence Repeats (SSRs) in five Stemonaceae chloroplast genomes. (A) Numbers of SSRs by length; (B) distribution of SSR loci. IGS: intergenic spacer region; CDS: protein-coding regions.
Figure 6.
Simple Sequence Repeats (SSRs) in five Stemonaceae chloroplast genomes. (A) Numbers of SSRs by length; (B) distribution of SSR loci. IGS: intergenic spacer region; CDS: protein-coding regions.

Figure 7.
Phylogenetic relationships of three Croomia species inferred from Maximum Likelihood (ML) and Bayesian Inference (BI) and divergence time of three Croomia species estimated using Bayesian Evolutionary Analysis Sampling Trees (BEAST) analysis. Numbers above the lines represent ML bootstrap values and BI posterior probability. Blue bars indicate the 95% highest posterior density (HPD) credibility intervals for node ages (Mya). Numbers at the node represent divergence time (Mya) and 95% highest posterior density intervals. The phylogenetic tree based on 74 protein-coding genes is completely consistent with this topology.


Table 1.
List of genes in Stemonaceae chloroplast genomes.
| Category of Genes | Groups of Genes | Names of Genes |
|---|---|---|
| Self-replication | rRNA genes | rrn16(×2), rrn23(×2), rrn4.5(×2), rrn 5(×2) |
| tRNA genes | trnA-UGC *(×2), trnC-GCA, trnD-GUC, trnE-UUC, trnF-GAA, trnfM-CAU, trnG-GCC, trnG-UCC *, trnH-GUG(×2), trnI-CAU(×2), trnI-GAU *(×2), trnK-UUU *, trnL-CAA(×2), trnL-UAA *, trnL-UAG, trnM-CAU, trnN-GUU(×2), trnP-UGG, trnQ-UUG, trnR-ACG(×2), trnR-UCU, trnS-GCU, trnS-GGA, trnS-UGA, trnT-GGU, trnT-UGU, trnV-GAC(×2), trnV-UAC *, trnW-CCA, trnY-FUA | |
| Small subunit of ribosome | rps2, rps3, rps4, rps7(×2), rps8, rps11, rps12 **(×2), rps14, rps15, rps16 *, rps18, rps19(×2) | |
| Large subunit of ribosome | rpl2 *(×2), rpl14, rpl16 *, rpl20, rpl22(×2), rpl23(×2), rpl32, rpl33, rpl36 | |
| DNA-dependent RNA polymerase | rpoA, rpoB, rpoC1 *, rpoC2 | |
| Genes for photosynthesis | Subunit of NADH-dehydrogenase | ndhA *, ndhB *(×2), ndhC, ndhD, ndhE, ndhF, ndhG, ndhI, ndhH, ndhJ, hdhK |
| Subunit of Photosystem 1 | psaA, psaB, psaC, psaI, psaJ, ycf3 ** | |
| Subunit of Photosystem 2 | psbA, psbB, psbC, psbD, psbE, psbF, psbH, psbI, psbJ, psbK, psbL, psbM, psbN, psbT | |
| Subunits of cytochrome b/f complex | petA, petB *, petD *, petG, petL, petN | |
| Subunits of ATP synthase | atpA, atpB, atpE, atpF *, atpH, atpI | |
| Large subunit of rubisco | rbcL | |
| Other genes | Maturase | matK, |
| Protease | clpP ** | |
| Envelope membrane protein | cemA | |
| Subunit of Acetyl-CoA-carboxylase | accD | |
| c-type cytochrome synthesis gene | ccsA | |
| Translation initiation factor IF-1 | infA | |
| Genes of unknown function | Open reading frames (ORF, ycf) | ycf1, ycf2(×2), ycf4, lhbA |
* Gene with one intron, ** gene with two introns; (×2) indicates genes duplicated in the IR region.
© 2018 by the authors. Licensee MDPI, Basel, Switzerland. This article is an open access article distributed under the terms and conditions of the Creative Commons Attribution (CC BY) license (http://creativecommons.org/licenses/by/4.0/).
Share and Cite
MDPI and ACS Style
Lu, Q.; Ye, W.; Lu, R.; Xu, W.; Qiu, Y. Phylogenomic and Comparative Analyses of Complete Plastomes of Croomia and Stemona (Stemonaceae). Int. J. Mol. Sci. 2018, 19, 2383. https://doi.org/10.3390/ijms19082383
AMA Style
Lu Q, Ye W, Lu R, Xu W, Qiu Y. Phylogenomic and Comparative Analyses of Complete Plastomes of Croomia and Stemona (Stemonaceae). International Journal of Molecular Sciences. 2018; 19(8):2383. https://doi.org/10.3390/ijms19082383
Chicago/Turabian StyleLu, Qixiang, Wenqing Ye, Ruisen Lu, Wuqin Xu, and Yingxiong Qiu. 2018. "Phylogenomic and Comparative Analyses of Complete Plastomes of Croomia and Stemona (Stemonaceae)" International Journal of Molecular Sciences 19, no. 8: 2383. https://doi.org/10.3390/ijms19082383
Note that from the first issue of 2016, this journal uses article numbers instead of page numbers. See further details here.