Article

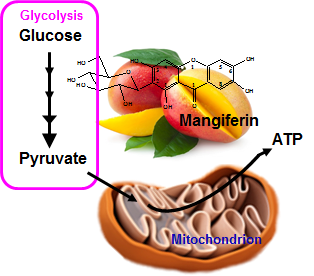
Mangiferin Accelerates Glycolysis and Enhances Mitochondrial Bioenergetics

1
Department of Medicine, Albert Einstein College of Medicine, Bronx, NY 10461, USA
2
Department of Physiology and Biophysics, Albert Einstein College of Medicine, Bronx, NY 10461, USA
3
Einstein Stable Isotope and Metabolomics Core, Albert Einstein College of Medicine, Bronx, NY 10461, USA
4
Department of Molecular Pharmacology, Albert Einstein College of Medicine, Bronx, NY 10461, USA
*
Author to whom correspondence should be addressed.
Int. J. Mol. Sci. 2018, 19(1), 201; https://doi.org/10.3390/ijms19010201
Submission received: 1 December 2017 / Revised: 23 December 2017 / Accepted: 27 December 2017 / Published: 9 January 2018
(This article belongs to the Special Issue Natural and Semi-Synthetic Small Molecules in Drug Discovery)

Abstract

:
One of the main causes of hyperglycemia is inefficient or impaired glucose utilization by skeletal muscle, which can be exacerbated by chronic high caloric intake. Previously, we identified a natural compound, mangiferin (MGF) that improved glucose utilization in high fat diet (HFD)-induced insulin resistant mice. To further identify the molecular mechanisms of MGF action on glucose metabolism, we conducted targeted metabolomics and transcriptomics studies of glycolyic and mitochondrial bioenergetics pathways in skeletal muscle. These data revealed that MGF increased glycolytic metabolites that were further augmented as glycolysis proceeded from the early to the late steps. Consistent with an MGF-stimulation of glycolytic flux there was a concomitant increase in the expression of enzymes catalyzing glycolysis. MGF also increased important metabolites in the tricarboxylic acid (TCA) cycle, such as α-ketoglutarate and fumarate. Interestingly however, there was a reduction in succinate, a metabolite that also feeds into the electron transport chain to produce energy. MGF increased succinate clearance by enhancing the expression and activity of succinate dehydrogenase, leading to increased ATP production. At the transcriptional level, MGF induced mRNAs of mitochondrial genes and their transcriptional factors. Together, these data suggest that MGF upregulates mitochondrial oxidative capacity that likely drives the acceleration of glycolysis flux.

Graphical Abstract

1. Introduction

The hallmark of diabetes is hyperglycemia. One of the main causes of hyperglycemia is inefficient or impaired glucose utilization in skeletal muscle, which can be exacerbated by chronic high caloric intake. Following uptake, glucose metabolism takes place in three pathways, glycogen synthesis, the pentose phosphate shunt and glycolysis. The last one generates pyruvate, a key metabolic branching point at which carbohydrate metabolism either goes through the anaerobic pathway to form lactate or the aerobic pathway to generate energy in mitochondria. While formation of lactate is a relatively fast way for glucose metabolism, the oxidative metabolism in mitochondria produces much more energy and is a more effective pathway to utilize carbohydrate nutrients and eliminate energy storage in form of, for instance, fat.
The oxidative metabolism of carbohydrates in mitochondria is composed of two processes, the tricarboxylic acid (TCA) cycle and the electron transport chain (ETC). Pyruvate enters the TCA cycle mainly via two possible pathways, pyruvate decarboxylation by pyruvate dehydrogenase (PDH) to form acetyl-CoA, whose subsequent metabolites feed into the ETC for mitochondrial respiration to produce energy, or carboxylation by pyruvate carboxylase to form oxaloacetate, which participates in TCA cycle anaplerosis [1,2]. The majority of pyruvate enters the TCA cycle via the irreversible pyruvate decarboxylation by PDH [2]. In addition, there are two other irreversible reactions in the TCA cycle, citrate synthase (CS) catalyzed formation of citrate from acetyl-CoA and α-ketoglutarate dehydrogenase (α-KGDH) catalyzed formation of succinyl-CoA from α-KG. Based on the reversibility of catabolic reactions, the TCA cycle is thought to operate in two sequential segments, the first being from acetyl-CoA until α-KG and the second being from α-KG to oxaloacetate [3].
Impaired glycolysis and mitochondrial bioenergetics have been reported under pathological conditions such as obesity and diabetes [4]. Previous studies have identified several enzymatic steps that are dysregulated in diabetes in vivo or under hyperglycemic conditions in vitro. In particular, phosphofructose kinase (PFK) and glyceraldehyde 3-phosphate dehydrogenase (GAPDH) are down-regulated in terms of both expression and activity [5,6,7,8,9,10,11,12]. Significantly reduced resting metabolic flux through the TCA cycle and oxidative phosphorylation were reported in skeletal muscle of patients with type 2 diabetes and insulin resistant offspring of type 2 diabetic patients [13,14,15]. Reduced metabolites in the TCA cycle were also reported in high fat diet (HFD)-fed mice [2,16]. In parallel with reduced metabolic flux, mitochondrial DNA (mtDNA) and the transcription of mitochondrial genes are also suppressed in skeletal muscle in insulin-resistant individuals [17,18]. It has been proposed that correction of impaired catalytic steps in glycolysis and mitochondrial bioenergetics could mitigate hyperglycemia. Thus, there has been great interest in identifying mechanisms that increase glycolysis and mitochondrial bioenergetics, and based on such mechanisms identifying nutraceuticals/pharmaceuticals that can improve glucose homeostasis.
MGF is a C-glucosyl xanthone (C2-β-d-glucopyranosyl-1,3,6,7-tetrahydroxyxanthone) that is a predominant constituent in extracts of the mango plant Mangifera indica L. Recently, we reported that MGF can enhance insulin sensitivity and mitigate glucose intolerance in HFD-induced insulin resistant mice [19]. In addition, MGF enhanced glucose oxidation both in cultured C2C12 myotubes and, particularly interestingly, in skeletal muscle isolated from obese and insulin resistant mice induced by HFD feeding. We have also demonstrated that MGF activates PDH, which presumably directs glucose metabolism to the mitochondrial oxidative processes. However, detailed information on how MGF affects each step of glycolysis and mitochondrial oxidative metabolism remains unknown. In this study, we investigated the molecular mechanisms responsible for the metabolic beneficial effects of MGF by using targeted metabolomics and transcriptomics.

2. Results

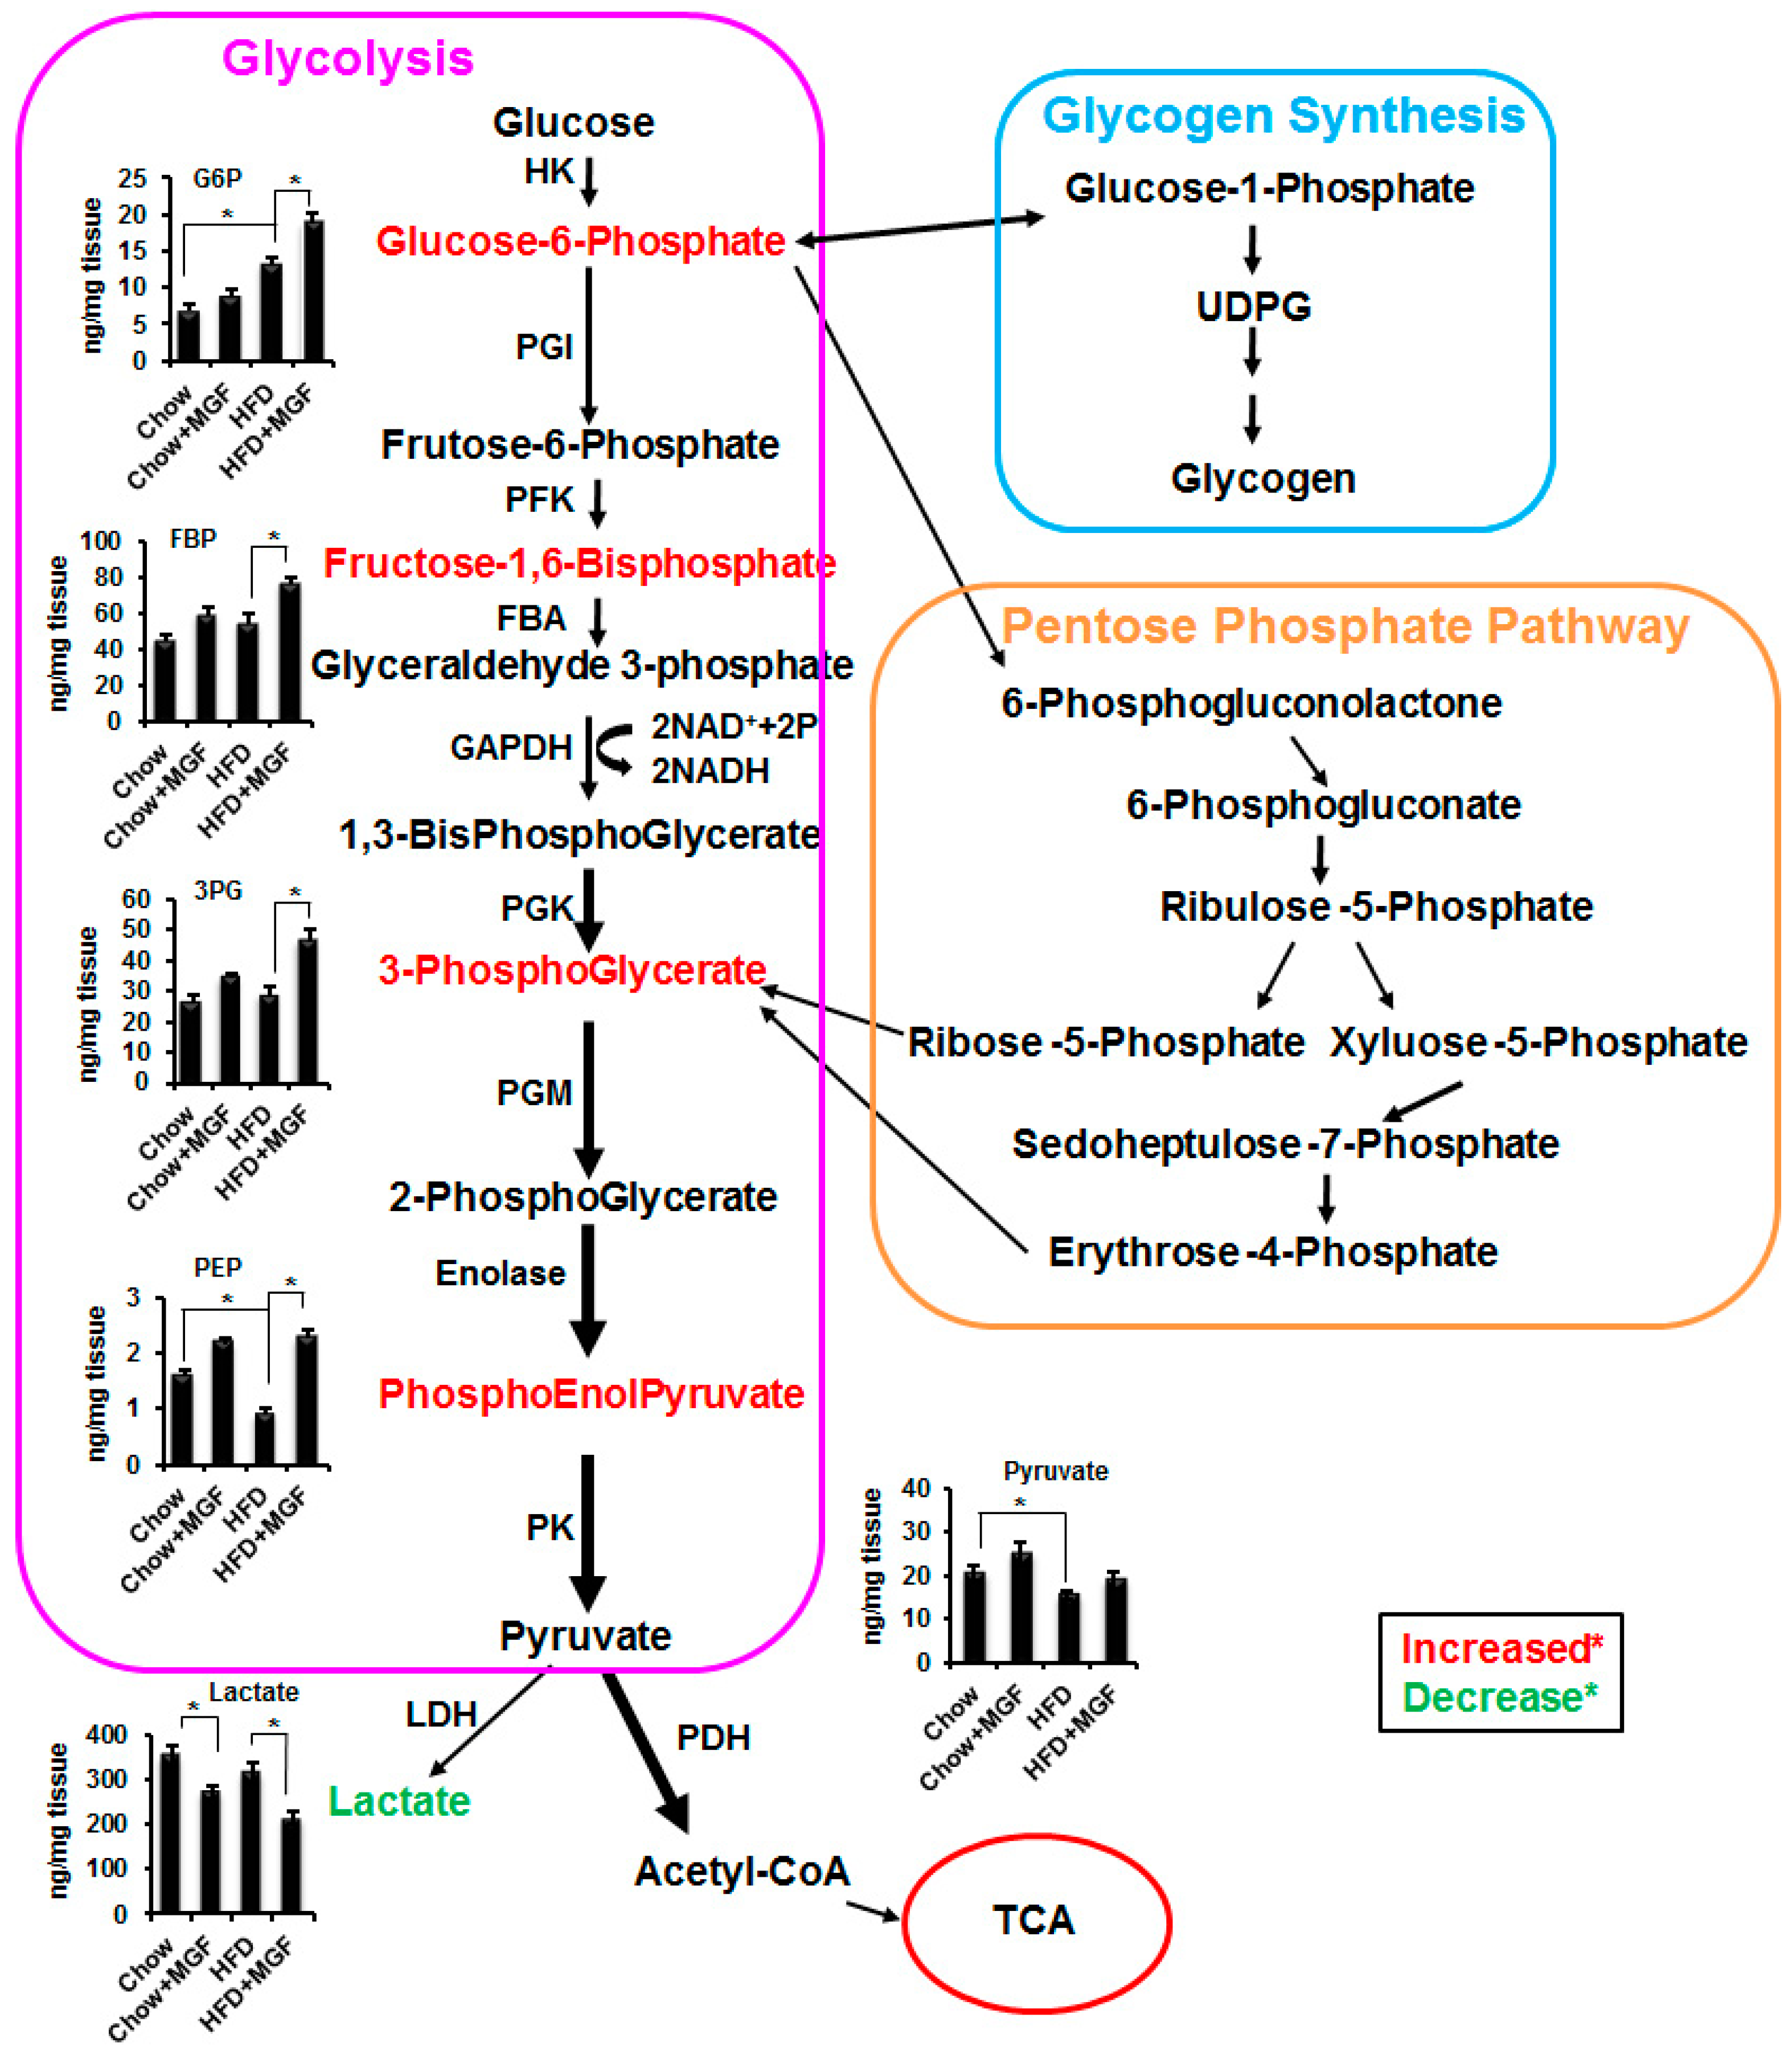
2.1. Profiling of Metabolites in Glucose Metabolism

In our previous study, we found that MGF orally administered to mice on HFD was able to reduce plasma glucose and insulin levels [19]. We also found that MGF enhanced carbohydrate oxidation in skeletal muscle of mice fed either chow or HFD [19]. Thus, we proposed that the MGF’s abilities of sensitizing insulin signaling and lowering glucose is, at least partially, due to MGF enhanced oxidative utilization of glucose in skeletal muscle. The processes of oxidative utilization of carbohydrates include glycolysis, and subsequent entry into the TCA cycle and the ETC. To understand how MGF affected these metabolic processes, we isolated quadriceps skeletal muscle from mice maintained on a normal low fat or HFD and were treated with or without MGF for 16 weeks, as previous reported [19] and analyzed metabolites in those skeletal muscle tissues.
Quantitative targeted metabolomics of several metabolic intermediates are listed in Table 1. Among all metabolites listed in Table 1, HFD significantly increased one metabolite, glucose-6-phosphate. Conversely, it significantly reduced several other metabolites in the glycolysis and the TCA cycle including phosphoenolpyruvate (PEP), pyruvate, α-KG, succinate, fumarate and aspartate. Overall MGF significantly affected more metabolites in HFD-fed mice than in chow fed mice.

2.2. MGF Accelerates Glycolysis

2.2.1. MGF Increases Glucose Metabolism via Glycolysis

To more clearly demonstrate the effects of MGF in the context of metabolic pathways, we present significantly altered metabolites in bar graphs in the pathways (Figure 1). The first metabolite of glucose is glucose-6-phosphate, which can be metabolized by three pathways, glycogen synthesis, the pentose phosphate shunt, and glycolysis. Urindine diphosphate glucose (UDPG) is the product of glucose-6-phosphate and precursor of glycogen. MGF did not significantly affect UDPG in either chow or HFD-fed mice (Table 1), suggesting that MGF probably did not affect glycogen synthesis pathway (Figure 1). As to the pentose phosphate shunt, MGF did not significantly affect 6-phosphogluconate (an important intermediate metabolite), nor ribose-5-phosphate (an important terminal metabolite) (Table 1), suggesting that MGF probably did not exert any significant effects on this pathway (Figure 1). In contrast, MGF increased glucose 6-phosphate, F-1,6-bisphosphate, 3-phosphoglycerate and PEP in chow and/or HFD-fed mice. The magnitude of these differences became greater, i.e., the ratios (MGF/Ctl) increased, as glycolysis proceeded from the early steps to the late steps, indicating that MGF accelerated metabolic flux via the glycolysis pathway. The effects are more significant and profound in HFD-fed mice than in chow mice (Table 1, Figure 1).

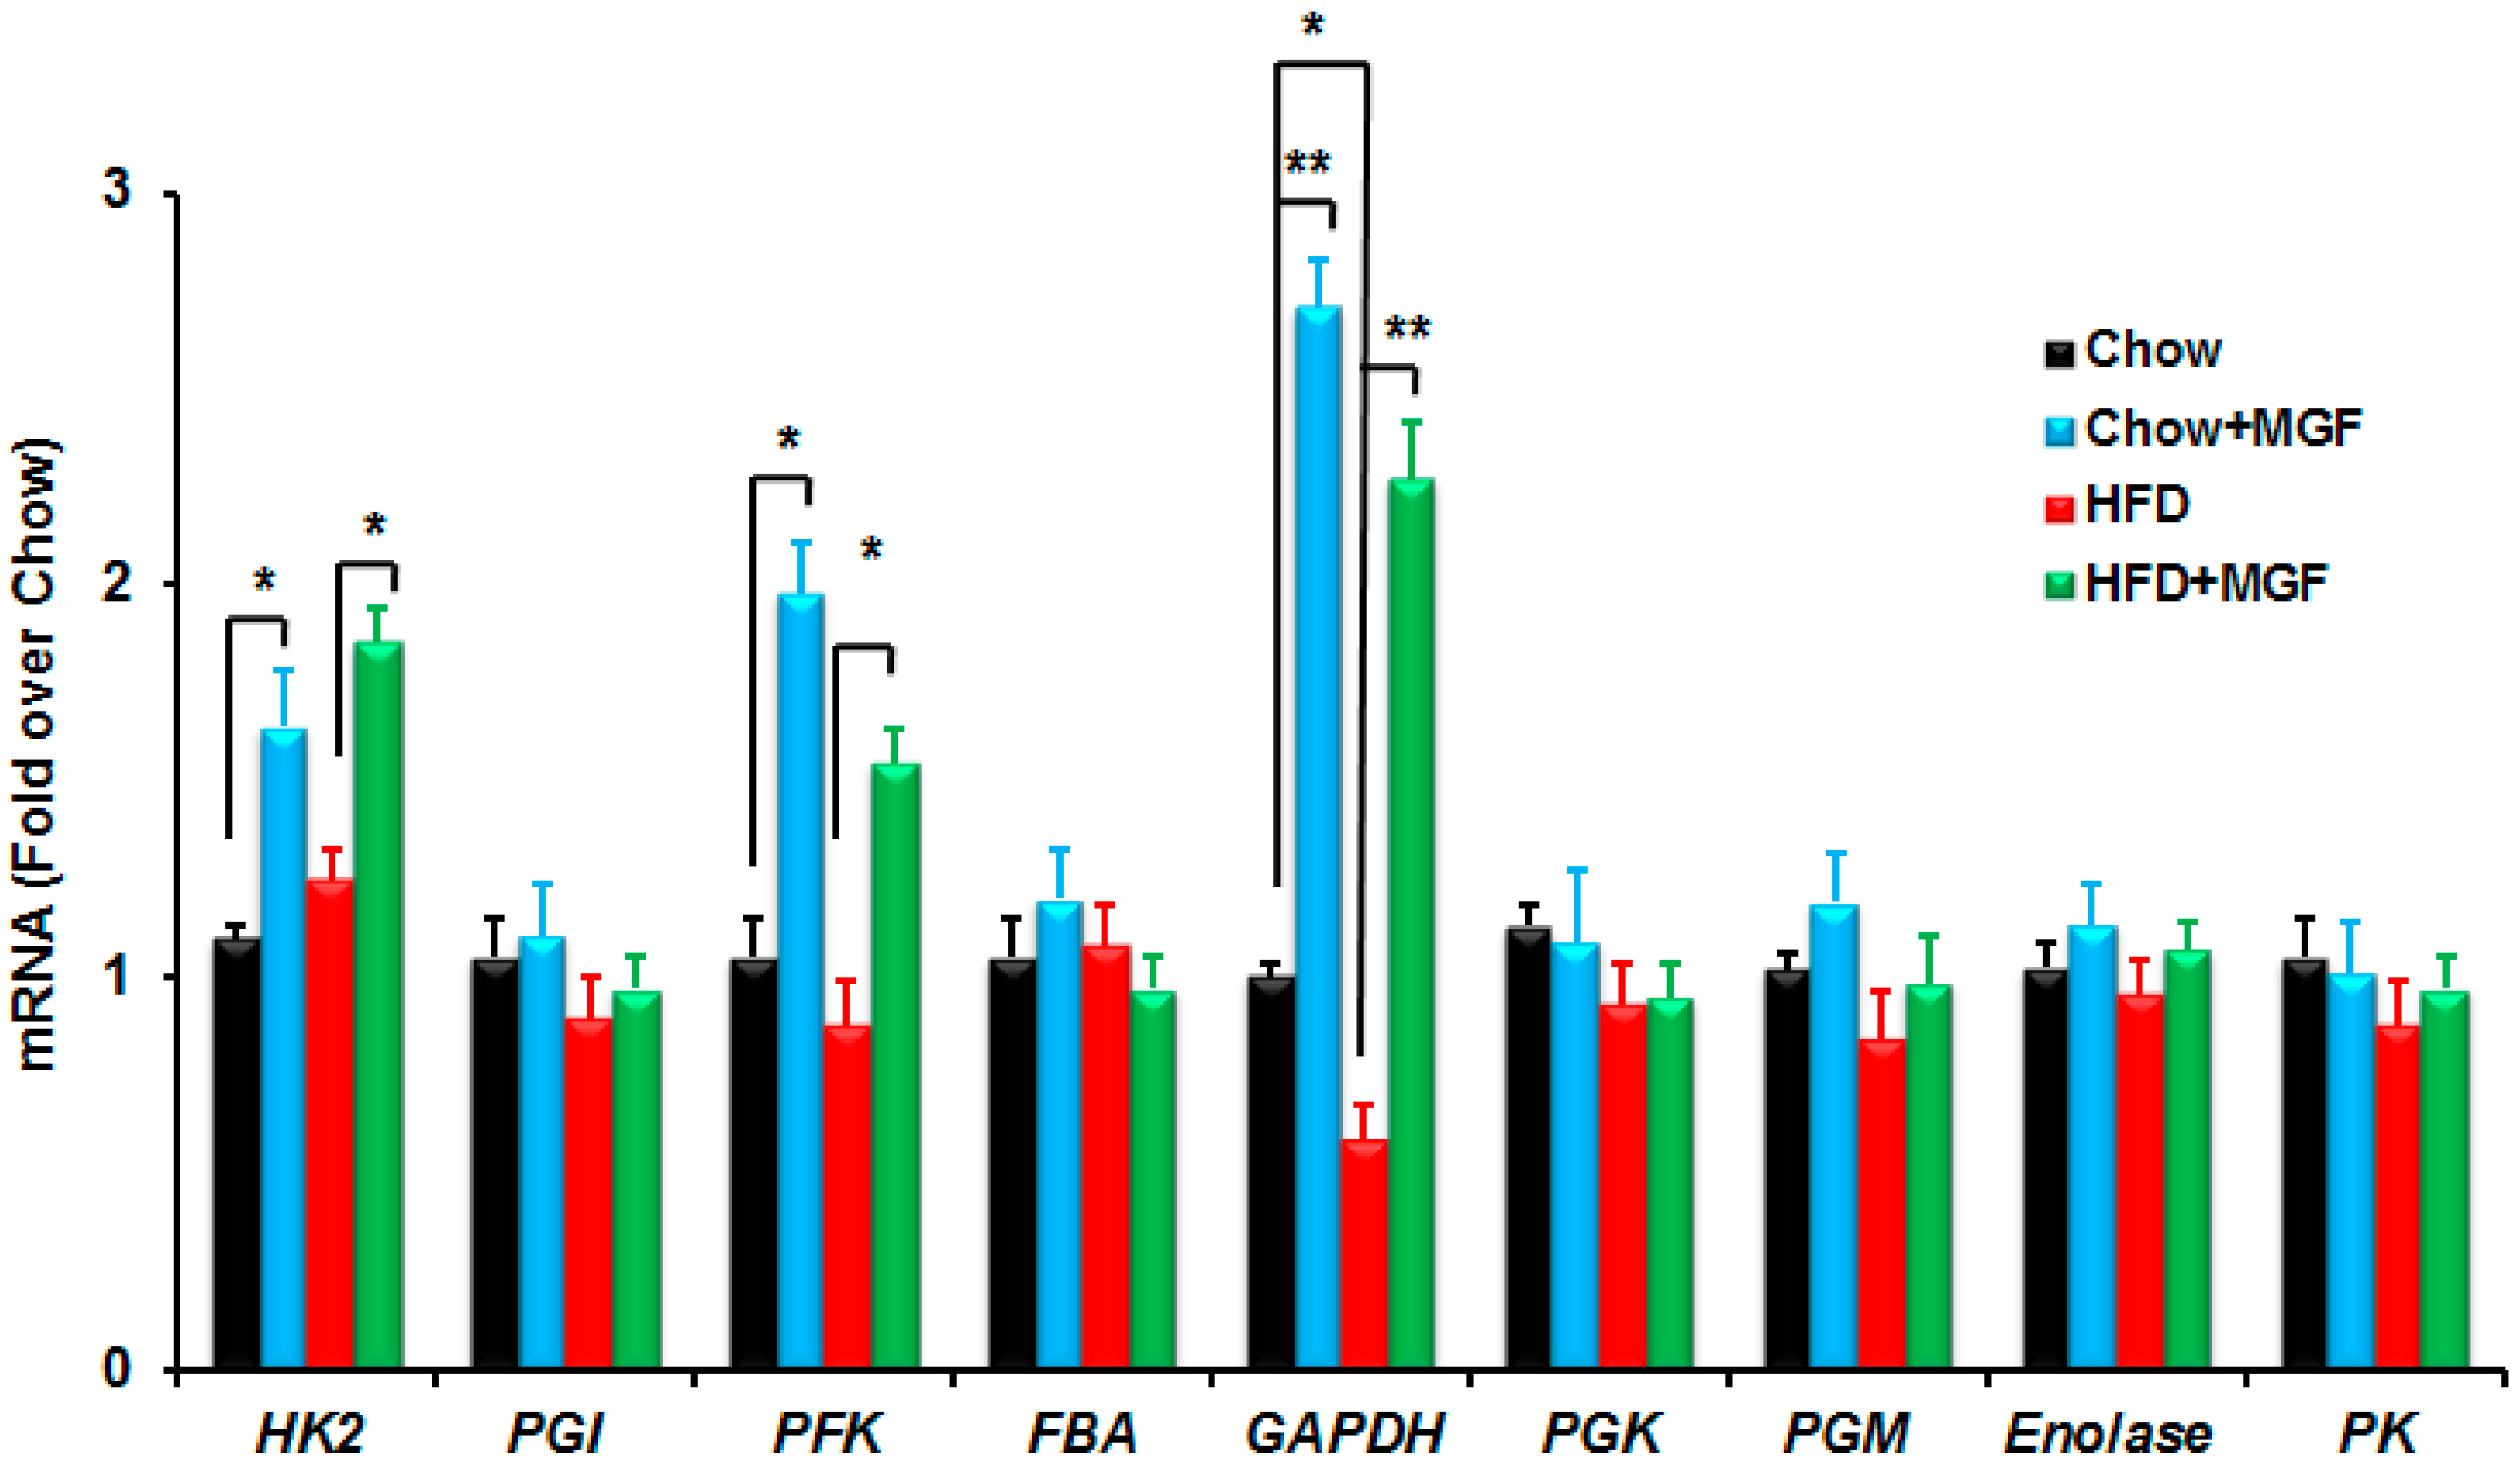
2.2.2. MGF Induces Some Enzymes in Glycolysis

To further understand how MGF might alter the metabolites in glycolysis, we profiled mRNAs of those enzymes in muscle tissues from those chow or HFD-fed mice treated with or without MGF. HFD significantly reduced the mRNA of GAPDH, whereas HFD had no significant effect on the other glycolytic enzyme mRNAs examined (Figure 2). However, MGF treatment induced the mRNAs of three enzymes, HK, PFK, and GAPDH, in both chow and HFD-fed mice. Among these enzymes GAPDH is the one on which MGF exerted the greatest effect (Figure 2).

2.3. MGF Enhances Mitochondrial Bioenergetics

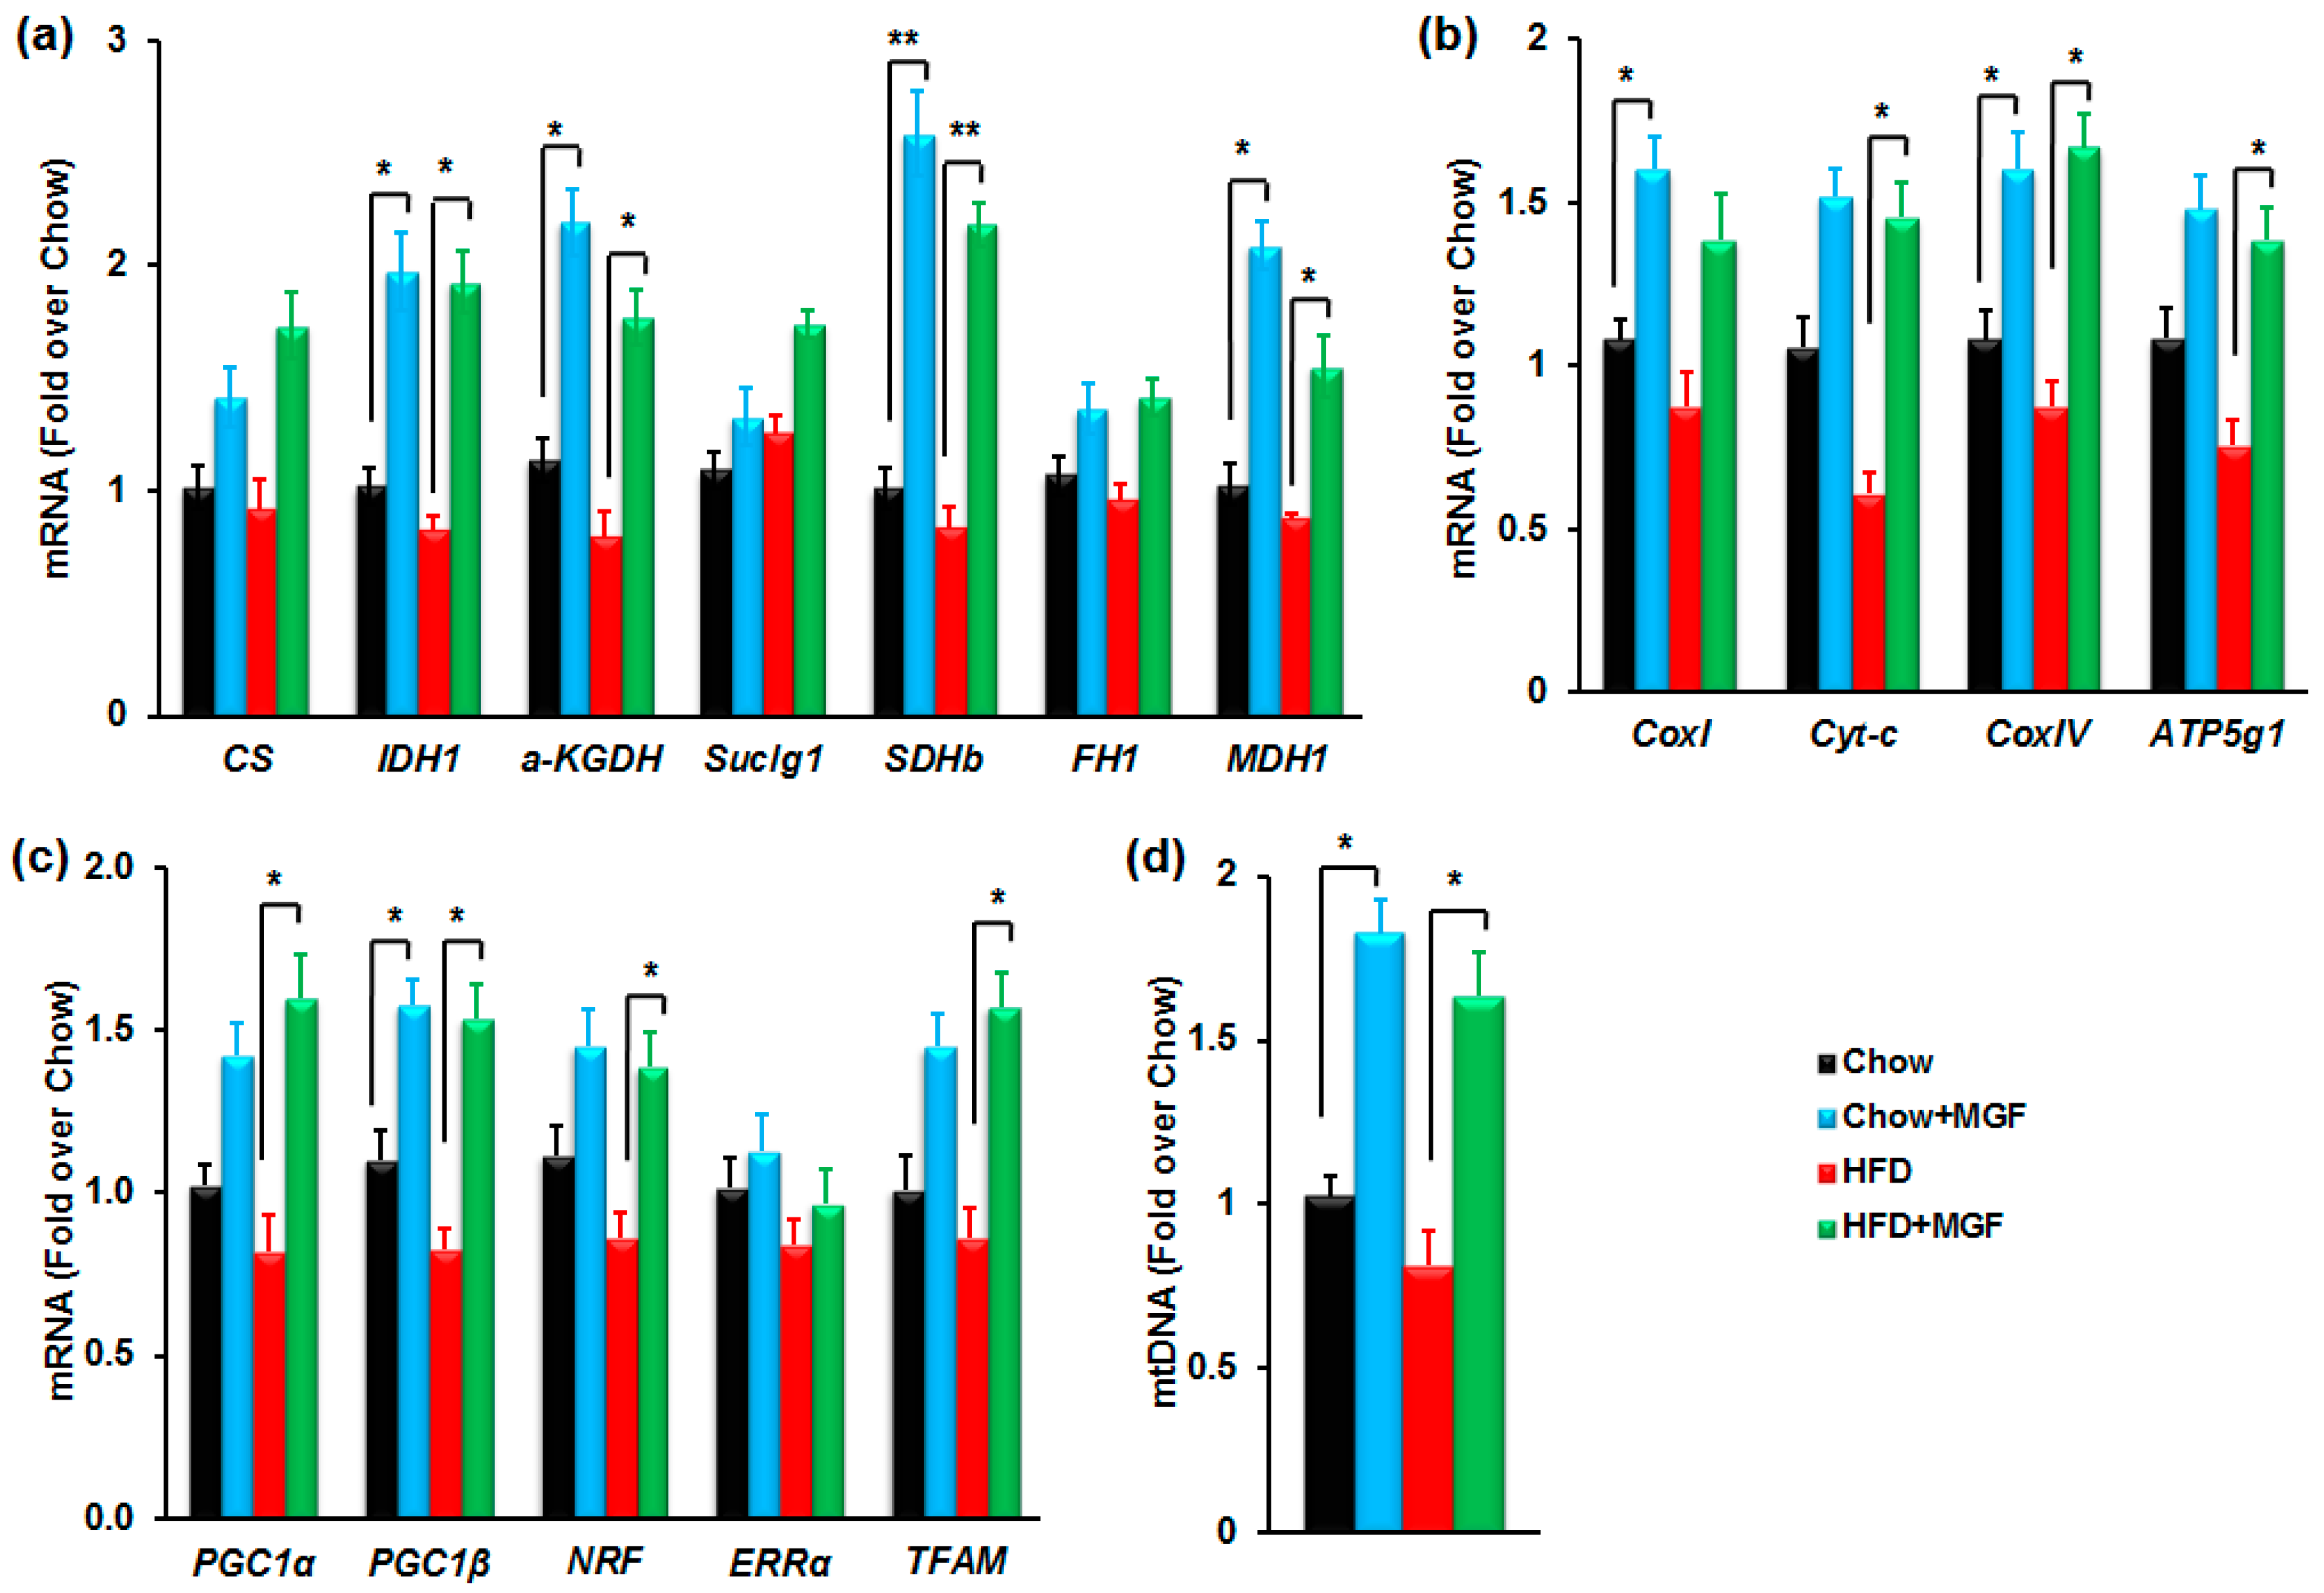
2.3.1. MGF Enhances Metabolism in the TCA Cycle

Accelerated glycolysis by itself would lead to an increase in the end product, pyruvate. However, there was no significant increase in pyruvate levels in the MGF treated mice, suggesting a more rapid clearance of pyruvate. Pyruvate can be catabolized to several products via different pathways. Pyruvate can be converted to lactate by lactate dehydrogenase (LDH) via the anaerobic pathway or enter the TCA cycle to be metabolized via the aerobic pathway. Figure 1 shows that there is significantly less lactate produced in MGF treated mice, suggesting that the MGF-increased clearance of pyruvate was not via the anaerobic pathway in the cytosol, but rather via the TCA cycle occurring in mitochondria.
In mitochondria, the majority of pyruvate is catabolized to acetyl CoA by PDH [2]. Acetyl CoA is then further metabolized to α-KG, which is a marker of the TCA flux during the first segment. We have previously reported that MGF activates PDH [19], and therefore we hypothesized that MGF accelerated the first segment of the TCA cycle. Indeed, MGF significantly increased α-KG, by about 150% in chow mice and by 220% in HFD muscle (Table 1, Figure 3). Interestingly, MGF elevated α-KG did not result in any increase in the subsequent metabolite of α-KG, succinate. Rather, MGF significantly reduced succinate by about 40% in chow and HFD muscles. On the other hand, MGF significantly increased fumarate formed from succinate by SDH by 138% in chow mice and by 151% in HFD muscle (Table 1, Figure 3). Fumarate is in rapid exchange with other four-carbon intermediates, malate and oxaloacetate, which can be reversibly converted to aspartate. MGF increased all these metabolites in the second segment of the TCA cycle, albeit some increases were insignificant.

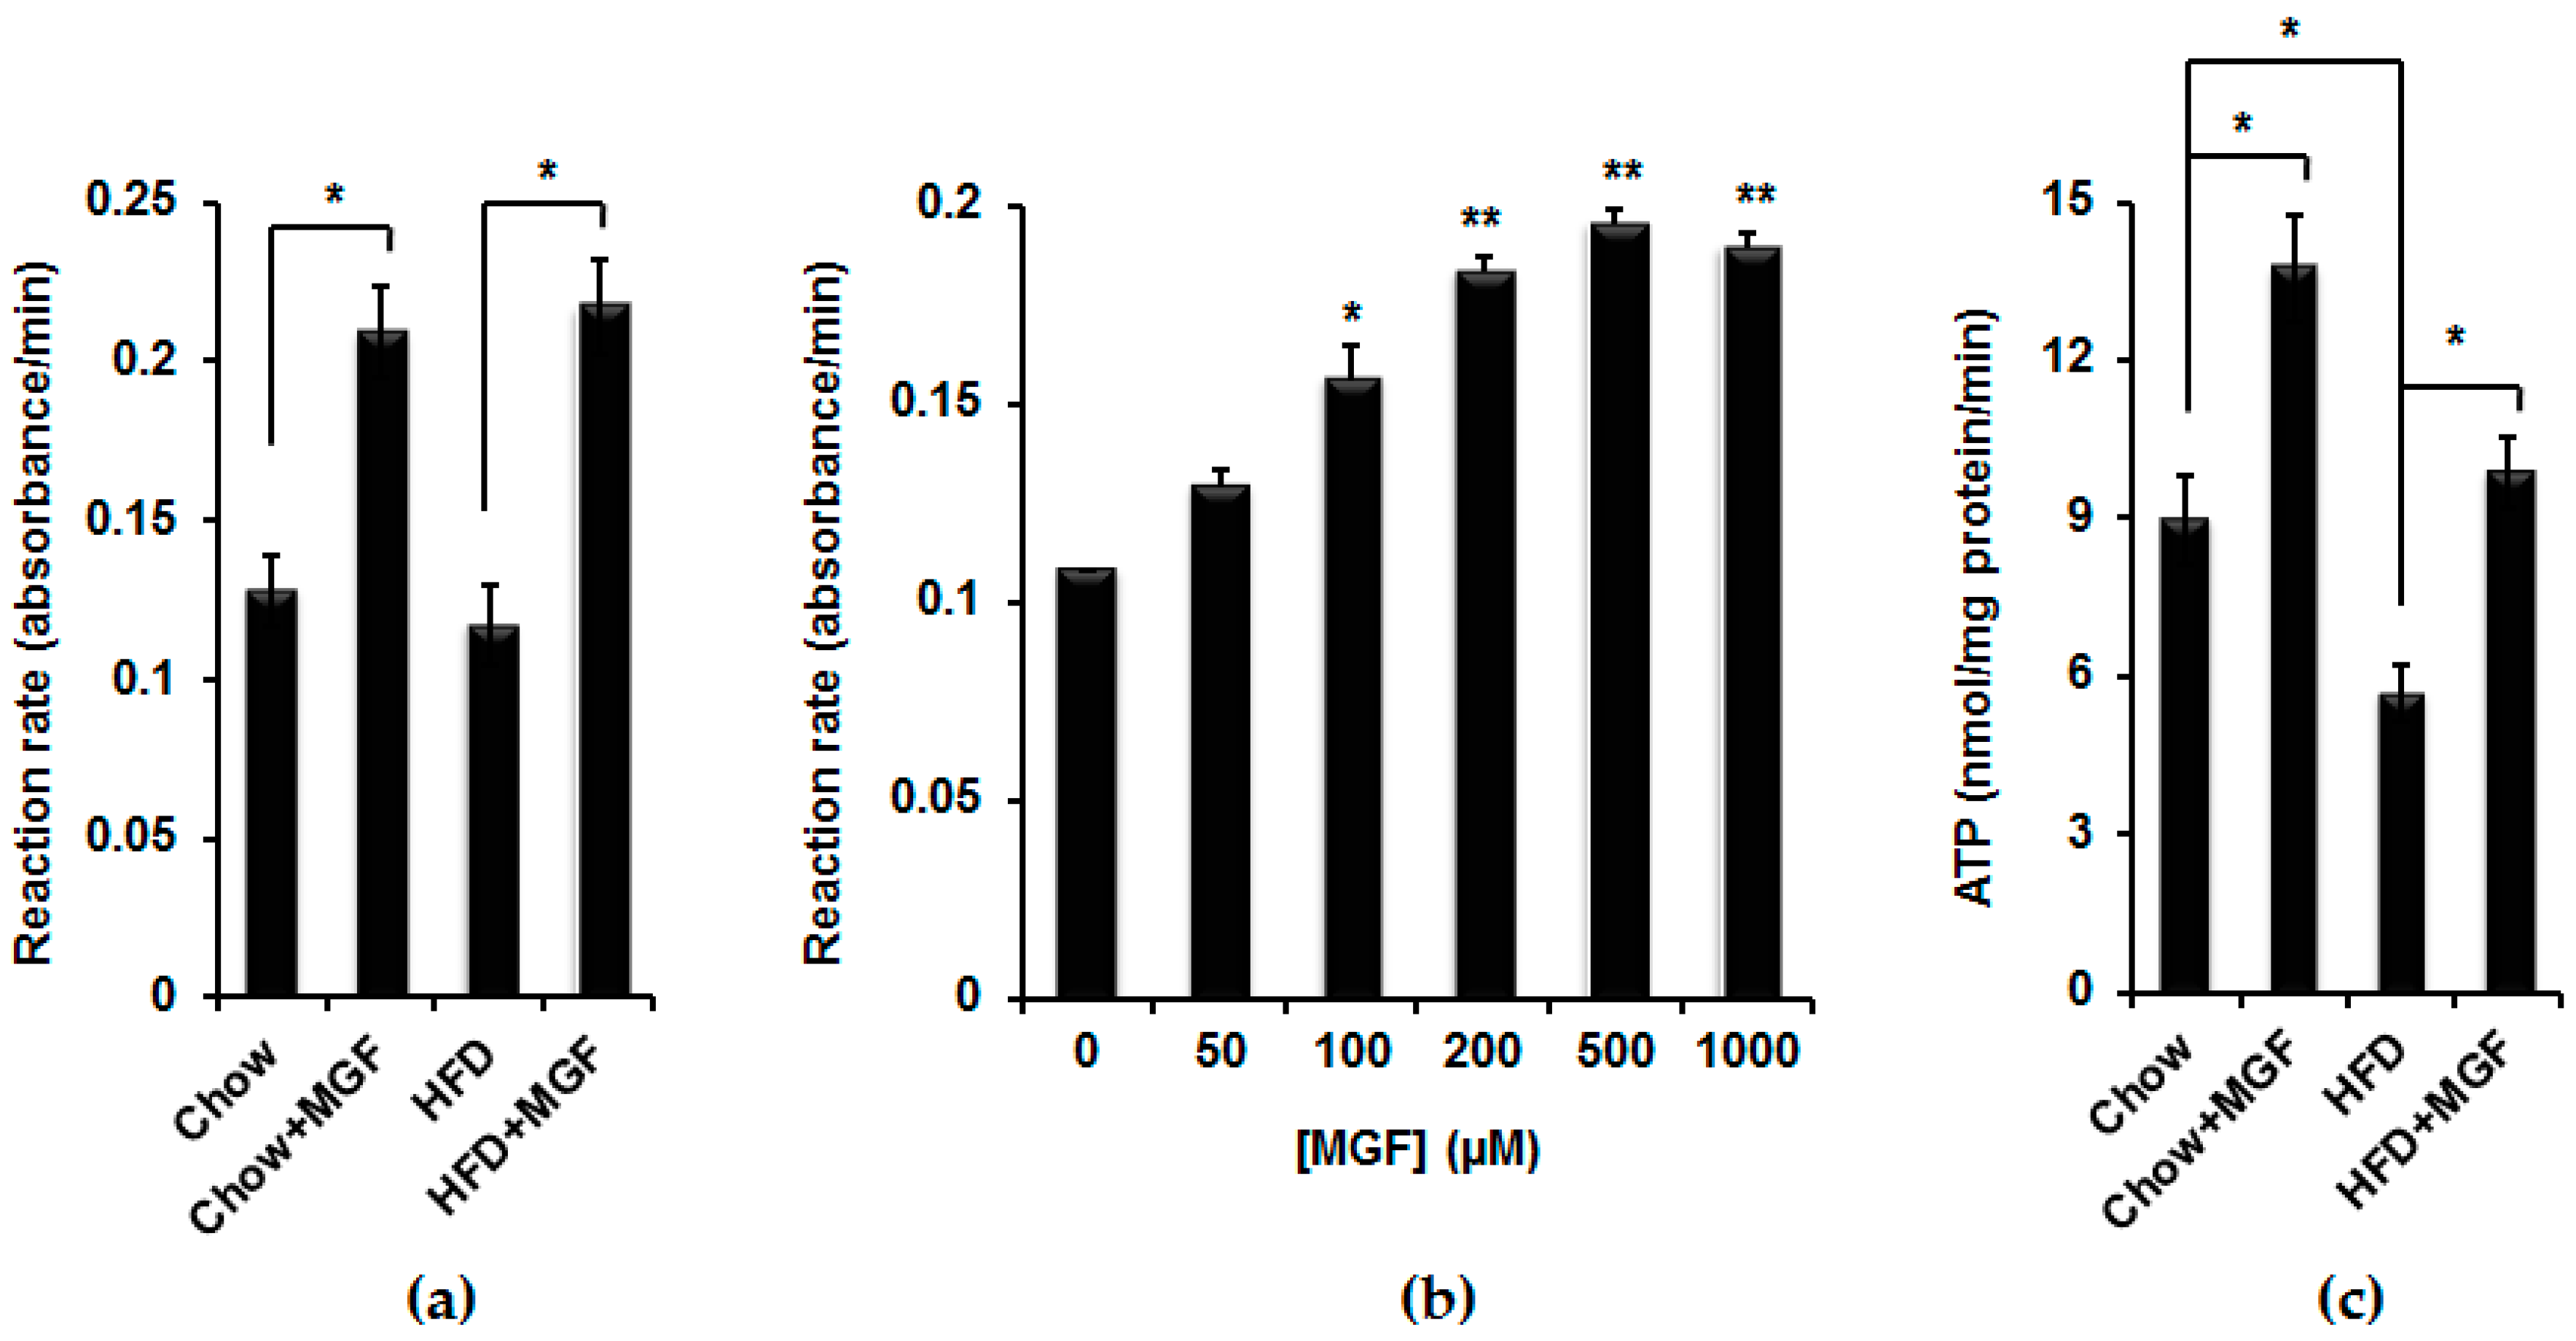
2.3.2. MGF Enhances SDH Activity and Overall Energy Production in Mitochondria

Succinate is an intermediate between α-KG and fumarate that were both increased, suggesting that the decrease in succinate levels was due to enhanced succinate consumption. MGF significantly increased the activity of SDH in mitochondrial isolated from quadriceps by 63% and 86% in mice fed with chow and HFD, respectively (Figure 4a). To confirm these in vivo effects, we treated C2C12 myotubes with various concentrations of MGF for about 4 h and isolated mitochondria from those cells and measured SDH activity. MGF also significantly increased SDH activity in those cells in a dose-dependent manner (Figure 4b).
Among the metabolites in the TCA cycle, succinate is the only one that enters the ETC to participate in a chain of oxidative reactions to ultimately produce energy, ATP. SDH is also the mitochondrial complex II in the ETC. SDH activity is a marker of mitochondrial oxidative capacity and positively related to energy production [20]. Thus, we measured ATP production in freshly isolated mitochondria from snap frozen quadriceps. HFD significantly reduced ATP production (Figure 4c). MGF significantly increased ATP production by about 150% in chow mice. Moreover, MGF reversed the reduction in ATP in HFD mice and increased the level of ATP slightly higher than that in chow control mice.

2.3.3. MGF Induces Mitochondrial Biogenesis

To investigate whether MGF has any effects on the expressions of mitochondrial genes, we profiled mRNAs of all enzymes in the TCA cycle and the ETC from the quadriceps skeletal muscle. HFD feeding caused reduction in most of mitochondrial genes, although most of these changes did not reach statistical significance (Figure 5a,b). On the other hand, MGF significantly induced several genes in the TCA cycle and the ETC in chow and/or HFD-fed mice (Figure 5a,b). These genes included IDH, αKGDH, SDH, CoxI, Cyt-c, COXIV and ATP5g1. The greatest effects occur in SDH, which could be a factor contributing MGF enhanced catabolism of succinate to fumarate.
Mitochondrial genes are tightly regulated by several transcription factors including transcriptional factor A (TFAM), nuclear respiratory factor 1 (NRF1) and estrogen-related receptor α (ERRα), and the co-factors of these transcriptional factors, peroxisome proliferator-activated receptor-γ coactivator (PGC)-1α and PGC-1β [21,22,23,24,25,26]. MGF significantly increased all of those transcriptional factors, except ERRα, in chow or HFD-fed mice (Figure 5c), indicating that MGF upregulates those enzymes in the TCA cycle and the ETC at the transcriptional level. PGC-1α is positively correlated to mtDNA. Therefore, we measured mtDNA contents in mitochondria isolated from those muscle tissues. MGF almost doubled mtDNA in both chow and HFD-fed mice (Figure 5d). Together, these results indicate that MGF induces mitochondrial biogenesis.

3. Discussion

Obese, insulin resistant and diabetic patients display impaired glycolysis and dysfunctional mitochondrial oxidation [4,13,14,15,17,18], which are major contributors to impaired glucose disposal/utilization and hence to hyperglycemia. Pharmaceutical and/or nutraceutical agents that can improve glycolysis and mitochondrial oxidative capacity have the potential for therapeutic value in treating diet induced obesity and insulin resistance. Using a HFD mouse model of obesity and insulin resistance, we previously identified a natural compound, MGF, that was able to correct HFD induced glucose intolerance and insulin resistance by enhancing glucose utilization [19]. Using metabolite and transcriptomic profiling we have found that MGF gradually increased metabolic flux in glycolysis, which was facilitated by MGF induced enzymes in glycolysis. In mitochondria, MGF directs pyruvate metabolism in sequence from the first segment to the second. In such manner MGF enhances oxidative metabolism, resulting in increased production of energy, ATP. MGF does so by upregulating transcription of mitochondrial genes and enhancing the activity of SDH.
Glucose-6-phosphate is the first metabolite in glucose metabolism. HFD feeding almost doubled glucose-6-phosphate probably due to HFD blunted metabolism at the subsequent metabolic steps, as there was gradually augmented reduction in metabolites from the early steps to the later. Near the end of glycolysis, HFD caused significant reduction in PEP and pyruvate (Table 1, Figure 1). On the contrary, MGF gradually and significantly increased metabolites and the increases were augmented from the early steps to the later (Table 1, Figure 1). These results indicate that MGF is able to counteract the inhibitory effects of HFD on glycolysis.
The conversion of glucose to glucose-6-phosphate is catalyzed by HK. Previously Sellamuthu et al. [27] showed that MGF increased HK activity in liver of streptozotocin induced diabetic rats. Here we show that MGF induces HK expression in muscle of both chow and HFD-fed mice (Figure 2). In glycolysis, glucose-6-phosphate is subsequently converted to fructose-1,6-bisphosphate by PFK. While the effects of HFD on the activity of PFK is uncertain [28,29,30], diabetes reduces the expression and activity of PFK [31]. Deficiency in PFK is associated with impaired insulin secretion and insulin resistance in human [5,6,8,32]. MGF induces PFK (Figure 2) and therefore has the possible capability of mitigating PFK deficiency in diabetes. MGF also significantly induced the mRNA of GAPDH, which is a key enzyme in the glycolytic conversion of glucose to pyruvate and has been considered to play a regulatory role in setting the glycolytic rate [33,34]. The reports on the effects of HFD feeding on expression of GAPDH are inconsistent probably due to tissue specificity [35,36,37]. Here we show that HFD significantly reduced GAPDH mRNA in skeletal muscle (Figure 2). More importantly, MGF treatment caused more than 2-fold induction in mRNA of GAPDH in both chow and HFD-fed mice (Figure 2).
The end product of glycolysis is pyruvate, which can be converted to lactate via the anaerobic process or enter mitochondria to be metabolized by the aerobic process. While HFD did not cause significant change in lactate, it significantly reduced several key metabolites in the TCA cycle (Table 1, Figure 3), which was also reported by others [2,16]. MGF modulated those metabolites in a biologically important manner. Pyruvate is converted from PEP by PK. MGF increased PEP, but did not suppress PK. One would expect that there could be similar magnitude of increase in pyruvate in MGF treated mice. However, MGF only caused mild and insignificant increase in pyruvate, suggesting that MGF probably enhanced pyruvate consumption, either by increasing lactate production or by enhancing oxidative metabolic flux in the TCA cycle. MGF significantly reduced lactate in muscle tissues of both chow and HFD-fed mice (Table 1, Figure 1), which recapitulates the effects of MGF on lactate in cultured C2C12 myotubes shown in our previous study [19]. We further demonstrated that MGF reduced lactate production not by inhibiting pyruvate carboxylase (lactate dehydrogenase), but by enhancing PDH activity, shuttling pyruvate to mitochondria. In mitochondria PDH catalyzes the irreversible conversion of pyruvate to acetyl-CoA, which will be irreversibly converted to citrate by citrate synthase (CS). These unidirectional reactions make commitment to the flow of the TCA cycle to produce the end product of the first segment of the TCA cycle, α-KG. The fact that MGF increased α-KG, as shown in this study (Table 1, Figure 3), confirms that MGF enhances PDH and accelerates the metabolism in the first segment of the TCA cycle. This enhancement is also supported by MGF increased CS and, more significantly, IDH (Figure 5a).
Subsequently, α-KG is irreversibly converted to succinyl-CoA by α-KGDH. MGF significantly increased α-KGDH, presumably increasing succinyl-CoA, the starting point of the second segment of the TCA cycle, leading to the production of oxaloacetate. All of the reactions in the second segment of the TCA cycle are reversible and some of the metabolites are in rapid exchange with each other. MGF increased most metabolites in the second segment of the TCA cycle, except succinate. Succinate is a unique metabolite. It is the only metabolite in the TCA cycle that also feeds in the ETC and participates in oxidative phosphorylation. Accumulation of succinate is a marker of anaerobic metabolism [3]. MGF significantly reduced succinate, which supports the idea that MGF enhances oxidative metabolism.
MGF eliminates succinate probably by enhancing SDH, as MGF upregulates SDH at both the expression and the activity levels (Figure 4a,b and Figure 5a). SDH is the only enzyme that is a component of both the TCA cycle and the ETC. In the ETC, it is named complex II. SDH catalyzes the oxidation of succinate to fumarate and uses the electrons derived from this oxidation to catalyze the reduction of ubiquinione to ubiquinol. These electrons are passed to complex III and then complex IV, thereby contributing to the establishment of the electrochemical gradient across the mitochondria inner membrane for ATP synthesis [38]. Among all mitochondrial complexes, complex II loses activity most rapidly after death and on inappropriate storage, and therefore its activity is considered as a marker of the integrity of the tissue and the reliability of respiratory chain enzymology [20]. Mutation of SDH gene results in mitochondrial respiratory chain deficiency [39]. Reduced SDH expression and activity were reported in obese and diabetic patients [18]. Here we show that MGF upregulates SHD at both expression and activity levels in quadriceps of not only wild type mice but also, importantly, in obese and insulin resistant mice (Figure 4a,b and Figure 5a). MGF was also shown to enhance SDH activity in soleus and tibialis of obese rats, and to increase SDH activity in heart of experimentally induced myocardial infarcted rats [40,41].
The effects of MGF on mitochondria are not limited to SDH. In addition to SDH, MGF was shown to increase the activities of other important enzymes in the TCA cycle and the ETC, including α-KGDH, MDH and cytochrome c [41]. At the expression level, here we found that MGF induced mRNAs of most enzymes in the TCA cycle and the ETC (Figure 5a,b). Furthermore, MGF induced several important mitochondrial transcriptional factors and their co-factors including TFAM, NRF1, PGC-1α and PGC-1β (Figure 5c), as well as increasing mitochondrial DNA content (Figure 5d). Taking together, these results indicate that MGF enhanced overall mitochondrial oxidative capacity, which probably drives the accelerated metabolic flux in glycolysis (Figure 1).
In addition to accelerating glycolysis, MGF has been shown to reduce glucose 6-phosphate and fructose bisphosphatase and therefore inhibit gluconeogenesis [27]. These effects, together, suggest that MGF could be an effective anti-hyperglycemia and anti-diabetes agent. Furthermore, we and others have shown that MGF has anti-hyperlipidemia effects in rodents [19,42,43,44,45,46,47], and impressively in humans [48]. As a natural compound, MGF has been shown to uniquely possess multi-beneficial effects in mitigating metabolic disorders. The drawback is that it has very low bioavailability (1.2%) [49,50,51] and therefore the dose required for MGF to exert significant effects is high. Nevertheless, the structural features of MGF allow chemical modifications and MGF has the potential to be developed into an effective nutraceutical/pharmaceutical for the treatment of complex metabolic syndrome.

4. Materials and Methods

Chemical reagents were purchased from Sigma-Aldrich (St. Louis, MO, USA) unless specified.

4.1. Cell Culture

C2C12 myoblast cells were maintained in DMEM High Glucose (Hyclone, Logan, UT, USA), supplemented with 1% penicillin and streptomycin (GIBCO, Carlsbad, CA, USA) and 10% FBS. C2C12 cells were differentiated into myotubes in the above DMEM medium containing 2% horse serum (replacing 10% FBS) for 4–6 days after cells reached confluence.

4.2. Animal Experiments

Wild type C57BL6/J mice at age of 5–6 weeks were purchased from Jackson laboratory (Bar Harbor, ME, USA). All studies were approved by and performed in compliance with the guidelines of the Einstein Institutional Animal Care and Use Committee. Chow diet (CD) (providing 28.5% (Kcal) protein, 13.5% fat and 58% carbohydrates) was obtained from Purina LabDiet, Framingham, MA, USA. HFD (providing 20% (Kcal) protein, 60% fat and 20% carbohydrates) was obtained from Research Diets, New Brunswick, NJ, USA. MGF was obtained from CTMedChem (Bronx, NY, USA) and administered orally via food. CD and HFD were ground into fine powder and mixed with pure MGF. The mixtures were re-pelleted and administered to individually housed mice. Mice were fed ad libitum with CD or HFD ± MGF (MGF dose, 400 mg/kg body weight) and water for 16 weeks. Mice were then sacrificed after 12-h fasting from 10 p.m. to 10 a.m. Quadriceps were collected, snap frozen in liquid N2 and stored at −80 °C.

4.3. Metabolite Profiling

Metabolite profiling was conducted at the Einstein Stable Isotope & Metabolomics Core. There are two main processes. One is sample preparation and the other is LC/MS/MS analysis. Tissue samples were homogenized with a mixture of methanol, acetonitrile and water (methanol:acetonitrile:water = 2:2:1 (v:v:v)) with tissue factor of 6 (to tissue weight). Internal standard (1.8 µg of UC13-succinate) was spiked to each sample before extraction. The samples were homogenized and centrifuged. The supernatant was transferred to a glass tube for lyophilization. The residue was reconstituted in 265 µL of 5 mM ammonium fumarate in acetonitrile solution (acetonitrile:water = 6:4 (v:v)).
LC/MS/MS (Waters Xevo TQ) analysis was performed to quantitate metabolites using similar method described previously [52]. Chromatographic analysis, prior to targeted and multiple reaction monitoring (MRM) mass spectrometric analyses, was performed using an Aquity UPLC using a Waters BEH amide 1.7 µm column 2.1 × 100 mm, and an acidic mobile phase containing an acetonitrile/water gradient, as per [52]. Samples were bracketed in between calibration standards and linear regression was performed for quantitation.

4.4. mRNA Measurement by Real Time qRT-PCR

Total RNA from muscle tissues was extracted with Trizol. One µg of total RNA was used to synthesize cDNA with Reverse Transcriptase and OligodT from Invitrogen (18080051, Carlsbad, CA, USA). Real time PCR using the Sybrgreen master mix (Applied Biosystems, Foster City, CA, USA) was performed by a 7900HT PCR machine from Applied Biosystems. The level of mRNA was calculated versus β-actin transcript and expressed as fold over control. All primers used for real time qRT-PCR are listed in Table 2.

4.5. Mitochondria Isolation

Mitochondria were isolated from muscle tissues using previously described method [53,54] with modified buffer (250 mM sucrose, 1 mM EGTA, 10 mM HEPES, and 5 g/L BSA, pH 7.5). Mitochondrial pellets were suspended, and mitochondria were permeabilized by a freeze–thaw procedure before used to evaluate the activity of mitochondrial membrane complexes like complex II (SDH) [53,54].

4.6. Measurement of Mitochondrial Complex II Activity

Complex II specific activity was measured by following the decline in absorbance at 600 nm due to the reduction of dichlorophenol indophenols. Two hundred and twenty five microliters of the reaction mixture (containing 50 mM potassium phosphate pH 7.8, 2 mM EDTA, 0.1% BSA, 0.3 mM KCN, 50 mM dichlorophenol indophenol, 3 μM rotenone, 1 μM antimycin A, 2 mmol/L ATP, 50 μM CoQ1 and 45 μg mitochondria protein) was loaded onto 96-well plate and equilibrated at 30 °C for 5 min. The reaction was started by addition of 25 µL sodium succinate at the final concentration of 10 mM and the enzyme-catalyzed reduction of dichlorophenol indophenol was monitored as absorbance at 600 nm for 5 min. Graphs of absorbance versus time were plotted and reaction rates were calculated.

4.7. Measurement of ATP Production

ATP production was measured by using the method previously described [55], with some modifications. We reduced the total volume of the reaction mixture from 1 mL to 250 µL and the reaction was carried out in 96-well plates.

4.8. Mitochondrial DNA (mtDNA)

Mitochondrial DNA content was determined according to the protocol described by Ajaz et al. [56]. It was quantified by real-time quantitative PCR.

4.9. Statistical Analysis

Group measurements were expressed as average ± SEM. One-way ANOVA was used to test for differences among groups. When either a significant (p < 0.05) or a marginal (0.05 < p < 0.1) effect was observed, two-tailed Student’s t tests were conducted to analyze the significance of the differences between two specific groups. p < 0.05 was considered significant.

5. Conclusions

In this study, we report that MGF significantly increased metabolites in glycolysis, and the increases augmented from the early steps to the late steps, indicating that MGF accelerated glycolytic flux, and this was supported by MGF induced mRNAs of several enzymes catalyzing glycolysis. MGF enhanced overall metabolism in the TCA cycle in a direction from citrate to oxaloacetate. It increased most of metabolites in the TCA cycle, but reduced succinate. MGF enhanced conversion of succinate to fumarate, which occurs not only in the TCA cycle but also in the ETC, by upregulating SDH at both the activity and the expression levels. At the expression level, MGF upregulated not only mtDNA contents, but also mRNAs of most of mitochondrial genes and their transcriptional factors. Overall, MGF upregulated mitochondrial oxidative capacity, which was indicated by MGF-increased ATP production. This study provides molecular understanding of how MGF stimulates carbohydrate oxidation and thereby mitigates hyperglycemia and insulin resistance. As a natural compound, MGF has great potential to be developed into a nutraceutical/pharmaceutical to combat diabetes and obesity.

Acknowledgments

This work was supported by the grants that Yuling Chi received from the American Heart Association (0735066N), from American Diabetes Association (1-11-JF-06), and partially from NIH/NIDDK (DK41296 and DK020541).

Author Contributions

Yuling Chi conceived and designed the experiments; Zhongbo Liu, Pasha Apontes and Ekaterina V. Fomenko performed the experiments; Yuling Chi, Zhongbo Liu, Ekaterina V. Fomenko, Nan Chi and Irwin J. Kurland analyzed the data; Yuling Chi wrote the paper; Victor L. Schuster and Jeffrey E. Pessin edited paper.

Conflicts of Interest

The authors declare no conflict of interest.

Abbreviations

TCATricarboxylic acid
ETCElectron transport chain
PDHPyruvate dehydrogenase
CSCitrate synthase
α-KGα-Ketoglutarate
α-KGDHα-Ketoglutarate dehydrogenase
PFKPhosphofructose kinase
GAPDHGlyceraldehyde 3-phosphate dehydrogenase
HFDHigh fat diet
MGFMangiferin
UDPGUrindine diphosphate glucose
PEPPhosphoenolpyruvate
HKHexose kinase
PGIPhosphoglucose isomerase
PFKPhosphofructokinase
FBAFructose-1,6-bisphosphate aldolase
PGKPhosphoglycerate Kinase
PGMPhosphoglycerate mutase
PKPyruvate kinase
LDHLactate dehydrogenase
PCPyruvate carboxylase
CSCitrate synthase
ACAconitase
IDHIsocitrate dehydrogenase
SuclSuccinyl coenzyme A synthetase
SDHSuccinate dehydrogenase
FHFumarase
MDHMalate dehydrogenase
Atp5g1ATP synthase subunit 5g1
TFAMTranscriptional factor A
NRF1Nuclear respiratory factor 1
ERRαEstrogen-related receptor α
PGC-1αPeroxisome proliferator-activated receptor-γ coactivator-1α
PGC-1βPeroxisome proliferator-activated receptor-γ coactivator-1β
mtDNAMitochondrial DNA
PBSPhosphate-buffered saline

References

  1. Owen, O.E.; Kalhan, S.C.; Hanson, R.W. The key role of anaplerosis and cataplerosis for citric acid cycle function. J. Biol. Chem. 2002, 277, 30409–30412. [Google Scholar] [CrossRef] [PubMed]
  2. Kowalski, G.M.; de Souza, D.P.; Burch, M.L.; Hamley, S.; Kloehn, J.; Selathurai, A.; Tull, D.; O’Callaghan, S.; McConville, M.J.; Bruce, C.R. Application of dynamic metabolomics to examine in vivo skeletal muscle glucose metabolism in the chronically high-fat fed mouse. Biochem. Biophys. Res. Commun. 2015, 462, 27–32. [Google Scholar] [CrossRef] [PubMed]
  3. Chinopoulos, C. Which way does the citric acid cycle turn during hypoxia? The critical role of α-ketoglutarate dehydrogenase complex. J. Neurosci. Res. 2013, 91, 1030–1043. [Google Scholar] [CrossRef] [PubMed] [Green Version]
  4. Abdul-Ghani, M.A.; DeFronzo, R.A. Mitochondrial dysfunction, insulin resistance, and type 2 diabetes mellitus. Curr. Diabetes Rep. 2008, 8, 173–178. [Google Scholar] [CrossRef]
  5. Ristow, M.; Carlqvist, H.; Hebinck, J.; Vorgerd, M.; Krone, W.; Pfeiffer, A.; Muller-Wieland, D.; Ostenson, C.G. Deficiency of phosphofructo-1-kinase/muscle subtype in humans is associated with impairment of insulin secretory oscillations. Diabetes 1999, 48, 1557–1561. [Google Scholar] [CrossRef] [PubMed]
  6. Ristow, M.; Vorgerd, M.; Mohlig, M.; Schatz, H.; Pfeiffer, A. Deficiency of phosphofructo-1-kinase/muscle subtype in humans impairs insulin secretion and causes insulin resistance. J. Clin. Investig. 1997, 100, 2833–2841. [Google Scholar] [CrossRef] [PubMed]
  7. Ristow, M.; Vorgerd, M.; Mohlig, M.; Schatz, H.; Pfeiffer, A. Insulin resistance and impaired insulin secretion due to phosphofructo-1-kinase-deficiency in humans. J. Mol. Med. 1999, 77, 96–103. [Google Scholar] [CrossRef] [PubMed]
  8. Da Silva, D.; Zancan, P.; Coelho, W.S.; Gomez, L.S.; Sola-Penna, M. Metformin reverses hexokinase and 6-phosphofructo-1-kinase inhibition in skeletal muscle, liver and adipose tissues from streptozotocin-induced diabetic mouse. Arch. Biochem. Biophys. 2010, 496, 53–60. [Google Scholar] [CrossRef] [PubMed]
  9. Du, X.; Matsumura, T.; Edelstein, D.; Rossetti, L.; Zsengeller, Z.; Szabo, C.; Brownlee, M. Inhibition of GAPDH activity by poly(ADP-ribose) polymerase activates three major pathways of hyperglycemic damage in endothelial cells. J. Clin. Investig. 2003, 112, 1049–1057. [Google Scholar] [CrossRef] [PubMed]
  10. Brownlee, M. The pathobiology of diabetic complications: A unifying mechanism. Diabetes 2005, 54, 1615–1625. [Google Scholar] [CrossRef] [PubMed]
  11. Wentzel, P.; Ejdesjo, A.; Eriksson, U.J. Maternal diabetes in vivo and high glucose in vitro diminish GAPDH activity in rat embryos. Diabetes 2003, 52, 1222–1228. [Google Scholar] [CrossRef] [PubMed]
  12. Senhaji, N.; Elkhalfi, B.; Soukri, A. Contribution to the study of glyceraldehyde-3-phosphate dehydrogenase in patients with type 2 diabetes. Pathol.-Biol. 2015, 63, 74–79. [Google Scholar] [CrossRef] [PubMed]
  13. Befroy, D.E.; Petersen, K.F.; Dufour, S.; Mason, G.F.; de Graaf, R.A.; Rothman, D.L.; Shulman, G.I. Impaired mitochondrial substrate oxidation in muscle of insulin-resistant offspring of type 2 diabetic patients. Diabetes 2007, 56, 1376–1381. [Google Scholar] [CrossRef] [PubMed]
  14. Petersen, K.F.; Dufour, S.; Befroy, D.; Garcia, R.; Shulman, G.I. Impaired mitochondrial activity in the insulin-resistant offspring of patients with type 2 diabetes. N. Engl. J. Med. 2004, 350, 664–671. [Google Scholar] [CrossRef] [PubMed]
  15. Szendroedi, J.; Schmid, A.I.; Chmelik, M.; Toth, C.; Brehm, A.; Krssak, M.; Nowotny, P.; Wolzt, M.; Waldhausl, W.; Roden, M. Muscle mitochondrial ATP synthesis and glucose transport/phosphorylation in type 2 diabetes. PLoS Med. 2007, 4, e154. [Google Scholar] [CrossRef] [PubMed]
  16. Patel, D.P.; Krausz, K.W.; Xie, C.; Beyoglu, D.; Gonzalez, F.J.; Idle, J.R. Metabolic profiling by gas chromatography-mass spectrometry of energy metabolism in high-fat diet-fed obese mice. PLoS ONE 2017, 12, e0177953. [Google Scholar] [CrossRef] [PubMed]
  17. Patti, M.E.; Butte, A.J.; Crunkhorn, S.; Cusi, K.; Berria, R.; Kashyap, S.; Miyazaki, Y.; Kohane, I.; Costello, M.; Saccone, R.; et al. Coordinated reduction of genes of oxidative metabolism in humans with insulin resistance and diabetes: Potential role of PGC1 and NRF1. Proc. Natl. Acad. Sci. USA 2003, 100, 8466–8471. [Google Scholar] [CrossRef] [PubMed]
  18. Ritov, V.B.; Menshikova, E.V.; He, J.; Ferrell, R.E.; Goodpaster, B.H.; Kelley, D.E. Deficiency of subsarcolemmal mitochondria in obesity and type 2 diabetes. Diabetes 2005, 54, 8–14. [Google Scholar] [CrossRef] [PubMed]
  19. Apontes, P.; Liu, Z.; Su, K.; Benard, O.; Youn, D.Y.; Li, X.; Li, W.; Mirza, R.H.; Bastie, C.C.; Jelicks, L.A.; et al. Mangiferin Stimulates Carbohydrate Oxidation and Protects against High Fat Diet Induced Metabolic Disorders. Diabetes 2014, 63, 3626–3636. [Google Scholar] [CrossRef] [PubMed]
  20. Kirby, D.M.; Thorburn, D.R.; Turnbull, D.M.; Taylor, R.W. Biochemical assays of respiratory chain complex activity. Methods Cell Biol. 2007, 80, 93–119. [Google Scholar] [PubMed]
  21. Puigserver, P. Tissue-specific regulation of metabolic pathways through the transcriptional coactivator PGC1-α. Int. J. Obes. 2005, 29, S5–S9. [Google Scholar] [CrossRef] [PubMed]
  22. Vega, R.B.; Huss, J.M.; Kelly, D.P. The coactivator PGC-1 cooperates with peroxisome proliferator-activated receptor α in transcriptional control of nuclear genes encoding mitochondrial fatty acid oxidation enzymes. Mol. Cell Biol. 2000, 20, 1868–1876. [Google Scholar] [CrossRef] [PubMed]
  23. Huss, J.M.; Kopp, R.P.; Kelly, D.P. Peroxisome proliferator-activated receptor coactivator-1α (PGC-1α) coactivates the cardiac-enriched nuclear receptors estrogen-related receptor-alpha and -gamma. Identification of novel leucine-rich interaction motif within PGC-1α. J. Biol. Chem. 2002, 277, 40265–40274. [Google Scholar] [CrossRef] [PubMed]
  24. Wu, Y.; Delerive, P.; Chin, W.W.; Burris, T.P. Requirement of helix 1 and the AF-2 domain of the thyroid hormone receptor for coactivation by PGC-1. J. Biol. Chem. 2002, 277, 8898–8905. [Google Scholar] [CrossRef] [PubMed]
  25. Scarpulla, R.C. Nuclear control of respiratory chain expression by nuclear respiratory factors and PGC-1-related coactivator. Ann. N. Y. Acad. Sci. 2008, 1147, 321–334. [Google Scholar] [CrossRef] [PubMed]
  26. Rodgers, J.T.; Lerin, C.; Haas, W.; Gygi, S.P.; Spiegelman, B.M.; Puigserver, P. Nutrient control of glucose homeostasis through a complex of PGC-1α and SIRT1. Nature 2005, 434, 113–118. [Google Scholar] [CrossRef] [PubMed]
  27. Sellamuthu, P.S.; Muniappan, B.P.; Perumal, S.M.; Kandasamy, M. Antihyperglycemic Effect of Mangiferin in Streptozotocin Induced Diabetic Rats. J. Health Sci. 2009, 55, 206–214. [Google Scholar] [CrossRef]
  28. Simi, B.; Sempore, B.; Mayet, M.H.; Favier, R.J. Additive effects of training and high-fat diet on energy metabolism during exercise. J. Appl. Physiol. (1985) 1991, 71, 197–203. [Google Scholar] [CrossRef] [PubMed]
  29. Leibowitz, S.F.; Dourmashkin, J.T.; Chang, G.Q.; Hill, J.O.; Gayles, E.C.; Fried, S.K.; Wang, J. Acute high-fat diet paradigms link galanin to triglycerides and their transport and metabolism in muscle. Brain Res. 2004, 1008, 168–178. [Google Scholar] [CrossRef] [PubMed]
  30. Roy, C.; Paglialunga, S.; Fisette, A.; Schrauwen, P.; Moonen-Kornips, E.; St-Onge, J.; Hesselink, M.K.; Richard, D.; Joanisse, D.R.; Cianflone, K. Shift in metabolic fuel in acylation-stimulating protein-deficient mice following a high-fat diet. Am. J. Physiol. Endocrinol. Metab. 2008, 294, E1051–E1059. [Google Scholar] [CrossRef] [PubMed]
  31. Chen-Zion, M.; Livnat, T.; Beitner, R. Effects of long-term streptozotocin diabetes on cytoskeletal and cytosolic phosphofructokinase and the levels of glucose 1,6-bisphosphate and fructose 2,6-bisphosphate in different rat muscles. Biochem. Med. Metab. Biol. 1994, 53, 137–144. [Google Scholar] [CrossRef] [PubMed]
  32. Vestergaard, H. Studies of gene expression and activity of hexokinase, phosphofructokinase and glycogen synthase in human skeletal muscle in states of altered insulin-stimulated glucose metabolism. Dan. Med. Bull. 1999, 46, 13–34. [Google Scholar] [PubMed]
  33. Aithal, H.N.; Walsh-Reitz, M.M.; Toback, F.G. Regulation of glyceraldehyde-3-phosphate dehydrogenase by a cytosolic protein. Am. J. Physiol. 1985, 249, C111–C116. [Google Scholar] [CrossRef] [PubMed]
  34. Nicholls, C.; Li, H.; Liu, J.P. GAPDH: A common enzyme with uncommon functions. Clin. Exp. Pharmacol. Physiol. 2012, 39, 674–679. [Google Scholar] [CrossRef] [PubMed]
  35. Modrego, J.; de las Heras, N.; Zamorano-Leon, J.J.; Mateos-Caceres, P.J.; Martin-Fernandez, B.; Valero-Munoz, M.; Lahera, V.; Lopez-Farre, A.J. Changes in cardiac energy metabolic pathways in overweighed rats fed a high-fat diet. Eur. J. Nutr. 2013, 52, 847–856. [Google Scholar] [CrossRef] [PubMed]
  36. Sellayah, D.; Sek, K.; Anthony, F.W.; Hanson, M.A.; Cagampang, F.R. Sensitivity of housekeeping genes in the hypothalamus to mismatch in diets between pre- and postnatal periods in mice. Neurosci. Lett. 2008, 447, 54–57. [Google Scholar] [CrossRef] [PubMed]
  37. Xu, L.; Ma, X.; Cui, B.; Li, X.; Ning, G.; Wang, S. Selection of reference genes for qRT-PCR in high fat diet-induced hepatic steatosis mice model. Mol. Biotechnol. 2011, 48, 255–262. [Google Scholar] [CrossRef] [PubMed]
  38. Van Vranken, J.G.; Na, U.; Winge, D.R.; Rutter, J. Protein-mediated assembly of succinate dehydrogenase and its cofactors. Crit. Rev. Biochem. Mol. Biol. 2015, 50, 168–180. [Google Scholar] [CrossRef] [PubMed]
  39. Bourgeron, T.; Rustin, P.; Chretien, D.; Birch-Machin, M.; Bourgeois, M.; Viegas-Pequignot, E.; Munnich, A.; Rotig, A. Mutation of a nuclear succinate dehydrogenase gene results in mitochondrial respiratory chain deficiency. Nat. Genet. 1995, 11, 144–149. [Google Scholar] [CrossRef] [PubMed]
  40. Acevedo, L.M.; Raya, A.I.; Martinez-Moreno, J.M.; Aguilera-Tejero, E.; Rivero, J.L. Mangiferin protects against adverse skeletal muscle changes and enhances muscle oxidative capacity in obese rats. PLoS ONE 2017, 12, e0173028. [Google Scholar] [CrossRef] [PubMed]
  41. Prabhu, S.; Jainu, M.; Sabitha, K.E.; Shyamala Devi, C.S. Effect of mangiferin on mitochondrial energy production in experimentally induced myocardial infarcted rats. Vasc. Pharmacol. 2006, 44, 519–525. [Google Scholar] [CrossRef] [PubMed]
  42. Lim, J.; Liu, Z.; Apontes, P.; Feng, D.; Pessin, J.E.; Sauve, A.A.; Angeletti, R.H.; Chi, Y. Dual mode action of mangiferin in mouse liver under high fat diet. PLoS ONE 2014, 9, e90137. [Google Scholar] [CrossRef] [PubMed]
  43. Muruganandan, S.; Srinivasan, K.; Gupta, S.; Gupta, P.K.; Lal, J. Effect of mangiferin on hyperglycemia and atherogenicity in streptozotocin diabetic rats. J. Ethnopharmacol. 2005, 97, 497–501. [Google Scholar] [CrossRef] [PubMed]
  44. Guo, F.; Huang, C.; Liao, X.; Wang, Y.; He, Y.; Feng, R.; Li, Y.; Sun, C. Beneficial effects of mangiferin on hyperlipidemia in high-fat-fed hamsters. Mol. Nutr. Food Res. 2011, 55, 1809–1818. [Google Scholar] [CrossRef] [PubMed]
  45. Niu, Y.; Li, S.; Na, L.; Feng, R.; Liu, L.; Li, Y.; Sun, C. Mangiferin decreases plasma free fatty acids through promoting its catabolism in liver by activation of AMPK. PLoS ONE 2012, 7, e30782. [Google Scholar] [CrossRef] [PubMed]
  46. Xing, X.; Li, D.; Chen, D.; Zhou, L.; Chonan, R.; Yamahara, J.; Wang, J.; Li, Y. Mangiferin treatment inhibits hepatic expression of acyl-coenzyme A:diacylglycerol acyltransferase-2 in fructose-fed spontaneously hypertensive rats: A link to amelioration of fatty liver. Toxicol. Appl. Pharmacol. 2014, 280, 207–215. [Google Scholar] [CrossRef] [PubMed]
  47. Zhou, L.; Pan, Y.; Chonan, R.; Batey, R.; Rong, X.; Yamahara, J.; Wang, J.; Li, Y. Mitigation of Insulin Resistance by Mangiferin in a Rat Model of Fructose-Induced Metabolic Syndrome Is Associated with Modulation of CD36 Redistribution in the Skeletal Muscle. J. Pharmacol. Exp. Ther. 2016, 356, 74–84. [Google Scholar] [CrossRef] [PubMed]
  48. Na, L.X.; Zhang, Q.; Jiang, S.; Du, S.S.; Zhang, W.; Li, Y.; Sun, C.H.; Niu, Y.C. Mangiferin supplementation improves serum lipid profiles in overweight patients with hyperlipidemia: A double-blind randomized controlled trial. Sci. Rep.-UK 2015, 5. [Google Scholar] [CrossRef] [PubMed]
  49. Han, D.; Chen, C.; Zhang, C.; Zhang, Y.; Tang, X. Determination of mangiferin in rat plasma by liquid-liquid extraction with UPLC-MS/MS. J. Pharm. Biomed. Anal. 2010, 51, 260–263. [Google Scholar] [CrossRef] [PubMed]
  50. Hou, S.Y.; Wang, F.; Li, Y.M.; Li, Y.; Wang, M.Q.; Sun, D.J.; Sun, C.H. Pharmacokinetic study of mangiferin in human plasma after oral administration. Food Chem. 2012, 132, 289–294. [Google Scholar] [CrossRef] [PubMed]
  51. Ma, H.; Chen, H.; Sun, L.; Tong, L.; Zhang, T. Improving permeability and oral absorption of mangiferin by phospholipid complexation. Fitoterapia 2014, 93, 54–61. [Google Scholar] [CrossRef] [PubMed]
  52. Serasinghe, M.N.; Wieder, S.Y.; Renault, T.T.; Elkholi, R.; Asciolla, J.J.; Yao, J.L.; Jabado, O.; Hoehn, K.; Kageyama, Y.; Sesaki, H.; et al. Mitochondrial Division Is Requisite to RAS-Induced Transformation and Targeted by Oncogenic MAPK Pathway Inhibitors. Mol. Cell 2015, 57, 521–536. [Google Scholar] [CrossRef] [PubMed]
  53. Jeoung, N.H.; Sanghani, P.C.; Zhai, L.; Harris, R.A. Assay of the pyruvate dehydrogenase complex by coupling with recombinant chicken liver arylamine N-acetyltransferase. Anal. Biochem. 2006, 356, 44–50. [Google Scholar] [CrossRef] [PubMed]
  54. Constantin-Teodosiu, D.; Cederblad, G.; Hultman, E. A sensitive radioisotopic assay of pyruvate dehydrogenase complex in human muscle tissue. Anal. Biochem. 1991, 198, 347–351. [Google Scholar] [CrossRef]
  55. Drew, B.; Phaneuf, S.; Dirks, A.; Selman, C.; Gredilla, R.; Lezza, A.; Barja, G.; Leeuwenburgh, C. Effects of aging and caloric restriction on mitochondrial energy production in gastrocnemius muscle and heart. Am. J. Physiol. Regul. Integr. Comp. Physiol. 2003, 284, R474–R480. [Google Scholar] [CrossRef] [PubMed]
  56. Ajaz, S.; Czajka, A.; Malik, A. Accurate measurement of circulating mitochondrial DNA content from human blood samples using real-time quantitative PCR. Methods Mol. Biol. 2015, 1264, 117–131. [Google Scholar] [PubMed]
Figure 1. MGF accelerates glycolysis. Glucose metabolic pathways include glycogen synthesis, pentose phosphate shunt and glycolysis. Arrows in the glycolysis pathway indicate mangiferin directed metabolic flux from one product to the next. Arrows in other pathways mean change of one metabolic product to the other. Significantly altered metabolites are presented in bar graphs. Values are average ± SEM (n = 6). * p < 0.05. HK, Hexose kinase; PGI, Phosphoglucose isomerase; PFK, Phosphofructokinase; FBA, Fructose-1,6-bisphosphate aldolase; GAPDH, Glyceraldehyde 3-phosphate dehydrogenase; PGK, Phosphoglycerate kinase; PGM, Phosphoglycerate mutase; PK, Pyruvate kinase; PEP, phosphoenolpyruvae; LDH, lactate dehydrogenase; PDH, pyruvate dehydrogenase; UDPG, urindine diphosphate glucose.
Ijms 19 00201 g001
Figure 2. MGF induces mRNAs of some enzymes participating in glycolysis. Profiles of mRNAs of glycolytic enzymes in quadriceps from mice treated with chow or HFD ± MGF for 16 weeks. Values are average ± SEM (n = 6/group). * p < 0.05, ** p < 0.01.
Ijms 19 00201 g002
Figure 3. MGF modulates metabolite profiles in the TCA cycle. One-end arrows mean unidirectional and two-end arrows mean bidirectional. Significantly altered metabolites are presented in bar graphs. Values are average ± SEM (n = 6). * p < 0.05. PC, pyruvate carboxylase; PDH, pyruvate dehydrogenase; CS, citrate synthase; AC, Aconitase; IDH, isocitrate dehydrogenase; α-KGDH, α-ketoglutarate dehydrogenase; Suclg, succinyl coenzyme A synthetase; SDH, succinate dehydrogenase; FH, fumarase; MDH, malate dehydrogenase; α-KG, α-ketoglutarate.
Ijms 19 00201 g003
Figure 4. MGF enhances SDH activity and increases ATP production. Mitochondria were isolated from quadriceps of mice treated with chow or HFD ± MGF for 16 weeks (n = 6/group) (a) or C2C12 myotubes treated with various concentrations of MGF for 4 h (b). In vitro experiment presented in (b) was repeated for three times. The comparisons are between the rate at each MGF concentration with the rate when [MGF] = 0; (c) ATP production in freshly isolated mitochondria from quadriceps of mice treated with chow or HFD ± MGF for 16 weeks (n = 6/group). Values are average ± SEM. * p < 0.05, ** p < 0.01.
Ijms 19 00201 g004
Figure 5. MGF induces mitochondrial biogenesis. (ac) Profiles of mRNAs of mitochondrial genes (a,b) and transcriptional factors (c) in quadriceps of mice treated with chow or HFD ± MGF for 16 weeks (n = 6/group); (d) Relative mitochondria DNA contents in quadriceps of mice treated with chow or HFD ± MGF for 16 weeks. Values are average ± SEM (n = 6). * p < 0.05, ** p < 0.01.
Ijms 19 00201 g005
Table 1. Profiles of metabolites in quadriceps of mice.
MetaboliteChowHFDHFD/Chow (Ctl)
CtlMGFRatio (MGF/Ctl)* p (MGF Versus Ctl)CtlMGFRatio (MGF/Ctl)* p (MGF Versus Ctl)Ratio* p
UDPG7.957.630.960.1156.405.890.920.3160.800.098
Glucose-6-phosphate6.938.901.280.27213.1918.841.430.0181.900.034
Fructose-1,6-bisphosphate44.1758.901.330.09954.2876.401.410.0431.230.451
3-Phosphoglycerate26.0334.091.310.08928.3946.181.630.0301.090.445
Phosphoeolpyruate1.582.181.380.0540.892.272.540.0240.570.025
Pyruvate20.4825.111.230.17515.4118.941.230.0830.750.038
Lactate350.59272.190.780.046313.57213.150.680.0290.890.144
Glycerol-3-phosphate120.48131.001.090.329103.34133.681.290.1520.860.274
Ribose-5-phosphate0.390.431.090.2160.440.471.050.6881.130.406
6-Phosphogluconate1.401.581.130.1931.191.070.890.2170.850.130
α-Ketoglutarate0.450.671.480.0430.280.622.200.0410.630.035
Succinate50.8131.230.610.03836.9621.850.590.0320.730.050
Fumarate8.1711.241.380.0496.019.091.510.0410.740.049
Malate43.8948.311.100.12135.6440.451.130.3220.810.084
Aspartate26.4829.531.120.09019.4520.821.070.2100.730.042
C57BL6/J mice were fed chow or HFD and treated with MGF or without MGF for 16 weeks. Mice were then sacrificed after fasting for 12 h from 10 p.m. to 10 a.m. Their quadriceps were collected and snap frozen in liquid N2. Metabolites were analyzed by the metabolomics study. Values are average, n = 6. * p < 0.05 is considered significant. HFD, high fat diet; MGF, mangiferin; Ctl, control; UDPG, urindine diphosphate glucose.
Table 2. Mouse primers for real time qRTPCR.
GeneForward Sequence from 5′ to 3′Reverse Sequencefrom 5′ to 3′
HK2TGATCGCCTGCTTATTCACGGAACCGCCTAGAAATCTCCAGA
PGITGGCCCAGACTGAGGCCCTGCTCTAGGTGTCTTTATTCTA
PFKCAGATCAGTGCCAACATAACCAACGGGATGCAGAGCTCATCA
FBAAGCCTTCTGAGAAGGATGCTCGTCCAGCATGAAGCAGTTGAC
GAPDHACTGGCATGGCCTTCCGCAGGCGGCACGTCAGATC
PGK1GGTCTTGCCAAAATGTCGCTTCCAATCGAATCCTCGTGTC
PGMbTGCCCGTCGCCATGGCTGCC-CGGTGGGACATCATAAGATC-
Enolase1GCCGGCTTTACGTTCACCTCGTTGAAGCACCACTGGGCAC
CSAAGGACGAGGCAGGATGAGTGCAGCTGTAGCTCTCTCCC
Idh1ATTGGTGGCATCACGATTCT TGGAGATGCAAGGAGATGAA
AKGDHAGTGGTGGTGGGTAAGTGGAGCAAAACTTGATCCTCTCGG
Suclg1TGTTTCCGAGAGGCTGTGTACAACCATGGTCTCCAGCAG
SDHbGTCTGTGCCCCTCGACAGTGACGTCAGGAGCCAAAAT
FH1ACACGGAAGGAATTTTGGCTACCATGTACCGCGCACTC
MDH1TGCTCCAGTCACAAGGACTC GACTGCTGGAGACTGCCTTT
CoxI (Ndufa9)TAAGGGATGAAGGTCCGATGGATCCAGATGCCGTAGGAAA
Cyc (cytochrome c)GGAGGCAAGCATAAGACTGGTCCATCAGGGTATCCTCTCC
CoxIVAGAAGGAAATGGCTGCAGAAGCTCGGCTTCCAGTATTGAG
Atp5g1GCTGCTTGAGAGATGGGTTCAGTTGGTGTGGCTGGATCA
PGC-1αAAGTGTGGAACTCTCTGGAACTGGGGTTATCTTGGTTGGCTTTATG
PGC-1βTGCTGCTGTCCTCAAATACGTGGAGACTGCTCTGGAAGGT
NRFCGGAGTGACCCAAACTGAACGATGACCACCTCGACCGTTT
ERRαACTGCCACTGCAGGATGAGCACAGCCTCAGCATCTTCAA
TFAMCCAAAAAGACCTCGTTCAGCATGTCTCCGGATCGTTTCAC
Β-actinCATGGAGTCCTGTGGCATCAGCACTGTGTTGGCGTAC

