Review

The Spatial Dimension of COVID-19: The Potential of Earth Observation Data in Support of Slum Communities with Evidence from Brazil

1
Politechnic School of Federal University of Bahia (UFBA), R. Aristides Novis, n.2, Salvador, Bahia 40210-630, Brazil
2
Geo-Information Science and Earth Observation (ITC), University of Twente, 7514 AE Enschede, The Netherlands
3
Collective Health of Federal University of Bahia (UFBA), R. Basílio da Gama, Salvador, Bahia 40110-040, Brazil
*
Author to whom correspondence should be addressed.
ISPRS Int. J. Geo-Inf. 2020, 9(9), 557; https://doi.org/10.3390/ijgi9090557
Submission received: 3 August 2020 / Revised: 1 September 2020 / Accepted: 8 September 2020 / Published: 20 September 2020
(This article belongs to the Collection Spatial Components of COVID-19 Pandemic)

Abstract

:
The COVID-19 health emergency is impacting all of our lives, but the living conditions and urban morphologies found in poor communities make inhabitants more vulnerable to the COVID-19 outbreak as compared to the formal city, where inhabitants have the resources to follow WHO guidelines. In general, municipal spatial datasets are not well equipped to support spatial responses to health emergencies, particularly in poor communities. In such critical situations, Earth observation (EO) data can play a vital role in timely decision making and can save many people’s lives. This work provides an overview of the potential of EO-based global and local datasets, as well as local data gathering procedures (e.g., drones), in support of COVID-19 responses by referring to two slum areas in Salvador, Brazil as a case study. We discuss the role of datasets as well as data gaps that hinder COVID-19 responses. In Salvador and other low- and middle-income countries’ (LMICs) cities, local data are available; however, they are not up to date. For example, depending on the source, the population of the study areas in 2020 varies by more than 20%. Thus, EO data integration can help in updating local datasets and in the acquisition of physical parameters of poor urban communities, which are often not systematically collected in local surveys.

Graphical Abstract

1. Introduction

COVID-19 was declared, by March 11, 2020, a global pandemic [1]. Recently, infection rates are increasing in many low- and middle-income countries (LMICs), as well as mortality rates, which are particularly high in deprived communities [2,3], pointing to high vulnerabilities of the urban poor in LMICs. The large differences in infection and mortality rates between LMICs and high-income countries (HICs) can be attributed to poor environmental and housing conditions, together with pre-existing health issues in LMICs, forming hotspots of infections in deprived communities. With an accelerated spread of COVID-19 in LMICs, municipalities and deprived communities, such as slums, need to be urgently prepared for appropriate responses [4]. The potential gain in the experience of mitigating negative impacts of pandemics in slums would also apply to many vulnerable populations other than slum dwellers outside of cities, such as indigenous groups. According to existing studies, it is worth mentioning that the most severe impacts of the epidemic also occur in other groups such as indigenous people, and these should be included in the risk group designation [5,6,7,8]. These indigenous groups, located in- or outside of cities, are often recognized as hard-to-access communities and prone to underestimation of the actual situation. Thus, spatial tools are highly demanded for the identification of hotspots and applying spatial measurements [9].
A large part of the increasing urban growth in LMICs is unplanned or informal [10]. Inhabitants are often excluded from access to essential basic services and are commonly not seen as a fully recognized part of the city [11]. In general, spatial data of such areas, e.g., about infrastructure or socio-economic conditions, are often missing in municipal databases [12] and maps [13]. This social exclusion and the lack of data are preventing effective responses from public health sectors. To effectively deal with a large health emergency triggered by a pandemic, such as COVID-19, the spatial dimension of health risks needs to be well understood in terms of locating and assessing risks at household and area levels. In the case of COVID-19, characterizing the spatio-temporal burden of diseases at a community scale provides critical support to city authorities and community-based organizations for the development of targeted strategies to minimize virus transmissions and provide better healthcare. This problem is not specific to the COVID-19 pandemic, as UN-Habitat also acknowledges that, within cities, there is a “lack of data” on deprived areas that do not allow for effective responses to most emergencies [14]. Data on such areas often lack reliability and information about the number of people, along with their health conditions. These data gaps lead to inappropriate or false responses, which have been observed during the 2014–2016 Ebola outbreak in several West African countries [15]. In this situation, remotely sensed data and maps, among others, are urgently required. However, data, especially regarding the spatial dimension, are commonly scarce and not available to support effective responses. Thus, it is essential to identify what are the key spatial datasets for geolocating health risks in slums.
Risk, in the context of natural hazards, is frequently defined as a function of the hazard and exposure of vulnerable elements (Figure 1) [16,17]. In the context of COVID-19, this concept can be applied to account for the combination and interaction of hazardous environmental variables and vulnerabilities of slum communities that might contribute to the risk of increasing infection, mortality, and morbidity. With COVID-19 as a given hazard, vulnerability would be the main focus for the preparedness against the risk. The critical examples of environmental and social vulnerabilities which challenge the COVID-19 response capacity in slum communities are:
(a)
Lack of basic services (e.g., clean water, sanitation and soap) which do not allow adherence to WHO guidelines for basic hygiene [18];
(b)
High density in both population and built environment that eliminate social distancing [19];
(c)
Access to work, livelihood, and food supply obligating dwellers to break social isolation recommendations (the informal economic section has been under particular threat by the lockdowns) [20];
(d)
The concentration of pre-existing health conditions such as chronic diseases (e.g., diabetes, hypertension [21], and respiratory diseases [22,23]) and infectious ones (e.g., malaria or leptospirosis [24]) because of poverty. Such vulnerabilities lead to a disease severity that requires an intensive care unit (ICU), and ultimately to mortality;
(e)
Unhealthy and dangerous environmental conditions (e.g., poor indoor ventilation, air pollution, open sewers, or living in humid areas, such as flood plains [22,23,25,26]);
(f)
Increased accumulation of waste (trash piles) caused by missing or insufficient public waste collection systems and increase of waste during the lockdown (raising heath fragility due to the increase of all sorts of associated diseases [27,28]);
(g)
Limited access to information, public health facilities, and social or financial aid [29];
(h)
Community organizations and empowerment through local leadership and available infrastructure for humanitarian aid actions, such as schools, community centers, and religious buildings [4].
Figure 1. Conceptualization of COVID-19 risks and the role of Earth observation (EO)-based data (based on [17,29]).
Ijgi 09 00557 g001
These vulnerabilities due to multi-dimensional deprivation lead to different levels of health risks, such as morbidity and mortality, when intersecting with extreme events such as pandemics. This intersection is rendered by its explicit spatial dimension, where it is crucial to locate how and where to deploy responses. Thus, Earth observation (EO)-based data have the potential to add an important component to understand the health risks of COVID-19 in slums, in addition to information on demographic, social, and economic conditions. Figure 1 presents a conceptual framework based on natural hazards risks evaluation [17] and current experiences at Salvador, Brazil [30], locating the potential role of EO-based data for assessing the health risk of COVID-19.
EO has proved to be efficient in deriving timely spatial information and bridging spatial data gaps [31,32]. Satellite imagery is globally available at various resolutions and is applicable for different purposes. The increasing temporal resolution of satellite imagery data also allows monitoring dynamics across days, weeks, months, and years. Presently, commercial data providers have made their repositories publicly available, e.g., Digital Globe provides access to very high-resolution data on several large cities, in response to the COVID-19 outbreak [33]. Thus in cases of crises, there are resources to cover urgent applications with high resolutions in both space and time. For example, base maps were derived from satellite imagery data for tracking Ebola in West Africa [34,35].
The usefulness of satellite data for emergency responses has been proved for many years; however, such data have fixed resolutions in space and time, and, if not available, they can be expensive. Therefore, unmanned aerial vehicles (UAVs) have recently been explored as a flexible alternative platform that can provide spatial information in crisis situations [12,34,35]. Recently, UAVs have been successfully applied for use in agriculture [36], mapping [37], surveying and cadastral applications [38], architecture and archaeology [39], and cultural heritage [40], among others. Recent research has shown the potential of UAVs in tracing the source of diseases such as malaria and tuberculosis in Spain [34]. The main advantage of using UAVs is that flights can be performed at a low altitude, which allows obtaining very high spatial resolution (2–10 cm) data. Furthermore, they are affordable, small in size, and easy to operate. Therefore, they are suitable for fast, cheap, and accurate data acquisition, and are nowadays increasingly used in health research [41]. For COVID-19, UAVs can efficiently provide necessary physical information on the built environment. Depending on the availability of the sensors onboard, UAVs can also be used for tracking temporal variations of temperature, radiation, noise, or pollution [42]. In addition, UAVs can be used for the transportation of medical supplies to access areas which are under serious infection [43]. Having the ability to process videos in real time, UAVs can, in principle, also be used in monitoring stress among people and following their movement patterns [44]. Among the many advantages of using UAVs, safety and privacy topics should not be left unmentioned [45]. Nowadays, many countries have regulations related to the usage of UAVs [46]; however, in most of the LMICs, such regulations are still not in place. In general, UAV data are relatively easy to collect for small areas at a relatively low cost; such data combined with low-cost or free EO-image allow for updating small areas where changes occurred.
In addition to the data obtained from satellites and UAVs, LiDAR, which stands for Light Detection and Ranging data, can also be used to derive highly accurate vertical information. The obtained point cloud information and elevation data can be used for 3D models, evaluation of soil displacement, flood simulation, detection of moving objects, etc. They can also be valuable for mitigation strategies in case of disasters [47].
The strength of the EO-based data could be especially magnified with auxiliary spatial information to obtain a full picture of the production and transmission of diseases. Therefore, as suggested by Elden [48], a terrestrial view considering the vertical dimension can be of great help. Many ground-based sensors and methods have been developed for obtaining useful geospatial data, such as Google Street View, images from web or video cameras, crowdsourcing, or social media posts. The ground-based perspective of Google Street View may provide valuable historical data that can be used for tracing specific disease patterns, including the third dimension, and can be efficiently used in combination with the EO methods mentioned above. Another useful resource of information for tracking human mobility, as discussed above, is crowdsourced data, such as Open Street Map (OSM). In recent decades, the use of social media has grown significantly. Algorithms that detect positive and negative posts for Facebook, Twitter, or Flickr were developed and can provide signals where people have health problems, and even locate them [49,50,51]. In times of pandemics or disasters, the combination of the sources mentioned above of geospatial information and using the analytical capabilities of GIS systems can play a huge role [52,53,54]. However, existing applications of EO-based data in the health community are still too limited to fully cover the potential of spatial datasets in assisting responses to a pandemic, such as COVID-19 responses, and also in support of public health in general. This gap is also stressed by the missing maps initiative [55] by the Red Cross.
Therefore, this paper aims to discuss how the EO-based datasets can potentially support a risk assessment of COVID-19 from the spatial dimension. We use the information from selected slum communities in Salvador, Brazil, as a study case of the role of EO-data in supporting the city’s Secretary of Health, Crises Committee, and communities to deal with the COVID-19 pandemic. Moreover, we show the potential of EO-data to encourage the public administration, research centers, and the civil society, stimulating them to think and act together in the territory. We see that this approach is not very common. Usually, health experts work only with epidemiological data from hospital registries. We propose a complementary approach that is essential to guide actions such as mobility restrictions, local disinfection, water supply verification, arbovirus control [56], humanitarian aid, etc. Here, we will focus on a range of socio-environmental determinants potentially associated with COVID-19 transmission and lethality. Examples are provided to illustrate the importance and potentials of appropriated spatial data for COVID-19 responses at city and community levels. Therefore, the paper demonstrates a conceptual frame of the multi-source geospatial solutions for adequate reactions in emergency health situations. We use the word slum as a translation of favela, which is recognized at both governmental and community levels [57,58].
In the following sections, we continue our discussions by answering one overarching research question: how can EO data help to identify specific intra-urban vulnerability during a pandemic? This question is detailed out in Section 2.

2. Materials and Methods

This section shows the concept of spatial information gaps hindering effective COVID-19 responses and the potential of EO-based data to fill these common gaps in slum communities. This concept of information needs and EO data is based on reviewed literature of COVID-19 responses [3,4,9,12,29,30,31] and voices from slum communities in Salvador and different places of the world [58,59,60] on the difficulties of fighting against the pandemic and following the Global North’s health advice. In Salvador, those voices were from the community leaders of the neighborhoods of Alto Do Cabrito, Marechal Rondon, and Península de Itapagipe, and of the Comitê Comunitário Virtual de Monitoramento das Ações de Enfrentamento da COVID-19 nos Bairros Populares de Salvador. Information about their difficulties has been gathered through publications on social media, interviews in local news, organization of local webinars, and through telephone calls and videoconferences held since April by one of the authors of this paper. We focused on EO-based data products that are readily available and also allow access for non-EO experts.

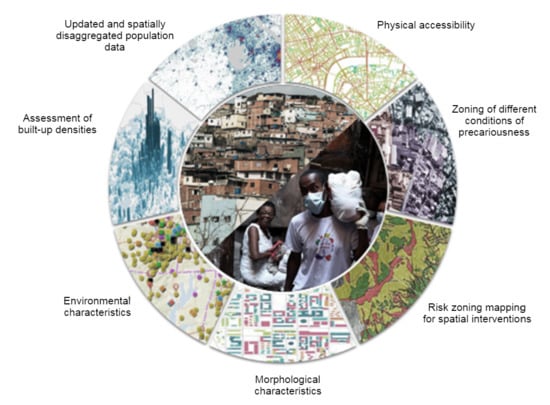
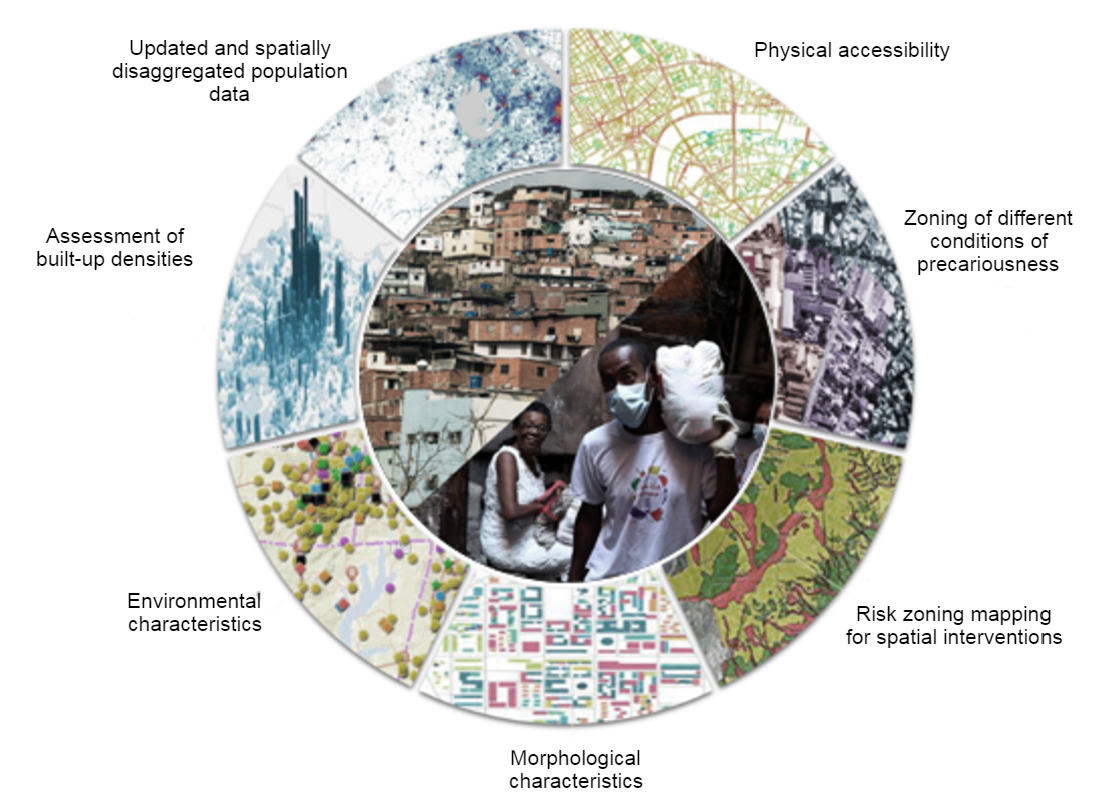
2.1. The Conceptual Frame of Information Needs and Spatial Data to Support COVID-19 Responses

Based on the spatial information needs and spatial data gaps found in slum communities, three major dimensions were summarized, i.e., density, facility, and environment-related data (we also acknowledge the importance of other dimensions, e.g., socio-economic data, which are not easy to extract from EO data, but are essential for COVID-19 responses). Within these three dimensions, we also saw two levels of information:
  • Static: distribution of spaces, such as dense buildings, narrow footpaths, and houses in flooding areas (water sinks). These are physical and environmental conditions (variables) potentially associated with a higher risk of COVID-19 transmission or morbidity.
  • Dynamic: distribution of potential movements, e.g., the spatial relation between residents and work/money/water/food supply, which leads to possible exposure to COVID-19.
Table 1 provides an overview of relevant spatial data, often missing for slums. For example, high population densities will cause serious problems for following the guidelines of social distancing. In many slums, in a very small house, like those in Figure 2, more than three people share one room [61]. Open spaces are scarce, and many footpaths are less than 2 m wide, which makes social distancing difficult when passing by people [19]. For the management of the COVID-19 pandemic, it is crucial to isolate symptomatic community members but also to ensure their supply of health care, food, and basic necessities. For this purpose, the identification of open spaces, community facilities, etc., that might be able to serve as isolation units is critical both within and in the immediate surroundings of communities [4]. On the other hand, it is important to monitor information flows related to the above mentioned dynamic level. Many times, connectivity may matter more than density for the virus spreading [20,62].
For the current research, global data and examples of local datasets for the city of Salvador were explored. The city was used as an example case (please refer to Section 3 about the rationale for selecting this case). Therefore, Table 2 provides a list of EO-based and other important spatial data with the potential to provide COVID-19 relevant information. Data sets include basic land cover data (10 m resolution), access to roads, built-up areas, and population data. Global data typically provide a general assessment of entire urban areas and an indication of basic settlement data. In contrast, local data provide detailed spatial information, such as a detailed LiDAR based surface model.

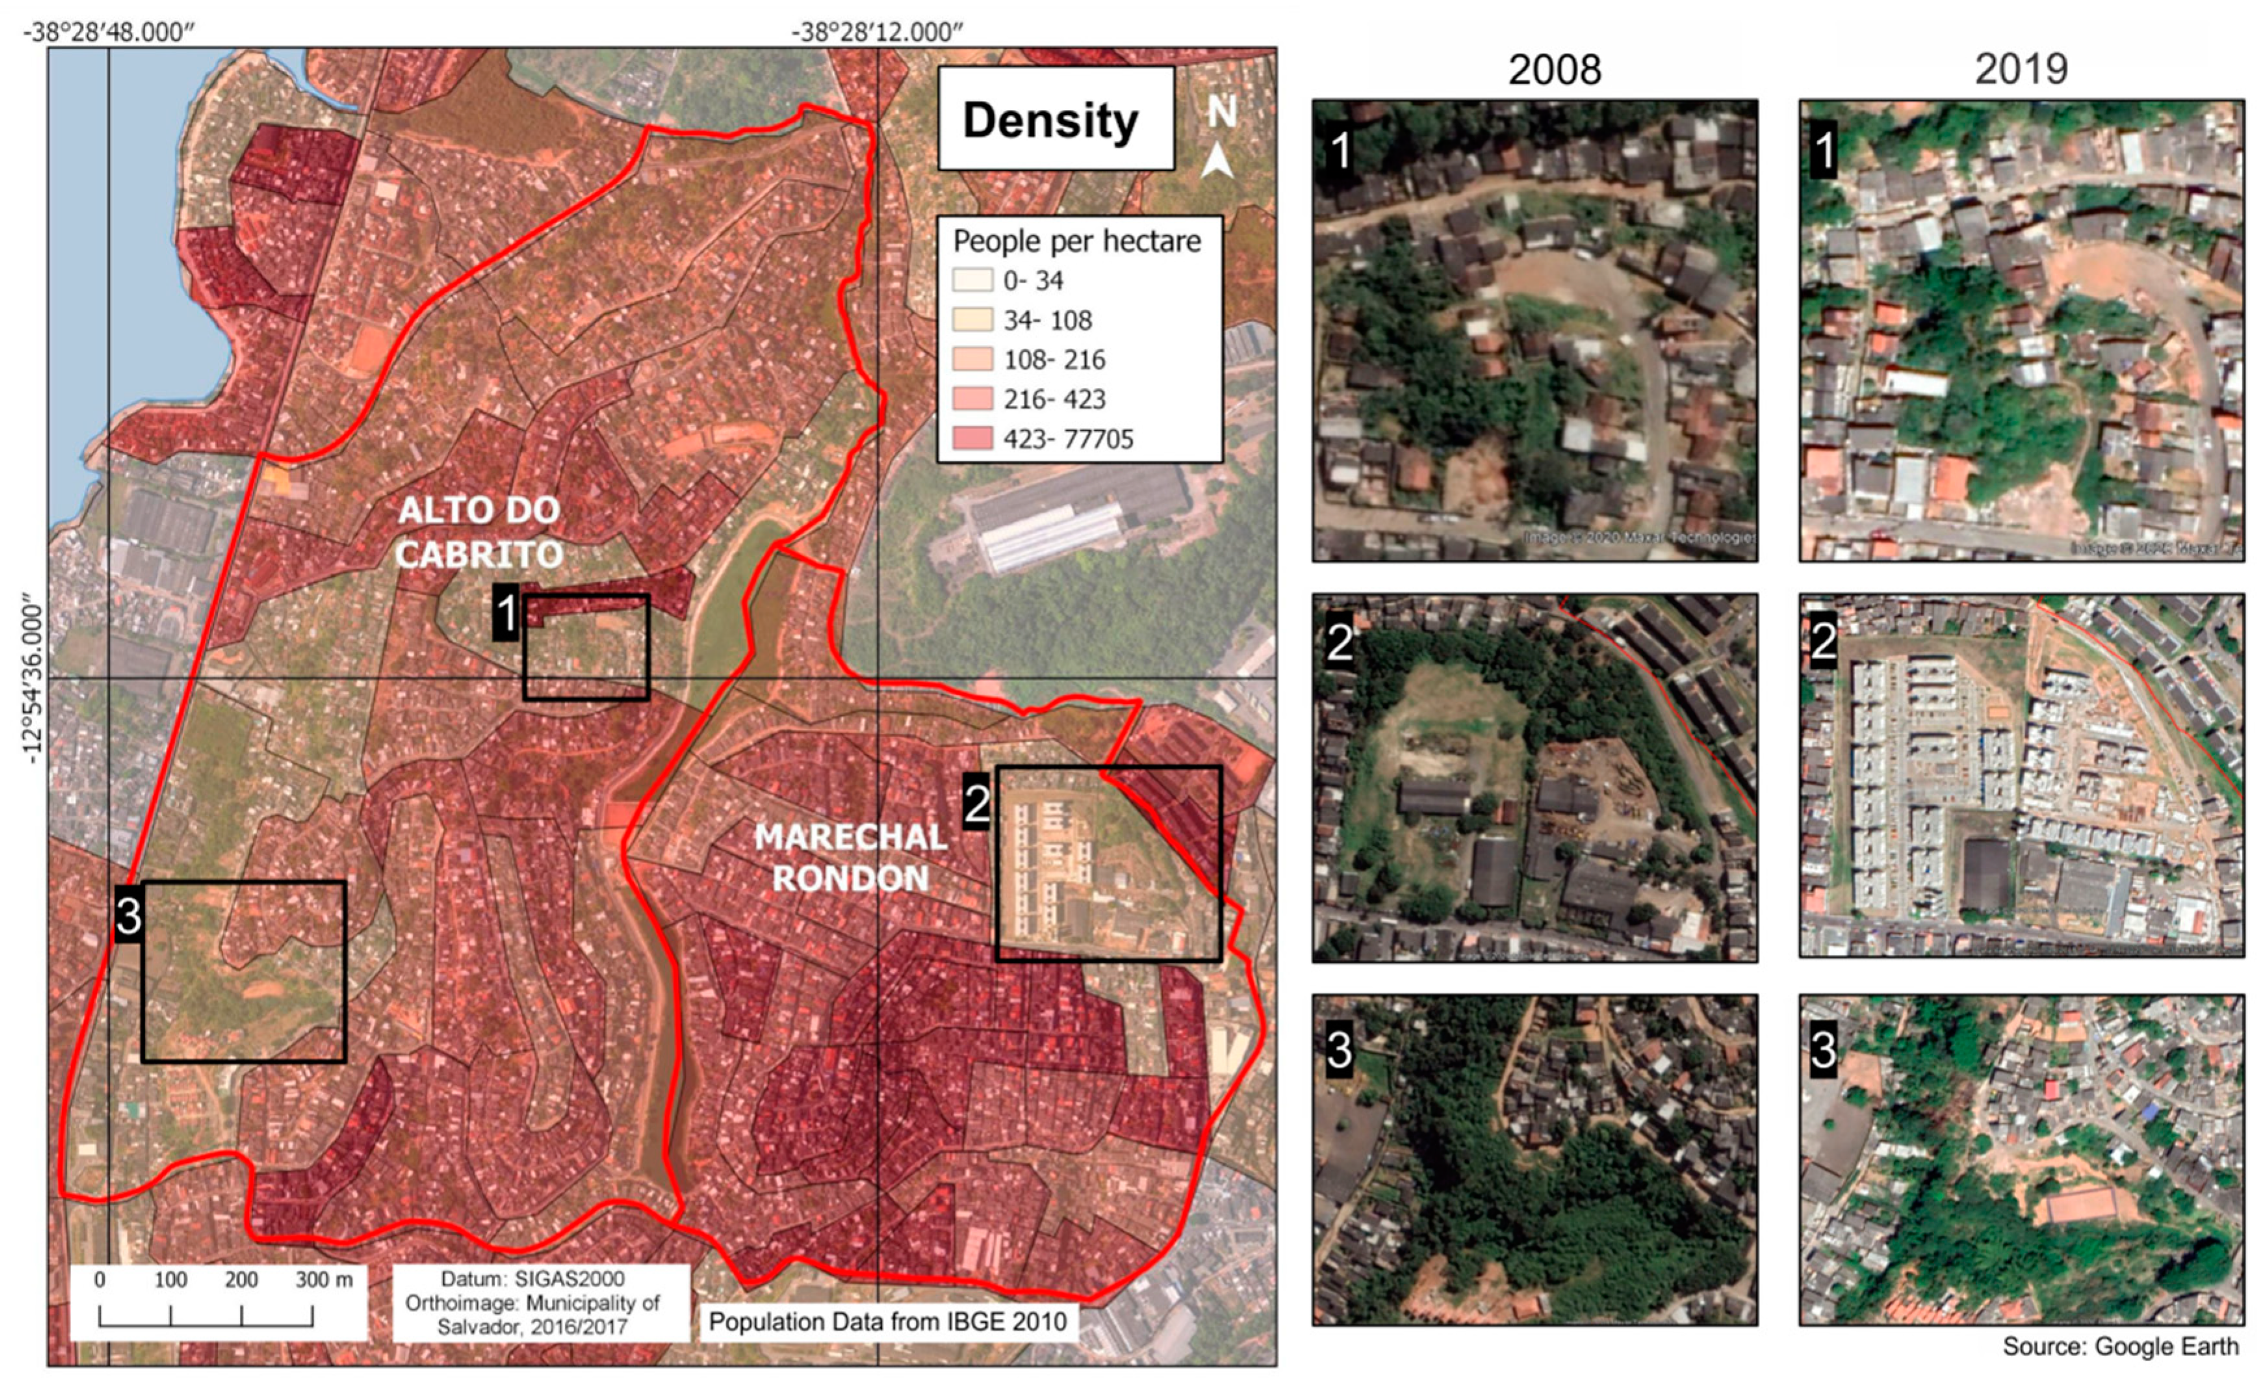
2.2. The Use Case of Spatial Data to Support COVID-19 Responses in Salvador, Brazil

To analyze the potential of spatial, in particular EO, data to support COVID-19 responses, we used a local case of slum communities in Salvador, Brazil, where several authors have detailed local knowledge. This allowed assessing three main questions:
  • What are the key spatial (EO) data needed to understand physical variations (spatial patterns) of COVID-19 infections?
  • What are the key spatial (EO) data needed to support local (municipal but also community-based) responses to prevent and respond to COVID-19 cases?
  • What are the specific spatial (EO) data needed to support slum communities (e.g., to support community-based organizations)?
These questions are taken up in Section 3 and used to review the existing data in the city of Salvador (Brazil) and their potential to fill existing data gaps in COVID-19 responses while also critically discussing their limitations.

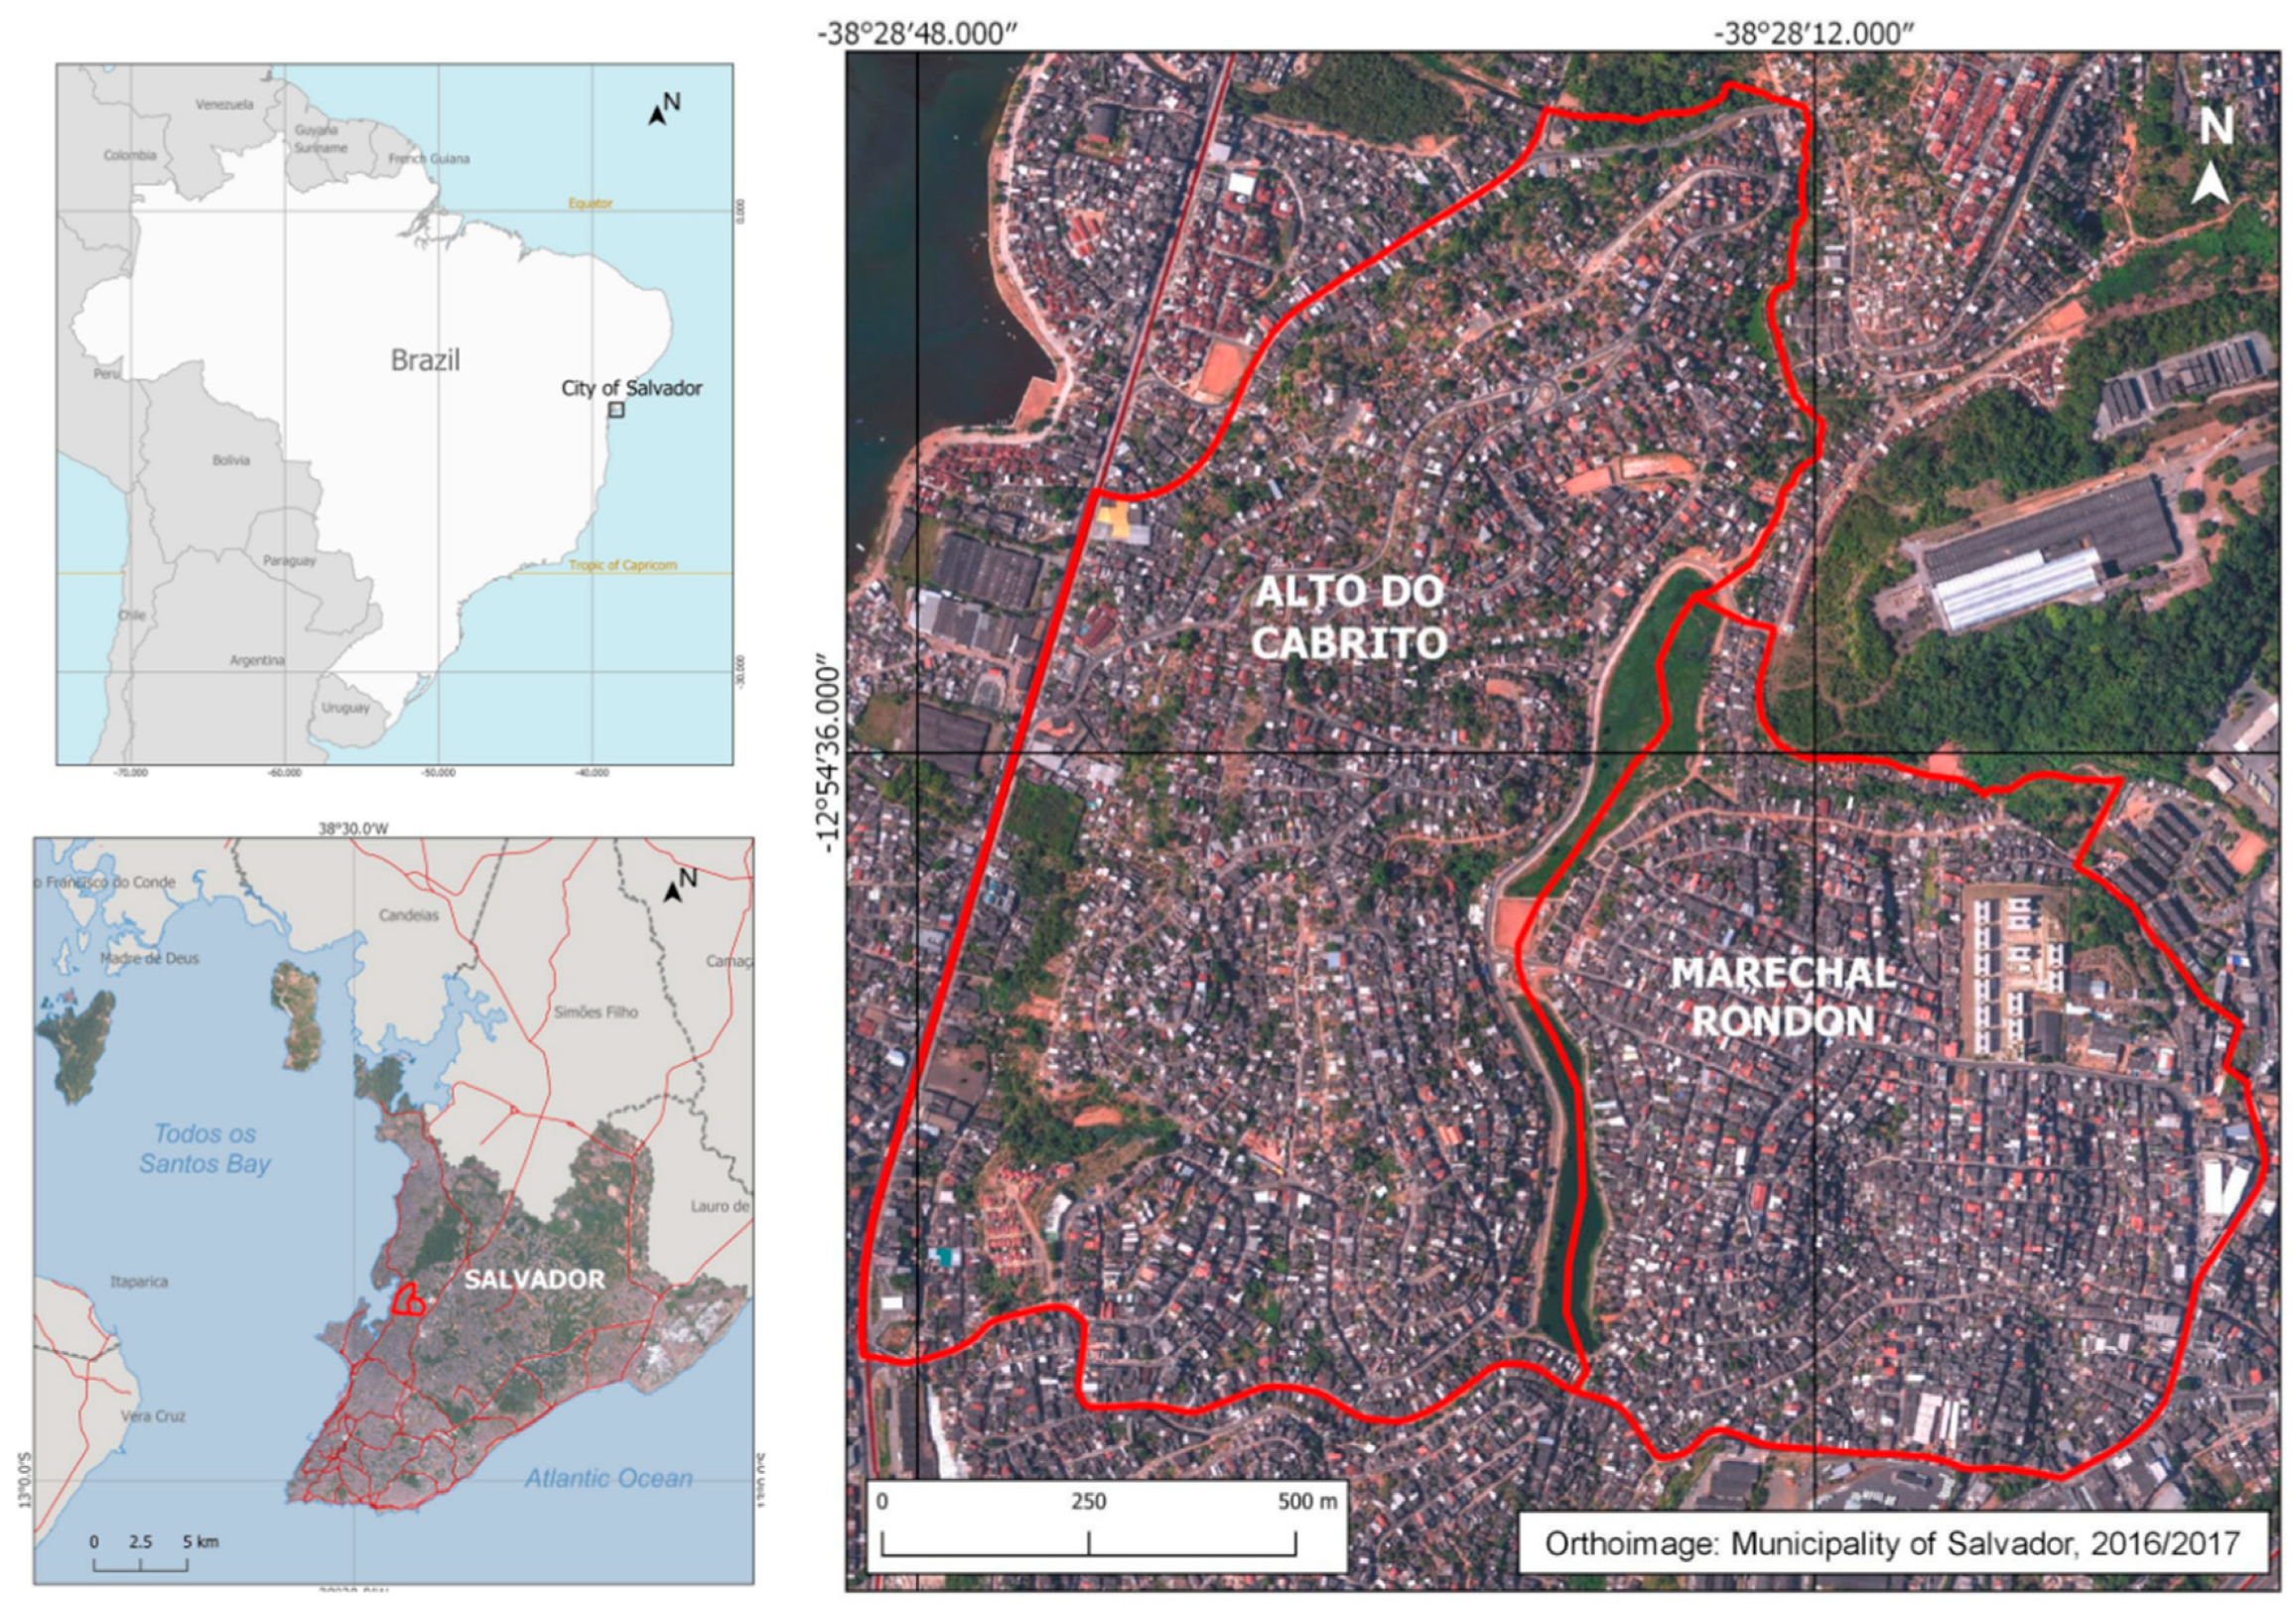
3. The Case of Salvador in Brazil

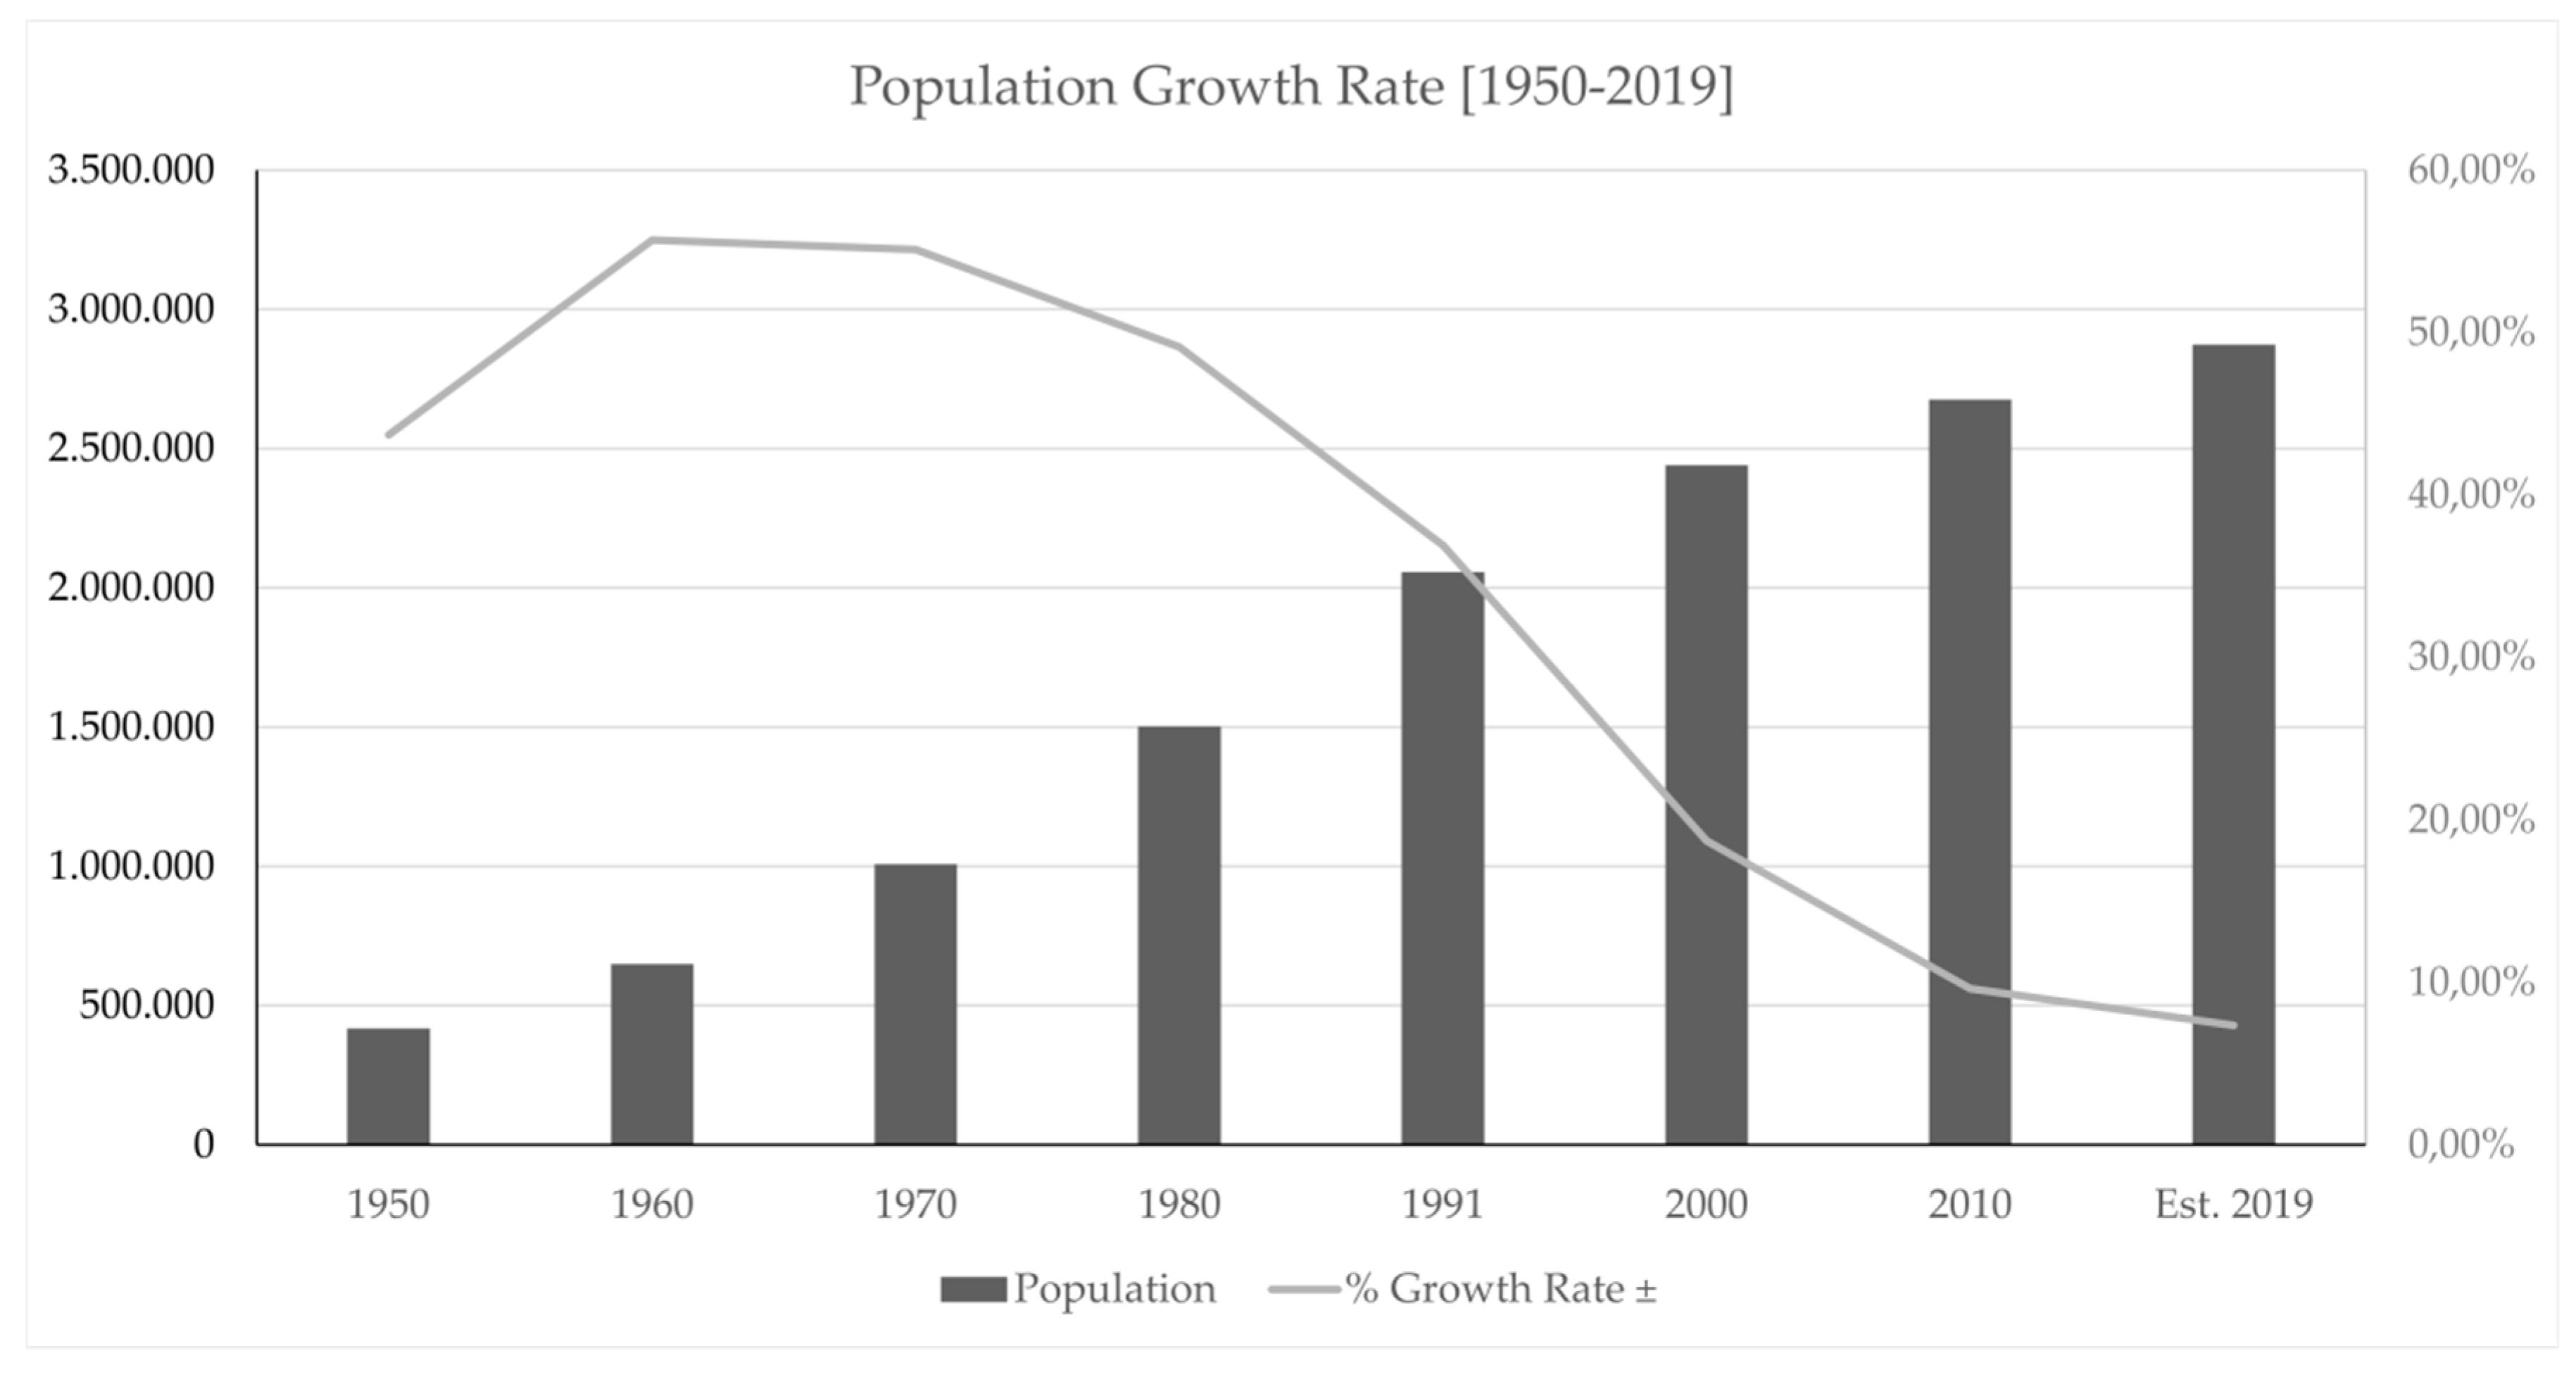
3.1. The General Context of Salvador

The city of Salvador is located on the coast of northeastern Brazil (Figure 3). Founded in 1549, it had its most significant expansion between the 1950s and 1970s, reaching, in 2019, an estimated population of 2,872,347 million people in the municipality of Salvador (Figure 4), and 3,929,209 million people in its metropolitan region [63].
Salvador has a human development index (HDI) of 0.743 [64] and a GDP of USD 6634 million [64], which can be considered good for the Brazilian reality (9th of the country). However, the city has great social heterogeneity. In December 2019, the Brazilian Institute of Geography and Statistics (IBGE) calculated that 41.83% of the housing units in Salvador are within subnormal agglomerates or in precarious areas [57]. In such areas, inhabitants face deprived living conditions, making the city the third with an absolute number of housing units in slums, following São Paulo and Rio de Janeiro. With another assessment called LIT (Territorial Information Assessment) [65], made by IBGE in 2013 using the 2010 census results and EO data from 2010 to 2013, Gomes and Pedrassoli [66] pointed out that about 50% of the households in Salvador slums occupy areas with a slope higher than 30%. Furthermore, 87% of slum households had two or more floors, and 94% of the households had virtually no space between them.

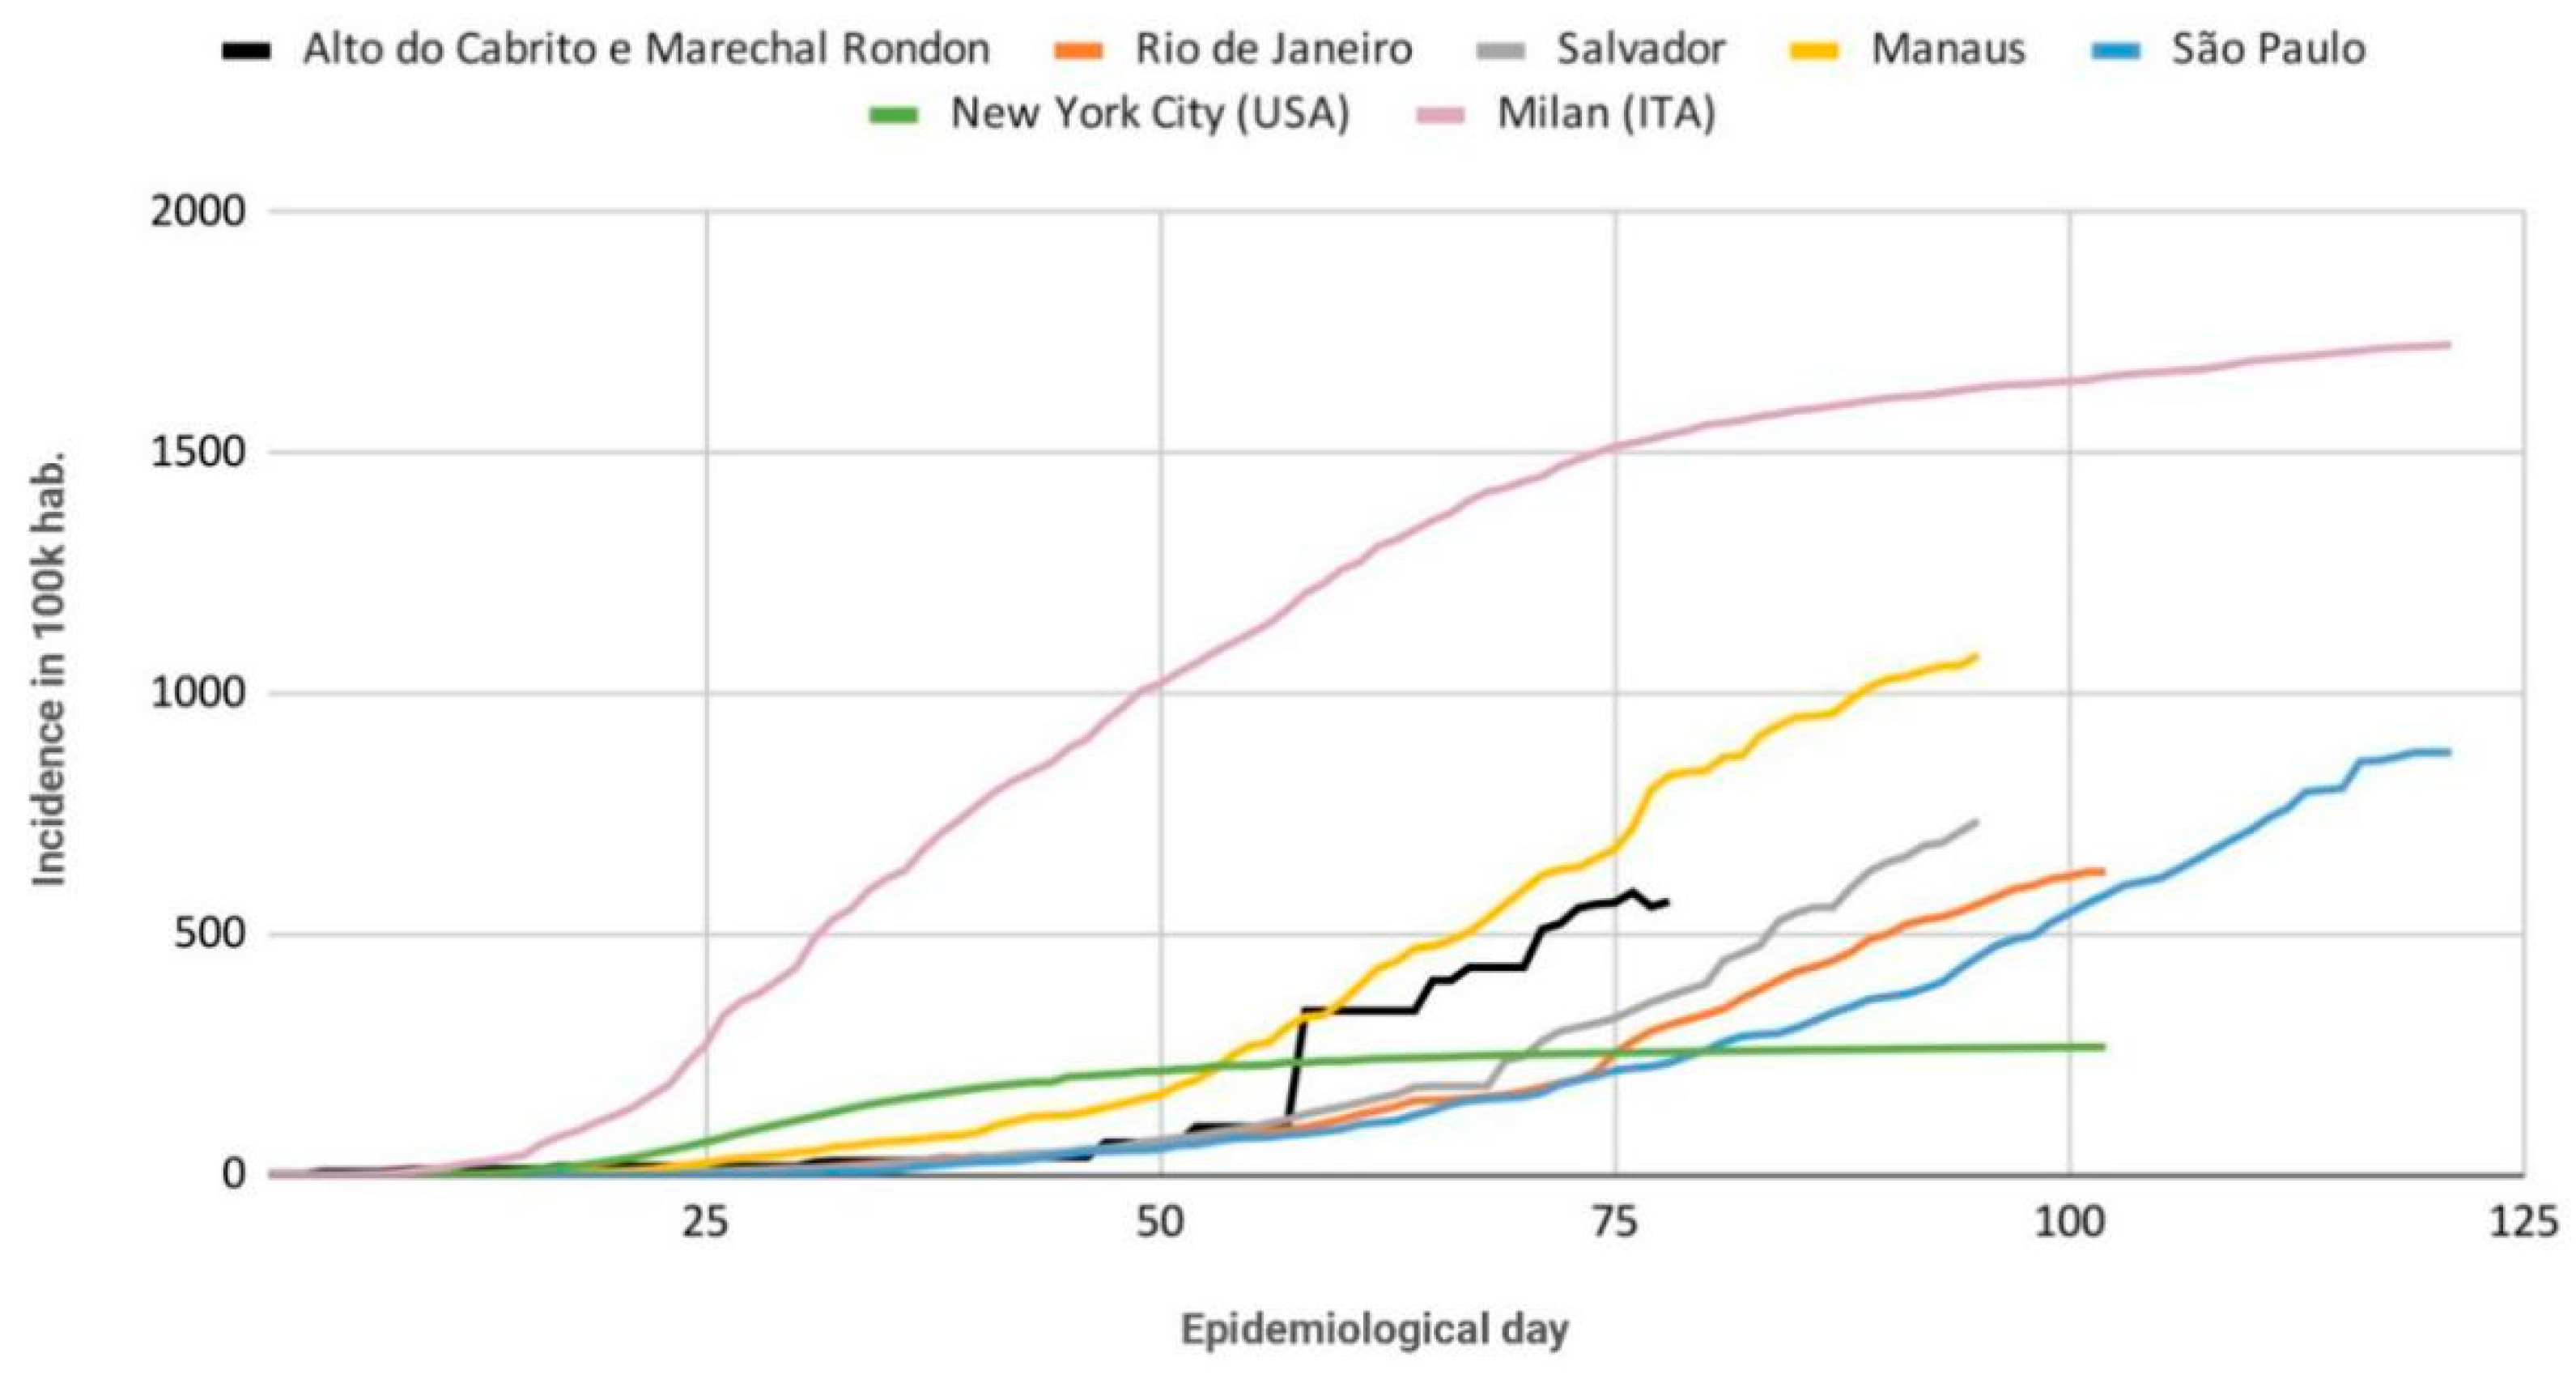
3.2. COVID-19 Crisis in Salvador

The city’s first COVID-19 case was registered on March 13, and it was a case imported from Spain. The expansion of the disease in Salvador is worse than in São Paulo and Rio de Janeiro, but not as bad as Manaus, where the health system has already collapsed. When comparing Salvador’s curve to two other large cities well known for their high transmission rates, it is possible to see that Brazilian cities did well, in the beginning, in holding back the growth of the disease, but the rates kept growing, passing New York City’s stabilization rate and reaching not too far from the slope of Milan’s curve. Thanks to the new ICUs at the campus hospital, occupation rates did not reach 100%. However, on June 26, they were at 83%. After June, during the holiday period, many people visit their families in the countryside. Therefore, it is expected that many new cases will appear which will increase the demand for the state capital (Salvador) health infrastructure after the summer break (Figure 5).

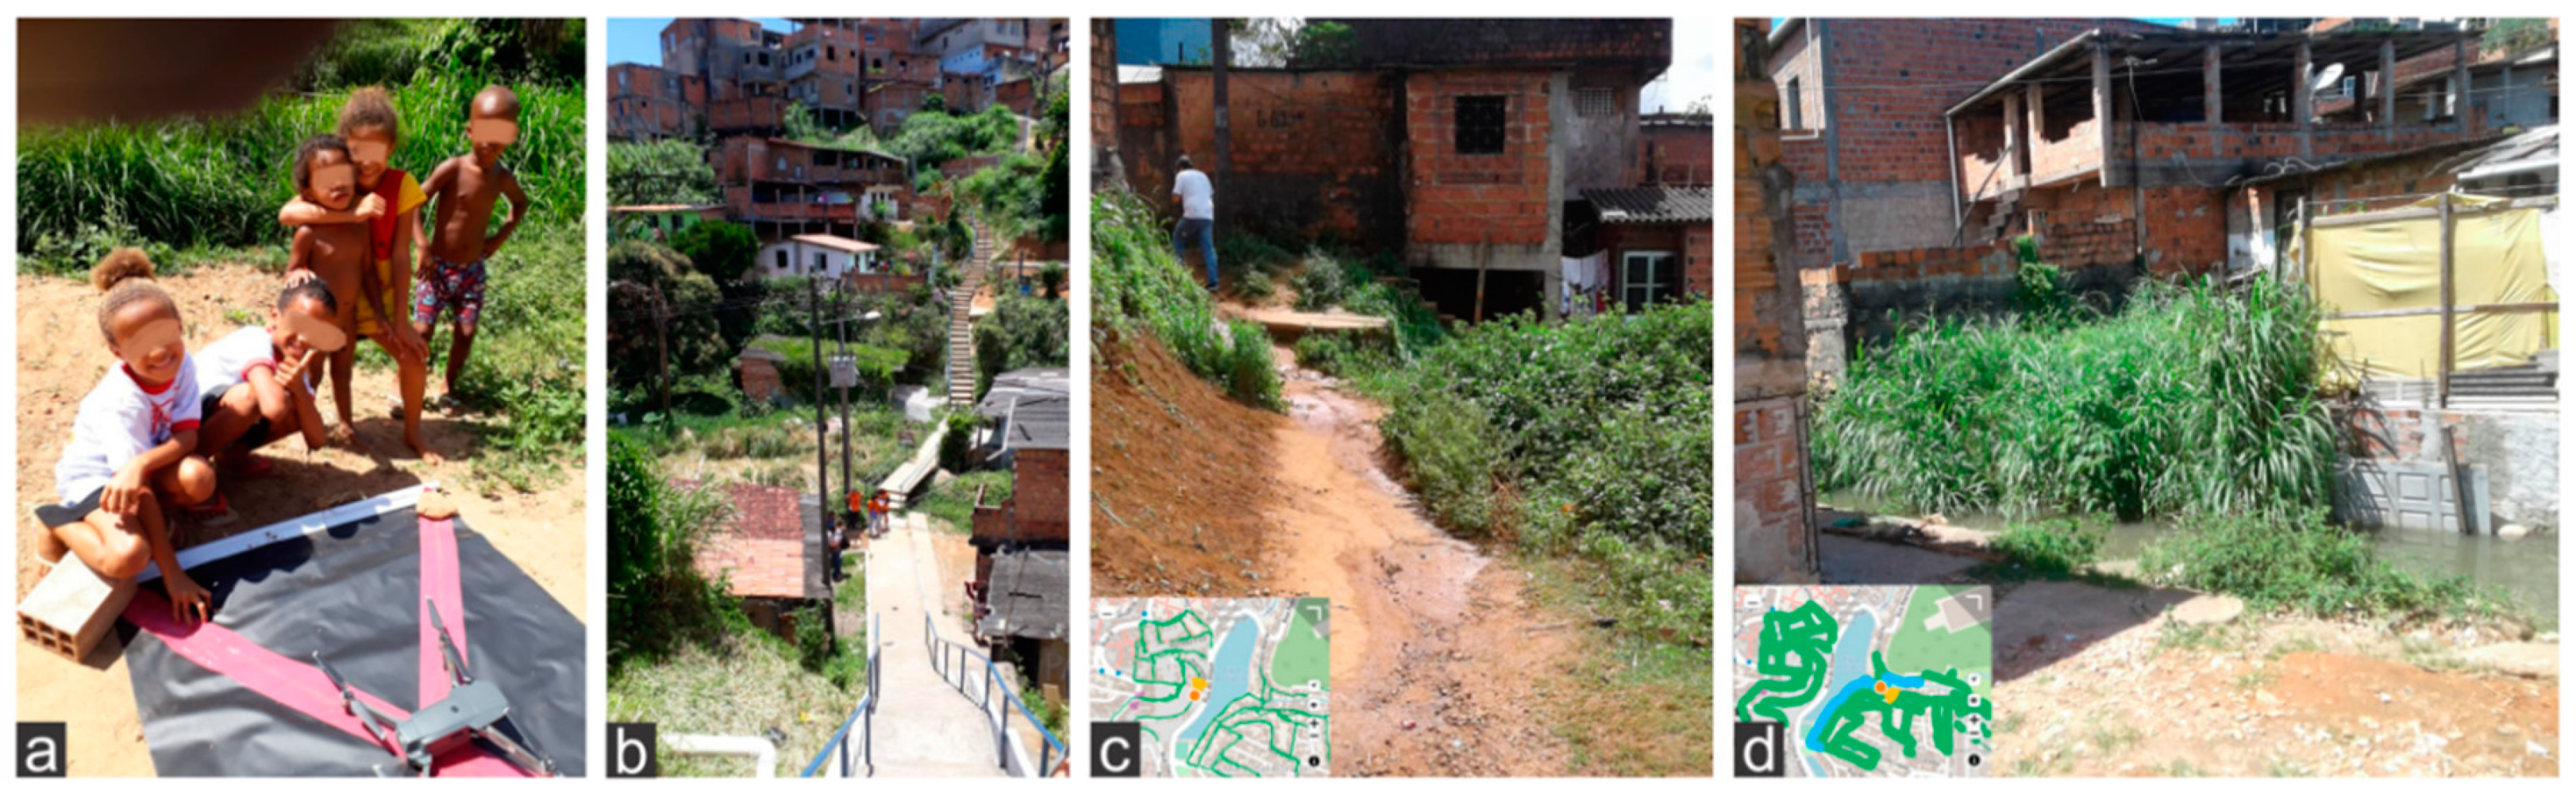
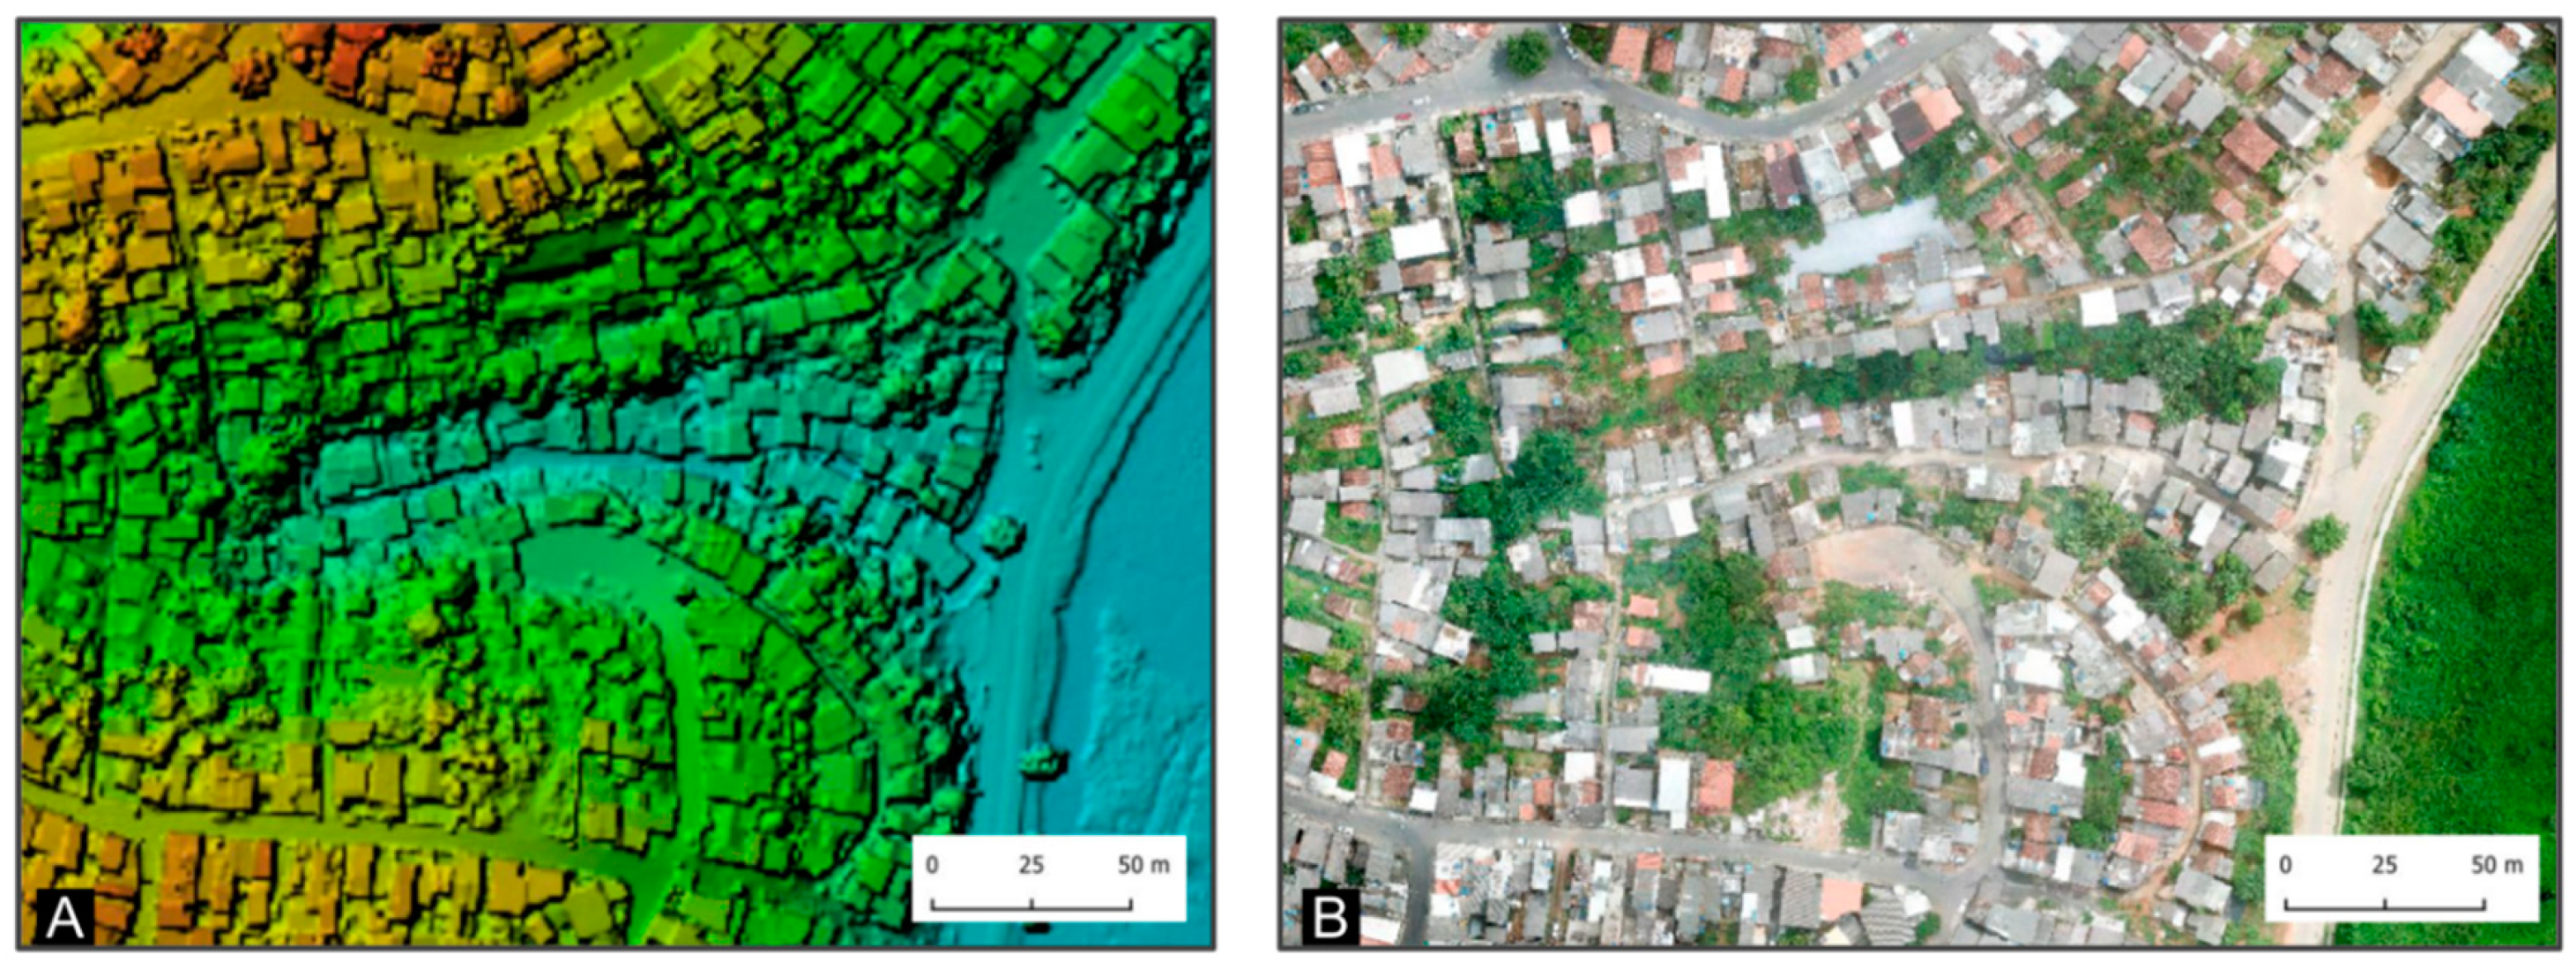
3.3. Examples of Spatial Data to Support COVID-19 Responses

To analyze the specific spatial data needs for deprived communities in the COVID-19 context, we used the example of two areas where the group has established long-standing research on infectious diseases [67,68] and a partnership with community representatives. The neighborhoods of Alto do Cabrito (AC), and Marechal Rondon (MR) are in a peripheral region of the city (Figure 3). According to IBGE census data in 2010, it has a total of 36,521 dwellers, with 19,470 inhabitants in MR and 17,051 inhabitants in AC. Although the neighborhoods have internally different degrees of deprivation, these differences are relatively small compared to other neighborhoods in the city. In 2010, the two neighborhoods had a human development index (HDI) considered average, with values ranging from 0.647 to 0.712 [69]. The two areas had 31% of households with an income of half of the minimum wage per capita or less, which corresponded to USD 9.70 per day per person. About 99% of households had access to a water supply and 98% to sewerage systems [70]. The population over 60 years old was 3330 (8.5%), the illiteracy rate among youths aged between 7 and 18 years was 95% [70], and 34% of households had more than two people per bedroom [69]. As the graphic in Figure 5 shows, the COVID-19 incidence rate in the two neighborhoods was higher than in the average of the city of Salvador. It took 78 days after the first case was registered in the area. This sums up to a total of 208 cases and an incidence rate of 569.5 cases per 100,000 inhabitants.
These two neighborhoods have four community associations that have been acting in accordance with WHO guidelines, state, and municipal government. Even so, leaders reported a large circulation of people and crowded situations at religious ceremonies, commerce, or even at soccer events and parties. Additionally, intermittent water supply services, serious financial difficulties for informal workers, and the existence of more families that, due the pandemic, depend on donations to feed themselves have increased given the delay and difficulty in accessing emergency government assistance. Figure 6 shows the population density based on census tract data from 2010 for the two settlements. In general, the areas have not changed much since the last census. However, in the highlighted areas 1, 2, and 3, changes have been observed. In addition, to visualize these changes, fragments from Google Earth images from 2008 and 2019 are shown.
From Figure 6, it became clear that the biggest changes occurred in the area shown in image 2. To explore these changes in more detail, we used UAV images (Figure 7, Figure 8 and Figure 9) with the respective digital elevation model (DEM) information. The images were acquired with a Mavic Pro drone in two subsequent flights: one in a linear way with the camera at 90° (nadir), and a second flight with the camera configured in an oblique view (45°). As a result, 557 images were acquired for both neighborhoods of Alto do Cabrito and Marechal Rondon in June and July 2019, and processed by Agisoft Photoscan Pro software using the Structure from Motion (SfM) algorithm. The results of the 3D point cloud model and the 2.8 cm spatial resolution orthophoto are shown in Figure 8. In addition, an extended view of the oblique images is visualized in Figure 8.
The UAV data helped in the estimation of floors per building by subtracting the digital surface model values from the digital terrain model values. Having oblique images, the façades of the buildings were visible; therefore, based on the number of windows, building density, and the estimated number of floors, a population estimation could be done [71]. This is an important aspect to consider since population numbers vary from different data sources, especially when global and local data are compared. Such bottom-up population estimates commonly reflect the actual population numbers of slums much better as compared to top-down estimates (typically based on census data which have low temporal granularity and often large data gaps in slums) [72,73]. The results of a global top-down model are shown in Figure 10. This globally available population dataset allows users to indicate areas of interest and provide population counts and age distributions, both being relevant aspects of assessing vulnerabilities. However, population data for slum areas typically have high uncertainties.
Having the precise number of residents and their space distribution in slums is important for the correct dimensioning of humanitarian aid, such as the provision of basic food and hygiene kits or masks. It is also important for planning COVID-19 testing campaigns since the number of tests is very limited and requires statistical sampling calculation. By comparing the census statistics with a global population dataset (Figure 7), differences can be observed. In the area presented for this research, depending on the source of information, the total population of the area in 2020 may vary by more than 20% (7064 inhabitants), as shown in Table 3. In these neighborhoods, the population increase occurred mainly in residential condominiums that are not characterized as slums.
Details on the demography and morphology of slums are also very relevant to understand their vulnerabilities. For example, communities with high population densities and large numbers of people above 60 years old are more vulnerable as compared to lower density areas with less senior inhabitants [75]. In Figure 10, the spatial variations within the two settlements in terms of built-up density variations are visible. Adding the height information allows us to indicate areas of standing water (sinks), which could be reservoirs of several pathogens and breeding places of vector-borne diseases [76]. These places are where rainwater will usually accumulate, signalizing flood-prone areas, adding humidity and insalubrity to the interior of the house [23]. From Figure 9d, it is possible to identify blocks of houses that are less than 2m apart, making their proximity another essential component for virus transmission [19]. This information may help local health agents to define priority surveillance areas for COVID-19 testing and monitoring when a resident is diagnosed with the disease.
Thus, to support COVID-19 responses, accurate and up-to-date locational, physical, environmental, socio-economic, and population data are required. However, census-based data available in rapidly growing cities are usually out-of-date by the time they are used, and often have much higher uncertainties and data gaps in slums. EO data are commonly used to update outdated census-based population data. However, top-down population estimates (e.g., WorldPop or LandScan) combine census, spatial, and EO data [77,78], and consequently also suffer from data gaps in slums. Top-down approaches commonly use census data (e.g., aggregated ward population), which are disaggregated to smaller spatial units using ancillary data (e.g., land-cover), resulting in disaggregated spatial representations of the census population distribution. Therefore, bottom-up population estimation models are often more suitable to provide realistic population data for the local context of slums. Bottom-up models typically combine spatial data (e.g., building outlines and the height of buildings, such as extracted from UAVs) with local data (e.g., from NGOs, surveys, and Volunteered Geographic Information (VGI)) to model the variation of the built-up area per person ratio across the city. The outputs produce localized estimates of the population densities.
Such bottom-up models have been used as complementary approaches to fill important data gaps in the COVID crisis response in Salvador by non-governmental and academic groups. One example is the GeoCombate COVID-19 BA that has used OSM pedestrian pathway data associated with digital terrain model data of Salvador to calculate walking times for elderly or infirm people to their closest public health care unit. The study has shown the urgent demand for safe alternative transportation to support suspected COVID-19 patients since this population does not have their own vehicle and must not use public transport [29]. The same group has also started a campaign in Humanitarian Open Street Map (HOT) Task Manager to add to OSM information about informal commercial and service buildings classified as local trip attractor agglomeration points. Concentrations of market places, convenience stores, and bank agencies, among others, need to be combined with the location of health facilities, population distribution, and roads indicating priority areas for public hygiene equipment installation, street disinfection, sensibilization campaigns, COVID-19 test application, etc. [29]. These actions will support appropriate health strategies and responses in slums.

4. Discussion

It is important to go back to the initial concept of COVID-19 risks, which characterized the risks and impacts of COVID-19. Inhabitants of favelas are most vulnerable to the increase in transmissions of the disease. They are more vulnerable due to the pre-existing precariousness that reflects on the health of residents and on the access to services and resources for fighting against the disease. In slums, the majority of inhabitants cannot perform a home office regime; most inhabitants need to continue working. For example, many inhabitants are essential workers and their livelihood depends on being in contact with people. Thus, inhabitants are required to continue their livelihood activities to feed their families. This, combined with the need to use public transport, increases their risks of getting the disease. EO-based data can help reveal these conditions and provide information about the spatial context and stress demands for help from public institutions and calls for humanitarian support. The disease does not originate in slums, and slums are not the disease. “Fighting the pandemic requires more than technical solutions based on data. It is essential to establish a political commitment that involves the whole of society for the protection of the peripheral population during and after the pandemic” [79].
Findings from the review of data gaps and available EO-based data sources for the case study have been summarized in Figure 11. In general, in Salvador and all other municipalities of Brazil, the last census was conducted 10 years ago, and the non-homogeneous way in which the city grows constitutes the first obstacle for the development of effective and spatially explicit actions. The second obstacle is the lack of zoning, where it is recognized that there are areas occupied by residents living in different conditions of precariousness. Third, it would be important to exclude, from the limits of the census, tract areas where there are no dwellings. This would allow a better assessment of densities. Fourth, the lack of knowledge on the location of small or informal activities is also an obstacle to the identification of places likely to have great exposure to the virus. These places need organization, street disinfection, hygiene equipment, mass testing, and other protection measures. Closing such places should be avoided as much as possible, as this would counteract with the local economy and financial rehabilitation of the community. For example, as observed in many African cities, the hunger crisis caused by the COVID-19 lockdown measurements is very serious [80]. Given the rugged topographic characteristic of the city, information extracted from the digital terrain model is relevant for pedestrian accessibility to health facilities and for the identification of valleys where residents are more exposed to unhealthy conditions. A public regulation agency, primary health care programs of the city hall, and community-based organizations have shown great interest in the use of vulnerability indicators, among other information, generated with the support of EO data. EO data would allow us to define priority sites for multisectoral health campaigns, and to carry out preventive surveys on essential services, such as water supply, garbage collection, and the combat against vector-borne diseases, which add to the vulnerabilities in slums.
In essence, EO-based data, along with auxiliary spatial information, would bridge data gaps by complementing the spatial dimension and helping to identify the spatial foci for COVID-19 control measurements. Thus, this would allow knowing where vulnerable groups and individuals are, who they are, and how people are exposed. Specifically, the EO-based approach supports the answer to “how people are exposed” by providing spatiotemporal information encoding different aspects of vulnerability. For instance, static information can be derived about the location of groups and individuals, the density of dwelling units and population, the environmental context of households and communities, as well as dynamic information of potential movements, along with road networks, facility accessibility, and relocation and development of households. Most importantly, the EO-based information could be ensured by timely access and used for either post-pandemic management or future risk preparedness. In summary, the study case has shown and/or discussed that EO-based approaches could support:
(1)
Rapid problem-oriented data acquirement;
(2)
Rapid and timely access to information encoding spatiotemporal dynamics of disease exposure in a household or area;
(3)
Assessment of the vulnerability level of an area or household in terms of information regarding density, facility accessibility, and environmental context;
(4)
Measurement of different aspects of vulnerability;
(5)
Estimation and prediction of the population at risk.
The strengths shown here also answer the questions posed in Section 2.2. In addition, EO-based products could be reasonably aggregated to different levels, for instance, from household level to community level, and thus are also suitable for area-level mapping, and, therefore, are very relevant to support area-based intervention which should address key problems related to health, environmental, and socio-economic conditions [81]. Such area-based mapping is complementing household-level information about deprivation (poverty), e.g., captured by surveys. To effectively target vulnerable populations in the context of COVID-19, we need to understand both the vulnerabilities of “slum households” and the area level risks inhabitants face when living in slums. Therefore, openly accessible, up-to-date, and accurate maps and images of slums in LMICs are essential to ensure relevant COVID-19 responses. However, most LMIC cities do not yet have operational spatial data systems in place that could support responses. Spatial data are urgently required to locate slum areas and support COVID-19 responses by local authorities, civil society organizations, and aid agencies. After the end of lockdown measurements, when economies reopen, slum maps will be extremely valuable to develop recovery strategies (e.g., economic recovery) and to manage COVID-19 s-wave outbreaks with context-relevant interventions while ensuring local access to health care, food, and basic necessities. To create maps that support COVID-19 responses and recovery, the global EO community can support local governments in developing spatial databases that are accessible to all groups of stakeholders but also respect privacy and data ethics. It will be important that such spatial databases include base maps, but also demographic and socio-economic information. The use of VGI platforms and community contributions, such as Open Street Map, can be of great help to convert EO data into vector-classified ready-to-use data, especially in places such as LMIC cities and slums, with few investments on mapping [55,82,83]. It has great potential for engagement in crisis situations and, as an external outcome, may also help raise risk awareness, citizen empowerment, and community resilience [54,84,85]. Sufficient and up-to-date data will support much more tailored COVID-19 responses as compared to present responses. At the moment, slums are requested to follow general health guidelines developed in Europe or North America without a clear understanding of how they need to be adapted to local conditions and also between different types of slums (e.g., considering differences in development stage, environmental, physical and socio-economic conditions). In this respect, too little attention is given to combine community-based data with available data products for adapting recommendations to communities, or even, more appropriately, to co-develop measurements with communities. Therefore, listening to the voices and needs of communities and using rich community-based data are critical to develop solutions that are also understood and accepted by communities in LMICs.

5. Conclusions

Illustrated by the case of Salvador, Brazil, a city with a large number of slum communities, we showed that extensive data gaps exist in the location and the physical, environmental, socio-economic, and demographic characteristics of slums. This prevents effective responses that are tailored to the needs and realities of the communities. Therefore, we explored the potential of EO data, which can provide urgently required base data. However, available global spatial datasets are not sufficiently equipped to be fully operational for local responses. The locally very rich open data repository, available for many cities in Brazil, has enormous potential for answering key questions. Such questions are related to physical (e.g., the location of high densities) risks, access to services, environmental risks, and open spaces and would allow for updating the very outdated census data. Optimally, these EO-based data need to be combined with community-based data, which could use VGI methods (e.g., data collected via mobile phones) to avoid risks during data collection. Such rich, up-to-date, and spatially detailed data will be the first step towards community-based COVID-19 responses.

Author Contributions

Conceptualization—Patricia Lustosa Brito, Monika Kuffer, Jiong Wang, Mila Koeva, and Julio Cesar Pedrassoli; writing—original draft: Patricia Lustosa Brito, Monika Kuffer, Jiong Wang, Mila Koeva and Julio Cesar Pedrassoli; introduction: Patricia Lustosa Brito, Monika Kuffer, Jiong Wang, Mila Koeva, Anderson Dias de Freitas, Julio Cesar Pedrassoli and Federico Costa; materials and methods: Patricia Lustosa Brito, Monika Kuffer, Jiong Wang, Mila Koeva, Anderson Dias de Freitas, Julio Cesar Pedrassoli and Federico Costa; results: Patricia Lustosa Brito, Monika Kuffer, Jiong Wang, Anderson Dias de Freitas, Julio Cesar Pedrassoli and Federico Costa; discussion and conclusions: Patricia Lustosa Brito, Monika Kuffer, Jiong Wang and Julio Cesar Pedrassoli; review and editing: Patricia Lustosa Brito, Monika Kuffer, Jiong Wang, Mila Koeva, Anderson Dias de Freitas, Julio Cesar Pedrassoli and Federico Costa. All authors have read and agreed to the published version of the manuscript.

Funding

This work was supported by the Medical Research Council of the United Kingdom, grant number MR/P024084/1, the Wellcome Trust (218987/Z/19/Z), the National Council for Scientific and Technological Development—CNPq, Coordenação de Aperfeiçoamento de Pessoal de Nível Superior—Brasil (CAPES)—Finance Code 001. The research of M.Ku. pertaining to these results received financial aid from the Netherlands Organisation for Scientific Research (NWO), grant number VI. Veni. 194.025.

Acknowledgments

The authors thank the editor of the International Journal of Geo-Information and the anonymous reviewers for their valuable comments.

Conflicts of Interest

The authors declare no conflict of interest.

References

  1. Ghebreyesus, T.A. WHO Director-General’s Opening Remarks at the Media Briefing on COVID-19-11 March 2020. Available online: https://www.who.int/dg/speeches/detail/who-director-general-s-opening-remarks-at-the-media-briefing-on-covid-19---11-march-2020 (accessed on 20 July 2020).
  2. Holden, M. COVID-19 Death Rate in Deprived Areas in England Double That of Better off Places: ONS. Available online: https://www.usnews.com/news/world/articles/2020-05-01/covid-19-death-rate-in-deprived-areas-in-england-double-that-of-better-off-places-ons (accessed on 13 July 2020).
  3. Iacobucci, G. COVID-19: Deprived areas have the highest death rates in England and Wales. BMJ 2020, 369, m1810. [Google Scholar] [CrossRef] [PubMed]
  4. Corburn, J.; Vlahov, D.; Mberu, B.; Riley, L.; Caiaffa, W.T.; Rashid, S.F.; Ko, A.I.; Patel, S.; Jukur, S.; Martínez-Herrera, E.; et al. Slum Health: Arresting COVID-19 and Improving Well-Being in Urban Informal Settlements. J. Urban Health 2020, 97, 348–357. [Google Scholar] [CrossRef] [PubMed] [Green Version]
  5. Codeço, C.T.; Villela, D.; Coelho, F.; Bastos, L.S.; Carvalho, L.M.; Gomes, M.F.C.; Cruz, O.G.; Lana, R.M. Risco de Espalhamento da COVID-19 em Populações Indígenas: Considerações Preliminares Sobre Vulnerabilidade Geográfica e Sociodemográfica. Available online: https://agencia.fiocruz.br/sites/agencia.fiocruz.br/files/u91/relatorios_tecnicos_-_covid-19_procc-emap-ensp-covid-19-report4_20200419-indigenas.pdf (accessed on 26 August 2020).
  6. Ferrante, L.; Fearnside, P.M. Protect Indigenous peoples from COVID-19. Science 2020, 368, 251. [Google Scholar] [CrossRef] [PubMed] [Green Version]
  7. Terri, H. How COVID-19 Could Destroy Indigenous Communities—BBC Future. Available online: https://www.bbc.com/future/article/20200727-how-covid-19-could-destroy-indigenous-communities (accessed on 26 August 2020).
  8. Department of Economic and Social Affairs Indigenous Peoples & The COVID-19 Pandemic: Considerations. Available online: https://www.un.org/development/desa/indigenouspeoples/wp-content/uploads/sites/19/2020/04/COVID19_IP_considerations.pdf (accessed on 26 August 2020).
  9. Lainhart, W.; Dutari, L.C.; Rovira, J.R.; Sucupira, I.M.C.; Povoa, M.M.; Conn, J.; Loaiza, J.R. Epidemic and Non-Epidemic Hot Spots of Malaria Transmission Occur in Indigenous Comarcas of Panama. PLoS Negl. Trop. Dis. 2016, 10, e0004718. [Google Scholar] [CrossRef]
  10. UN Department of Economic and Social Affairs Population Division. World Urbanization Prospects. The 2018 Revision; United Nations: New York, NY, USA, 2019; Volume ST/ESA/SER.A/420.
  11. UN-Habitat Slums almanac 2015-16. Tracking Improvement in the Lives of Slum Dwellers; UN-Habitat: Rio de Janeiro, Brazil, 2016. [Google Scholar]
  12. Gevaert, C.M.; Kohli, D.; Kuffer, M. Slums, Informal Areas, or Invisible Cities? Mapping the “Missing Spaces”—JURSE 2019. Available online: http://jurse2019.org/special-session-slums-informal-areas-or-invisible-cities-mapping-the-missing-spaces/ (accessed on 13 July 2020).
  13. Mocnik, F.; Raposo, P.; Feringa, W.; Kraak, M.-J.; Köbben, B. Epidemics and pandemics in maps—The case of COVID-19. J. Maps 2020, 16, 144–152. [Google Scholar] [CrossRef]
  14. Wilkinson, A. Local response in health emergencies: Key considerations for addressing the COVID-19 pandemic in informal urban settlements. Environ. Urban. 2020, 0956247820922843. [Google Scholar] [CrossRef]
  15. Coltart, C.E.M.; Lindsey, B.B.; Ghinai, I.; Johnson, A.M.; Heymann, D.L. The Ebola outbreak, 2013–2016: Old lessons for new epidemics. Philos. Trans. R. Soc. B Biol. Sci. 2017, 372, 20160297. [Google Scholar] [CrossRef] [PubMed]
  16. Field, C.B.; Barros, V.R. Climate Change 2014: Impacts, Adaptation, and Vulnerability—IPCC WGII AR5 Summary for Policymakers. Available online: https://www.researchgate.net/publication/272150376_Climate_change_2014_impacts_adaptation_and_vulnerability_-_IPCC_WGII_AR5_summary_for_policymakers (accessed on 13 July 2020).
  17. Schneiderbauer, S.; Ehrlich, D. Risk, hazard and people’s vulnerability to natural hazards. A Rev. Defin. Concepts Data. Eur. Comm. Jt. Res. Centre. EUR 2004, 21410, 40. [Google Scholar]
  18. WHO Coronavirus Disease (COVID-19) Advice for the Public. Available online: https://www.who.int/emergencies/diseases/novel-coronavirus-2019/advice-for-public (accessed on 5 May 2020).
  19. Cheong, L.; Da Silva, E.; Gibson, L.; Rush, D. Novel Coronavirus in Cape Town Informal Settlements: Feasibility of Using Informal Dwelling Outlines to Identify High Risk Areas for COVID-19 Transmission From A Social Distancing Perspective. JMIR Public Health Surveill. 2020, 6, e18844. [Google Scholar] [CrossRef]
  20. Marino, A.; Klintowitz, D.; Brito, G.; Rolnik, R.; Santoro, P.M.P. Circulação Para Trabalho Explica Concentração de Casos de Covid-19—LabCidade. Available online: http://www.labcidade.fau.usp.br/circulacao-para-trabalho-inclusive-servicos-essenciais-explica-concentracao-de-casos-de-covid-19/ (accessed on 13 July 2020).
  21. Barber, S.; Roux, A.V.D.; Cardoso, L.; Santos, S.; Toste, V.; James, S.; Barreto, S.M.; Schmidt, M.; Giatti, L.; Chor, D. At the intersection of place, race, and health in Brazil: Residential segregation and cardio-metabolic risk factors in the Brazilian Longitudinal Study of Adult Health (ELSA-Brasil). Soc. Sci. Med. 2018, 199, 67–76. [Google Scholar] [CrossRef]
  22. Unger, A.; Riley, L.W. Slum Health: From Understanding to Action. PLoS Med. 2007, 4, e295. [Google Scholar] [CrossRef] [PubMed] [Green Version]
  23. Hood, E. Dwelling Disparities: How Poor Housing Leads to Poor Health. Environ. Health Perspect. 2005, 113, 113. [Google Scholar] [CrossRef]
  24. Brito, P.L.; Arenas, H.; Lam, N.S.N.; Quintanilha, J.A. Recognition of Urban Patterns Related to Leptospirosis Contamination Risks Using Object Based Classification of Aerial Photography. Test Areas: Informal Settlements of the Railroad Suburb of Salvador, Brazil. In Proceedings of the IEEE International Geoscience and Remote Sensing Symposium (IGARSS 2008), Boston, MA, USA, 7–11 July 2008. [Google Scholar]
  25. Pasternak, S. Habitação e saúde. Estud. Avançados 2016, 30, 51–66. [Google Scholar] [CrossRef]
  26. Cecilia, B.; González, S.; Resistência, E.D.E.; Em, M.; Com, A.; Mellitus, D. Condições ambientais como fator de risco para doenças em comunidade carente na zona sul de são Paulo. Rev. Aten. Primária Saúde 2005, 13, 20–28. [Google Scholar]
  27. Catapreta, C.A.A.; Heller, L. Associação entre coleta de resíduos sólidos domiciliares e saúde, Belo Horizonte (MG), Brasil. Rev. Panam. Salud Pública 1999, 5, 88–96. [Google Scholar] [CrossRef] [Green Version]
  28. Boadi, K.O.; Kuitunen, M. Environmental and health impacts of household solid waste handling and disposal practices in third world cities: The case of the Accra Metropolitan Area, Ghana. J. Environ. Health 2005, 68, 32–36. [Google Scholar]
  29. Brito, P.L.; Viana, M.S.; Delgado, J.P.M.; Brandão, A.C.; Pedrassoli, J.C.; Pedreira Júnior, J.U.; Souza, F.A. Nota Técnica 04—Alertas e Propostas de Ações para Península de Itapagipe Baseadas em Análises Geoespaciais de Suporte ao Combate à COVID-19; GeoCombate: Salvador, Brazil, 2020. [Google Scholar]
  30. Pedreira, J.J.U.; Delgado, J.P.M.; Pedrassoli, J.C.; Souza, F.A.; Brito, P.L.; Viana, M.S.; Galindo, E.; Brata, A.; Cassiano, A.; Freitas, J.C.A.; et al. Nota Técnica 1—Risco dos Bairros de Salvador ao Espalhamento do COVID-19 Decorrente da Circulação de Pessoas e Condições Socioeconômicas; GeoCombate: Salvador, Brazil, 2020. [Google Scholar]
  31. Kuffer, M.; Thomson, D.R.; Boo, G.; Mahabir, R.; Grippa, T.; VanHuysse, S.; Engstrom, R.; Ndugwa, R.; Makau, J.; Darin, E.; et al. The Role of Earth Observation in an Integrated Deprived Area Mapping “System” for Low-to-Middle Income Countries. Remote Sens. 2020, 12, 982. [Google Scholar] [CrossRef] [Green Version]
  32. Kuffer, M.; Pfeffer, K.; Sliuzas, R. Slums from Space—15 Years of Slum Mapping Using Remote Sensing. Remote Sens. 2016, 8, 455. [Google Scholar] [CrossRef] [Green Version]
  33. Digital Globe Open Data Occasion. Available online: https://www.digitalglobe.com/ecosystem/open-data/covid19 (accessed on 26 August 2020).
  34. Peckham, R.; Sinha, R. Satellites and the New War on Infection: Tracking Ebola in West Africa. Geoforum 2017, 80, 24–38. [Google Scholar] [CrossRef]
  35. Schootman, M.; Nelson, E.J.; Werner, K.B.; Shacham, E.; Elliott, M.B.; Ratnapradipa, K.L.; Lian, M.; McVay, A. Emerging technologies to measure neighborhood conditions in public health: Implications for interventions and next steps. Int. J. Health Geogr. 2016, 15, 20. [Google Scholar] [CrossRef] [Green Version]
  36. Grenzdörffer, G.J.; Niemeyer, F. Uav based brdf-measurements of agricultural surfaces with pfiffikus. Int. Arch. Photogramm. Remote Sens. Spat. Inf. Sci. 2012, 229–234. [Google Scholar] [CrossRef] [Green Version]
  37. Koeva, M.; Muneza, M.; Gevaert, C.M.; Gerke, M.; Nex, F. Using UAVs for map creation and updating. A case study in Rwanda. Surv. Rev. 2016, 50, 312–325. [Google Scholar] [CrossRef] [Green Version]
  38. Koeva, M.; Stöcker, C.; Crommelinck, S.; Ho, S.; Chipofya, M.; Jan, S.; Bennett, R.; Zevenbergen, J.; Vosselman, G.; Lemmen, C.; et al. Innovative Remote Sensing Methodologies for Kenyan Land Tenure Mapping. Remote Sens. 2020, 12, 273. [Google Scholar] [CrossRef] [Green Version]
  39. Chiabrando, F.; Nex, F.; Piatti, D.; Rinaudo, F. UAV and RPV systems for photogrammetric surveys in archaelogical areas: Two tests in the Piedmont region (Italy). J. Archaeol. Sci. 2011, 38, 697–710. [Google Scholar] [CrossRef]
  40. Rinaudo, F.; Chiabrando, F.; Lingua, A.; Spanò, A. Archaeological Site Monitoring: Uav Photogrammetry Can Be An Answer. Int. Arch. Photogramm. Remote Sens. Spat. Inf. Sci. 2012, 39, 583–588. [Google Scholar] [CrossRef] [Green Version]
  41. Akpan, N. Drones Are Taking Pictures That Could Demystify A Malaria Surge: Goats and Soda: NPR. Available online: https://www.npr.org/sections/goatsandsoda/2014/10/22/357637900/drones-are-taking-pictures-that-could-demystify-a-malaria-surge (accessed on 14 July 2020).
  42. Malaver, A.; Motta, N.; Corke, P.; Gonzalez, F. Development and Integration of a Solar Powered Unmanned Aerial Vehicle and a Wireless Sensor Network to Monitor Greenhouse Gases. Sensors 2015, 15, 4072–4096. [Google Scholar] [CrossRef] [PubMed]
  43. Eninger, R.M.; Johnson, R.L. Unmanned Aerial Systems in Occupational Hygiene—Learning from Allied Disciplines. Ann. Occup. Hyg. 2015, 59, 949–958. [Google Scholar] [CrossRef] [Green Version]
  44. Doherty, P.; Rudol, P. A UAV Search and Rescue Scenario with Human Body Detection and Geolocalization; Springer Science and Business Media LLC: Berlin/Heidelberg, Germany, 2007; Volume 4830, pp. 1–13. [Google Scholar]
  45. Gevaert, C.M. Unmanned Aerial Vehicle Mapping for Settlement Upgrading; University Library/University of Twente: Enschede, The Netherlands, 2018. [Google Scholar]
  46. Stöcker, C.; Bennett, R.; Nex, F.; Gerke, M.; Zevenbergen, J. Review of the Current State of UAV Regulations. Remote Sens. 2017, 9, 459. [Google Scholar] [CrossRef] [Green Version]
  47. LiDAR Uses in Disaster Response. Available online: https://www.harrisgeospatial.com/Support/Self-Help-Tools/Help-Articles/Help-Articles-Detail/ArtMID/10220/ArticleID/16108/LiDAR-Uses-in-Disaster-Response (accessed on 14 July 2020).
  48. Elden, S. Secure the volume: Vertical geopolitics and the depth of power. Politi Geogr. 2013, 34, 35–51. [Google Scholar] [CrossRef]
  49. Reavley, N.J.; Pilkington, P.D. Use of Twitter to monitor attitudes toward depression and schizophrenia: An exploratory study. PeerJ 2014, 2, e647. [Google Scholar] [CrossRef] [Green Version]
  50. Lee, K.; Agrawal, A.; Choudhary, A. Real-time disease surveillance using Twitter data. In Proceedings of the the 19th ACM SIGKDD International Conference; Association for Computing Machinery (ACM), Chicago, IL, USA, 11–14 August 2013; pp. 1474–1477. [Google Scholar]
  51. Quercia, D.; Schifanella, R.; Aiello, L.M.; McLean, K. Smelly Maps: The Digital Life of Urban Smellscapes. arXiv 2015, arXiv:1505.06851. [Google Scholar]
  52. Zastrow, M. Crisis mappers turn to citizen scientists. Nature 2014, 515, 321. [Google Scholar] [CrossRef] [PubMed]
  53. Wukich, C. Social media use in emergency management. J. Emerg. Manag. 2015, 13, 281–295. [Google Scholar] [CrossRef] [PubMed]
  54. Boulos, M.N.K.; Resch, B.; Crowley, D.N.; Breslin, J.G.; Sohn, G.; Burtner, R.; Pike, W.A.; Jezierski, E.; Chuang, K.-Y.S. Crowdsourcing, citizen sensing and sensor web technologies for public and environmental health surveillance and crisis management: Trends, OGC standards and application examples. Int. J. Health Geogr. 2011, 10, 67. [Google Scholar] [CrossRef] [Green Version]
  55. Missing Maps Putting the World’s Vulnerable People on the Map. Available online: https://www.missingmaps.org/ (accessed on 26 August 2020).
  56. Magalhaes, T.; Chalegre, K.D.M.; Braga, M.C.; Foy, B. The Endless Challenges of Arboviral Diseases in Brazil. Trop. Med. Infect. Dis. 2020, 5, 75. [Google Scholar] [CrossRef]
  57. IBGE. Aglomerados Subnormais; IBGE: Brasília, Brazil, 2010.
  58. Silva, J.; Barbosa, J.; Biteti, M.; Fernandes, F. O Que é a Favela, Afinal? Observatório de Favelas: Rio de Janeiro, Brazil, 2009; ISBN 9788598881072. [Google Scholar]
  59. IdeaMaps Network Responding to COVID-19 in LMIC Cities: Citizens—Documentos Google. Available online: https://docs.google.com/document/d/19fsQAJZp7DpZT4f5qfcYnNylYMDP_EtmC4hoO7jtJro/edit (accessed on 14 July 2020).
  60. JEI Corona Diaries of the Urban Poor. Available online: https://www.justempower.org/coronadiaries (accessed on 20 July 2020).
  61. WHO. WHO Housing and Health Guidelines; WHO: Geneva, Switzerland, 2018. [Google Scholar]
  62. Hamidi, S.; Sabouri, S.; Ewing, R. Does Density Aggravate the COVID-19 Pandemic? J. Am. Plan. Assoc. 2020, 1–15. [Google Scholar] [CrossRef]
  63. IBGE. Estimativas de população para os municípios e para as Unidades da Federação brasileiros, com data de referência em 1° de julho de 2019. Diário União 28 Agosto 2019. Available online: https://agenciadenoticias.ibge.gov.br/en/agencia-press-room/2185-news-agency/releases-en/25283-ibge-divulga-as-estimativas-da-populacao-dos-municipios-para-2020 (accessed on 20 July 2020).
  64. IBGE. Produto Interno Bruto dos Municípios 2017; IBGE: Brasília, Brazil, 2017; p. 16.
  65. IBGE. Subnormal Agglomerates—About the Publication—2010—Territorial Information. Available online: https://www.ibge.gov.br/en/geosciences/full-list-geosciences/17553-subnormal-agglomerates.html?edicao=17588&t=sobre (accessed on 16 July 2020).
  66. Gomes, J.; Pedrassoli, J. Levantamento de Características de Moradias Em Favelas com o Uso de Drone: Um Experimento na Comunidade do Alto das Pombas, Salvador/Ba. In Proceedings of the III Seminário Nacional sobre Urbanização de Favelas—UrbFavelas, Salvador, Brazil, 21–23 November 2018. [Google Scholar]
  67. Hagan, J.E.; Moraga, P.; Costa, F.; Capian, N.; Ribeiro, G.S.; Wunder, E.A., Jr.; Felzemburgh, R.D.M.; Reis, R.B.; Nery, N.; Santana, F.S.; et al. Spatiotemporal Determinants of Urban Leptospirosis Transmission: Four-Year Prospective Cohort Study of Slum Residents in Brazil. PLoS Negl. Trop. Dis. 2016, 10, e0004275. [Google Scholar] [CrossRef]
  68. Snyder, R.E.; Rajan, J.V.; Costa, F.; Lima, H.C.A.V.; Calcagno, J.I.; Couto, R.D.; Riley, L.W.; Dos Reis, M.G.; Ko, A.I.; Ribeiro, G.S. Differences in the Prevalence of Non-Communicable Disease between Slum Dwellers and the General Population in a Large Urban Area in Brazil. Trop. Med. Infect. Dis. 2017, 2, 47. [Google Scholar] [CrossRef]
  69. IPEA Atlas da Vulnerabilidade Social. Available online: http://ivs.ipea.gov.br/index.php/pt/ (accessed on 16 July 2020).
  70. IBGE Censo Demográfico 2010. Available online: https://portaldemapas.ibge.gov.br/portal.php#homepage (accessed on 20 July 2020).
  71. Mahabir, R.; Croitoru, A.; Crooks, A.; Agouris, P.; Stefanidis, A. A Critical Review of High and Very High-Resolution Remote Sensing Approaches for Detecting and Mapping Slums: Trends, Challenges and Emerging Opportunities. Urban Sci. 2018, 2, 8. [Google Scholar] [CrossRef] [Green Version]
  72. Kuffer, M.; Persello, C.; Pfeffer, K.; Sliuzas, R.; Rao, V.; Itc, K.P. Do we underestimate the global slum population? In Proceedings of the Joint Urban Remote Sensing Event (JURSE 2019), Vannes, France, 22–24 May 2019; IEEE: Vannes, France, 2019; pp. 1–4. [Google Scholar]
  73. Carr-Hill, R. Missing Millions and Measuring Development Progress. World Dev. 2013, 46, 30–44. [Google Scholar] [CrossRef]
  74. SEI. Projeções Populacionais Para a Bahia 2010–2030; Governo do Estado da Bahia: Salvador, Brazil, 2013.
  75. Costa, M.A.; Lui, L.; Santos, R.M.D.; Curi, R.L.C.; Albuquerque, C.G.D.; Tavares, S.R.; Krause, C. Nota Técnica Abril de 2020 Apontamentos Sobre a Dimensão Territorial da Pandemia da COVID-19 e os Fatores que Contribuem Para Aumentar a Vulnerabilidade Socioespacial nas Unidades de Desenvolvimento Humano de Áreas Metropolitanas Brasileiras; IPEA: Brazilia, Brazil, 2020.
  76. Fornace, K.M.; Drakeley, C.; William, T.; Espino, F.; Cox, J. Mapping infectious disease landscapes: Unmanned aerial vehicles and epidemiology. Trends Parasitol. 2014, 30, 514–519. [Google Scholar] [CrossRef]
  77. Stevens, F.R.; Gaughan, A.E.; Linard, C.; Tatem, A.J. Disaggregating Census Data for Population Mapping Using Random Forests with Remotely-Sensed and Ancillary Data. PLoS ONE 2015, 10, e0107042. [Google Scholar] [CrossRef] [Green Version]
  78. Kit, O.; Lüdeke, M.; Reckien, D. Defining the Bull’S Eye: Satellite Imagery-Assisted Slum Population Assessment in Hyderabad, India. Urban Geogr. 2013, 34, 413–424. [Google Scholar] [CrossRef]
  79. Rolnik, R.; Marino, A.; Klintowitz, D.; Brito, G.; Resende, P.; Nisida, V.; Cavalcante, L. Mapas do Coronavírus Escondem Informações—LabCidade. Available online: http://www.labcidade.fau.usp.br/mapas-do-coronavirus-escondem-informacoes/ (accessed on 16 July 2020).
  80. Reuters Africa Faces “Hunger Pandemic” as Coronavirus Destroys Jobs and Fuels Poverty. Available online: https://www.reuters.com/article/us-health-coronavirus-africa-hunger-feat/africa-faces-hunger-pandemic-as-coronavirus-destroys-jobs-and-fuels-poverty-idUSKCN22629V (accessed on 16 July 2020).
  81. Thomson, D.R.; Kuffer, M.; Boo, G.; Hati, B.; Grippa, T.; Elsey, H.; Linard, C.; Mahabir, R.; Kyobutungi, C.; Maviti, J.; et al. Need for an Integrated Deprived Area “Slum” Mapping System (IDEAMAPS) in Low-and Middle-Income Countries (LMICs). Soc. Sci. 2020, 9, 80. [Google Scholar] [CrossRef]
  82. Hachmann, S.; Arsanjani, J.J.; Vaz, E. Spatial data for slum upgrading: Volunteered Geographic Information and the role of citizen science. Habitat Int. 2018, 72, 18–26. [Google Scholar] [CrossRef]
  83. Mahabir, R.; Stefanidis, A.; Croitoru, A.; Crooks, A.; Agouris, P. Authoritative and Volunteered Geographical Information in a Developing Country: A Comparative Case Study of Road Datasets in Nairobi, Kenya. ISPRS Int. J. Geo Inf. 2017, 6, 24. [Google Scholar] [CrossRef]
  84. Mooney, P.; Grinberger, A.Y.; Minghini, M.; Coetzee, S.; Juhasz, L.; Yeboah, G. OpenStreetMap data use cases during the early months of the COVID-19 pandemic 2020. arXiv 2020, arXiv:2008.02653. [Google Scholar]
  85. de Albuquerque, J.P.; Eckle, M.; Herfort, B.; Zipf, A. Crowdsourcing geographic information for disaster management and improving urban resilience: An overview of recent developments and lessons learned. In European Handbook of Crowdsourced Geographic Information; Ubiquity Press: London, UK, 2016; pp. 309–321. [Google Scholar] [CrossRef] [Green Version]
Figure 2. Scenes of Salvador’s slums, Brazil: (a) children either barefoot or with no clothes on playing in a lowland open area and watching the unmanned aerial vehicle (UAV) take-off; (b) narrow pathways and typical occupation of slopes; (c,d) open ground photo data archive Mapillary showing a humid unpaved pathway and house typology (Photos a and b by Patricia Brito).
Ijgi 09 00557 g002
Figure 3. Overview of the case study area. Map of Alto do Cabrito and Marechal Rondon of Salvador City; Brazil (upper left); Salvador (lower left); case study neighborhoods (right). Produced by the authors. Data source: Brazilian Institute of Geography and Statistics (IBGE) and Municipality of Salvador.
Ijgi 09 00557 g003
Figure 4. Population growth trends of the Salvador municipality (in steps of 10 years, from 1959 to 2019) (data source: Brasil.io).
Ijgi 09 00557 g004
Figure 5. Confirmed COVID-19 cases in Salvador, in the study area, and in other cities. Sources of COVID-19 cases data: Brazilian municipalities—Brasil.io; Salvador neighborhoods—Salvador Health Secretary; Italian Municipalities—Dipartimento della Protezione Civile de Italian; USA municipalities—John Hopkins CSSE GIS and Data.
Ijgi 09 00557 g005
Figure 6. Alto do Cabrito and Marechal Rondon density in 2010 and urban growth.
Ijgi 09 00557 g006
Figure 7. Fragments of the (A) digital elevation model and (B) orthophoto of Alto do Cabrito.
Ijgi 09 00557 g007
Figure 8. Oblique UAV images of the Alto do Cabrito neighborhood.
Ijgi 09 00557 g008
Figure 9. (a) Boundaries of the two selected settlements in Salvador (Brazil) showing a PlanetScope image of 3 m resolution; (b) 3D point cloud-based model; (c) UAV 45° oblique image of a high-risk area due to high built-up density located in a sink; (d) blocks of houses based on their proximity to each other.
Ijgi 09 00557 g009
Figure 10. Socioeconomic Data and Applications Center (SEDAC) Ciesin population databases for COVID-19 responses, showing population densities, counts, and age group estimates for the two selected communities in Salvador, Brazil (Source: SEDAC, Ciesin, Columbia Univeristy).
Ijgi 09 00557 g010
Figure 11. Summarizing the potential of Earth observation (EO) data for the case of Salvador, Brazil.
Ijgi 09 00557 g011
Table 1. Relevant spatial information in responding to the COVID-19 outbreak in slums and the potential of Earth observation (EO) based data.
Spatial InformationEO-Based Data (Potential)Dimension
PopulationV/HR-imagery + demographic dataDensity
BuildingsV/HR-imageryDensity
Road and pathways typesV/HR-imageryDensity
Road width V/HR-imageryDensity
Open spaces within communitiesV/HR-imageryDensity
Surrounding open spacesV/HR-imageryDensity/Facilities
Local marketsCommunity-based mappingFacilities
Health facilitiesCommunity-based mappingFacilities
SchoolsCommunity-based mappingFacilities
Community centersCommunity-based mappingFacilities
Religious placesCommunity-based mappingFacilities
Water collection pointsCommunity-based mappingFacilities
Open seversVHR aerial and UAV imageryEnvironmental
SlopesLiDAR point clouds or VHR stereo-imagesEnvironmental
Standing water (sinks)LiDAR point clouds or VHR stereo-imagesEnvironmental
Open watersV/HR-imageryEnvironmental
Trash pilesVHR and drone imageryEnvironmental
Heat accumulationTIR imagesEnvironmental
Table 2. Relevant global data and local repositories relevant to provide base data for COVID-19 responses for the example of Salvador, Brazil (for non-EO experts).
DataLinksScale
(1) Access to roadshttps://millionneighborhoods.org/#14.31/-12.99896/-38.48936Global
(2) Population densities (Sedac)https://sedac.ciesin.columbia.edu/mapping/popest/covid-19/Global
(3) TEP Urban platform https://urban-tep.eu/#!Global
(4) Global Human Settlement Layerhttps://ghsl.jrc.ec.europa.eu/Global
(5) Population and health data (Worldpop)https://www.worldpop.org/Global
(6) Open cities projecthttps://opencitiesproject.org/about/Global
(7) OpenStreetMaphttps://www.openstreetmap.org/Global
(8) Global elevation modelhttps://www.usgs.gov/centers/eros/science/usgs-eros-archive-digital-elevation-shuttle-radar-topography-mission-srtm-non?qt-science_center_objects=0#qt-science_center_objectsGlobal
(9) Global Land Coverhttp://data.ess.tsinghua.edu.cn/fromglc10_2017v01.htmlGlobal
(10) OpenAerialmaphttps://map.openaerialmap.org/#Global
(11) Missing Mapshttps://mapswipe.org/data.htmlGlobal (no data on case)
(12) Geo-Referenced Infrastruc-ture and Demographic Data for Developmenthttps://grid3.org/Global (no data on case)
(13) Salvador Municipal base datahttp://cartografia.salvador.ba.gov.br/Local
(14) Estate and Municipal health and social economic datahttp://estudoscolaborativos.sei.ba.gov.br/covid19/?p=607Local
(15) Brazil spacial Data Infrastructure visualiserhttps://visualizador.inde.gov.br/Local
(16) Bahia Spacial Data Infrastructurehttp://geoportal.ide.ba.gov.br/geoportal/consultaLocal
(17) Aglomerados subnormais (official slums polygonals)https://covid19.ibge.gov.br/Local
(18) Socioeconomic Index of the Geographic Context for Health Studies (GeoSES)https://opendatasus.saude.gov.br/ne/dataset/geosesLocal
(19) Institute of Applied Economic Research (IPEA)https://www.ipea.gov.br/portal/Local
(20) Centro de Estudos da Metrópole—DataCEMhttp://centrodametropole.fflch.usp.br/pt-br/downloads-de-dados/datacemLocal
(21) Data Liberation Project Brasil.io 1https://brasil.io/home/Local
(22) Salvador Orthoimages Web Map Services, flight year 2016/2017 1,2http://mapeamento.salvador.ba.gov.br/wmsLocal
(23) IBGE 2010 Census Tract 1https://portaldemapas.ibge.gov.br/portal.php#homepageLocal
(24) Salvador COVID-19 Data 1http://www.saude.salvador.ba.gov.br/covid/notas-e-boletins-e-censo/Local
(25) Orthoimages of A. Cabrito e M. Rondon (DJI Mavic Pro UAV with a FC220 Camera) 1https://map.openaerialmap.org/#/-38.4686279296875,-12.913468738705538,13/square/211021021210012?_k=t5rtu2Local
(26) Google Earth Images (visual interpretation of 2008 and 2019 images 1)https://www.google.com.br/earth/download/gep/agree.htmlGlobal
(27) DSM image of Alto do Cabrito 1https://map.openaerialmap.org/#/-38.4686279296875,-12.913468738705538,13/square/211021021210012?_k=t5rtu2Local
(28) Buildings Footprints (for identification of blocks of houses 1,3)https://www.openstreetmap.org/#map=16/-12.9113/-38.4741Local
1 Resources used in this paper; 2 Built with nadir images from a DJI Mavic Pro FC220 camera and Agisoft Photoscan Pro Processing software; 3 Vectorisation on Salvador Orthoimages WMS and on HOT Task Manager (https://tasks.hotosm.org/projects/8788) processed using QGIS Software.
Table 3. Comparison of three available population datasets that allow estimating how many people live within the two selected communities.
Data LayerYearPopulation Estimate
Worldpop202040,011
SEDAC *2020 *32,947
Census201036,521
Census (projected) [74] *202039,271
* Based on estimates of 2010 data.

