Article

Assessment and Mapping of Spatio-Temporal Variations in Human Mortality-Related Parameters at European Scale

by
Panagiotis Andreopoulos
1,
Christos Polykretis
2,* and
Alexandra Tragaki
1
1
Department of Geography, Harokopio University, 17671 Athens, Greece
2
Lab of Geophysical—Satellite Remote Sensing and Archaeo-Environment, Institute for Mediterranean Studies, Foundation for Research and Technology—Hellas, 74100 Rethymno, Greece
*
Author to whom correspondence should be addressed.
ISPRS Int. J. Geo-Inf. 2020, 9(9), 547; https://doi.org/10.3390/ijgi9090547
Submission received: 26 May 2020 / Revised: 4 August 2020 / Accepted: 13 September 2020 / Published: 15 September 2020
(This article belongs to the Special Issue GIS-Based Analysis for Quality of Life and Environmental Monitoring)

Abstract

:
Research efforts focusing on better understanding and capture of mortality progression over the time are considered to be of significant interest in the field of demography. On a demographic basis, mortality can be expressed by different physical parameters. The main objective of this study is the assessment and mapping of four such parameters at the European scale, during the time period 1993–2013. Infant mortality (parameter θ), population aging (parameter ξ), and individual and population mortality due to unexpected exogenous factors/events (parameter κ and λ, respectively) are represented from these parameters. Given that their estimation is based on demographics by age and cause of death, and in order to be examined and visualized by gender, time-specific mortality and population demographic data with respect to gender, age, and cause of death was used. The resulting maps present the spatial patterns of the estimated parameters as well as their variations over the examined period for both male and female populations of 22 European countries in all.

1. Introduction

During the last century, there has been an unprecedented decline in mortality at all ages (especially in early life stages) resulting in a significant growth of the global human population. In terms of the relative increase in life expectancy, humans tend to survive at higher ages due to better living conditions and substantial progress in the medical and technological sectors. The observed improvement in mortality rate as well as the predictions for further increase of life expectancy reveal the need for the assessment of past and current trends, and forecasting of future trends in a population’s mortality.
A major issue in the demographic, social, and health sciences is the assessment of human mortality over time [1]. Concerning the related literature, a lot of research work has been carried out on identifying mortality patterns and formulating specific trends in Europe [2,3,4,5,6]. Furthermore, the continuous development of spatial technologies and the increasing availability of related data have allowed the implementation of spatial analyses in mortality research. Spatial analysis can address the specificities of each space and consider that mortality may have variations in different geographical settings. Numerous studies have been conducted over recent years exploring mortality from a spatial perspective, at various spatial levels (national, state, or district) [7,8,9,10].
In line with above, a significant number of statistical methods have been developed and optimized in order to describe the mortality of a given population [11,12]. An overview of these methods is presented in [13]. Some of them, like the one proposed by Gompertz [14], are empirical since they describe the mortality trajectories without giving any explanations about the processes underlying the mortality dynamics. Others, like that proposed by Makeham [15], are mechanistic and include terms that explain the “nature” of processes and model parameters with biological or demographic interpretations. However, the majority of the developed methods has been constructed by using physical, demographically defined parameters as fundamental components [16]. These parameters are defined on the basis of quantities, such as the number of deaths, with respect to demographic characteristics like age, gender, level of education, marital status, or cause of death [17,18].
Considering the focus of most research work on spatial variations of mortality and not on its aforementioned parameters, the present study aims to assess and cartographically visualize four of these parameters at the European scale, during the time period 1993–2013. Defined by demographics with respect to age and cause of death, the examined parameters constitute the fundamental components of a recently proposed mortality method named the Beta Gompertz Generalized Makeham (BGGM) distribution [19]. Their spatio-temporal assessment and mapping resulted to the identification of spatial mortality patterns as well as variations over time. In order to achieve a visualization by gender, the estimation of parameters was based on the analysis of available historical (remote and recent past) mortality and population data for different combinations of genders, ages, and causes of death.

2. Materials and Methods

2.1. Data

This study relies on two different datasets. The first dataset consists of annual data on absolute numbers of deaths in the entire population, in terms of age, gender, and cause of death, provided by the “Human Mortality Database” (HMD) [20]. The HMD is the output of a project which was supported by various research and science collaborators from around the world, who were generally interested in the history of human longevity. It was developed with the aim of providing open, international access to detailed mortality and population data for more than 40 countries worldwide. The obtained mortality data referred to the period 1993–2013 and to 22 European countries. These countries were: Austria, Belgium, Czech Republic, Denmark, Estonia, Finland, France, Germany, Greece, Iceland, Ireland, Italy, Latvia, Lithuania, Netherlands, Norway, Poland, Portugal, Spain, Sweden, Switzerland, and the United Kingdom. Furthermore, age and gender-specific population demographics were obtained by the HMD for the far-past, and by the European statistical authority Eurostat [21] for the recent past.
The main spatial dataset used for the cartographic visualization of the estimated parameters was also provided by Eurostat [22]. As a geographic information systems (GIS)-supported vector layer representing European scale, this dataset contained the total of European countries as polygon spatial features. Among all, the features related to the 22 countries mentioned above were selected and extracted as a new separate dataset (Figure 1).

2.2. Methodology

Τhe examined parameters constitute the fundamental components of a recently proposed mortality method named the Beta Gompertz Generalized Makeham (BGGM) distribution. The details of this method have been described by Andreopoulos et al. [19]. In general, the proposed BGGM method combines the Gompertz [14] and Gompertz–Makeham [23] distributions by using a beta generator. Its comparative advantage over the individual methods, on which its creation was based, can be traced to the fact that it provides a greater flexibility and better capture of mortality “irregularities” at both very low and very high ages. BGGM can be expressed by the following equation:
f B G G M ( x ) = ( θ e ξ x + λ + κ x ) e λ x θ ξ ( e ξ x 1 ) Β ( α , β ) · [ ( 1 e κ λ x 2 λ x θ ξ ( e ξ x 1 ) ) ] α 1 · [ ( e κ λ x 2 λ x θ ξ ( e ξ x 1 ) ) ] β 1 θ , ξ , κ ,   λ , α , β > 0 ,   x 0
where x is age, starting from 0 and going up to a maximum theoretical biological threshold (i.e., an age above which no individual can theoretically survive), α and β are parameters of beta distribution [24], and θ , ξ , κ , and λ are parameters related to different aspects of mortality.
Each of the above parameters has a specific demographic interpretation making output results easy to analyze and useful for understanding age and time-specific observations related to mortality. The range given for each parameter enables one to study and predict the course of human life, within certain limits. Specifically, parameter θ describes the mortality at initial ages [0, 1), also known as infant mortality. Human life is very fragile at the time of birth as well as during the months that follow it. As an indicator of population living standards, infant mortality is highly influenced by changes in economic and social conditions [25]. Parameter ξ , defined as the percentage of people aged 70 years or over, can reflect the demographic aging of a population [14]. Parameter κ describes the risk of an unexpected death at the individual level. The higher its value, the higher the probability of a sudden death. It actually reflects the impact of lifestyle choices, as well as the risk of an acute health deterioration, a suicide, a car accident, or any other unpredictable fatality. The parameter λ refers to hazardous events that may affect the entire population [15]. These events may be due to various social (e.g., wars, illnesses), economic (e.g., economic crisis), or environmental (e.g., natural disasters like earthquakes, floods, etc.) circumstances that have been proved to affect the rate of mortality. The higher the value of the parameter, the greater the impact of an aggravating factor on the mortality of the population. In other words, λ expresses the degree of success/failure by which the population is dealing with death.
Each and all of the four parameters θ , ξ , κ , and λ can contribute to the understanding of the progression of a population’s mortality over time. Their estimation was achieved by using the maximum likelihood method and the method of weighted least squares. The maximum likelihood is defined by the equation [26]:
l o g   L = x = 1 n [ l o g ( l x d x ) + d x l o g   q x + ( l x d x ) l o g ( 1 q x ) ]
where l o g   L is the natural logarithm of likelihood L , l x is the quantity of individuals that are alive in the age of x , d x is the quantity of deaths in the interval [ x , x + 1 ] , and q x is the probability of an individual of age x to die in this interval as it is calculated by the ratio:
q x = d x l x
In order to minimize the difference between real and calculated values, the method of weighted least squares was applied. It is defined as follows [27]:
x = 1 n w x [ r x q x ] 2
where w x is a weight value for age x , and r x is the real value for age x . It is worth mentioning that in this case the real values were represented by the obtained death rates.
By using the obtained mortality and population demographic datasets in Equations (2)–(4), the values of the four parameters θ , ξ , κ , and λ were estimated (Figure 2 and Figure 3). Their estimation was conducted by using open code R software (www.r-project.org), and specifically the “minpack.lm” package [28] by the Comprehensive R Archive Network (CRAN) digital library. Of particular importance was the “nls.lm” function, which was used to minimize the sum square of the vector returned by the function “fn” (a function that returns a vector of residuals, the sum square of which is to be minimized), by a modification of the Levenberg–Marquardt algorithm.
After a spatially-based assignment of the parameter values to each of the spatial features (i.e., to each of the examined European countries) of the corresponding vector layer, multi-temporal gender-specific maps were created in GIS environment (by using ESRI/ArcGIS ver. 10.4 software package). The classification of the maps was then executed using the standard deviation method (Figure 4, Figure 5, Figure 6, Figure 7, Figure 8, Figure 9, Figure 10 and Figure 11). Based on the mean value of the dataset, this classification method generates class breaks by adding or subtracting one standard deviation at a time [29]. As it is shown in Table 1, the parameter values were split into four and three discrete classes for males and females, respectively, according to the relative classification standard deviations (std).

3. Results

Figure 4, Figure 5, Figure 6, Figure 7, Figure 8, Figure 9, Figure 10 and Figure 11 are composed of an overview of separate (sub)maps visualizing, by gender, the spatial distribution of the estimated parameters for the 22 European countries, and six selected years (1993, 1998, 2002, 2006, 2009, and 2013).

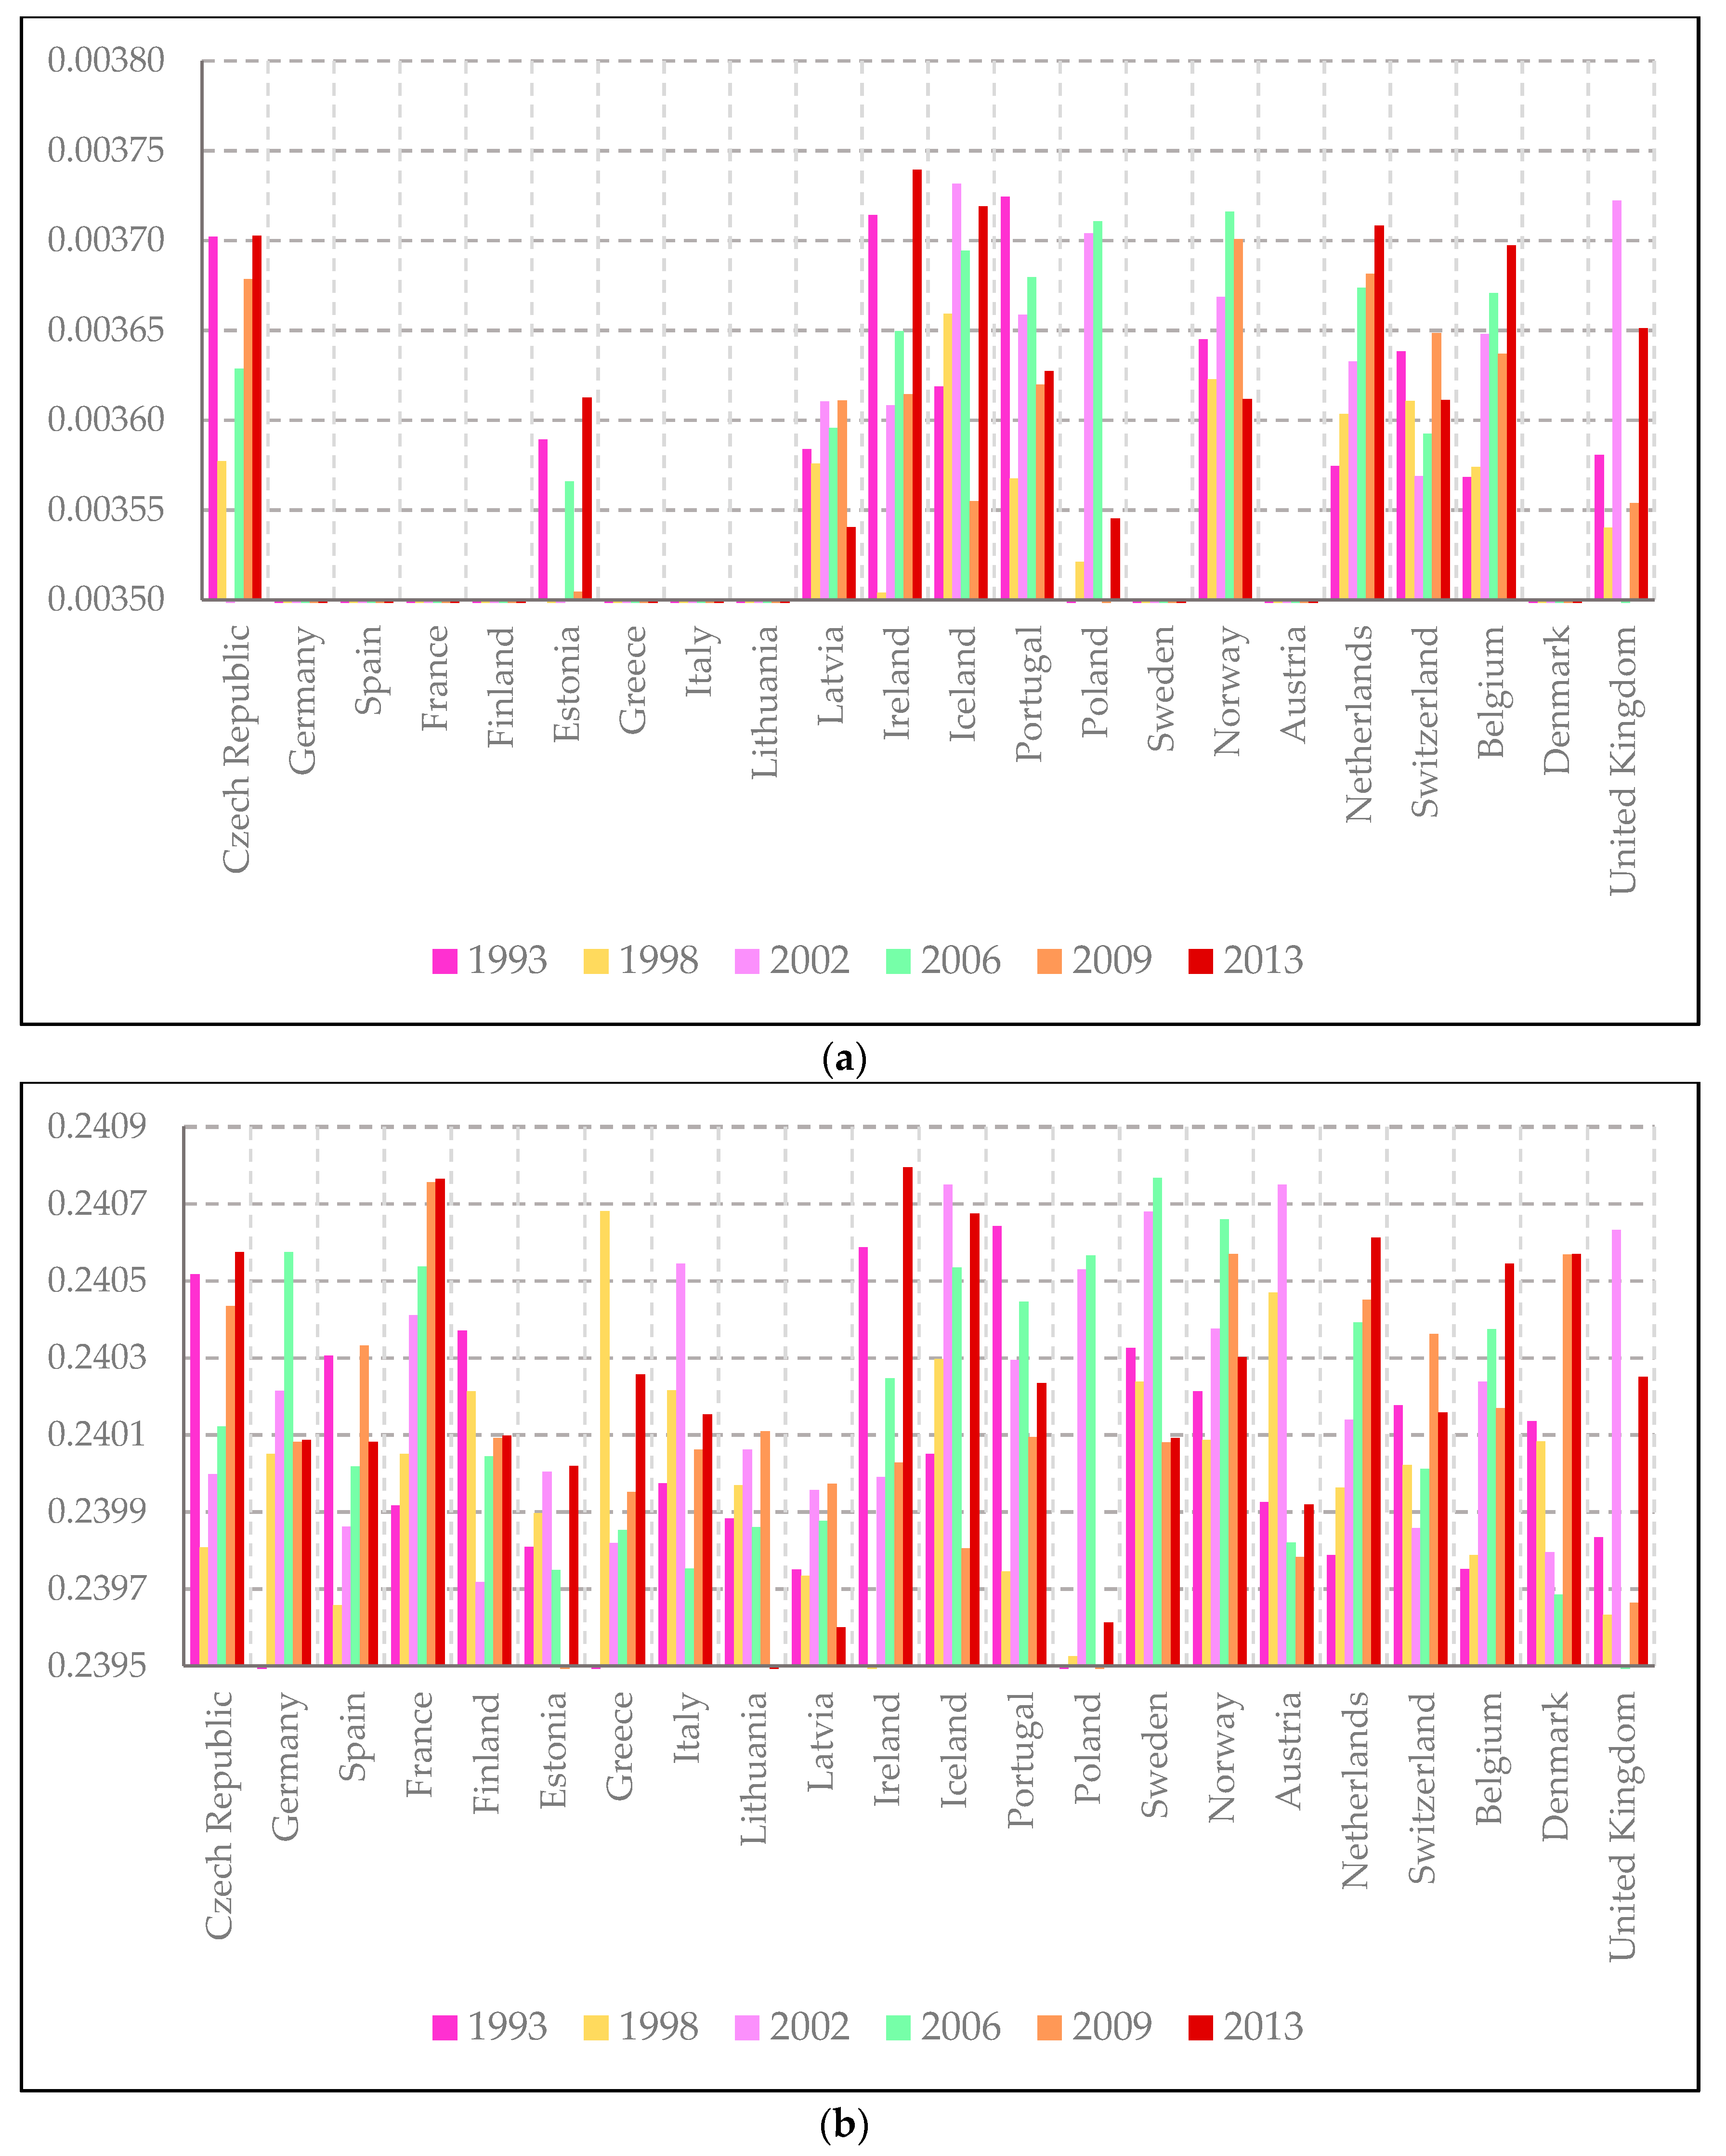
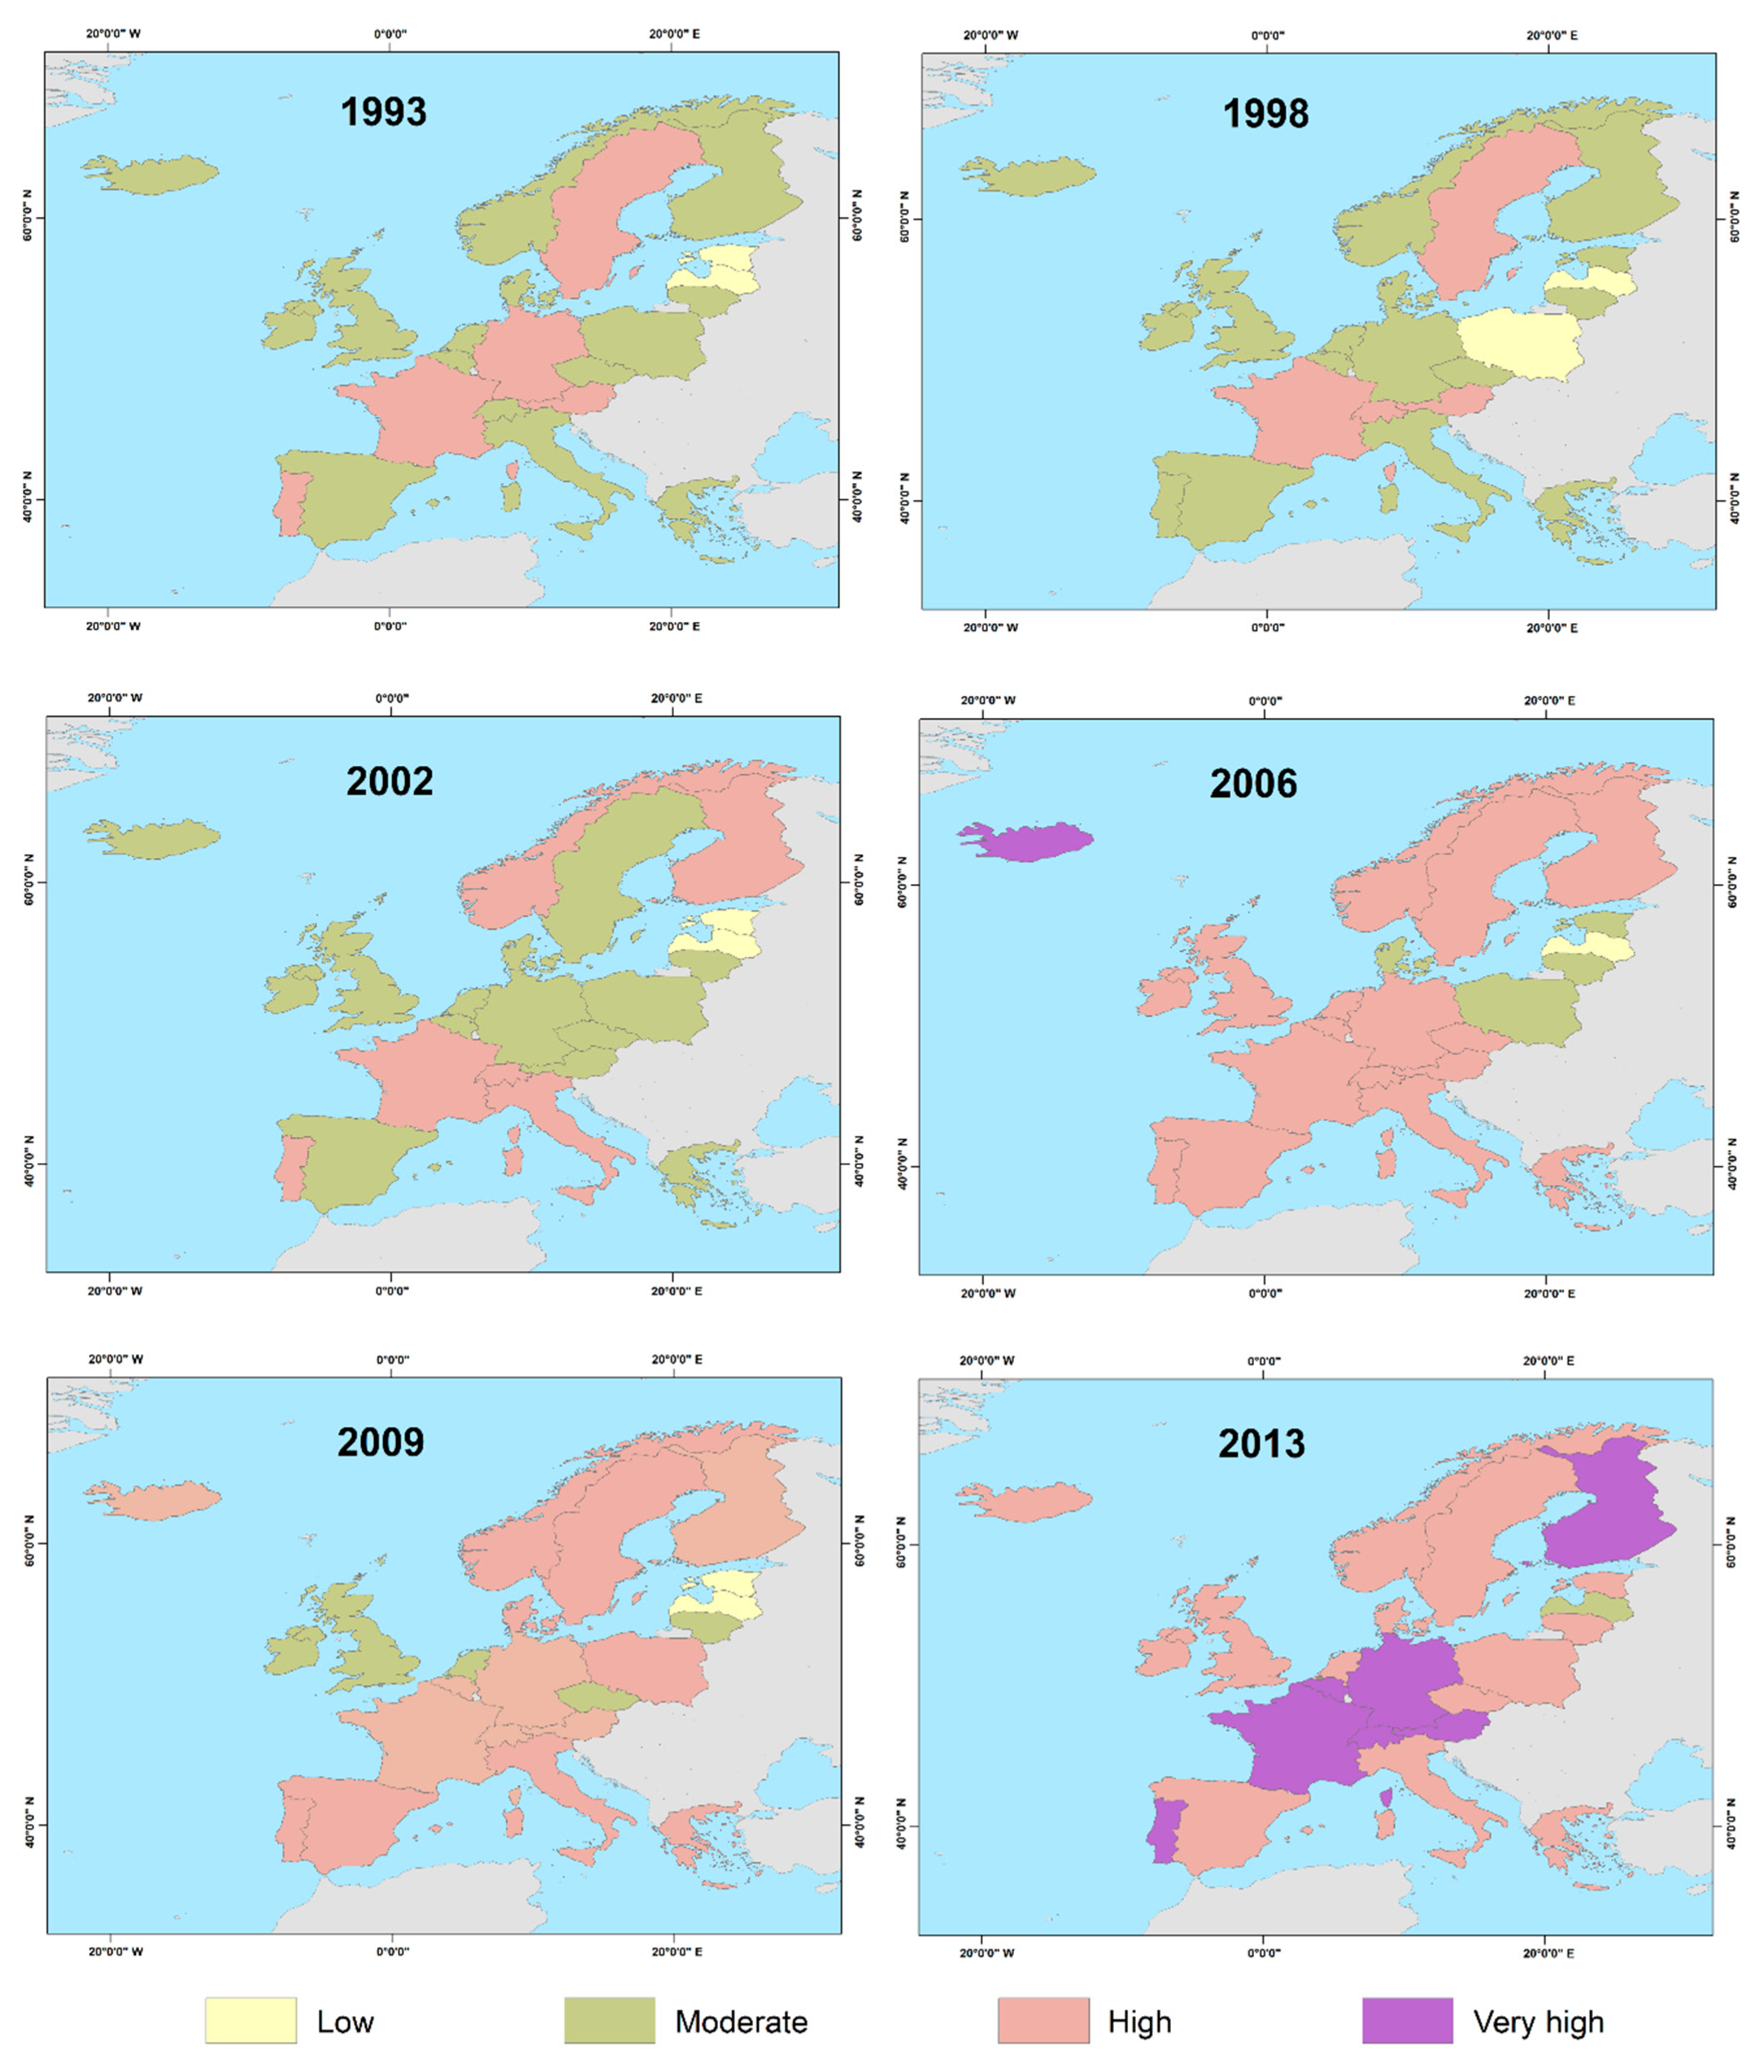
3.1. Infant Mortality (Parameter Θ)

According to the results of parameter θ (Figure 4), except for Iceland, the majority of the other Nordic countries (Sweden, Finland, and Denmark) generally presented low male infant mortality over time. After an increased tendency between 1993 and 2002, another Nordic country, Norway seemed to follow a downward tendency. Tendencies similar to Iceland and Norway were observed for Ireland and the United Kingdom, respectively. Among the Baltic countries, Estonia and Latvia showed strong fluctuations over time. However, Lithuania developed a constantly positive tendency with low parameter values. After fluctuations, the Netherlands culminated in moderate male infant mortality. Its neighbor, Belgium, as well as countries in Central Europe (France, Germany, and the Czech Republic) followed a constantly positive tendency with low parameter values. Beyond this tendency, Switzerland, Austria, and Poland could not manage to get a positive sign in the parameter estimations, indicating higher parameter values. With the exception of Portugal, which mainly showed from high to very high levels of male infant mortality, the other Mediterranean countries (Greece, Italy, and Spain) were found with low levels over the entire examined period.
In the case of female infant mortality (Figure 5), it can be mentioned that there are two main patterns represented by countries with constantly low parameter values (Sweden, Finland, Denmark, Lithuania, Germany, France, Austria, Greece, Italy, and Spain), and countries with constantly higher values (Norway, Iceland, the United Kingdom, Ireland, the Netherlands, Belgium, Poland, Latvia, Switzerland and Portugal). The decrease in the parameter values of Estonia and the Czech Republic in 1998 and 2002, respectively, was followed by an increase assigning also these two countries to the above second pattern.

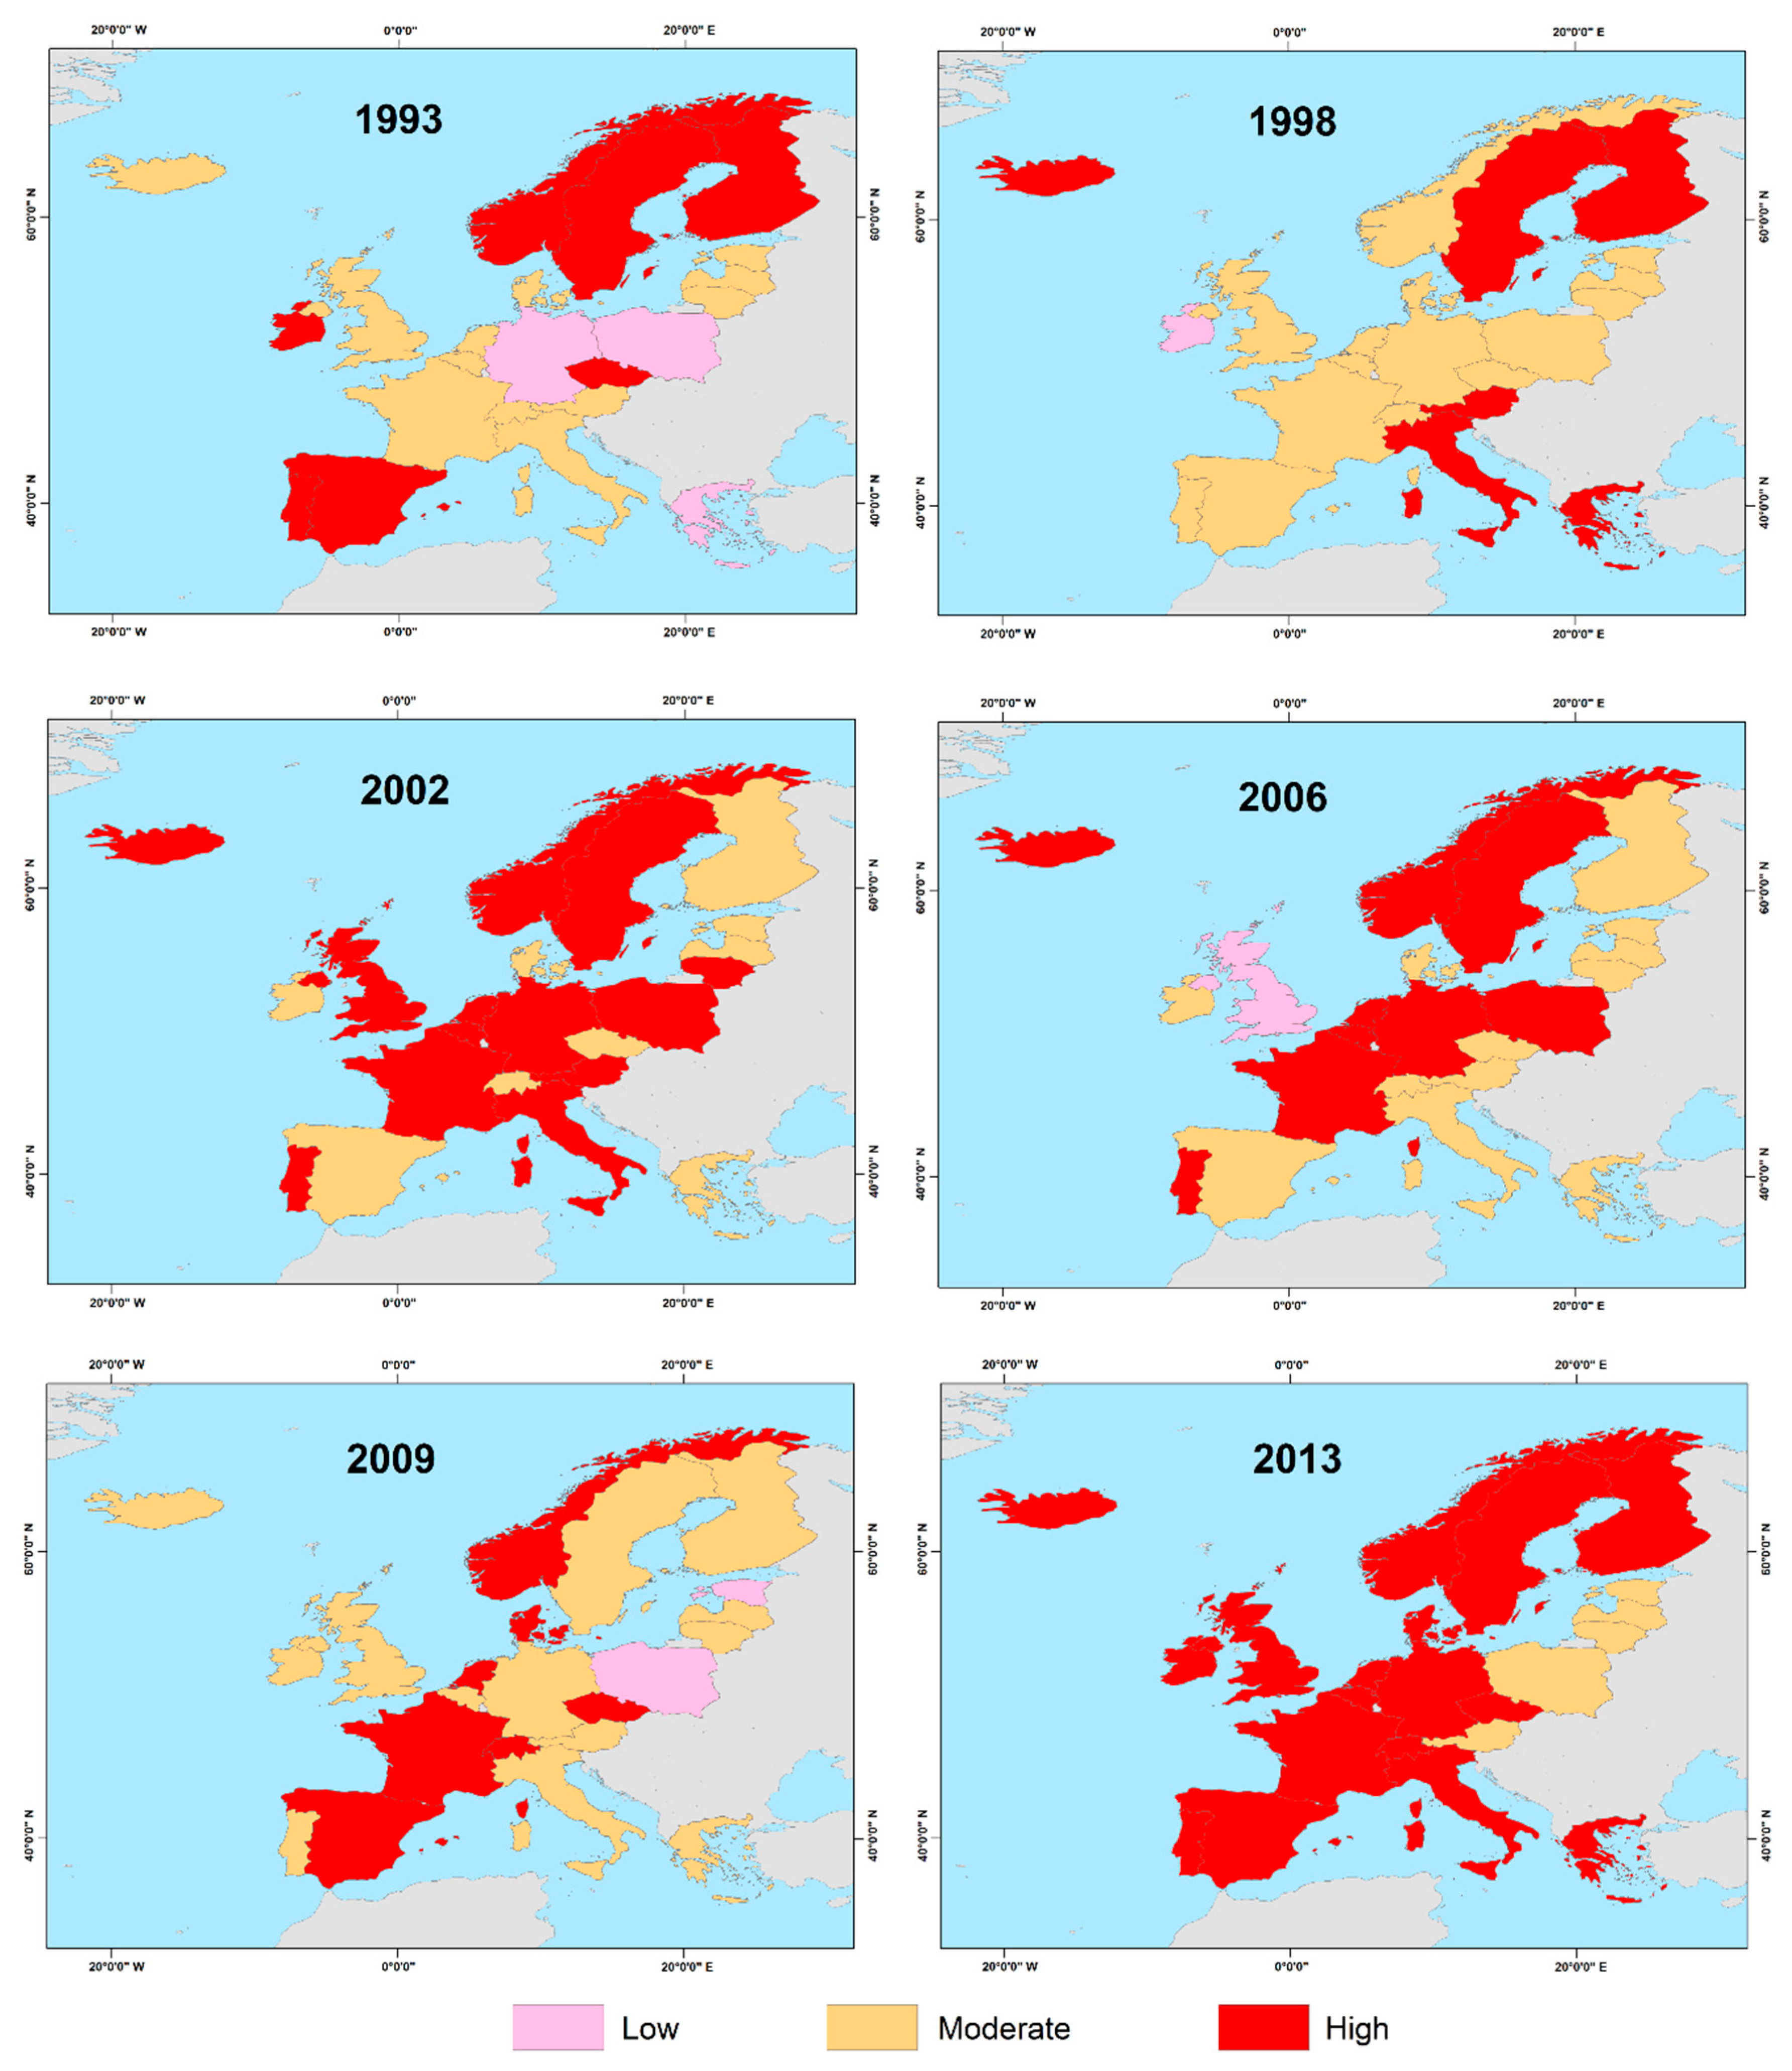
3.2. Population Aging (Parameter Ξ)

Based on the results of parameter ξ (Figure 6), despite the influence of fluctuations over time (intense increase in 2006 and a slight decrease in 2009), the male population aging for Iceland eventually reached a high level. Finland constantly showed an upward tendency, reaching a very high level in 2013. Norway and Denmark witnessed an increase in 2002 and 2009, respectively, resulting in high parameter values. Except for a significant decrease in 2002, causing a moderate parameter value, another Nordic country, Sweden, generally presented constantly high values from 2006 onwards. Although they presented low parameter values in the largest part of the examined period (between 1993 and 2009), Estonia and Latvia eventually managed to achieve an increase in 2013. However, except for an increase in 2013, Lithuania showed almost steadily moderate values. Higher parameter values were detected for the Netherlands. A steady increase from 2006 onwards led to very high levels of aging in 2013 for Belgium. In the United Kingdom and Ireland, the general balance in moderate levels was affected by an increase in 2013 resulting eventually in higher levels of values. Tendencies similar to the United Kingdom were presented by Poland and the Czech Republic, respectively. Longevity in other countries in Central Europe such as Germany, France, Switzerland, and Austria could be considered to have the most significant impact on the male population aging with extremely increased parameter values (very high levels in 2013). The steady tendency of Greece was eventually affected by an increase in 2006. Spain and Italy were found to generally have an upward tendency after 2002 and 2006, respectively. Except for a decrease in 1998, another Mediterranean country, Portugal, showed a steady upward tendency, eventually reaching a very high parameter value.
Concerning female population aging (Figure 7), Nordic countries were found to constantly have high parameter values over the time. The United Kingdom and Ireland were shown to reveal strong fluctuations over the time, and finally a clear upward tendency to high parameter values. Except for an increase between 2006 and 2009 in Lithuania, the female populations of Baltic countries were mostly characterized by moderate levels in terms of aging. Despite their moderate parameter values until 1998, the Low Countries showed an increased tendency in the following period. A similar tendency was observed for the most of countries in Central Europe while their initial low values in 1993 were then affected by an upward tendency. Austria and Poland constitute two exceptions with a converse (downward) tendency. More or less strong fluctuations had as a final result high percentages of elderly women in the Mediterranean countries.

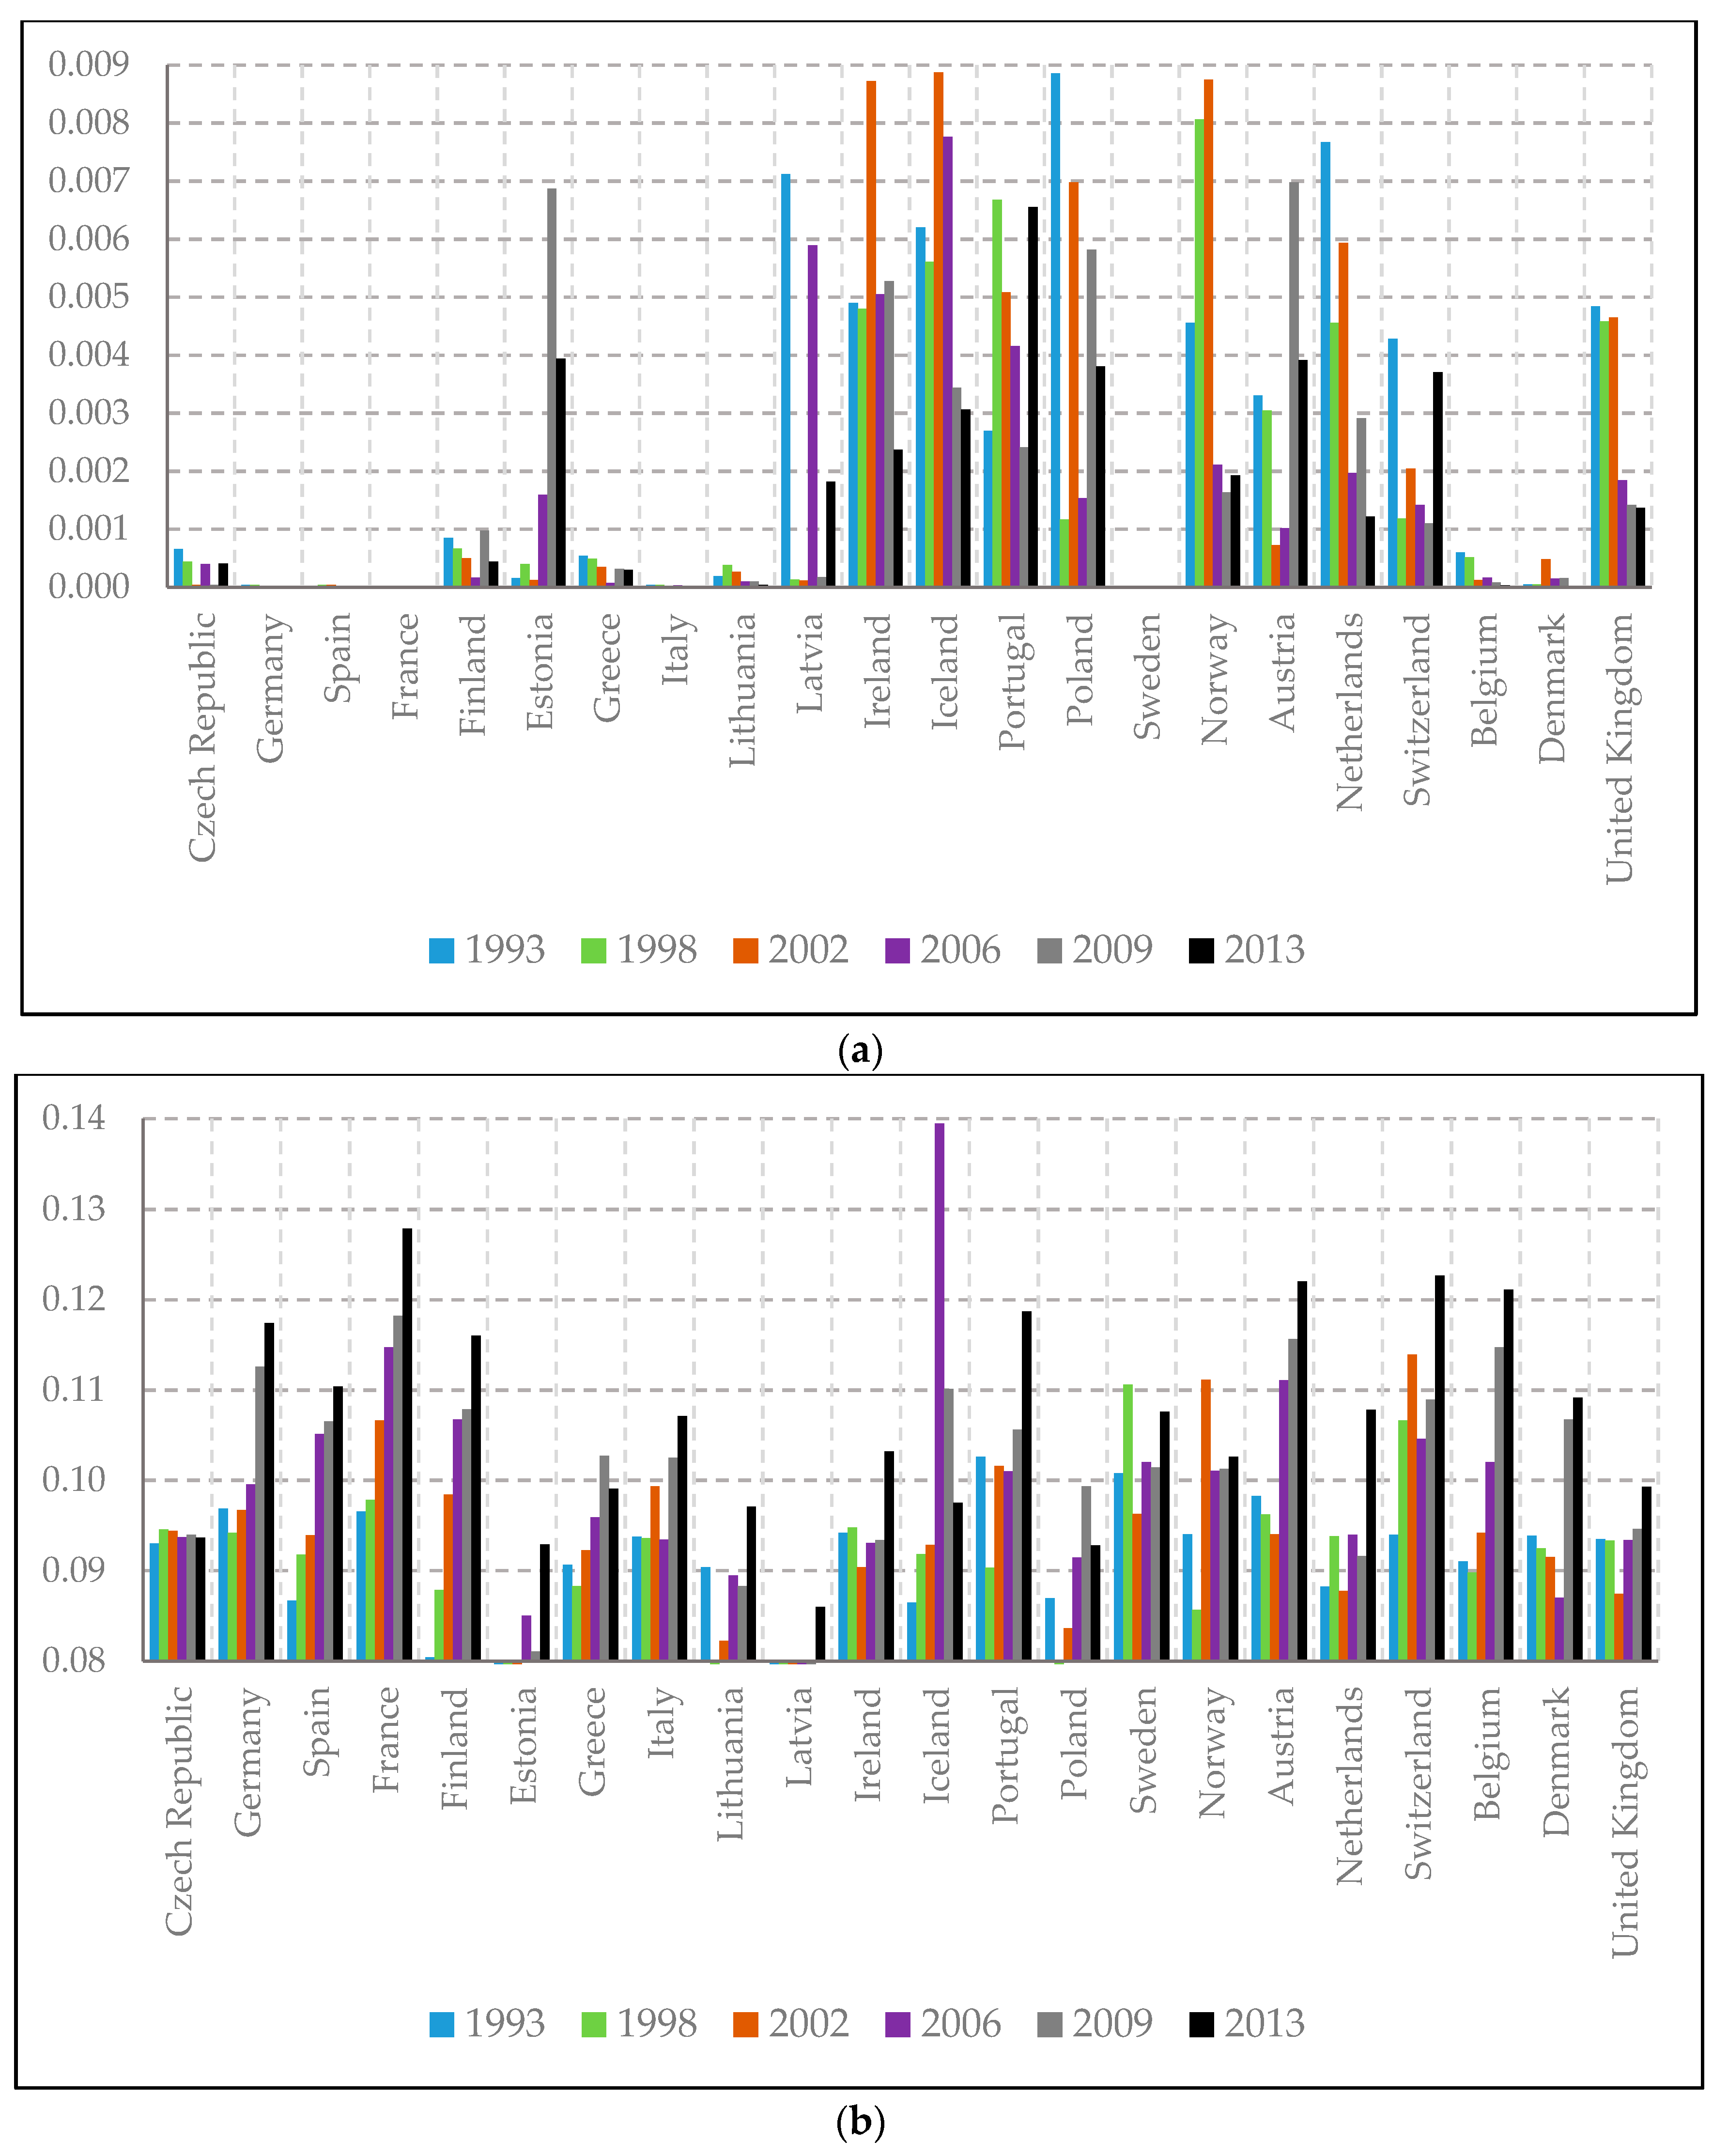
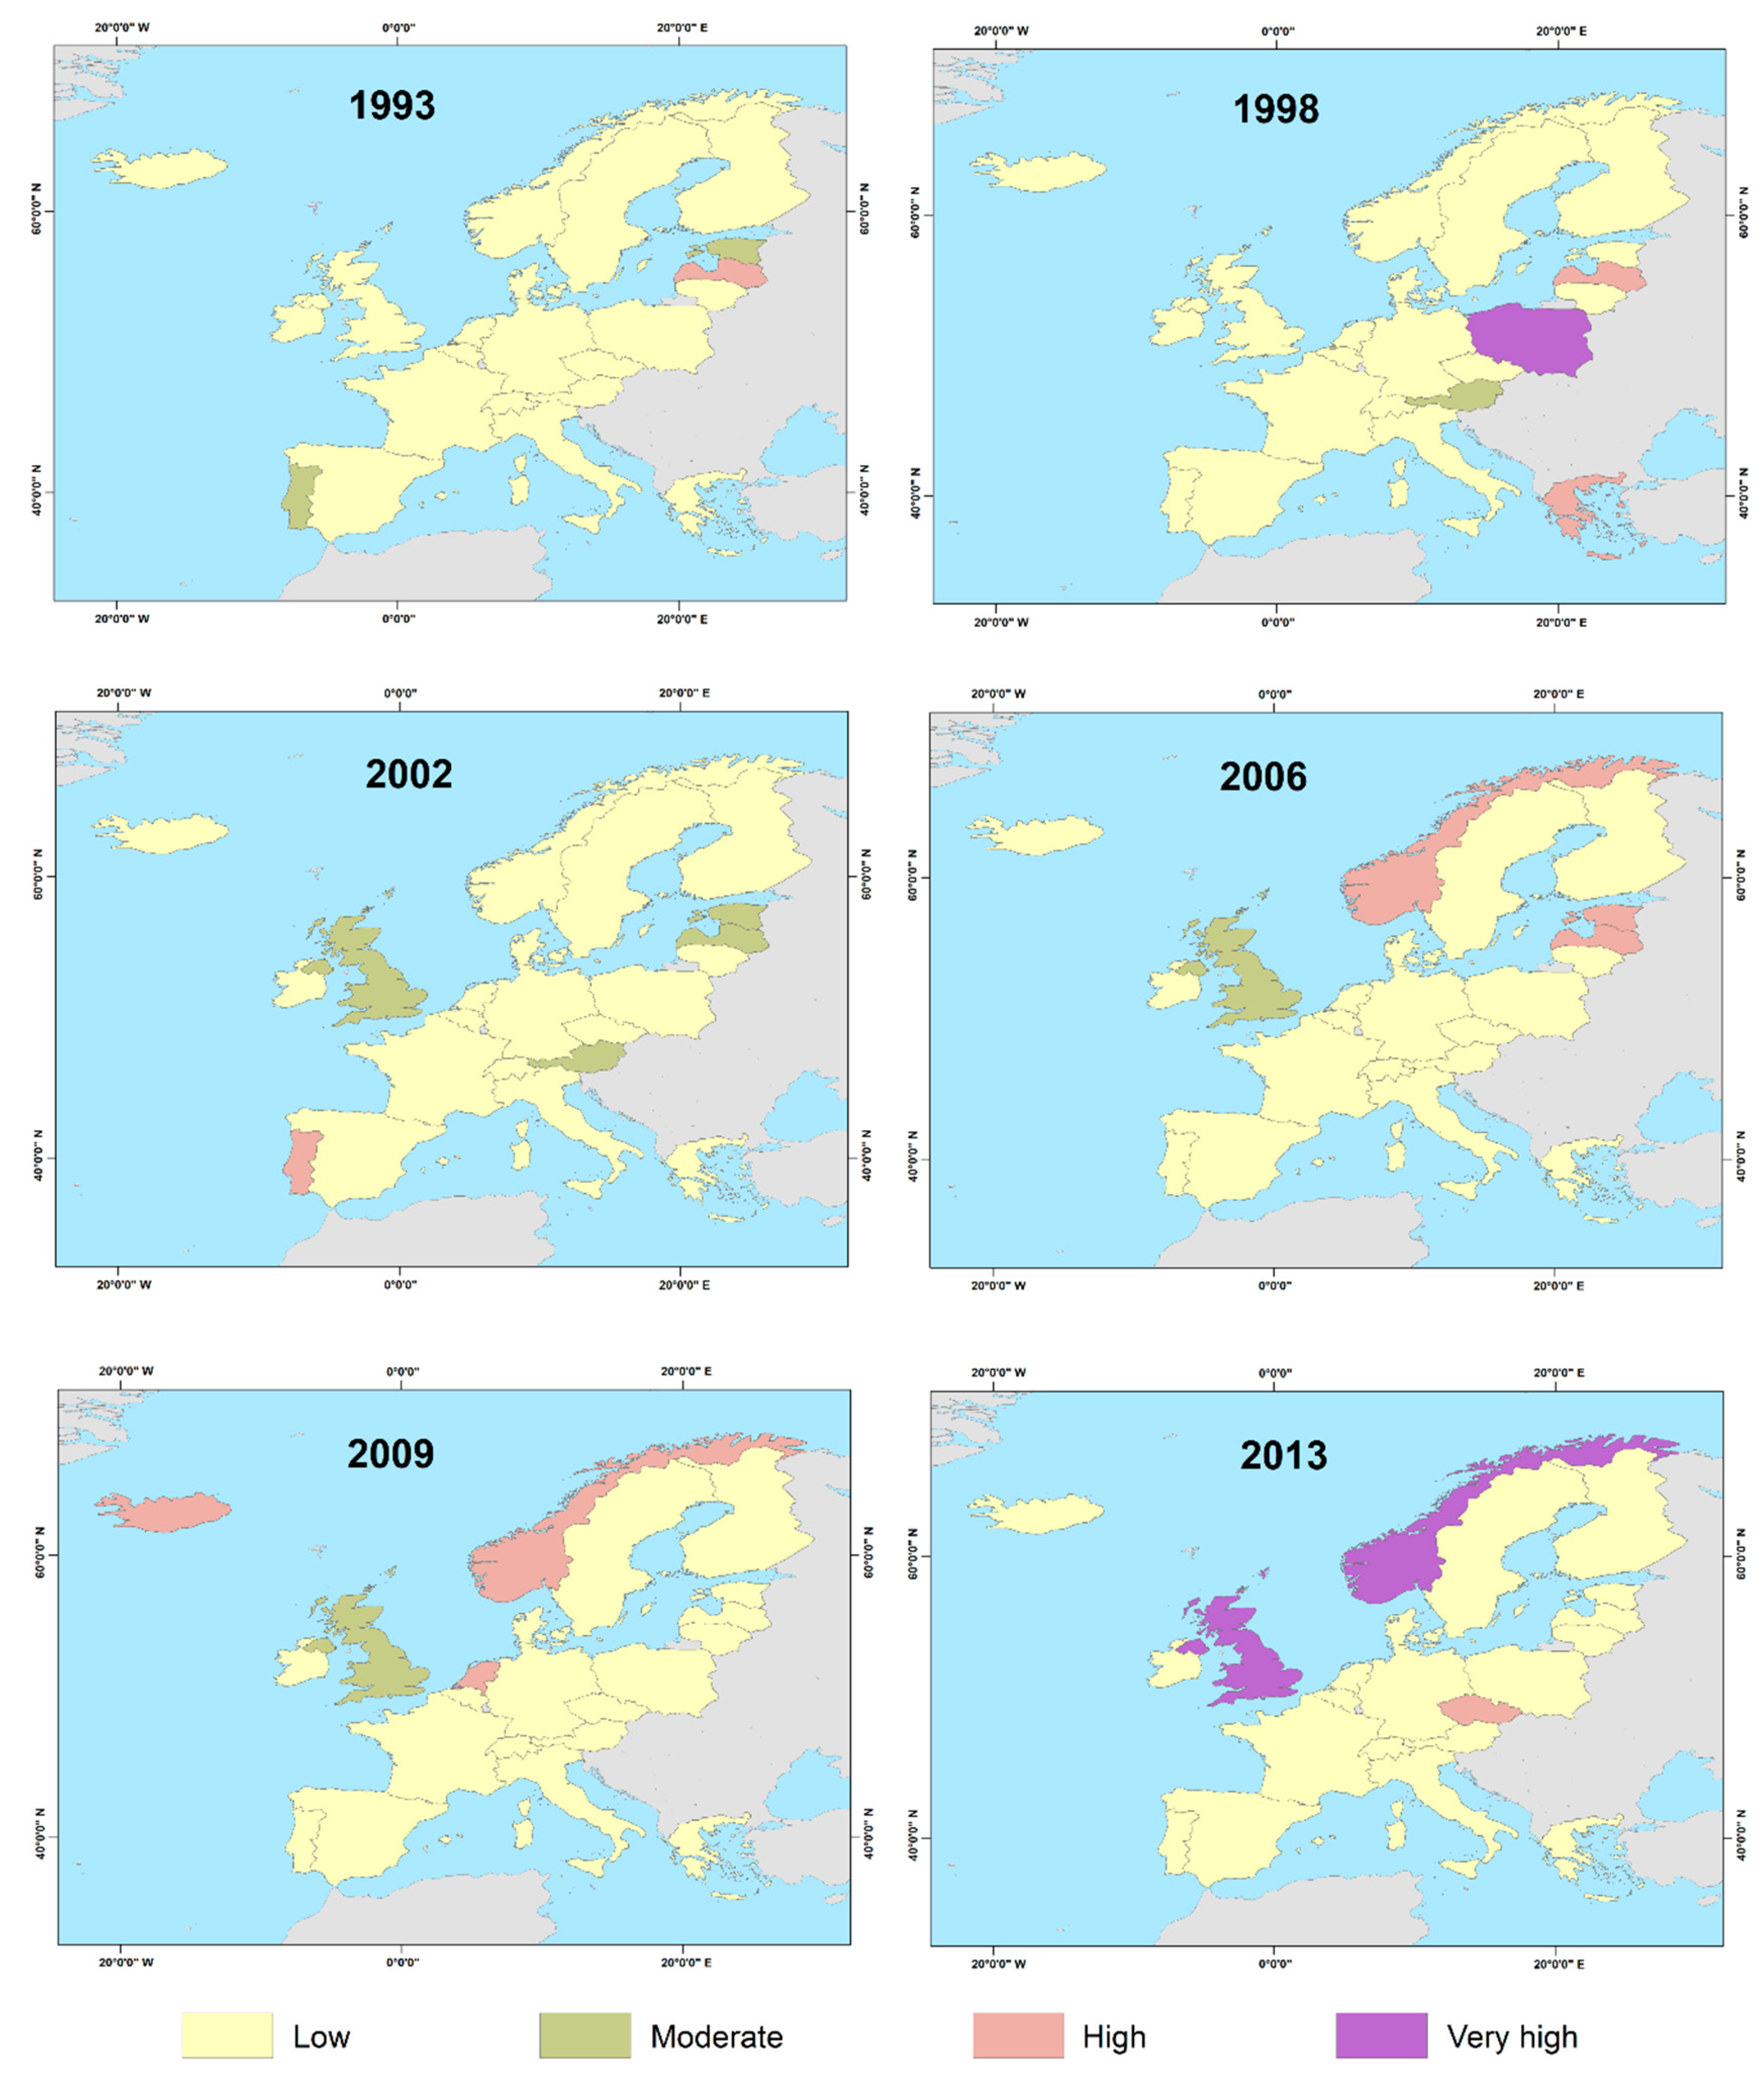
3.3. Individual Unexpected Mortality (Parameter Κ)

According to the results of parameter κ (Figure 8), the male populations of the majority of Nordic countries constantly presented a low possibility of individual unexpected mortality. On the contrary, the initial low parameter values of Norway in the period of 1993–2002 were significantly increased in the following period (2002–2013). Among the Baltic countries, Lithuania indicated a balance in low levels over time. Despite their upward tendency in approximately the total of examined period, the other two Baltic countries managed to significantly decrease their parameter values from 2006 onwards, reaching low levels in 2013. With the exception of increased tendency from the Netherlands between 2006 and 2009, the Low Countries revealed low parameter values. Conversely, the initial “positivity” (low levels) from the United Kingdom was followed by a steady increase in its parameter values from 1998 onwards, having as a result much higher levels in 2013. A steady “positivity” was detected for Ireland, as well as for most of the countries in Central Europe. Among them, only the Czech Republic was found to present a high parameter value in 2013. Except for the fluctuations in Portugal until 2006 and the notable increase in Greece in 1998, low levels with respect to male individual unexpected mortality generally characterized the Mediterranean countries.
The relative results of the parameter also indicated that the initial high possibility in terms of female individual unexpected mortality from the majority of examined European countries was followed by a steady downward tendency resulting in lower values in 2013 (Figure 9). Denmark, Poland, the United Kingdom and the three Baltic countries constitute the exceptions, with high parameter values in either most or all of the examined period.

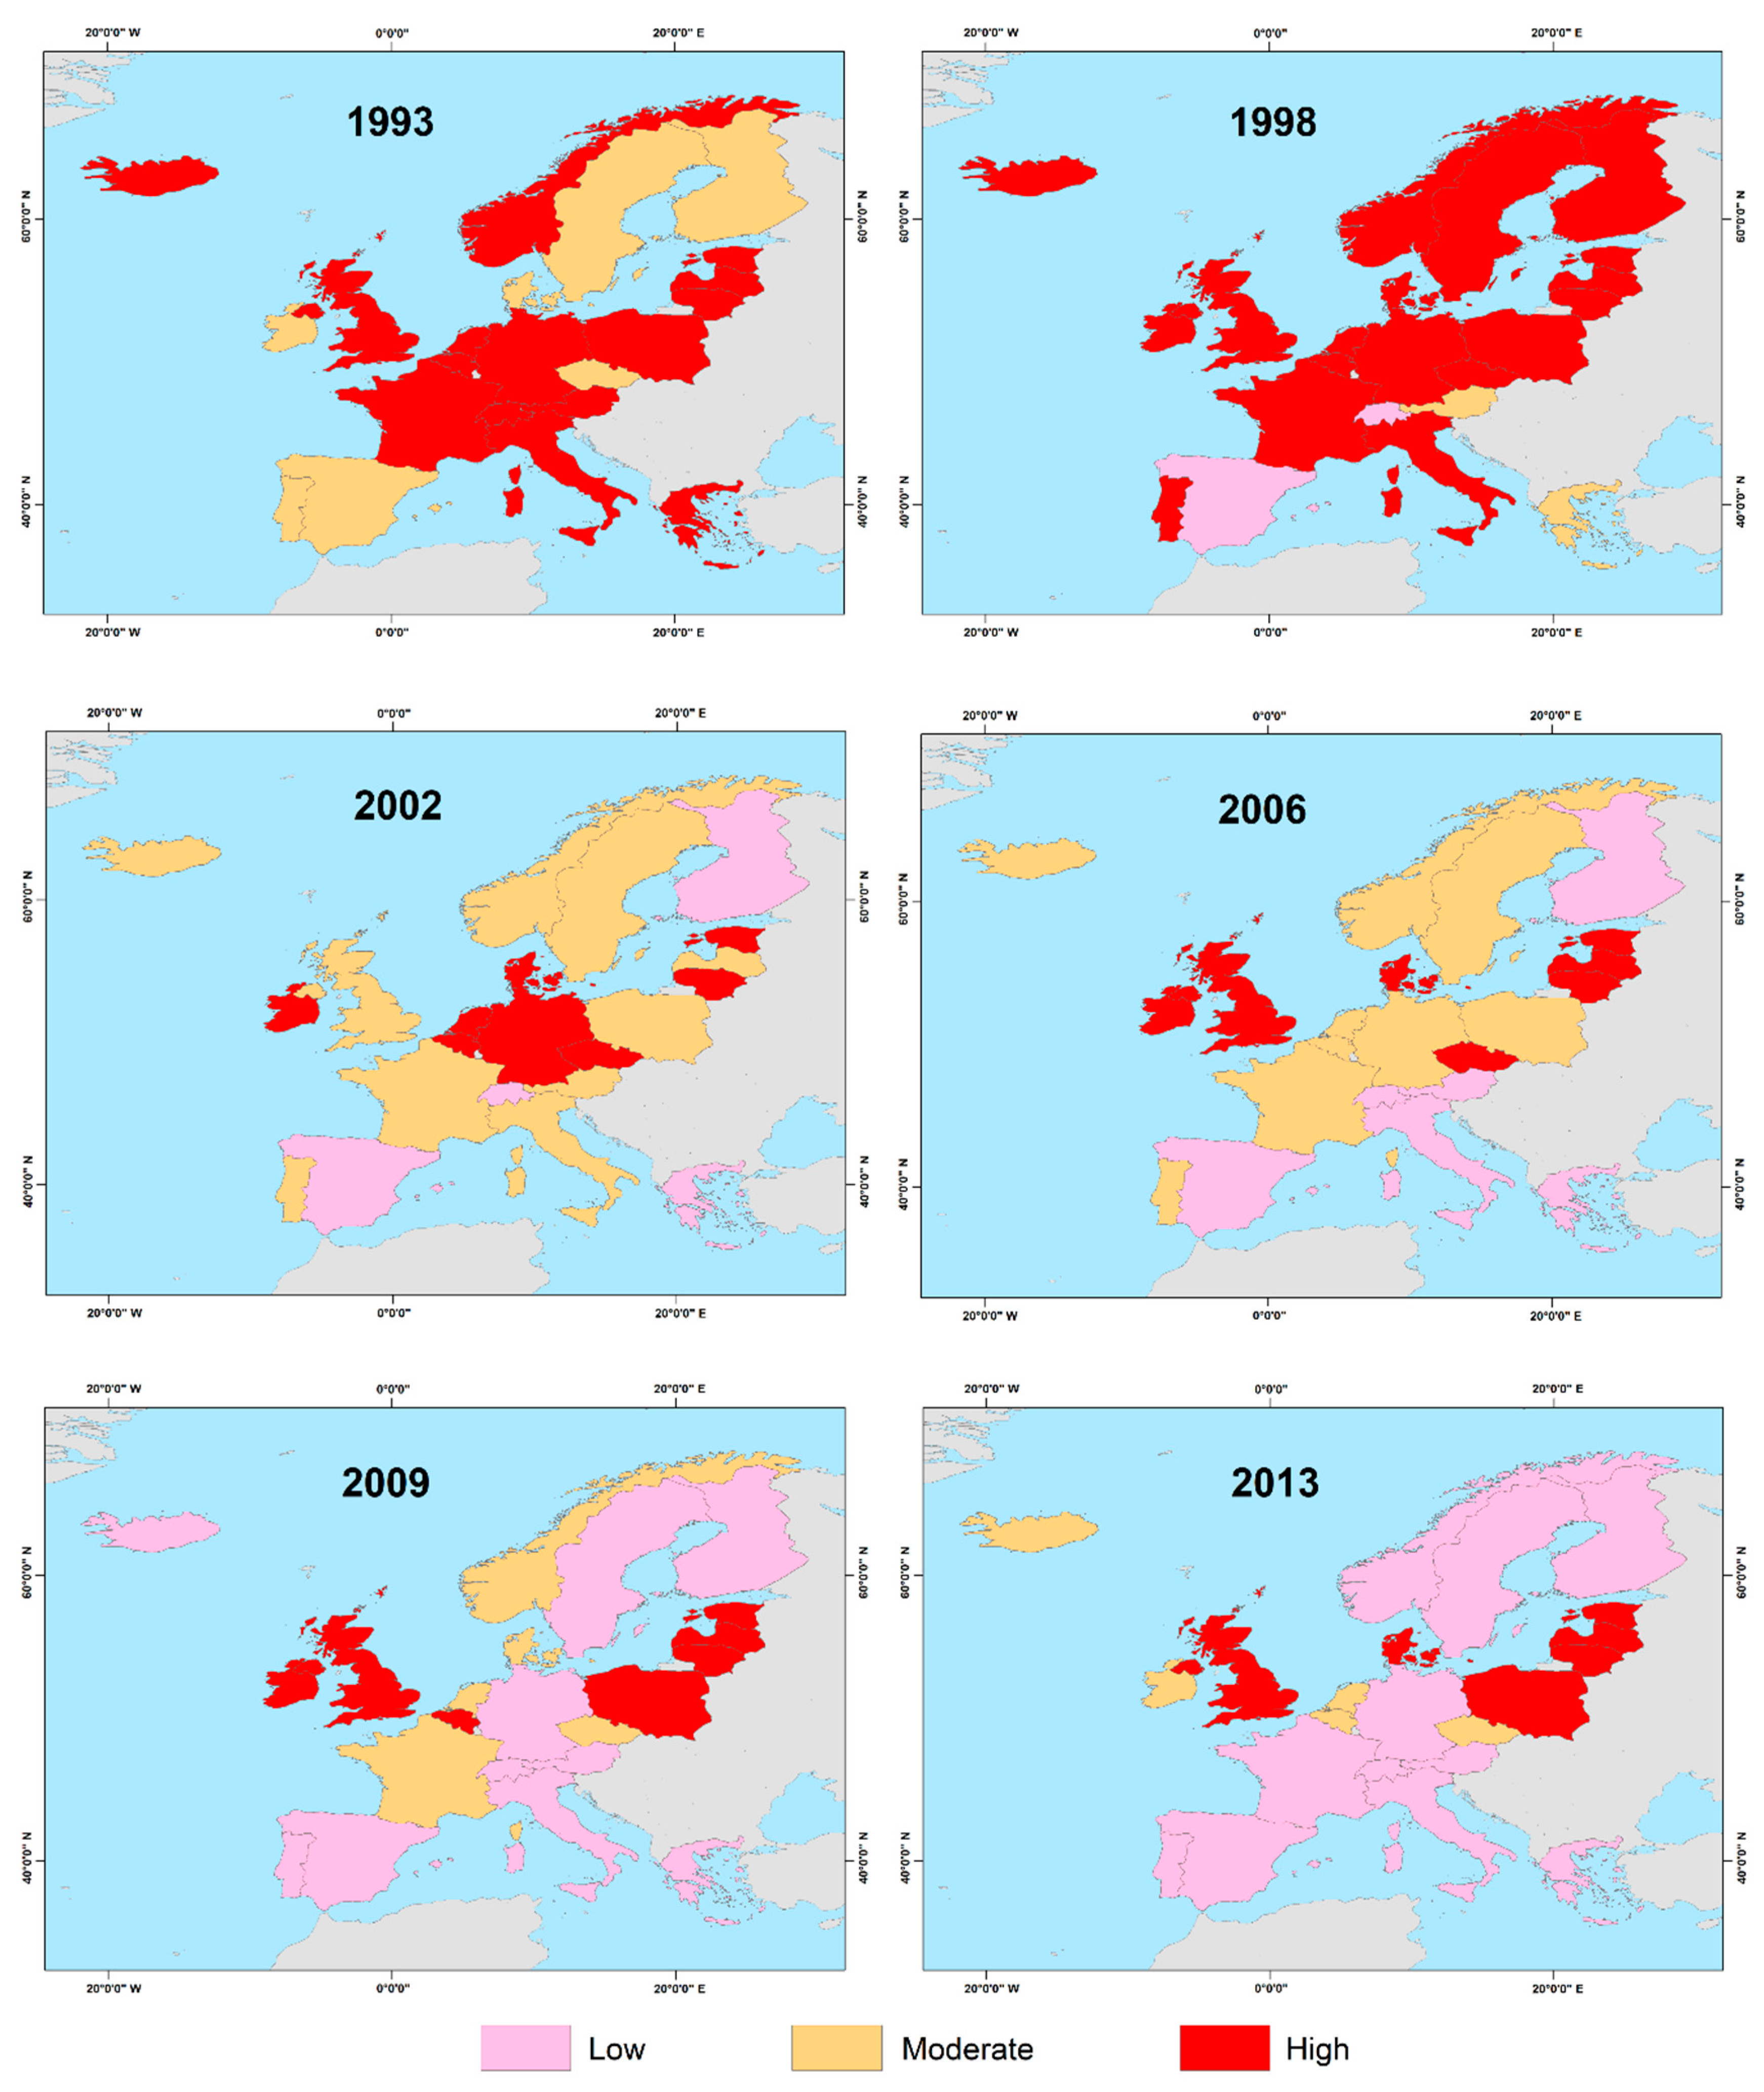
3.4. Population Mortality due to Hazardous Events (Parameter Λ)

Regarding the results of parameter λ (Figure 10), there are two main patterns with respect to the possibility of male overall unexpected mortality. These patterns were mainly represented by countries with constantly low parameter values (the majority of Nordic countries, the Baltic countries, Poland, the Czech Republic and the United Kingdom), and countries with more (Germany, France, and Austria) or less (Denmark, Greece, Italy, Spain, and Portugal) increased values, especially from 2006 onwards.
Concerning the female population (Figure 11), different fluctuations over time characterized countries with eventually low (Iceland, Ireland, the Netherlands, and Switzerland) and moderate (Sweden, Finland, Denmark, the United Kingdom, Austria, the Czech Republic, Greece, Italy, Spain, and Portugal) parameter values in 2013. Fluctuations between low and moderate values over the entire period was also shown by Germany and France. Similar endings were presented by Estonia and Poland which, after a steady tendency to high levels until 2009, managed to reach decreased (moderate) values in 2013. That was not observed for the other two Baltic countries (Lithuania and Latvia), which followed a steady tendency to high parameter values over the entire period. The steady tendency of Norway to low parameter values was affected by a significant increase in 2009, resulting in a much higher value. However, the country appeared to show a relative decrease in 2013, reaching eventually a low value.

4. Discussion and Conclusions

The current study presents the way that influencing parameters contribute to the gender-specific mortality at European scale. For this reason, the spatial patterns of these parameters as well as their variations during the period of 1993–2013 were identified in a total of 22 European countries. Each of the parameters has a particular demographic interpretation enabling the exploration of mortality by different aspects, such as infant mortality (parameter θ), population aging (parameter ξ), as well as individual (parameter κ) and population unexpected mortality (parameter λ). In order to estimate them, a number of demographic characteristics should be taken into account. Age and gender are two of the most important such characteristics since they can indicate the gender-composition and age-distribution of a given population, and thus define its potential prospects. The importance of certain causes of death has also been constantly increasing as a result of the adoption by humans of unhealthy practices and their exposure to frequently occurring environmental risks [30].
Considering the above, relative time-specific, demographic mortality, and population data with respect to gender, age, and cause of death were exploited for the estimation of parameters. The estimated parameters were then visualized by a time series of gender-specific maps. Certain interesting findings can be extracted from the total of produced results.
Concerning the two genders, the produced results capture the fact that women face lower mortality risk during the first year of life, as well as higher longevity compared to men. In other words, more male infants do not survive at the critical age of [0, 1) years, while the male population is shown to have no concrete resilience to death. These findings are in agreement with those derived from the studies of [31,32]. According to [31], between the two genders, a growing male disadvantage in infant mortality has been noted in both European and non-European countries from the first half of the twentieth century onwards. This disadvantage is mainly due to the even greater vulnerability of males to mortality from perinatal conditions. Furthermore, as mentioned in [32], women live longer than men in most countries of Europe. The female advantage in longevity was mainly observed in the middle of the eighteenth century. During the twentieth century, this “gender gap” further increased because of the economic development and improved living conditions for women.
Moreover, men have been proven to be more vulnerable to various exogenous factors and unexpected events that affect mortality at both individual and population perspectives. A higher percentage of male than female individuals is documented to be linked with deaths caused by accidents, suicides, and exposure to several exogenous forces in European countries [33]. This percentage has been found to be analogous the percentage of male population’s deaths caused by natural disasters and other harmful socio-economic circumstances [34].
By the interpretation of temporal variations in the four parameters, it is concluded that the majority of the examined European countries generally present a “positive” tendency in infant mortality, with either constantly low or continuously decreasing levels over time. By analyzing data on deaths of children aged less than one year between 1994 and 2015, Onambele et al. [35] also found that infant mortality has declined steadily in the EU and its member states in the past decades. Demographically, this is reflected in an increase in human life expectancy. This increase is also reinforced by the upward tendency in the population aging over the time. Based on Suchecka and Urbaniak [36], there is no country in Europe that is not experiencing a growing number and proportion of elderly among its residents. In recent decades, deaths in Europe tend to be accumulated at ages over 75. This fact, in combination with the observed downward tendency in birth rates, can highly contribute to the transformation of the European population’s age composition in the next years. In particular, official data published by various agencies throughout Europe predicts that, by 2030, the elderly will be the one-quarter of European population [36].
In terms of vulnerability to exogenous factors, differentiations by the “nature” of vulnerability (individual and overall) is mainly detected over time. For males, the majority of the countries were found to generally show a stabilization in low individual vulnerability, and simultaneously an increasing tendency in overall vulnerability. Conversely, for females, a greatly decreasing tendency in the vulnerability of individuals and a stabilized “positive” tendency (with low parameter values) in the vulnerability of overall populations are pronounced for the majority of the countries. The most common explanations for these findings are considered to be biological risks, risks acquired through social roles, lifestyle, and behavior, as well as differential healthcare access, treatment, and use [37].
Regarding the spatial patterns identified in the four parameters, it can be stated that they are highly influenced by the geographical location and vicinity of the European countries. Geographically defined groups of countries such as the Nordic countries (Sweden, Norway, Finland, Denmark, and Iceland), Baltic countries (Estonia, Latvia, and Lithuania), Low Countries (the Netherlands and Belgium), Central European countries (France, Germany, Switzerland, Austria the Czech Republic, and Poland), Mediterranean countries (Greece, Italy, Spain, and Portugal), as well as the pair of the United Kingdom–Ireland, were found to present more or less similar tendencies over the time. For instance, with some exceptions from Norway, the Nordic countries generally indicated low infant mortality, high population aging, and concurrently low individual and population unexpected mortality, reflecting the very good living standards provided by them. In general, the Nordic countries rank highly on the basis of various socio-economic and health-relevant conditions such as high gender equality, educational attainment, and labor force participation, low income disparities, and a predominant publicly financed health-care system [38]. Their neighboring Baltic countries, however, showed strong fluctuations in the majority of cases, indicating a sensitivity in the four mortality-related parameters. This sensitivity could be explained by the particular size and age composition of their populations. Small and generally much younger populations characterize the specific group of countries [39].
Since 2008, a constantly increasing mortality of male population due to unexpected events was observed for the Central Europe countries, and mainly the Mediterranean countries. This increase most probably captures the impacts of the 2008 global economic crisis on mortality. An economic crisis is associated with job displacements and increasing unemployment rates, which tend to worsen life conditions. It is also highly related to mortality, due to specific causes or by affecting specific groups of the population [6]. As an example, Laliotis et al. [40] stated that deaths by suicide increased in the Mediterranean country of Greece during the 2008 economic crisis, with the association being strongest among men of working age (15–64 years). Furthermore, high levels were generally marked over the time by the Low Countries in terms of female individual unexpected mortality. The composition of their populations by a number of different nationalities have probably played a significant role in it. The Low Countries have revealed the largest proportions of immigrants in Europe for decades [41,42]. Long-term residence in a host country can lead to health deterioration among some immigrant groups as a result of poor living and healthcare conditions [43].
Some important assumptions of the study need to be pointed out. The variations in parameter κ are mostly related to age rather than gender. For any given individual, κ is expected to be higher during adolescence and early adult life as well as at ages from 50 to 75. This reflects the fact that young adults usually adopt a more risky lifestyle, while individuals between the ages of 50 and 75 tend to be more prone to unexpected health problems. Moreover, given that its estimation is based on individual/personal data (not always available from official statistical authorities), the conclusions derived from this parameter essentially constitute simple indications.
Similarly to the present study, research efforts that explore the dynamics of mortality throughout human life and its fluctuations over time can have a significant usefulness. In particular, the analysis of spatio-temporal variations of mortality can greatly contribute to understanding of the mechanisms underlying aging and mortality, as well as the planning and implementation of socio-economic strategies aiming to improve the quality of life, extend life expectancy, and reduce premature mortality. Furthermore, projections about the demographic progression of populations can be obtained. Based on these projections, governments can better manage their pension commitments and properly share their health-focused budgets.
In addition, considering the two genders, their differences in terms of mortality or health are considered to be complex since they mostly depend on biological, social/behavioral, and economic context. Due to the higher degree of difficulty for biological interventions (e.g., in genetics and hormones), policies aiming to promote and establish gender-specific health-seeking social behaviors and economic well-being—in relation to the “advantageous” gender detected from each of four examined mortality parameters—might reduce these differences. Especially as men increasingly behave more similarly to women, and as inequalities in employment, healthcare access, and familial responsibilities and involvement recede, so may the “gap” between them be narrowed.

Author Contributions

Conceptualization, Panagiotis Andreopoulos and Alexandra Tragaki; methodology, Panagiotis Andreopoulos; formal analysis, Panagiotis Andreopoulos and Christos Polykretis; data curation, Panagiotis Andreopoulos and Christos Polykretis; writing—original draft preparation, Panagiotis Andreopoulos, Christos Polykretis and Alexandra Tragaki; writing—review and editing, Panagiotis Andreopoulos and Christos Polykretis; visualization, Christos Polykretis; supervision, Alexandra Tragaki; project administration, Alexandra Tragaki; funding acquisition, Alexandra Tragaki All authors have read and agreed to the published version of the manuscript.

Funding

This research was funded by Harokopio University, grant number 458. The APC was funded by Harokopio University.

Acknowledgments

The authors wish to thank the journal’s editor for handling this article, as well as the colleagues who politely considered revising it.

Conflicts of Interest

The authors declare no conflict of interest.

References

  1. Currie, I.D.; Durban, M.; Eilers, P.H. Smoothing and forecasting mortality rates. Stat. Model. 2004, 4, 279–298. [Google Scholar] [CrossRef]
  2. Bosetti, C.; Bertuccio, P.; Chatenoud, L.; Negri, E.; Levi, F.; La Vecchia, C. Childhood cancer mortality in Europe, 1970–2007. Eur. J. Cancer 2010, 46, 384–394. [Google Scholar] [CrossRef] [PubMed]
  3. Amaro, J.; Severo, M.; Vilela, S.; Fonseca, S.; Fontes, F.; La Vecchia, C.; Lunet, N. Patterns of breast cancer mortality trends in Europe. Breast 2013, 22, 244–253. [Google Scholar] [CrossRef]
  4. Ferlay, J.; Steliarova-Foucher, E.; Lortet-Tieulent, J.; Rosso, S.; Coebergh, J.W.W.; Comber, H.; Forman, D.; Bray, F. Cancer incidence and mortality patterns in Europe: Estimatesfor 40 countries in 2012. Eur. J. Cancer 2013, 49, 1374–1403. [Google Scholar] [CrossRef] [Green Version]
  5. Hartley, A.; Marshall, D.C.; Salciccioli, J.D.; Sikkel, M.B.; Maruthappu, M.; Shalhoub, J. Trends in Mortality From Ischemic Heart Disease and Cerebrovascular Disease in Europe: 1980 to 2009. Circulation 2016, 133, 1916–1926. [Google Scholar] [CrossRef] [PubMed] [Green Version]
  6. Ballester, J.; Robine, J.-M.; Herrmann, F.R.; Xavier Rodó, X. Effect of the Great Recession on regional mortality trends in Europe. Nat. Commun. 2019, 10, 679. [Google Scholar] [CrossRef]
  7. Rey, G.; Jougla, E.; Fouillet, A.; Hémon, D. Ecological association between a deprivation index and mortality in France over the period 1997–2001: Variations with spatial scale, degree of urbanicity, age, gender and cause of death. BMC Public Health 2009, 9, 33. [Google Scholar] [CrossRef] [Green Version]
  8. Schuster, C.; Burkart, K.; Lakes, T. Heat mortality in Berlin – Spatial variability at the neighborhood scale. Urban Clim. 2014, 10, 134–147. [Google Scholar] [CrossRef]
  9. López-Abente, G.; Aragonés, N.; Pérez-Gómez, B.; Pollán, M.; García-Pérez, J.; Ramis, R.; Fernández-Navarro, P. Time trends in municipal distribution patterns ofcancer mortality in Spain. BMC Cancer 2014, 14, 535. [Google Scholar] [CrossRef] [PubMed] [Green Version]
  10. Almendra, R.; Santana, P.; Vasconcelos, J. Evidence of social deprivation on the spatial patterns of excess winter mortality. Int. J. Public Health 2017, 62, 849–856. [Google Scholar] [CrossRef] [Green Version]
  11. Yashin, A.I.; Iachine, I.A.; Begun, A.S. Mortality modeling: A review. Math. Popul. Stud. 2000, 8, 305–332. [Google Scholar] [CrossRef]
  12. Vaupel, J.W. Biodemography of human ageing. Nature 2010, 464, 536–542. [Google Scholar] [CrossRef] [PubMed] [Green Version]
  13. Booth, H.; Tickle, L. Mortality modelling and forecasting: A review of methods. Ann. Actuar. Sci. 2008, 3, 3–43. [Google Scholar] [CrossRef]
  14. Gompertz, B. On the nature of the function expressive of the law of human mortality, and on a new mode of determining the value of life contingencies. Philos. Trans. R. Soc. Lond. 1825, 115, 513–583. [Google Scholar]
  15. Makeham, W.M. On the law of mortality and construction of annuity tables. Assur. Mag. J. Inst. Actuar. 1860, 8, 301–310. [Google Scholar] [CrossRef] [Green Version]
  16. Skiadas, C.H.; Skiadas, C. A modeling approach to life table data sets. Recent Adv. Stoch. Modeling Data Anal. 2007, 350–359. [Google Scholar] [CrossRef] [Green Version]
  17. Gavrilov, L.A.; Gavrilova, N.S. The Quest for a General Theory of Aging and Longevity. Sci. Aging Knowl. Environ. 2003, 28, 5. [Google Scholar] [CrossRef] [Green Version]
  18. Vaupel, J.W. Lifesaving, lifetimes and lifetables. Demogr. Res. 2005, 13, 597–614. [Google Scholar] [CrossRef]
  19. Andreopoulos, P.; Bersimis, G.F.; Tragaki, A.; Rovolis, A. Mortality modeling using probability distributions: Application in greek mortality data. Commun. Stat. Theory Methods 2019, 48, 127–140. [Google Scholar] [CrossRef]
  20. Human Mortality Database (HMD). Mortality and Population Data. Available online: http://www.mortality.org/ (accessed on 26 November 2019).
  21. European Statistical Authority (Eurostat). Population Data. Available online: https://ec.europa.eu/eurostat/ (accessed on 26 November 2019).
  22. European Statistical Authority (Eurostat). Vector Layer of European Countries. Available online: https://ec.europa.eu/eurostat/ (accessed on 26 November 2019).
  23. Forfar, D.O.; McCutcheon, J.J.; Wilkie, A.D. On graduation by mathematical formula. J. Inst. Actuar. 1988, 115, 1–149. [Google Scholar] [CrossRef]
  24. Jones, M.C. On a class of distributions defined by the relationship between their density and distribution functions. Commun. Stat. Theory Methods 2007, 36, 1835–1843. [Google Scholar] [CrossRef]
  25. Kim, D.; Saada, A. The Social Determinants of Infant Mortality and Birth Outcomes in Western Developed Nations: A Cross-Country Systematic Review. Int. J. Environ. Res. Public Health 2013, 10, 2296–2335. [Google Scholar] [CrossRef] [Green Version]
  26. Myung, I.J. Tutorial on maximum likelihood estimation. J. Math. Psychol. 2003, 47, 90–100. [Google Scholar] [CrossRef]
  27. Amemiya, T. Advanced Econometrics; Harvard University Press: Cambridge, MA, USA, 1985. [Google Scholar]
  28. Elzhov, T.V.; Mullen, K.M.; Spiess, A.N.; Bolker, B. R Interface to the Levenberg-Marquardt Nonlinear Least-Squares Algorithm Found in MINPACK, Plus Support for Bounds. R Package Version 1.2-1. 2016, p. 14. Available online: https://cran.r-project.org/web/packages/minpack.lm/minpack.lm.pdf (accessed on 18 January 2020).
  29. Ayalew, L.; Yamagishi, H. The application of GIS-based logistic regression for landslide susceptibility mapping in the Kakuda-Yahiko Mountains Central Japan. Geomorphology 2005, 65, 15–31. [Google Scholar] [CrossRef]
  30. Kalogirou, S.; Tsimbos, C.; Verropoulou, G.; Kotsifakis, G. Regional mortality differentials in Greece by selected causes of death: 2006–2008. J. Maps 2012, 8, 354–360. [Google Scholar] [CrossRef]
  31. Drevenstedt, G.L.; Crimmins, E.M.; Vasunilashorn, S.; Finch, C.E. The rise and fall of excess male infant mortality. Proc. Natl. Acad. Sci. USA 2008, 105, 5016–5021. [Google Scholar] [CrossRef] [PubMed] [Green Version]
  32. Organisation for Economic Co-Operation and Development (OECD). Health at a Glance 2019: OECD Indicators; OECD Publishing: Paris, France, 2019. [Google Scholar]
  33. Wasserman, D.; Cheng, Q.; Jiang, G.X. Global suicide rates among young people aged 15–19. World Psychiatry 2005, 4, 114–120. [Google Scholar]
  34. Lenart, P.; Kuruczova, D.; Joshi, P.K.; Bienertová-Vašků, J. Male mortality rates mirror mortality rates of older females. Sci. Rep. 2019, 9, 10589. [Google Scholar] [CrossRef] [Green Version]
  35. Onambele, L.; San Martin-Rodríguez, L.; Niu, H.; Alvarez-Alvarez, I.; Arnedo-Pena, A.; Guillen-Grima, F.; Aguinaga-Ontoso, I. Infant mortality in the European Union: A time trend analysis of the 1994–2015 period. An. De Pediatría 2019, 91, 219–227. [Google Scholar] [CrossRef]
  36. Suchecka, J.; Urbaniak, B. Determinants of Healthy Ageing for Older People in European Countries—A Spatio-Temporal Approach. Comp. Econ. Res. 2016, 19, 157–178. [Google Scholar] [CrossRef]
  37. Oksuzyan, A.; Juel, K.; Vaupel, J.W.; Christensen, K. Men: Good health and high mortality. Sex differences in health and aging. Aging Clin. Exp. Res. 2008, 20, 91–102. [Google Scholar] [CrossRef] [Green Version]
  38. Nordic Burden of Disease Collaborators. Life expectancy and disease burden in the Nordic countries: Results from the Global Burden of Diseases, Injuries, and Risk Factors Study 2017. Lancet Public Health 2019, 4, e658–e669. [Google Scholar] [CrossRef]
  39. Hazans, M. Migration Experience of the Baltic Countries in the Context of Economic Crisis. In Labor Migration, EU Enlargement, and the Great Recession; Kahanec, M., Zimmermann, K.F., Eds.; Springer: Berlin/Heidelberg, Germany, 2016; pp. 297–344. [Google Scholar]
  40. Laliotis, I.; Ioannidis, J.P.A.; Stavropoulou, C. Total and cause-specific mortality before and after the onset of the Greek economic crisis: An interrupted time-series analysis. Lancet Public Health 2016, 1, e56–e65. [Google Scholar] [CrossRef] [Green Version]
  41. Lafaut, D.; Vandenheede, H.; Surkyn, J.; Coene, G. Counting the non-existing: Causes of death of undocumented migrants in Brussels-Capital Region (Belgium), 2005–2010. Arch. Public Health 2019, 77. [Google Scholar] [CrossRef] [Green Version]
  42. Van Meeteren, M.; van de Pol, S.; Dekker, R.; Engbersen, G.; Snel, E. Destination Netherlands: History of Immigration and Immigration Policy in the Netherlands. In Immigrants: Acculturation, Socioeconomic Challenges and Cultural Psychology; Ho, J., Ed.; Nova Science Publishers: New York, NY, USA, 2013; pp. 113–170. [Google Scholar]
  43. Domnich, A.; Panatto, D.; Gasparini, R.; Amicizia, D. The “healthy immigrant” effect: Does it exist in Europe today? Ital. J. Public Health 2012, 9, e7532–e7537. [Google Scholar]
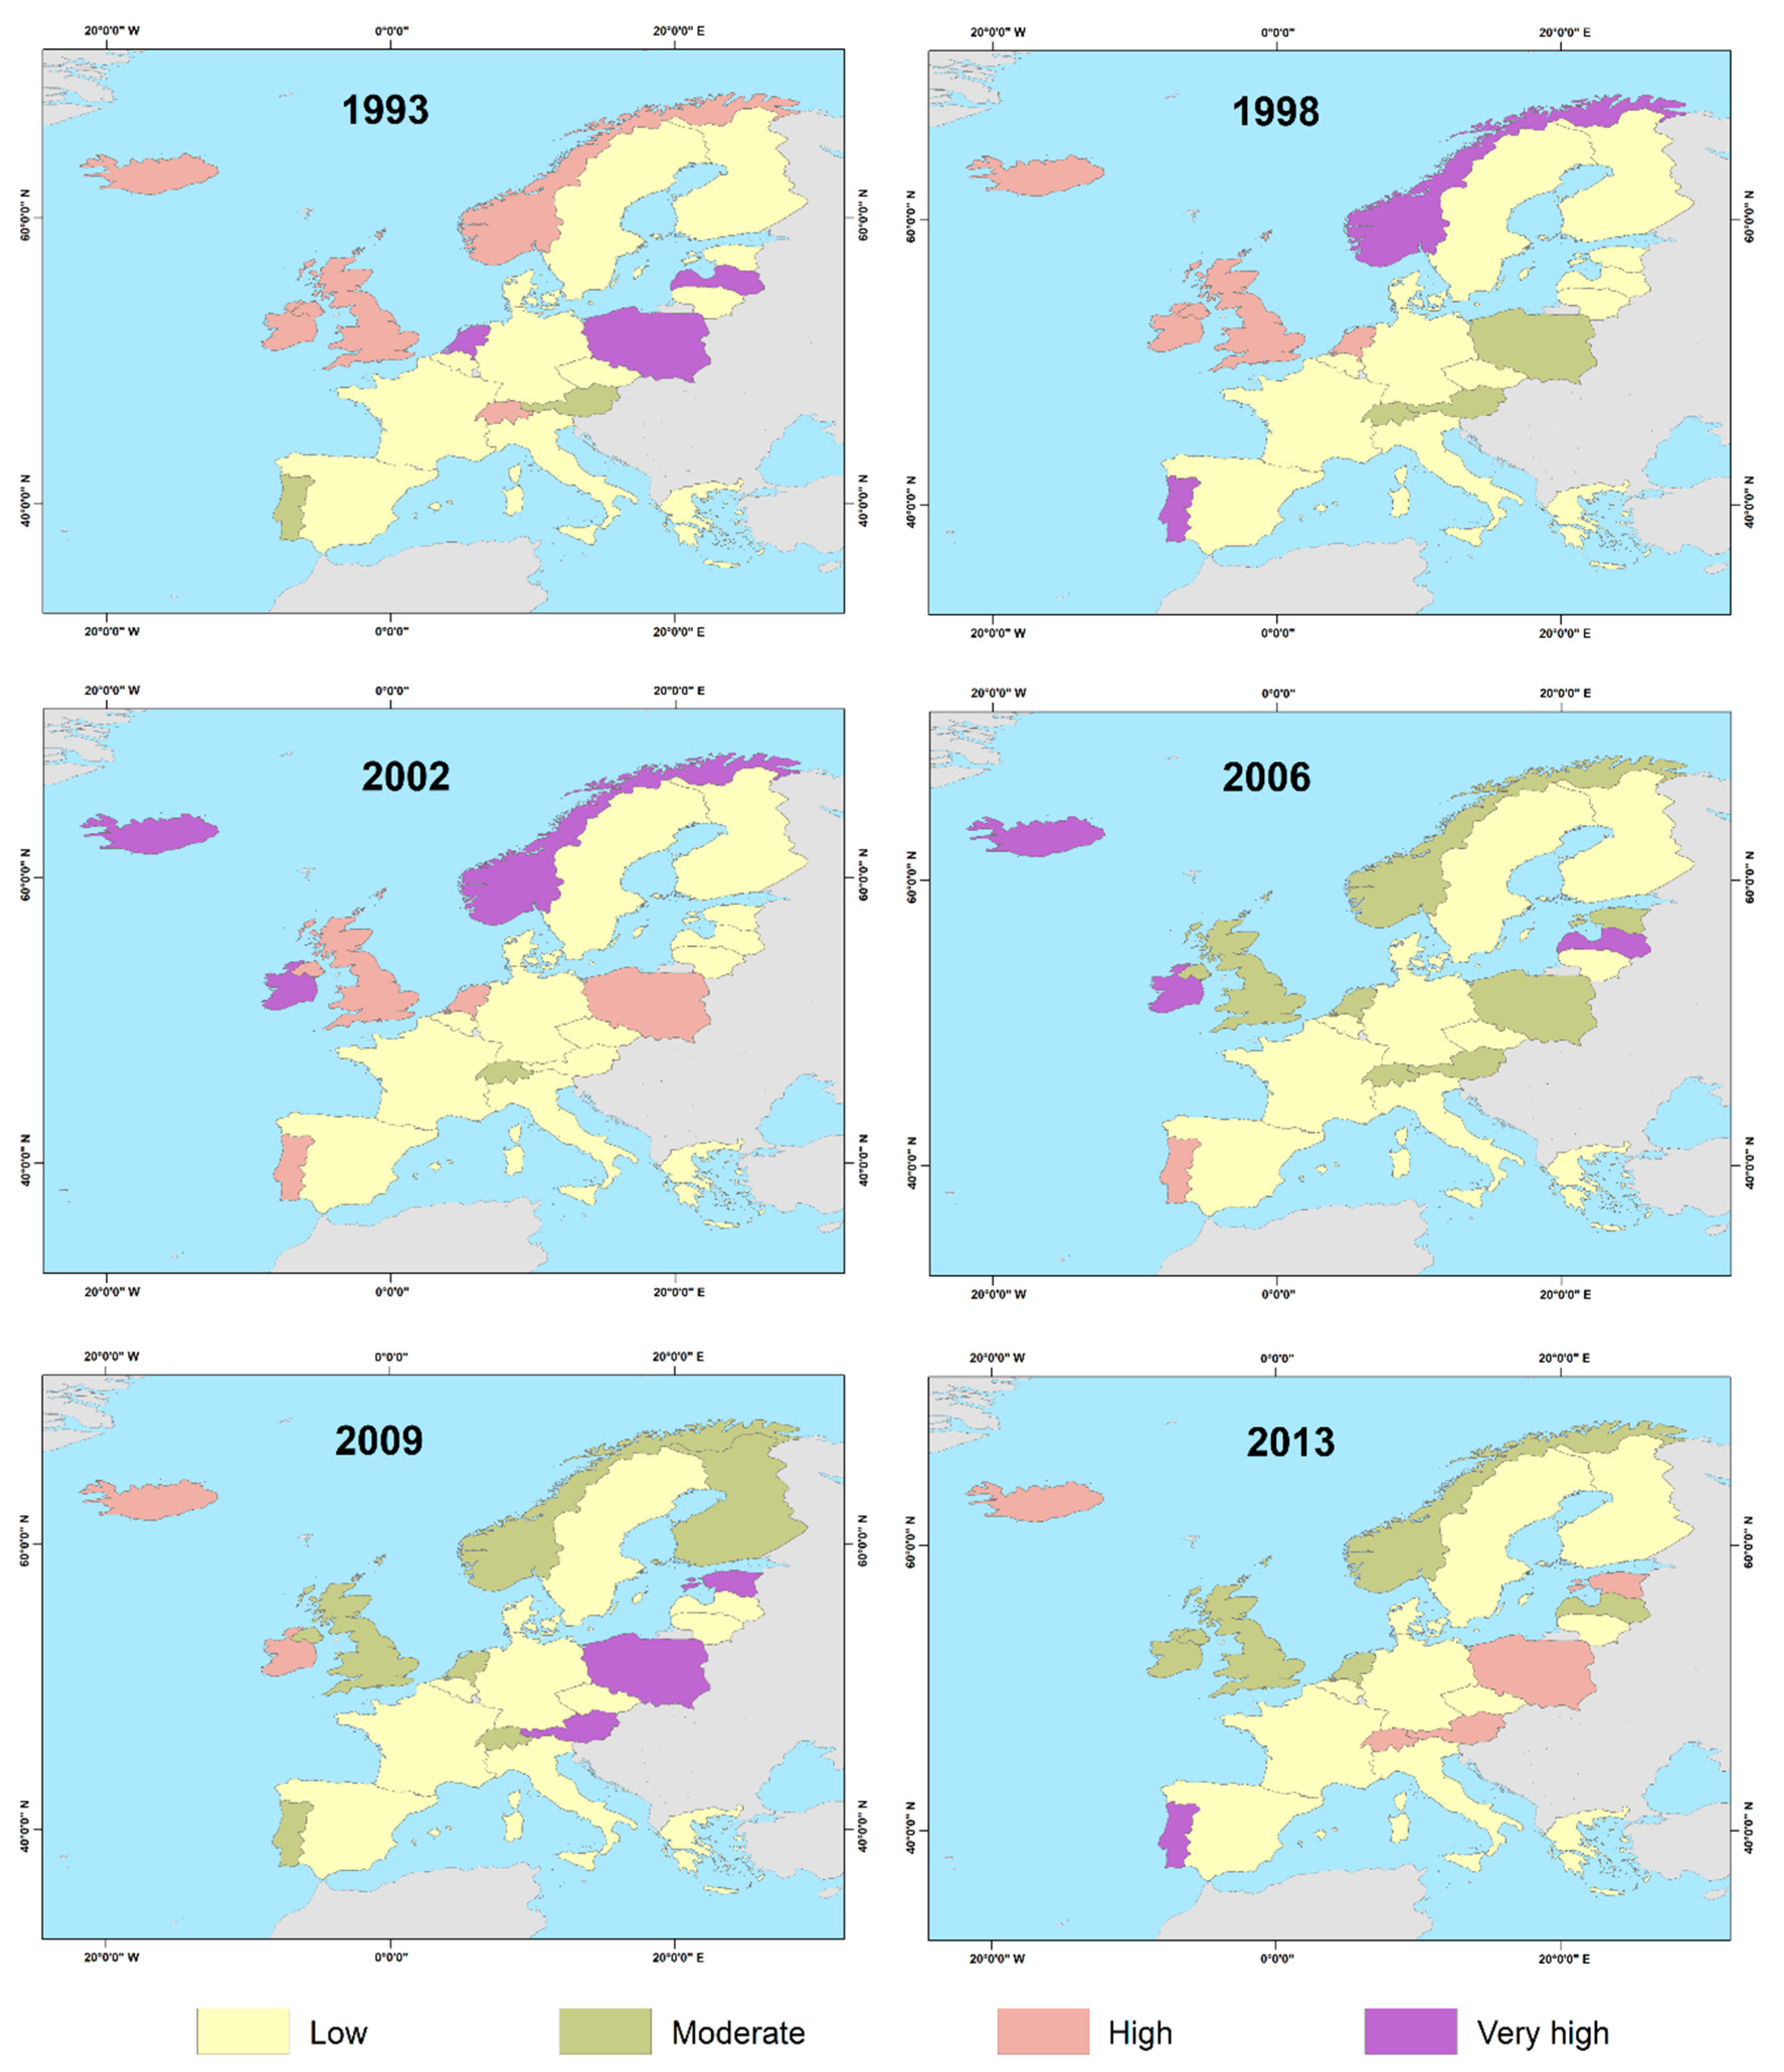
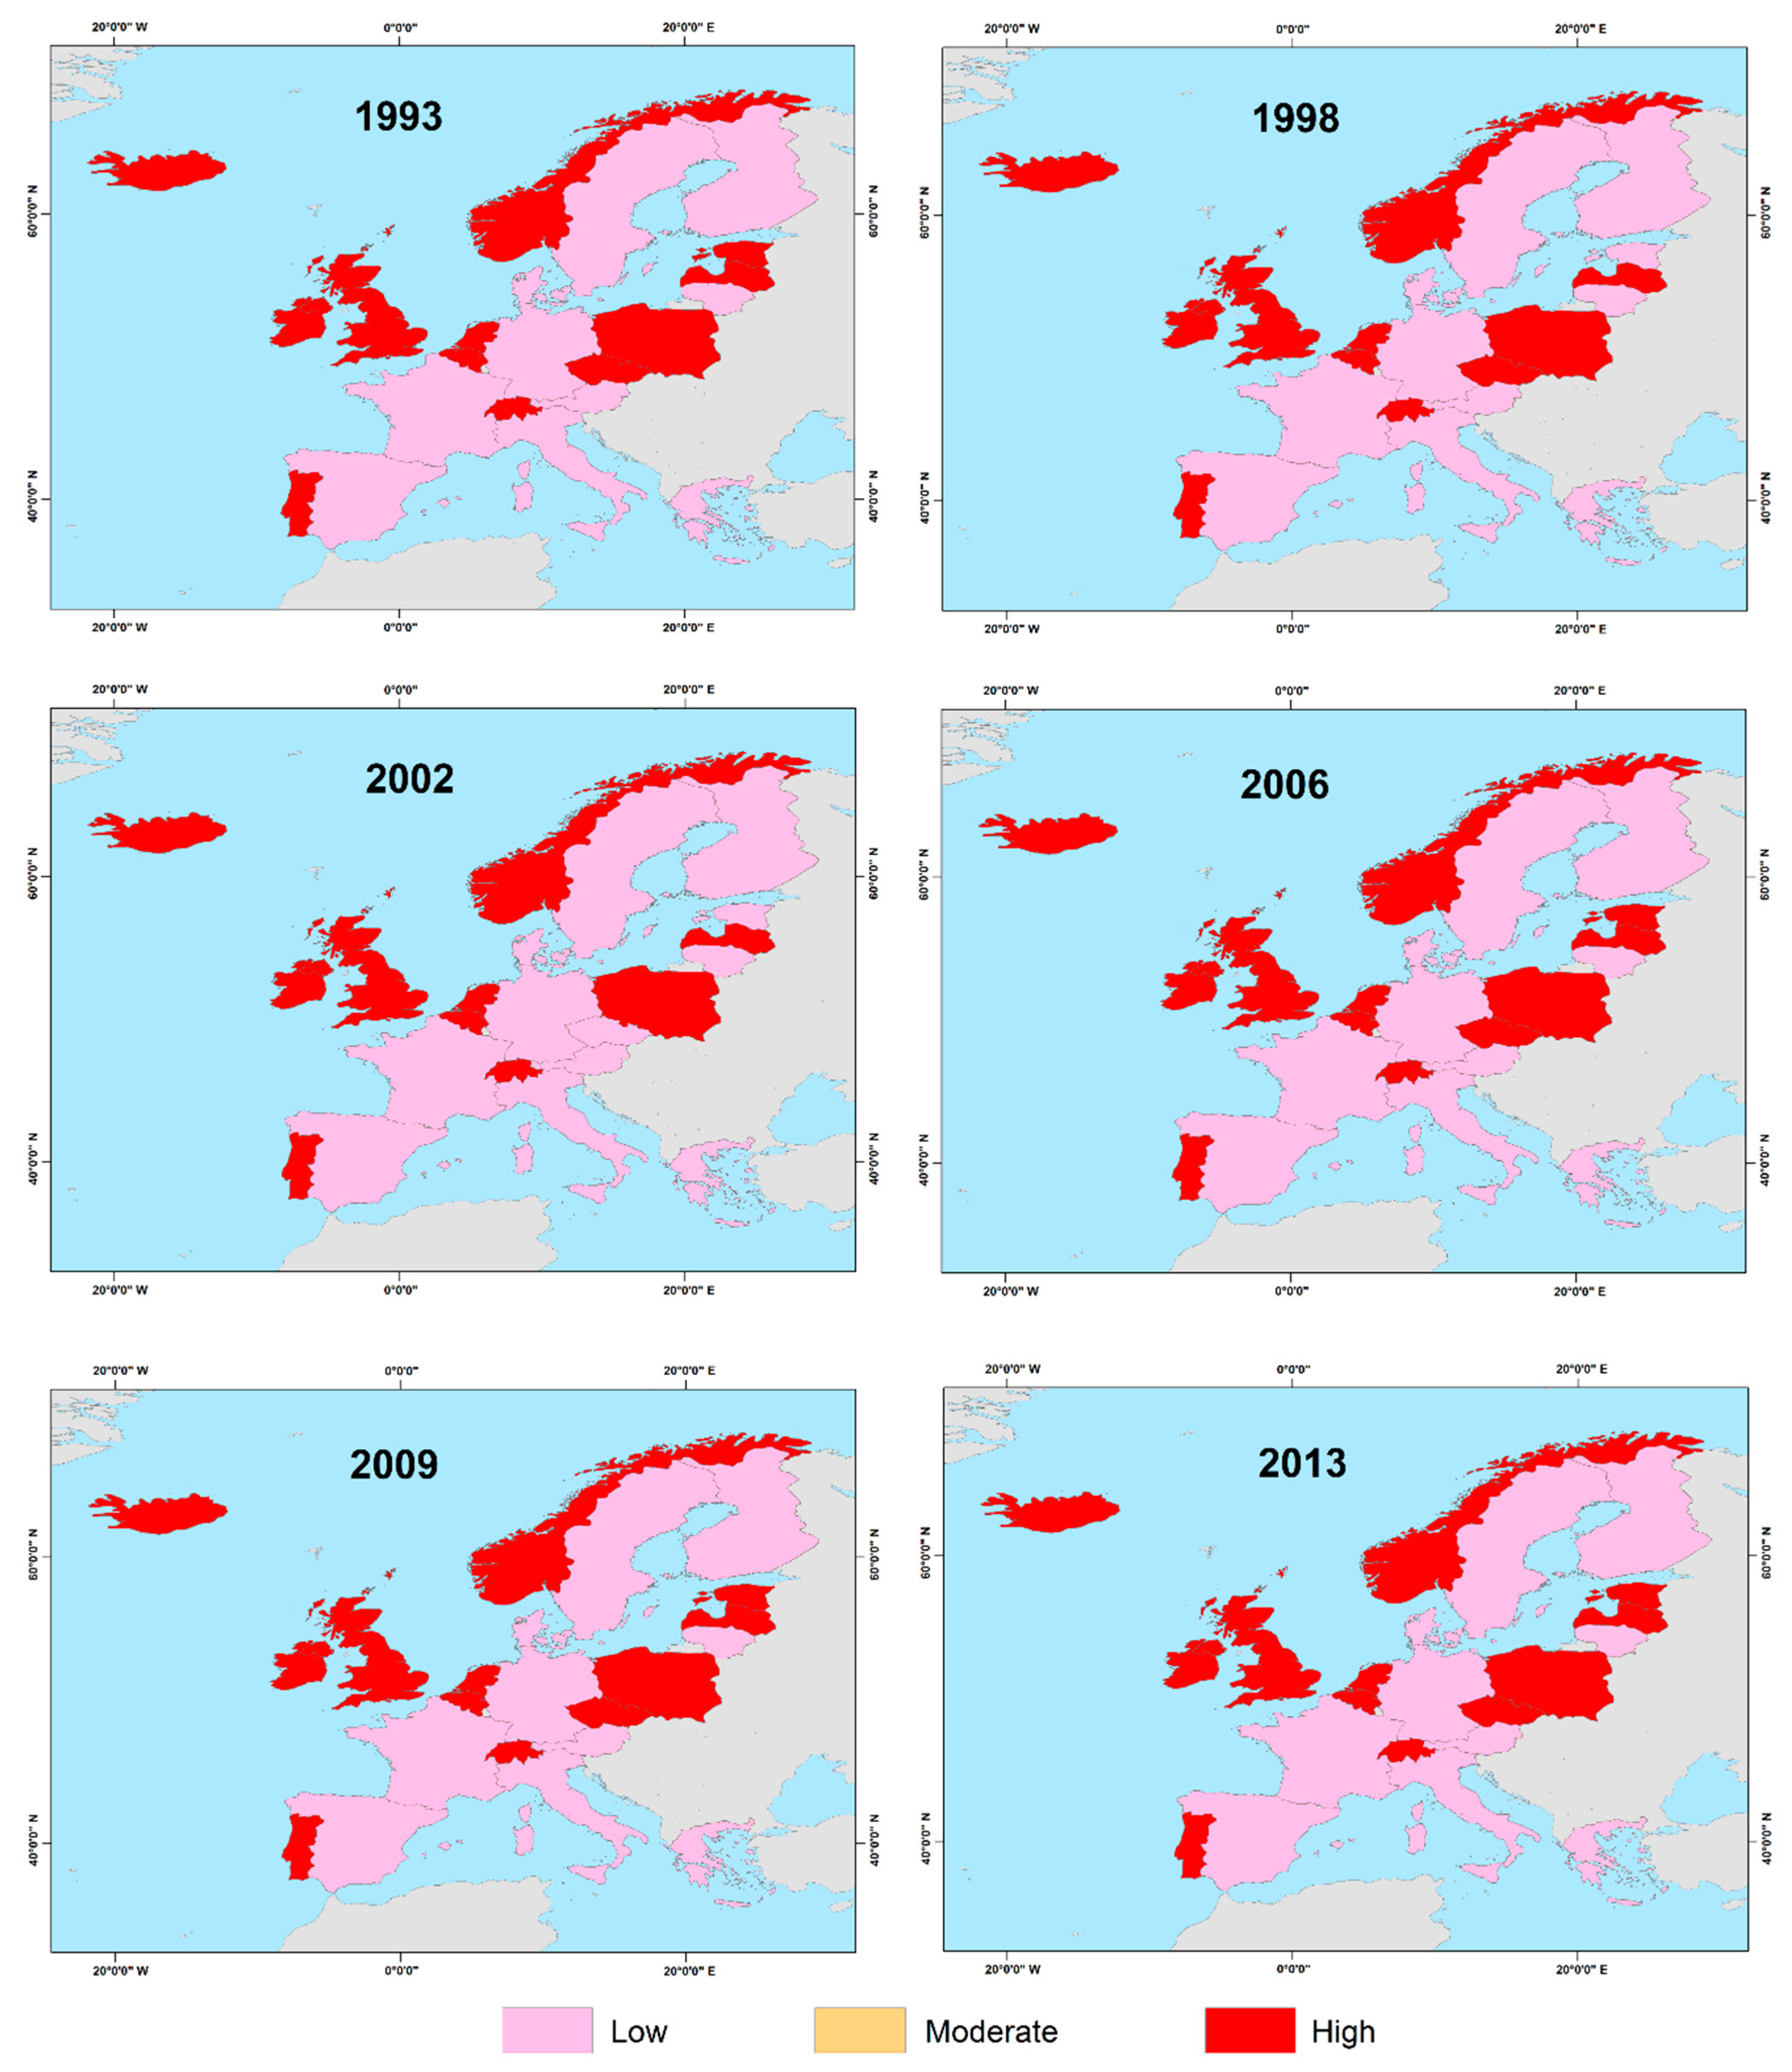
Figure 1. European countries examined in the study.
Ijgi 09 00547 g001
Figure 2. Parameter values estimated for male gender in selected years of the period 1993–2013: (a) Infant mortality (parameter θ); (b) Population aging (parameter ξ); (c) Individual unexpected mortality (parameter κ); (d) Population mortality due to hazardous events (parameter λ).
Ijgi 09 00547 g002aIjgi 09 00547 g002b
Figure 3. Parameter values estimated for female gender in selected years of period 1993–2013: (a) Infant mortality (parameter θ); (b) Population aging (parameter ξ); (c) Individual unexpected mortality (parameter κ); (d) Population mortality due to hazardous events (parameter λ).
Ijgi 09 00547 g003aIjgi 09 00547 g003b
Figure 4. Infant mortality (parameter θ) for male gender in 1993, 1998, 2002, 2006, 2009, and 2013.
Ijgi 09 00547 g004
Figure 5. Infant mortality (parameter θ) for female gender in 1993, 1998, 2002, 2006, 2009, and 2013.
Ijgi 09 00547 g005
Figure 6. Population aging (parameter ξ) for male gender in 1993, 1998, 2002, 2006, 2009, and 2013.
Ijgi 09 00547 g006
Figure 7. Population aging (parameter ξ) for female gender in 1993, 1998, 2002, 2006, 2009, and 2013.
Ijgi 09 00547 g007
Figure 8. Individual unexpected mortality (parameter κ) for male gender in 1993, 1998, 2002, 2006, 2009, and 2013.
Ijgi 09 00547 g008
Figure 9. Individual unexpected mortality (parameter κ) for female gender in 1993, 1998, 2002, 2006, 2009, and 2013.
Ijgi 09 00547 g009
Figure 10. Population mortality due to hazardous events (parameter λ) for male gender in 1993, 1998, 2002, 2006, 2009, and 2013.
Ijgi 09 00547 g010
Figure 11. Population mortality due to hazardous events (parameter λ) for female gender in 1993, 1998, 2002, 2006, 2009, and 2013.
Ijgi 09 00547 g011
Table 1. The standard deviation classification method for the gender-specific values of parameters.
ClassesStandard Deviations
MalesFemales
Low<−0.5 std<−0.5 std
Moderate−0.5–0.5 std−0.5–0.5 std
High0.5–1.5 std> 0.5 std
Very high>1.5 std

