Linguistic Landscapes on Street-Level Images


Department of Geography, Kyung Hee University, Seoul 02447, Korea
ISPRS Int. J. Geo-Inf. 2020, 9(1), 57; https://doi.org/10.3390/ijgi9010057
Submission received: 25 December 2019
/
Revised: 9 January 2020
/
Accepted: 19 January 2020
/
Published: 20 January 2020
(This article belongs to the Special Issue Deep Learning and Computer Vision for GeoInformation Sciences)
Abstract
:Linguistic landscape research focuses on relationships between written languages in public spaces and the sociodemographic structure of a city. While a great deal of work has been done on the evaluation of linguistic landscapes in different cities, most of the studies are based on ad-hoc interpretation of data collected from fieldwork. The purpose of this paper is to develop a new methodological framework that combines computer vision and machine learning techniques for assessing the diversity of languages from street-level images. As demonstrated with an analysis of a small Chinese community in Seoul, South Korea, the proposed approach can reveal the spatiotemporal pattern of linguistic variations effectively and provide insights into the demographic composition as well as social changes in the neighborhood. Although the method presented in this work is at a conceptual stage, it has the potential to open new opportunities to conduct linguistic landscape research at a large scale and in a reproducible manner. It is also capable of yielding a more objective description of a linguistic landscape than arbitrary classification and interpretation of on-site observations. The proposed approach can be a new direction for the study of linguistic landscapes that builds upon urban analytics methodology, and it will help both geographers and sociolinguists explore and understand our society.
1. Introduction
The increasing availability of high-resolution geospatial data and the development of advanced methods over the past decade have changed many aspects of research activities, from how we collect, process and analyze data to how we report and interpret the findings. The rapid progress in computer vision and natural language processing allows us to extract information from a variety of unstructured data, such as images, videos, and web pages. Unmanned aerial vehicles, also called drones, have become tools for acquiring precise orthophotos in a timely manner, and machine learning techniques have enabled fast and accurate object detection and classification. The role of visualization is now crucial not only in exploring large-scale data, but also in presenting results from complex analysis.
Urban analytics is a new discipline that emerged in this context. While its definition varies from scholar to scholar, it is essentially a field that studies dynamic urban processes using new forms of data and methods. The analysis of geo-tagged data from social media for identifying retail center locations and catchments [1] may be a case in point. The application of quantitative, computational, and visual methods to less conventional data sets is growing popular in the fields of geography and urban studies, helping us understand and solve various problems in cities more effectively.
This methodological paradigm shift has affected the study of linguistic landscapes to some extent. In general, linguistic landscape research focuses on relationships between written languages in public spaces and the sociodemographic structure of a city. Fieldwork is an important part of the data collection process in many previous studies of this sort: sociolinguists and ethnographers visited a place of interest, took photographs of signage and interviewed business owners, residents, and shoppers to derive social meaning from the landscape. This approach is, however, difficult to be carried out in distant, inaccessible, or vast areas, and it requires a great deal of effort to conduct longitudinal surveys [2].
To overcome these limitations of on-site data collection, several recent studies have suggested or demonstrated the use of street-level images on the Internet as an alternative source of information [3]. Google Street View (GSV), for example, contains millions of panoramic images along roads and streets in major cities, so it can provide a more convenient and efficient way of gathering linguistic landscapes in urban areas. However, the literature to date tends to use street-level images as supplementary data only, and there has been little attention given to how scholars can process and analyze a large amount of imagery for linguistic landscape research.
The purpose of this paper is to develop a new methodological framework for exploring linguistic landscapes captured in street-level images. The proposed method utilizes computer vision and machine learning techniques to assess the diversity of languages visible in each scene. As will be demonstrated with an example of a small Chinese community in Seoul, South Korea, it can reveal the spatiotemporal pattern of linguistic variations effectively and provide insights into the demographic composition as well as social changes in the neighborhood.
Although the method presented in this work is at a conceptual stage, it has the potential to open new opportunities to conduct linguistic landscape research at a larger scale and in a reproducible manner. The use of street-level images enables researchers to examine the linguistic landscapes of distant and less accessible areas without visiting places physically [3], so it can facilitate spatiotemporal comparisons of large geographic areas, which would not be possible with traditional approaches relying on fieldwork. Furthermore, the present method can yield more objective interpretation of linguistic landscapes by minimizing selection bias that may occur in observational studies [4].
This paper is organized as follows. In the next section, I briefly review the concept of the linguistic landscape and introduce recent applications of street-level images across a range of urban studies. The following section describes the study area, as well as the procedures for collecting, processing and analyzing its street-level images. Section 4 summarizes the findings from the analysis and validates the results. This paper concludes with a discussion on the value and limitations of the proposed method for linguistic landscape research in the context of urban analytics.
2. Previous Studies
2.1. Linguistic Landscape
Following the definition of Landry and Bourhis [5], the term linguistic landscape generally refers to all readable features that are visible to people in an area. In most of previous studies, the concept is applied to static objects, such as “public road signs, advertising billboards, street names, place names, commercial shop signs, and public signs on government buildings” (p. 25 in [5]), but nonstationary signage can also be subjects of analysis as in [6,7,8,9]. While interest in languages on signs has been there for a long time [6,10], it has received more attention than ever before in the last two decades. Numerous case studies have been conducted for places around the globe, and relationships between a linguistic landscape and various aspects of society have been investigated.
In multilingual cities, such as Brussels in Belgium and Montreal in Canada, a linguistic landscape and its geographic distribution represent the relative power and status of language groups inhabiting the region. An early survey of Tulp [11] on the languages of commercial billboards in Brussels found that the majority of them were written in French and such tendency was more prominent in the south of the city, where French-speaking people were primarily concentrated. More recent studies reported similar results [12,13,14,15], although there were noticeably more street signs in English for a variety of reasons (see [12] for a detailed discussion on this matter). Aside from the argument of whether or not this is appropriate for maintaining a bilingual environment, the dominance of French billboards in Brussels provided empirical evidence for the link between the linguistic landscape and the strengths of linguistic communities in the territory.
Linguistic landscape research on other bilingual cities also showed similarities to the situation of Brussels. Monnier [16] carried out a survey on outdoor signage in Montreal’s commercial sector to monitor its compliance with Québec’s language legislation and found that a large proportion of the signs were written exclusively in French. The linguistic landscape of Jerusalem also reflected the demographic composition of the city and power relations among ethnic groups: monolingual Hebrew and bilingual Hebrew–English signs were dominant in Jewish localities, where Arabic was almost invisible, while Hebrew was frequently observed as well even in areas populated by Palestinian Israelis [17,18]. The outcomes from these empirical studies and many others (e.g., the cases of European Union member states [13], Chinatown in New York [19,20], and the Māori language in New Zealand) suggest that the linguistic landscape is not merely a product of the linguistic population makeup, but it is influenced by historical, political, social, and economic motives.
Linguistic landscapes can shed light on significant societal changes, such as the progress in globalization, the increase of immigrants, and the growing importance of tourism. As society becomes more diverse in terms of ethnicity and culture through globalization and immigration, the public tolerance towards the use of foreign languages rises in general, and it leads to linguistic heterogeneity on signage even in monolingual countries. Local communities, whose economy relies on tourism, in particular, are more likely to exhibit bilingual signs, because they “prefer a language understood by potential customer even in cases where the sign writer’s skill condition is only partially met” (p. 25 in [6]).
As such, a longitudinal analysis of a city’s linguistic landscape can offer a useful insight into the demographic, social, and economic changes occurring in the city. However, as Backaus [21] clearly noted, this type of study requires two or more successive surveys over several years, and it usually demands an enormous amount of time and money. A great deal of the existing literature on this topic is based on field observations and quantitative analysis of pictures, ranging from 20 to several thousands, which undoubtedly need considerable efforts. Furthermore, the selection of survey sites and the categorization of signs in the current approach are mostly a subjective practice [4], so the results may be biased towards hypotheses or preconceptions [22]. As will be illustrated in the rest of the paper, the integrated use of street-level images and computer vision techniques can be a reasonable alternative for exploring linguistic landscapes. Recently, street-level images available on the Internet have become a valuable source of information in the field of urban studies, and they can be used for linguistic landscape research as well.
2.2. Street-Level Images
The widespread use of mobile devices and the advances in computing and telecommunication technologies have made it easier to collect, process and share street-level images of various locations. There is now a massive amount of crowdsourced street-level imagery available on social media, and online map service providers offer panoramic views of streets as part of their products [23]. In general, street-level images have higher spatial resolution than aerial or satellite images and show more details from the pedestrian point of view. It contains a tremendous amount of information about space and place, and the utilization of street-level images becomes increasingly popular in the field of urban studies.
The feasibility, advantages, and limitations of using street-level images have been assessed for a wide range of applications. Rundle and his colleagues [24], for example, compared the results from neighborhood audits using in-person measurements and GSV and concluded that street-level images can be a cost-effective, yet reliable method for characterizing neighborhood environments. A number of recent studies have demonstrated that GSV can also be used for the measurement of street greenery in urban areas [25,26,27]: although it may not wholly replace high-resolution satellite imagery or field surveys, GSV and other profile views of urban landscape can represent the distribution of greenery “from the same viewpoint in which citizens experience and see the urban landscape” (p. 93 in [26]). The use of street-level images has illustrated for land use classification [28,29], building classification [30], pedestrian volume estimation [31], and urban canyon mapping [32], and it has the potential to be extended to linguistic landscape research.
To utilize street-level images for the evaluation of linguistic landscapes, two computer vision techniques, namely scene text detection and recognition methods, are essential. There is extensive research being conducted on this subject in the computer science literature, and a good review is provided in [33,34,35]. In general, the identification of typeset text on scanned documents is a relatively straightforward process and achieves high recognition rates [36], especially when the language is correctly prespecified. Offline, handwritten, and multilingual texts tend to be more difficult to read, but the development of neural-network-based methods has resulted in significant progress over the last several years.
Text detection and recognition from natural scene images, such as street-level images, are even more challenging [37]. Natural scene images display many features in varying distances, and the features are not always horizontally aligned. Texts on natural scene images, also known as scene texts, are unpredictable in terms of color, font, size, and orientation, and the background is not necessarily clean. As such, the detection and recognition rates of scene texts are still considerably lower than reading words from scanned documents [38], even with state-of-the-art approaches. However, this field is currently experiencing rapid progress, and thus, the combined use of these computer vision techniques with the existing data collection and visualization methods can be a promising approach to linguistic landscape research.
3. Materials and Methods
3.1. Study Area
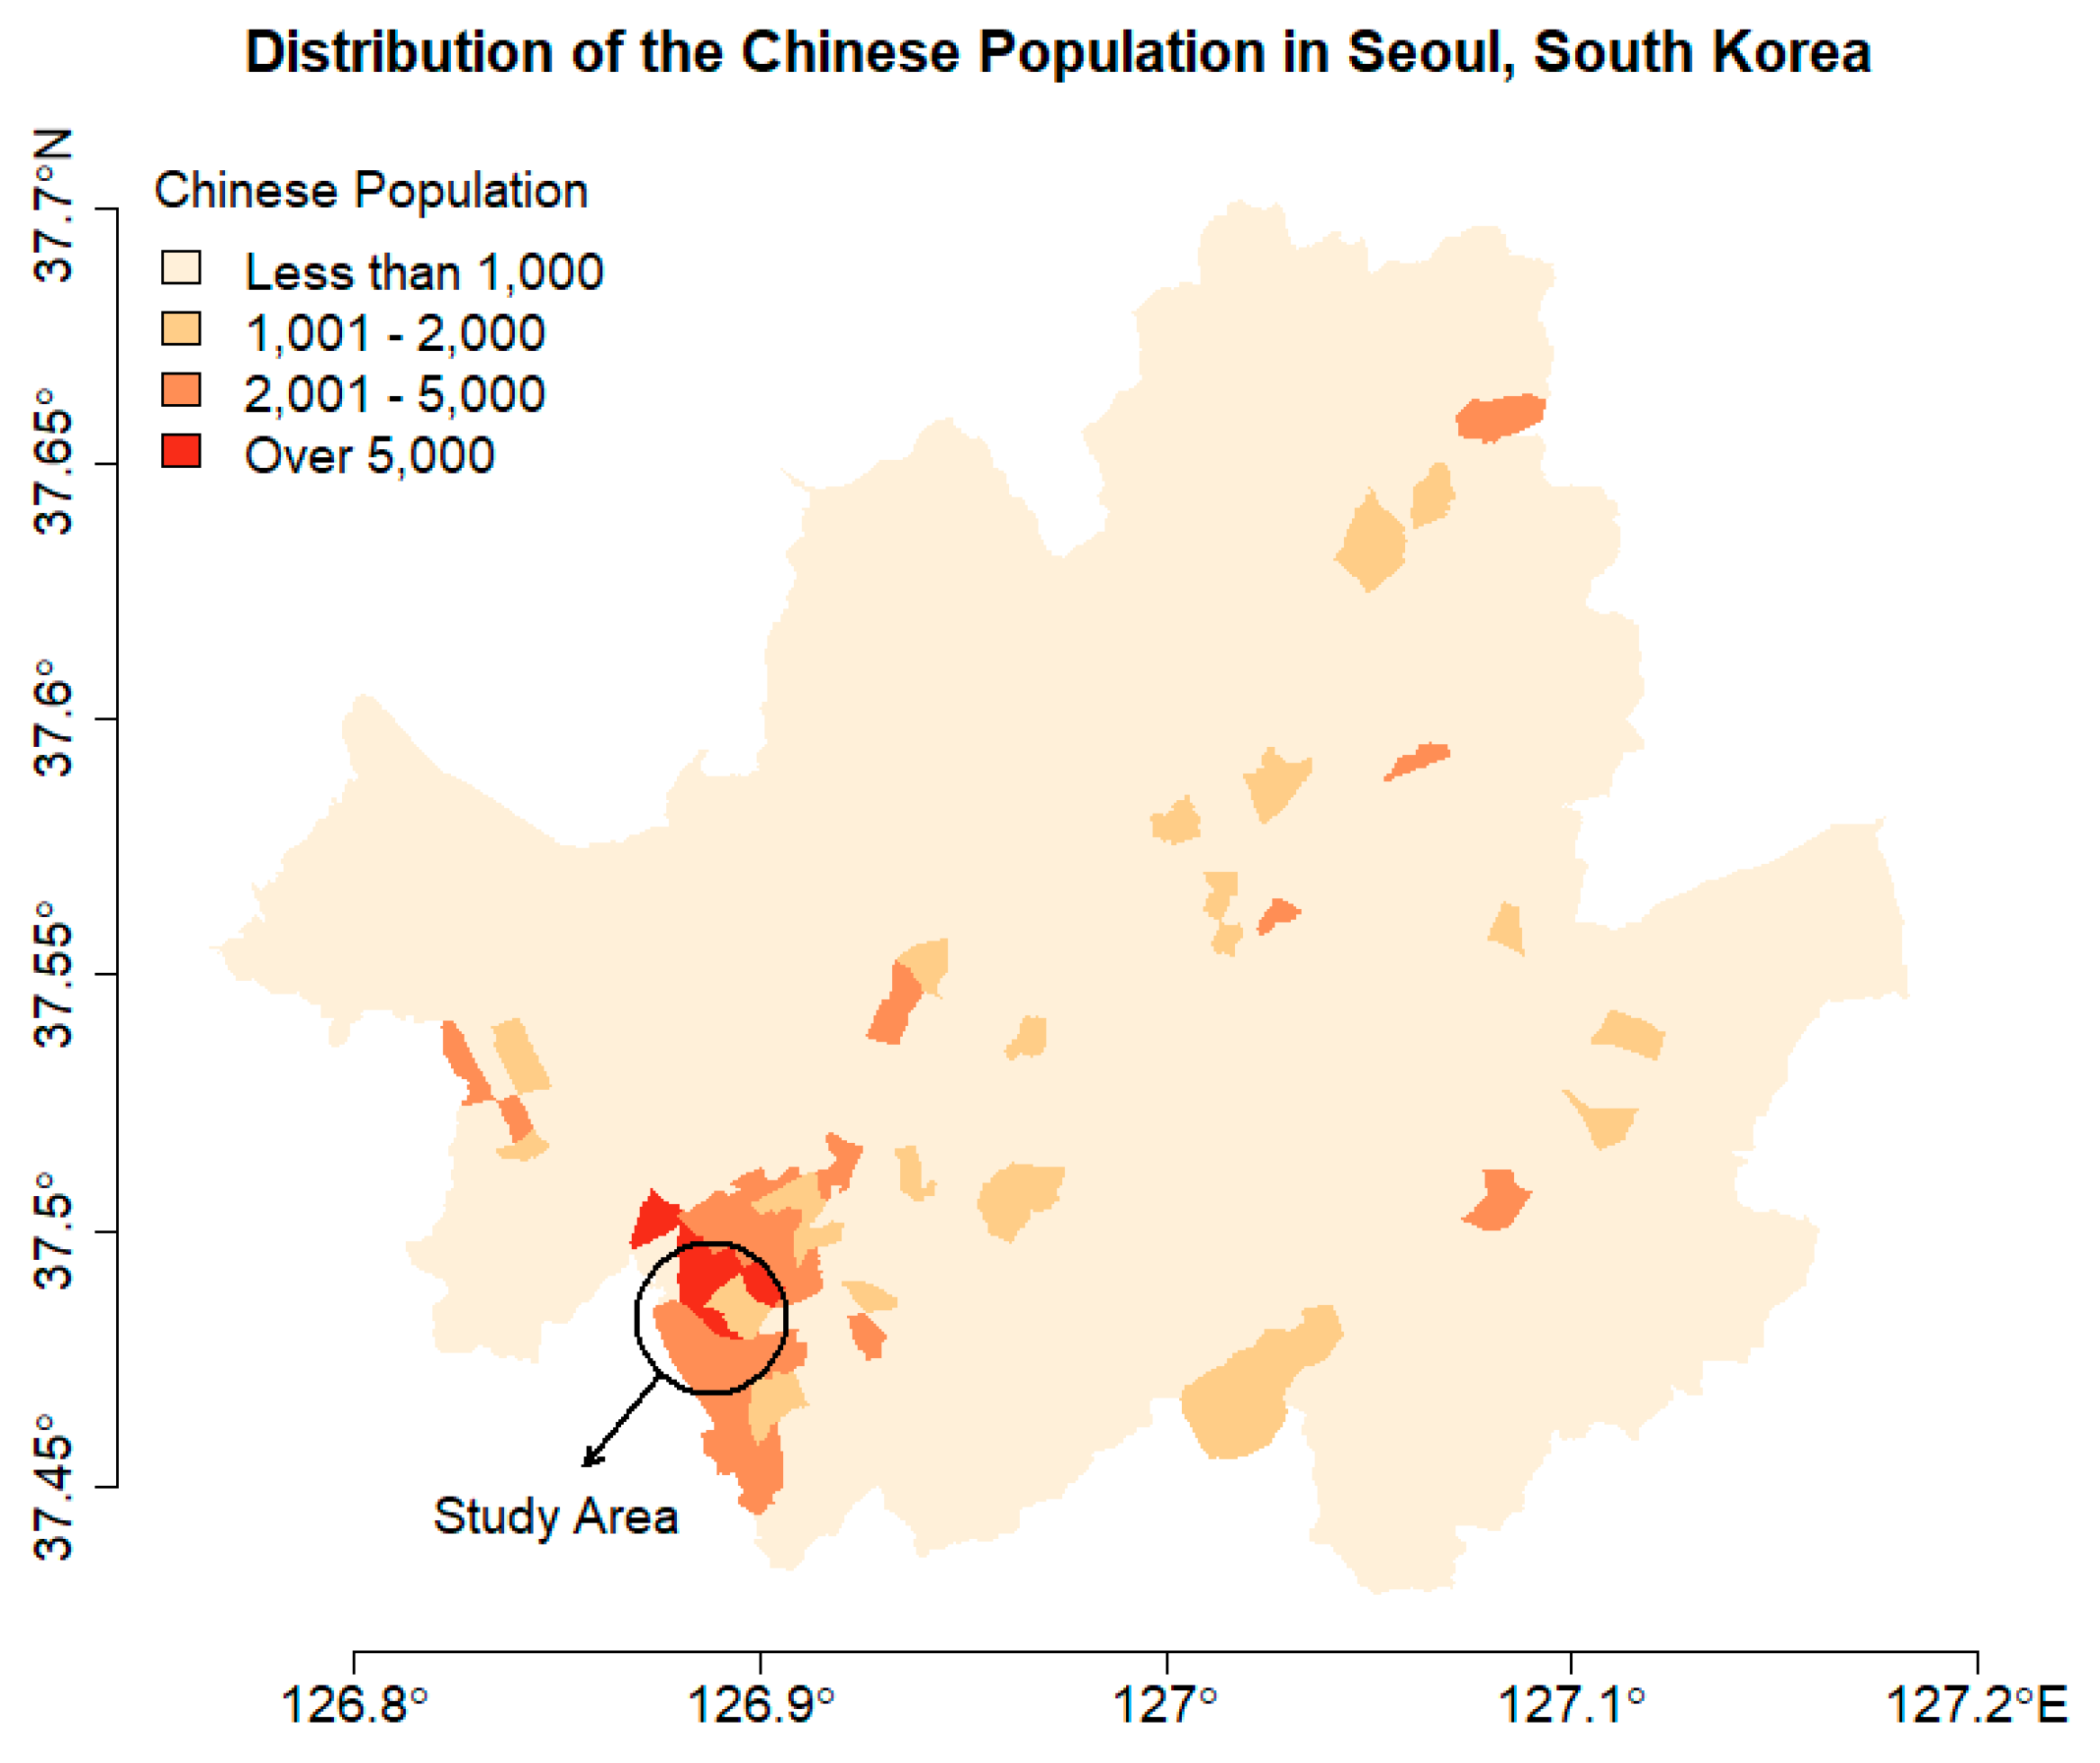
This paper focuses on the linguistic landscape of a small ethnic neighborhood called Garibong-dong in the capital city of South Korea, Seoul. Garibong-dong is one of the 424 administrative zones in Seoul and is located in the southwestern part of the city (i.e., the circled area of Figure 1). As of 2018, there are 190,060 Chinese people living in Seoul, and more than one-third of them are clustered in the two districts, namely Guro-gu and Yeongdeungpo-gu [39]. The study area of this paper, Garibong-dong, is part of Guro-gu and is home to 7332 Chinese people [40].
This paper explores the linguistic landscape of Garibong-dong, because it is one of a few places, in which the foreign population comprises an appreciable proportion in the local demographic composition. Foreigners account for only 2.8% of the total population in Seoul [39], making the city virtually monolingual, so the city’s linguistic landscape is mostly dominated by the Korean language [41]. It is certainly not an ideal environment for demonstrating a new methodological framework, so a subarea that exhibits at least some degree of linguistic diversity is carefully chosen instead. Garibong-dong is situated within the most noticeable ethnic community, and the linguistic landscape portrays a mixture of Korean, English, and Chinese. While the linguistic landscape of Garibong-dong may not represent that of the entire city, it can be helpful for validating the proposed approach.
3.2. Street-Level Image Collection
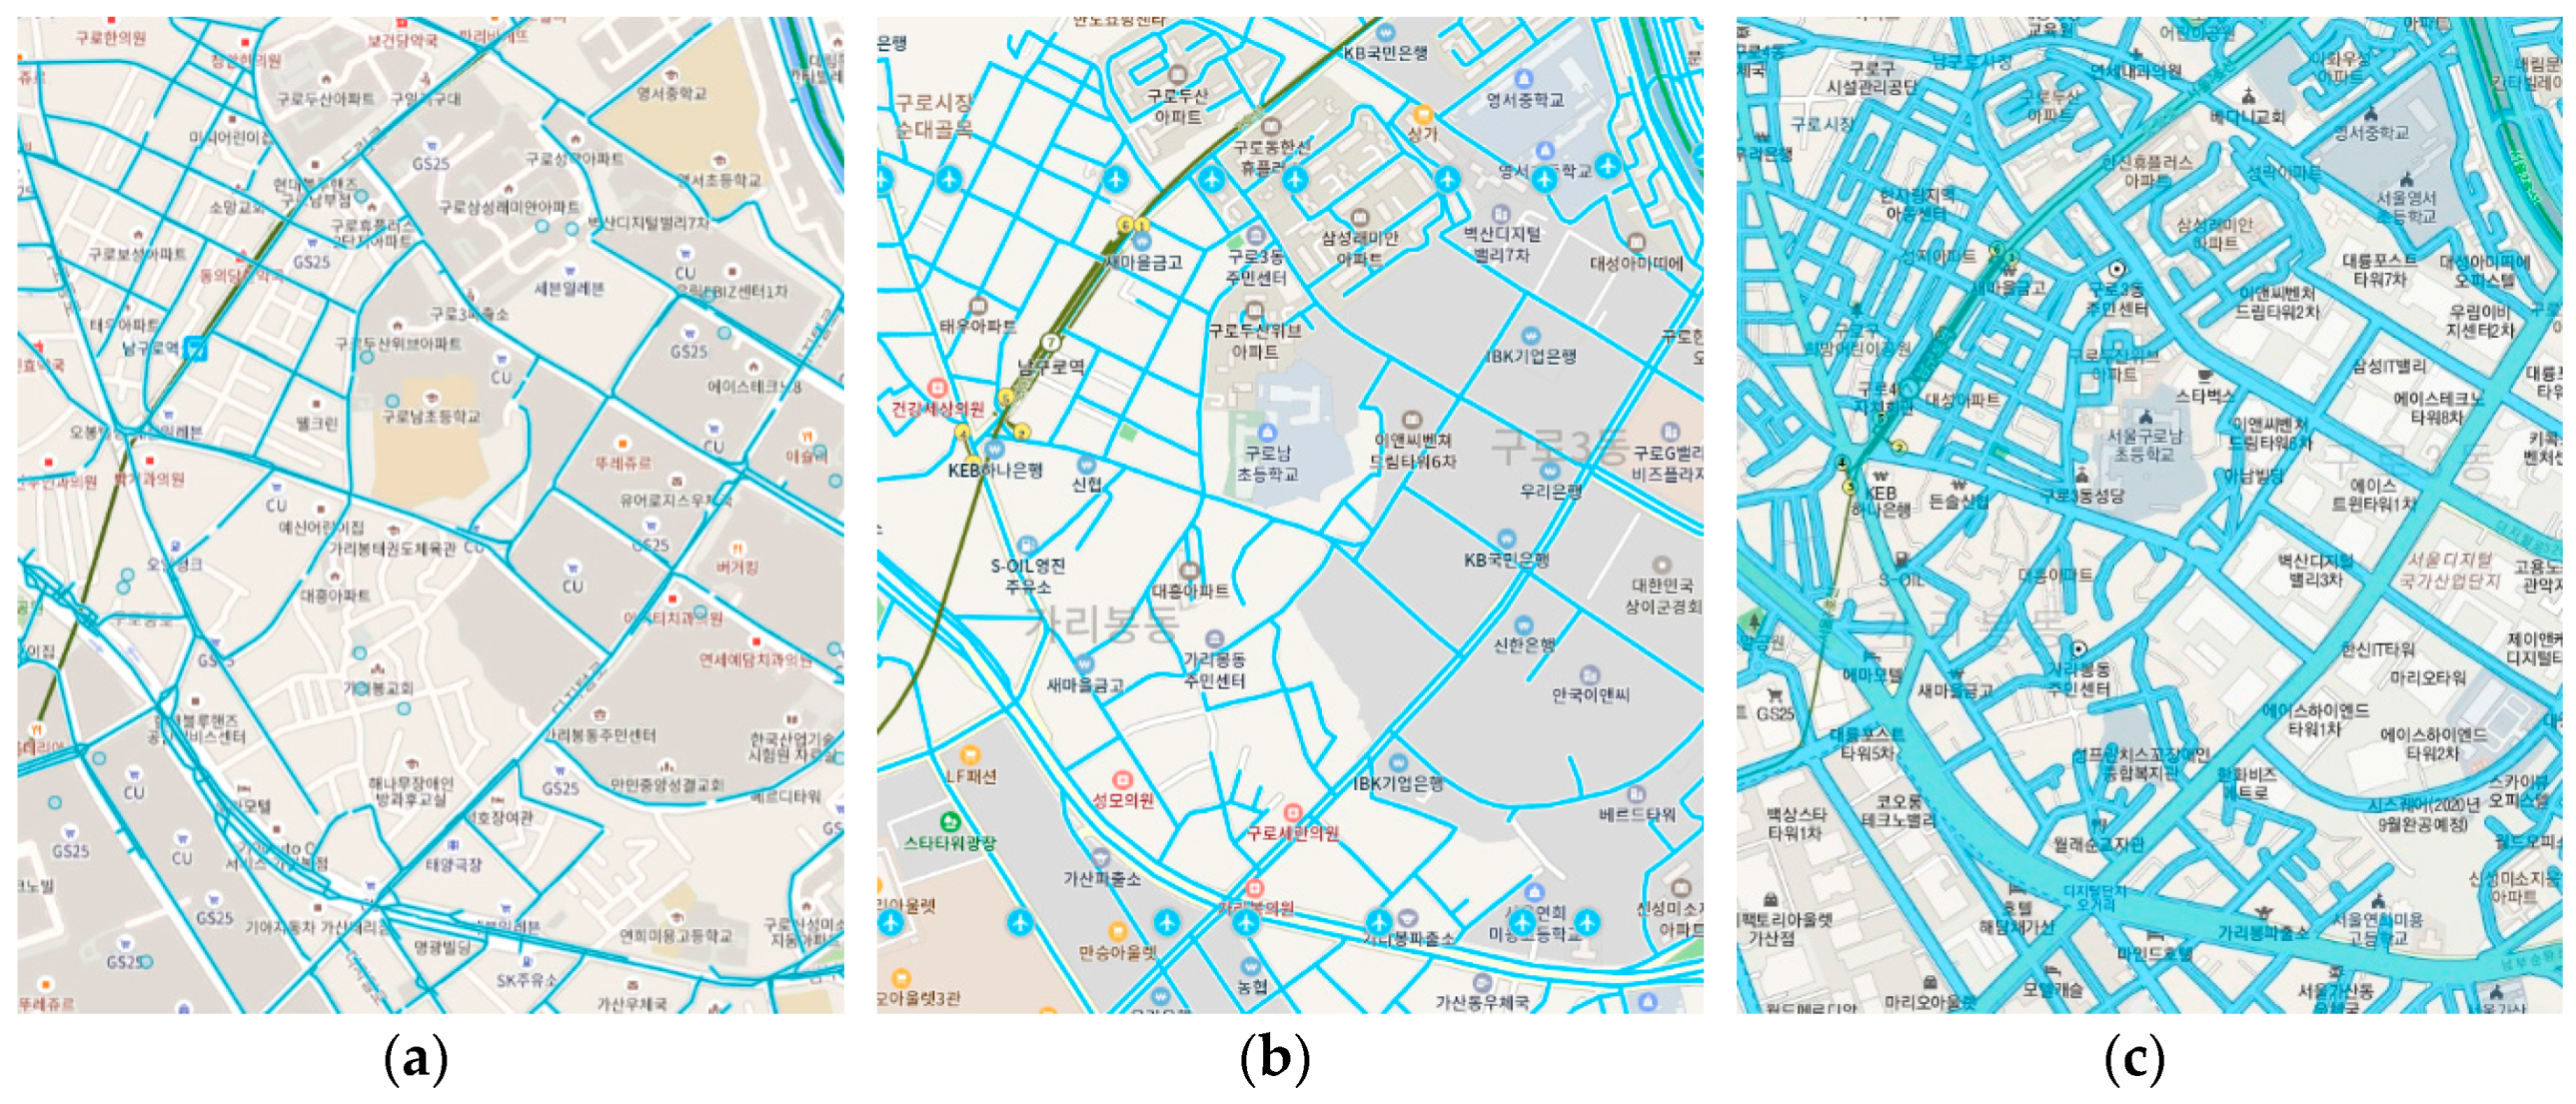
This paper uses street-level images available from Kakao Road View, offered by one of the most popular online map services in the country, Kakao Map. While GSV provides street-level images for South Korea, its coverage is relatively limited compared to those of local competitors, Naver Street View and Kakao Road View. The blue overlays in Figure 2a–c indicate roads, where street-level images are accessible on the three platforms, and they suggest that Kakao Road View has the most extensive coverage in the study area. Furthermore, since Kakao Map was the first to start the street-level image service in the country, it has more streetscapes captured from the earliest period, making it suitable for spatiotemporal comparisons of a linguistic landscape.
The data collection process was conducted at 709 randomly selected sampling points in the study area. Initially, a random point generation tool implemented in QGIS attempted to create 1000 sampling points along the road network, each of which should be at least 10 meters apart from the others. However, it ended up with 709 points due to the distance constraint. Of the sampling points, 43.3% (or 307 out of 709) had no images at all or duplicate views, because the points were too close to the other points. Street-level images were gathered from the remaining 402 locations, and the total number of collected scenes was 3032. At the time of this study, the application programming interface (API) for Kakao Road View allowed for the access to only the most recent view, so the images had to be collected manually.
At most of the sampling points, there were images for more than one timeframe, usually one or two per year. Each point had about 7.54 street-level images on average, resulting in more than 200 panoramic views for each year, except for 2008. The yearly distribution is given in Table 1: there seem to be notably more images taken in 2014 and 2018, so these two years, along with 2010, will be used for exploratory spatial data analysis in Section 4. It may be worth mentioning that all the street-level images were collected at a fixed resolution of 1280 × 760 pixels and that the viewing angle was determined to display as many signs and billboards as possible in a scene.
3.3. Image Processing
As discussed in the previous section, the text detection and recognition from natural scenes are very challenging tasks. Although several state-of-art approaches are already implemented in open-source software, such as OpenCV [42], and major cloud computing vendors, including Amazon Web Services, Google Cloud, and Microsoft Azure, offer machine-learning-based applications, the detection and recognition rates are still unsatisfactory, especially for non-Latin characters. This difficulty is particularly problematic in the present paper, because the Korean and Chinese languages form the vast majority in the study area’s linguistic landscape. To overcome this issue, a two-stage classification approach was adopted: it first applied a general feature detection method to the images for identifying all visible objects and then used a random forest algorithm for classifying them into those with and without text. By doing so, a relatively high text detection rate of 78.94% was achieved, as will be explained in this section.
The general feature detection was carried out through the Google Vision API. It identified a total of 146 unique objects from 3032 street-level images, and Table 2 shows some of the frequently observed features. Since Garibong-dong is part of a metropolitan area and has a mixture of residential and commercial land uses, relevant features, such as “neighborhood”, “city”, “residential area”, “metropolitan area”, “building”, and “urban area”, were commonly found (Table 2). The frequent appearance of “street”, “road”, and “vehicle” might be reasonable as well, considering the fact that the images were originally taken along roads and streets. Interestingly, there were features like “advertising” and “signage” that directly indicate the presence of text in the scene. However, their numbers were relatively small (217 and 72 images, respectively, out of 3032), and many images containing signs and billboards did not include such features.
To better classify the images into those with and without text (e.g., signs, billboards, and banners), a random forest algorithm was applied to the features detected. The training data set was created by manually classifying 50 images that were randomly selected. The classified groups were imbalanced in terms of size: more than two-thirds of the references (or 36 out of 50 images) had some signs or billboards, and only less than 30% displayed no text at all. Nevertheless, the algorithm with 500 random trees performed well, and the overall accuracy against the manual classification was about 78.94% (Table 3).
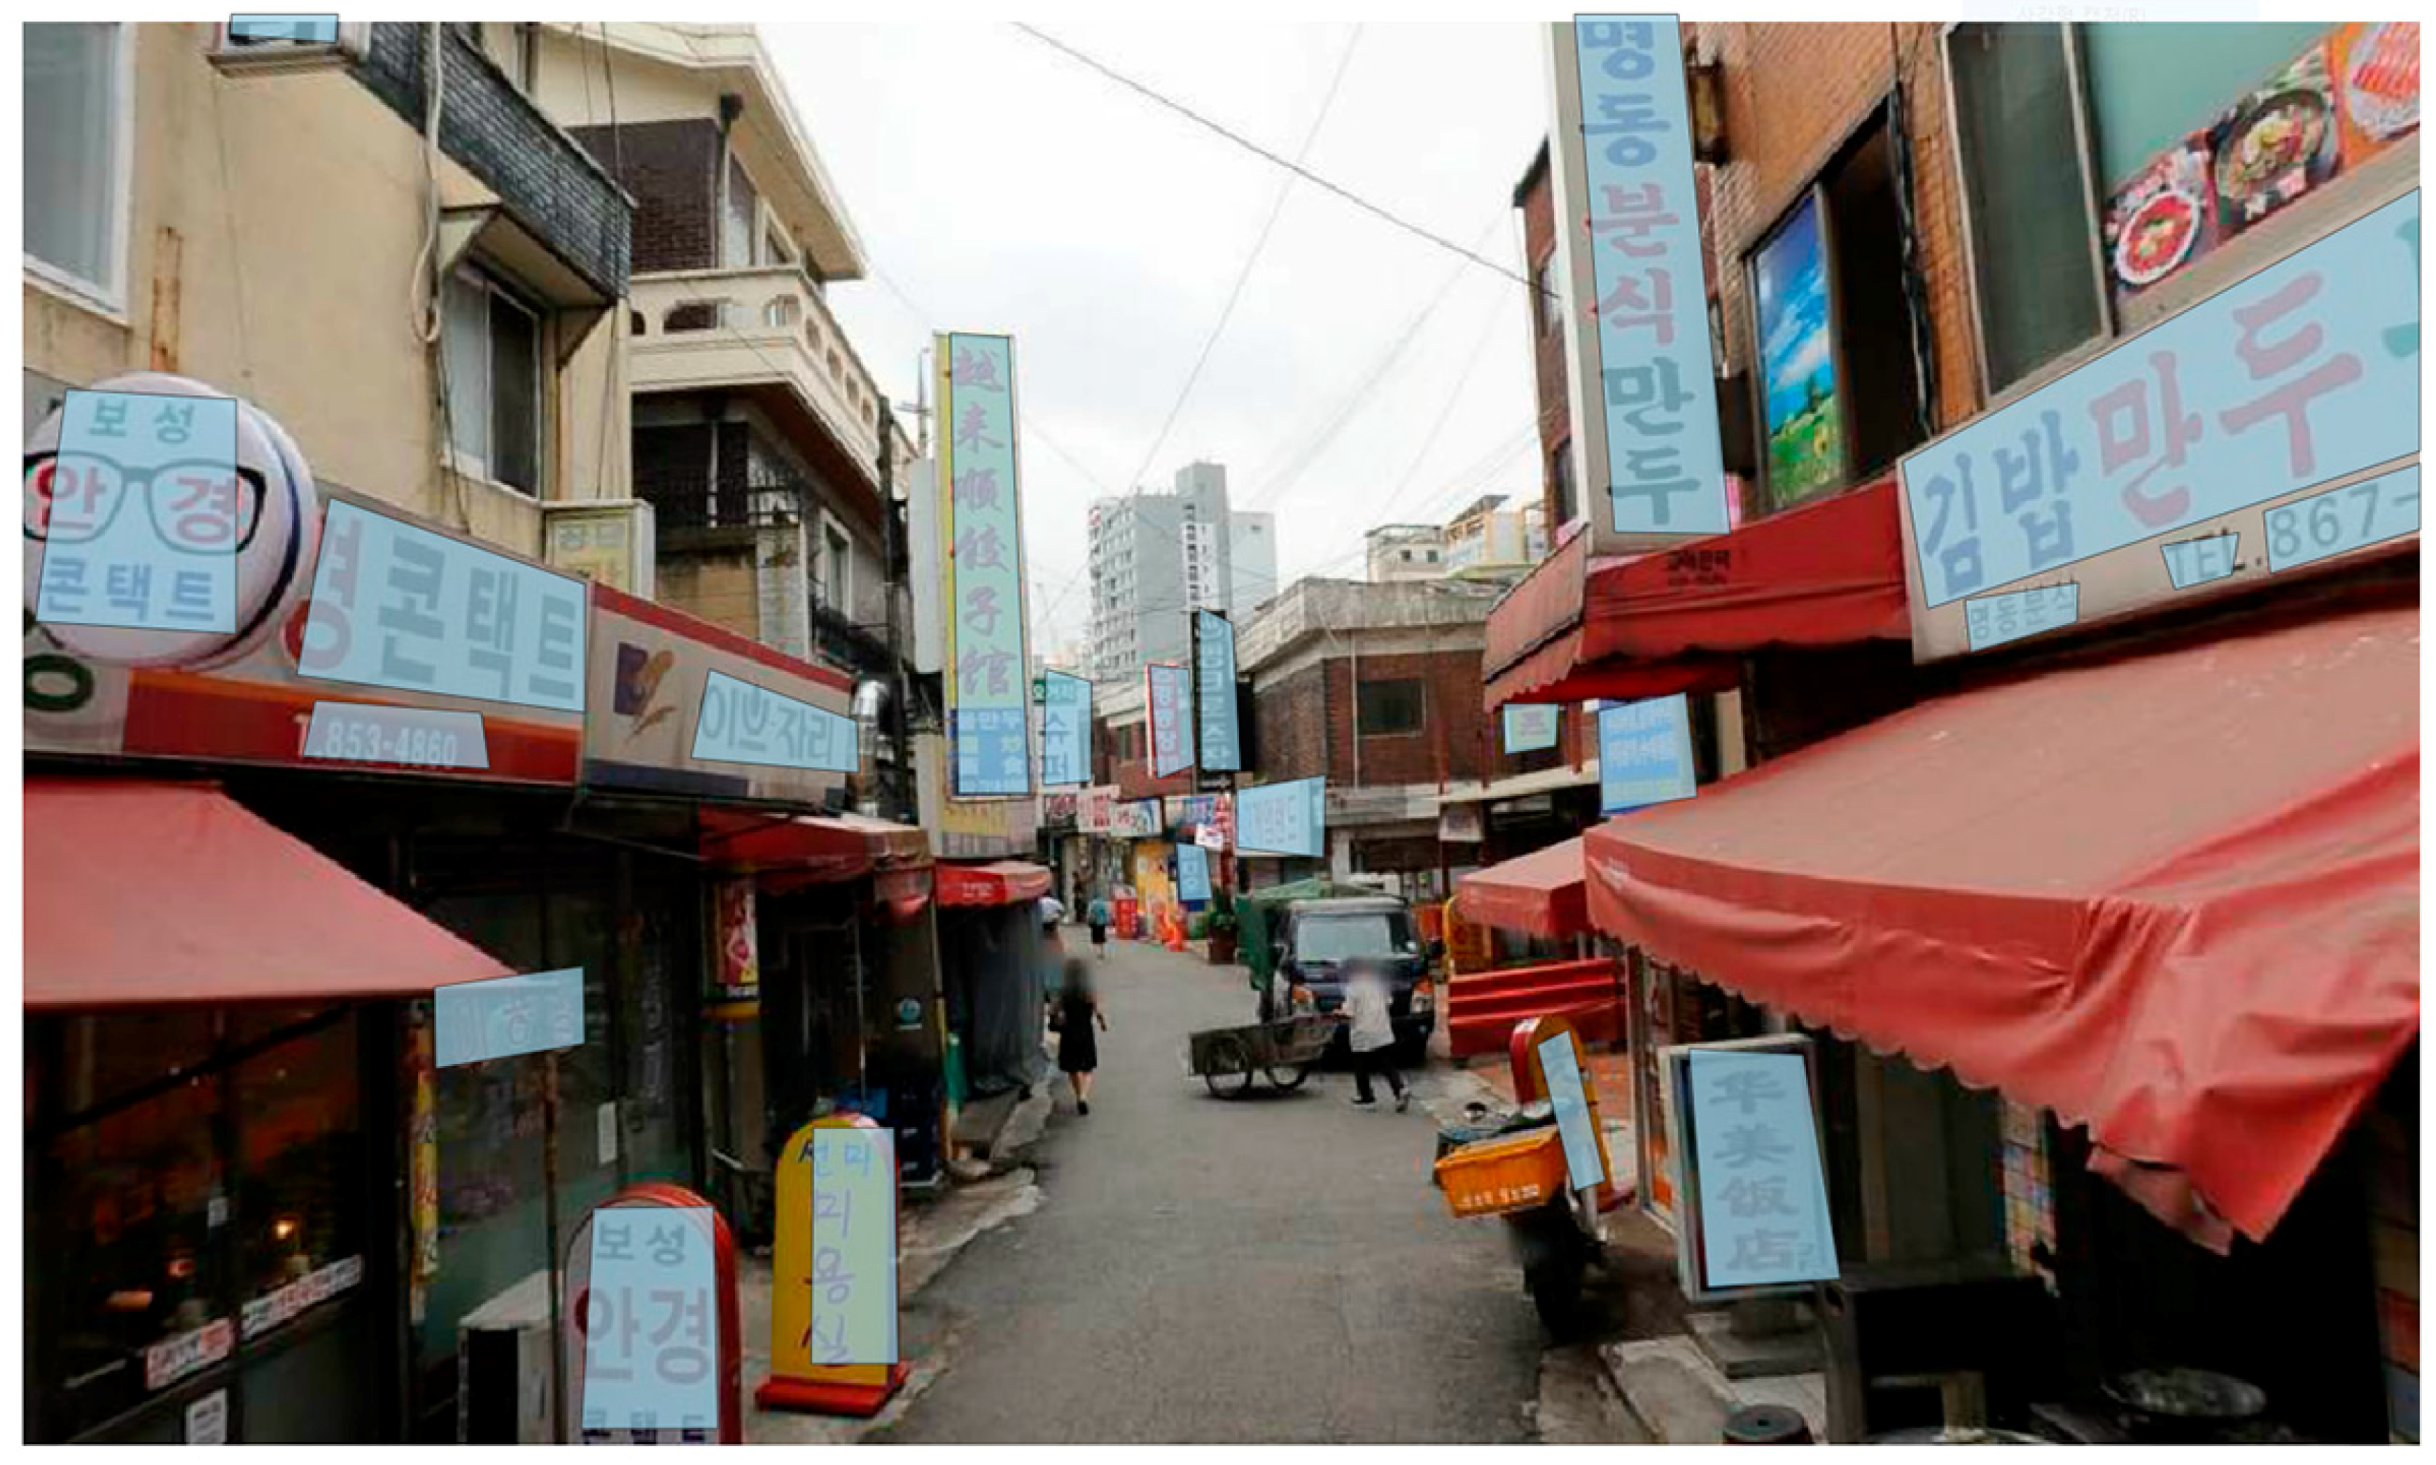
For each image with signs or billboards, text regions were identified and marked using polygons, as shown in Figure 3. The recognition process was limited to the type of the dominant language in these polygons, not the contents written, to accelerate the task and improve its accuracy. Each of the text regions was coded into one of the following categories: 1 for Korean, 2 for English, 3 for Chinese, 4 for numbers, 5 for all other languages, and 6 for unrecognizable texts. This simplification may not be suitable for empirical studies, as it cannot distinguish among signs in different domains (e.g., public and private signs) and provides only limited insights into complex sociolinguistic phenomena. However, it was considered sufficient for demonstrating the feasibility of the proposed approach, which was the main goal of this work.
The images were first fed to the Text Detection feature in the Google Vision API, but many texts remained unrecognized or only partially recognized. The low recognition rate might be due to the presence of numerous non-Latin characters: in general, it is considered a more difficult task to read non-Latin characters, such as Koreans and Chinese, from natural scenes, because they usually have more letters and complex character shapes while there are less reference data sets for training deep neural networks [43]. As a result, the labor-intensive manual inspection of the images was necessary for the language detection, and it was the most time-consuming part of the present work. However, this is a field of very active research, and the advances in learning algorithms and the accumulation of reference data sets will eventually bring a more automatic exploration in this phase of the proposed approach.
Once the language recognition was complete, the area of polygons for each category was estimated and normalized, so that the total area in a single view remains 1. This was based on the idea that the relative area a specific language occupied in an image implied the impression one would receive when the person visited the place. In this way, a linguistic landscape can be more accurately quantified than by counting signs and billboards of arbitrary size in different languages.
4. Results
Table 4 presents the mean proportion of each language visible in street-level images over the years between 2008 and 2018. Korean was the most dominant language in the linguistic landscape of the study area for the entire period, and this result appears to be consistent with earlier observations. Lawrence [41], for example, conducted a survey on five commercial districts in Seoul and reported that the majority of signs was written in Korean (i.e., 66.3% in Gangnam, 71.3% in Insadong, 73.3% in Sadang, and 98.2% in Tteukseom), except for Itaewon (11.3%), where many shops are aimed at tourists and the United States military personnel. The analysis of street-level images, however, revealed an interesting temporal trend—in recent years, the proportion of Korean was decreased to a large extent, from 0.843 in 2008 to 0.778 in 2018, while the Chinese language became more visible during the same period. In 2008, Chinese signs and billboards accounted for 4.6% of the local linguistic landscape, but it was more than doubled in 2018. The highest figure was about 11.4% in 2017.
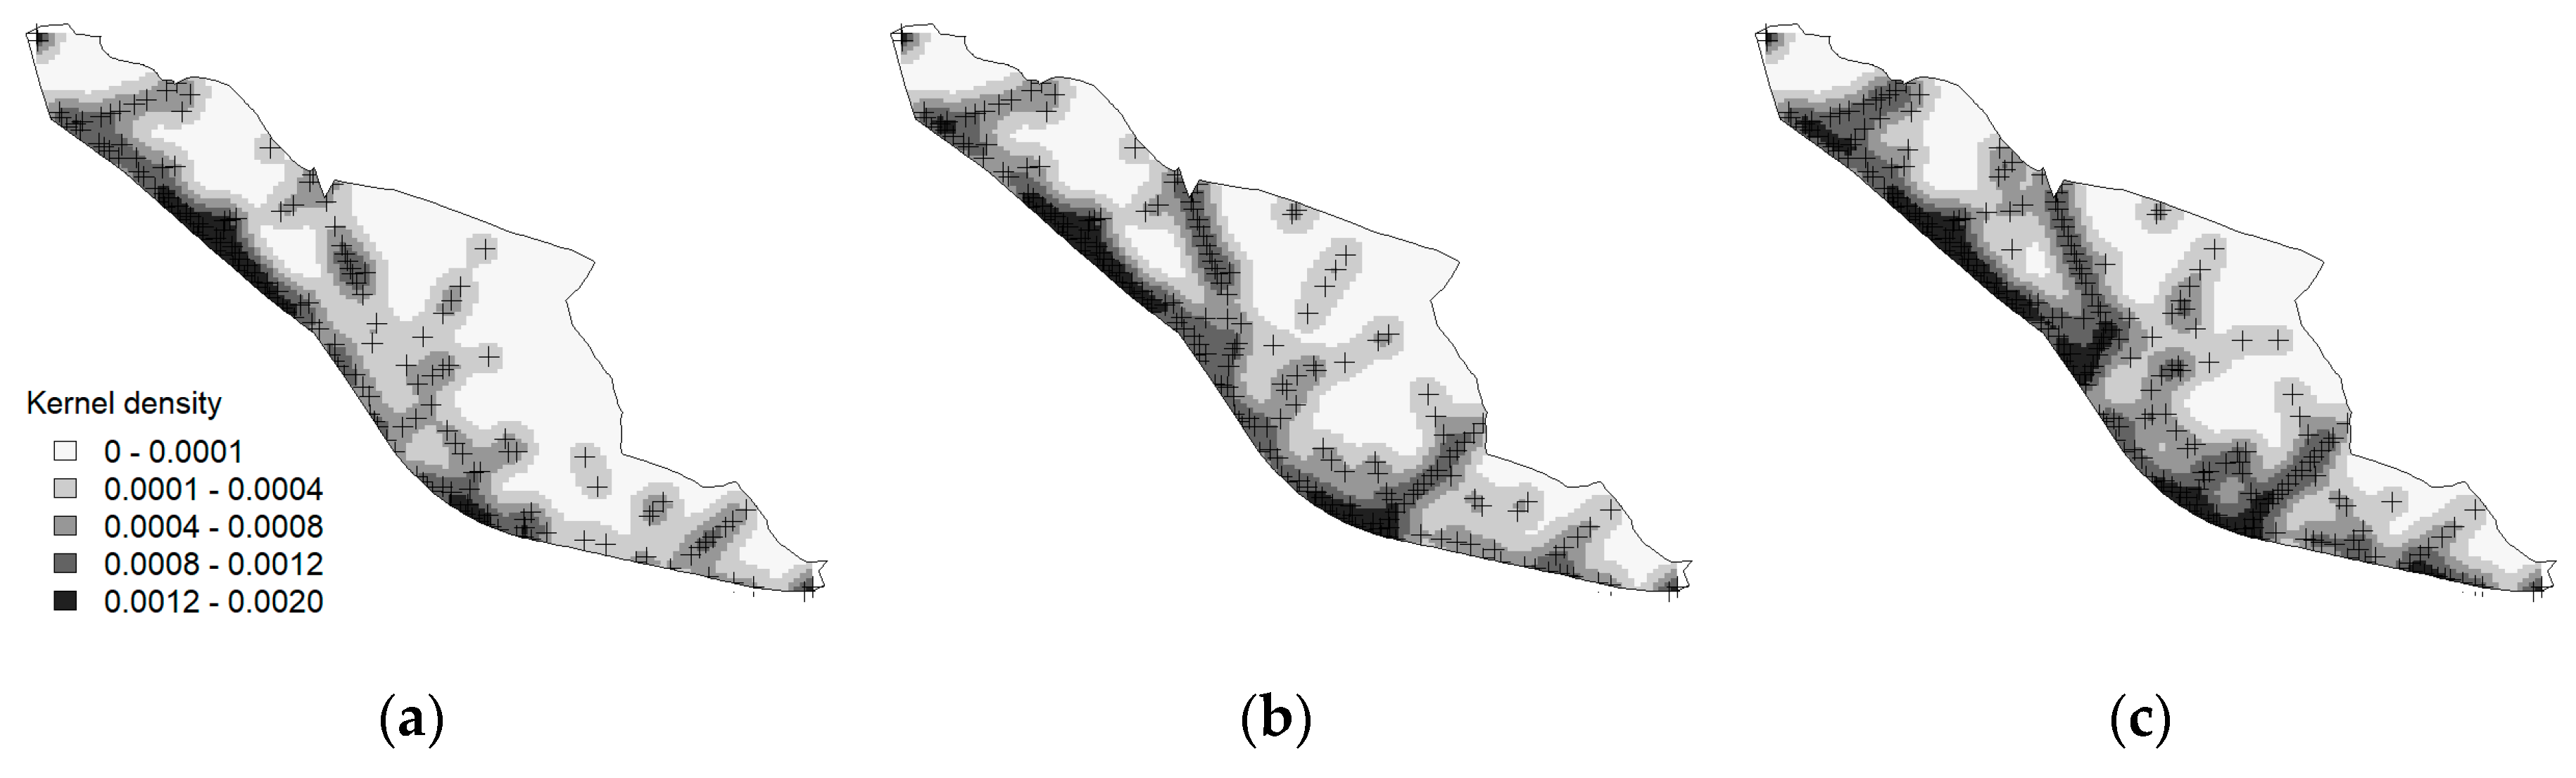
Figure 4 demonstrates one advantage of the proposed approach. The three maps showed the kernel density estimation surfaces of Chinese signs in the study area for 2010, 2014, and 2018, and they illustrated the spatiotemporal expansion of the Chinese linguistic community intuitively. This sort of visual comparison is not readily possible with field observations, because the data collection is often limited to a single year, and it requires tremendous efforts, time, and money to collect the minimum number of samples.
While it is beyond the scope of this paper to investigate the underlying reasons behind the expansion of the Chinese linguistic landscape, the geographic distribution in Figure 4 provides some clues. On each map, the darker color represents the areas, in which Chinese signs are densely located, whereas the brighter color indicates the opposite. The Chinese language became more noticeable along the southern border of Garibong-dong, where ethnic restaurants and supermarkets were clustered, and this result implied that the increase was likely to be related to the recent popularity of Chinese food in the Korean society.
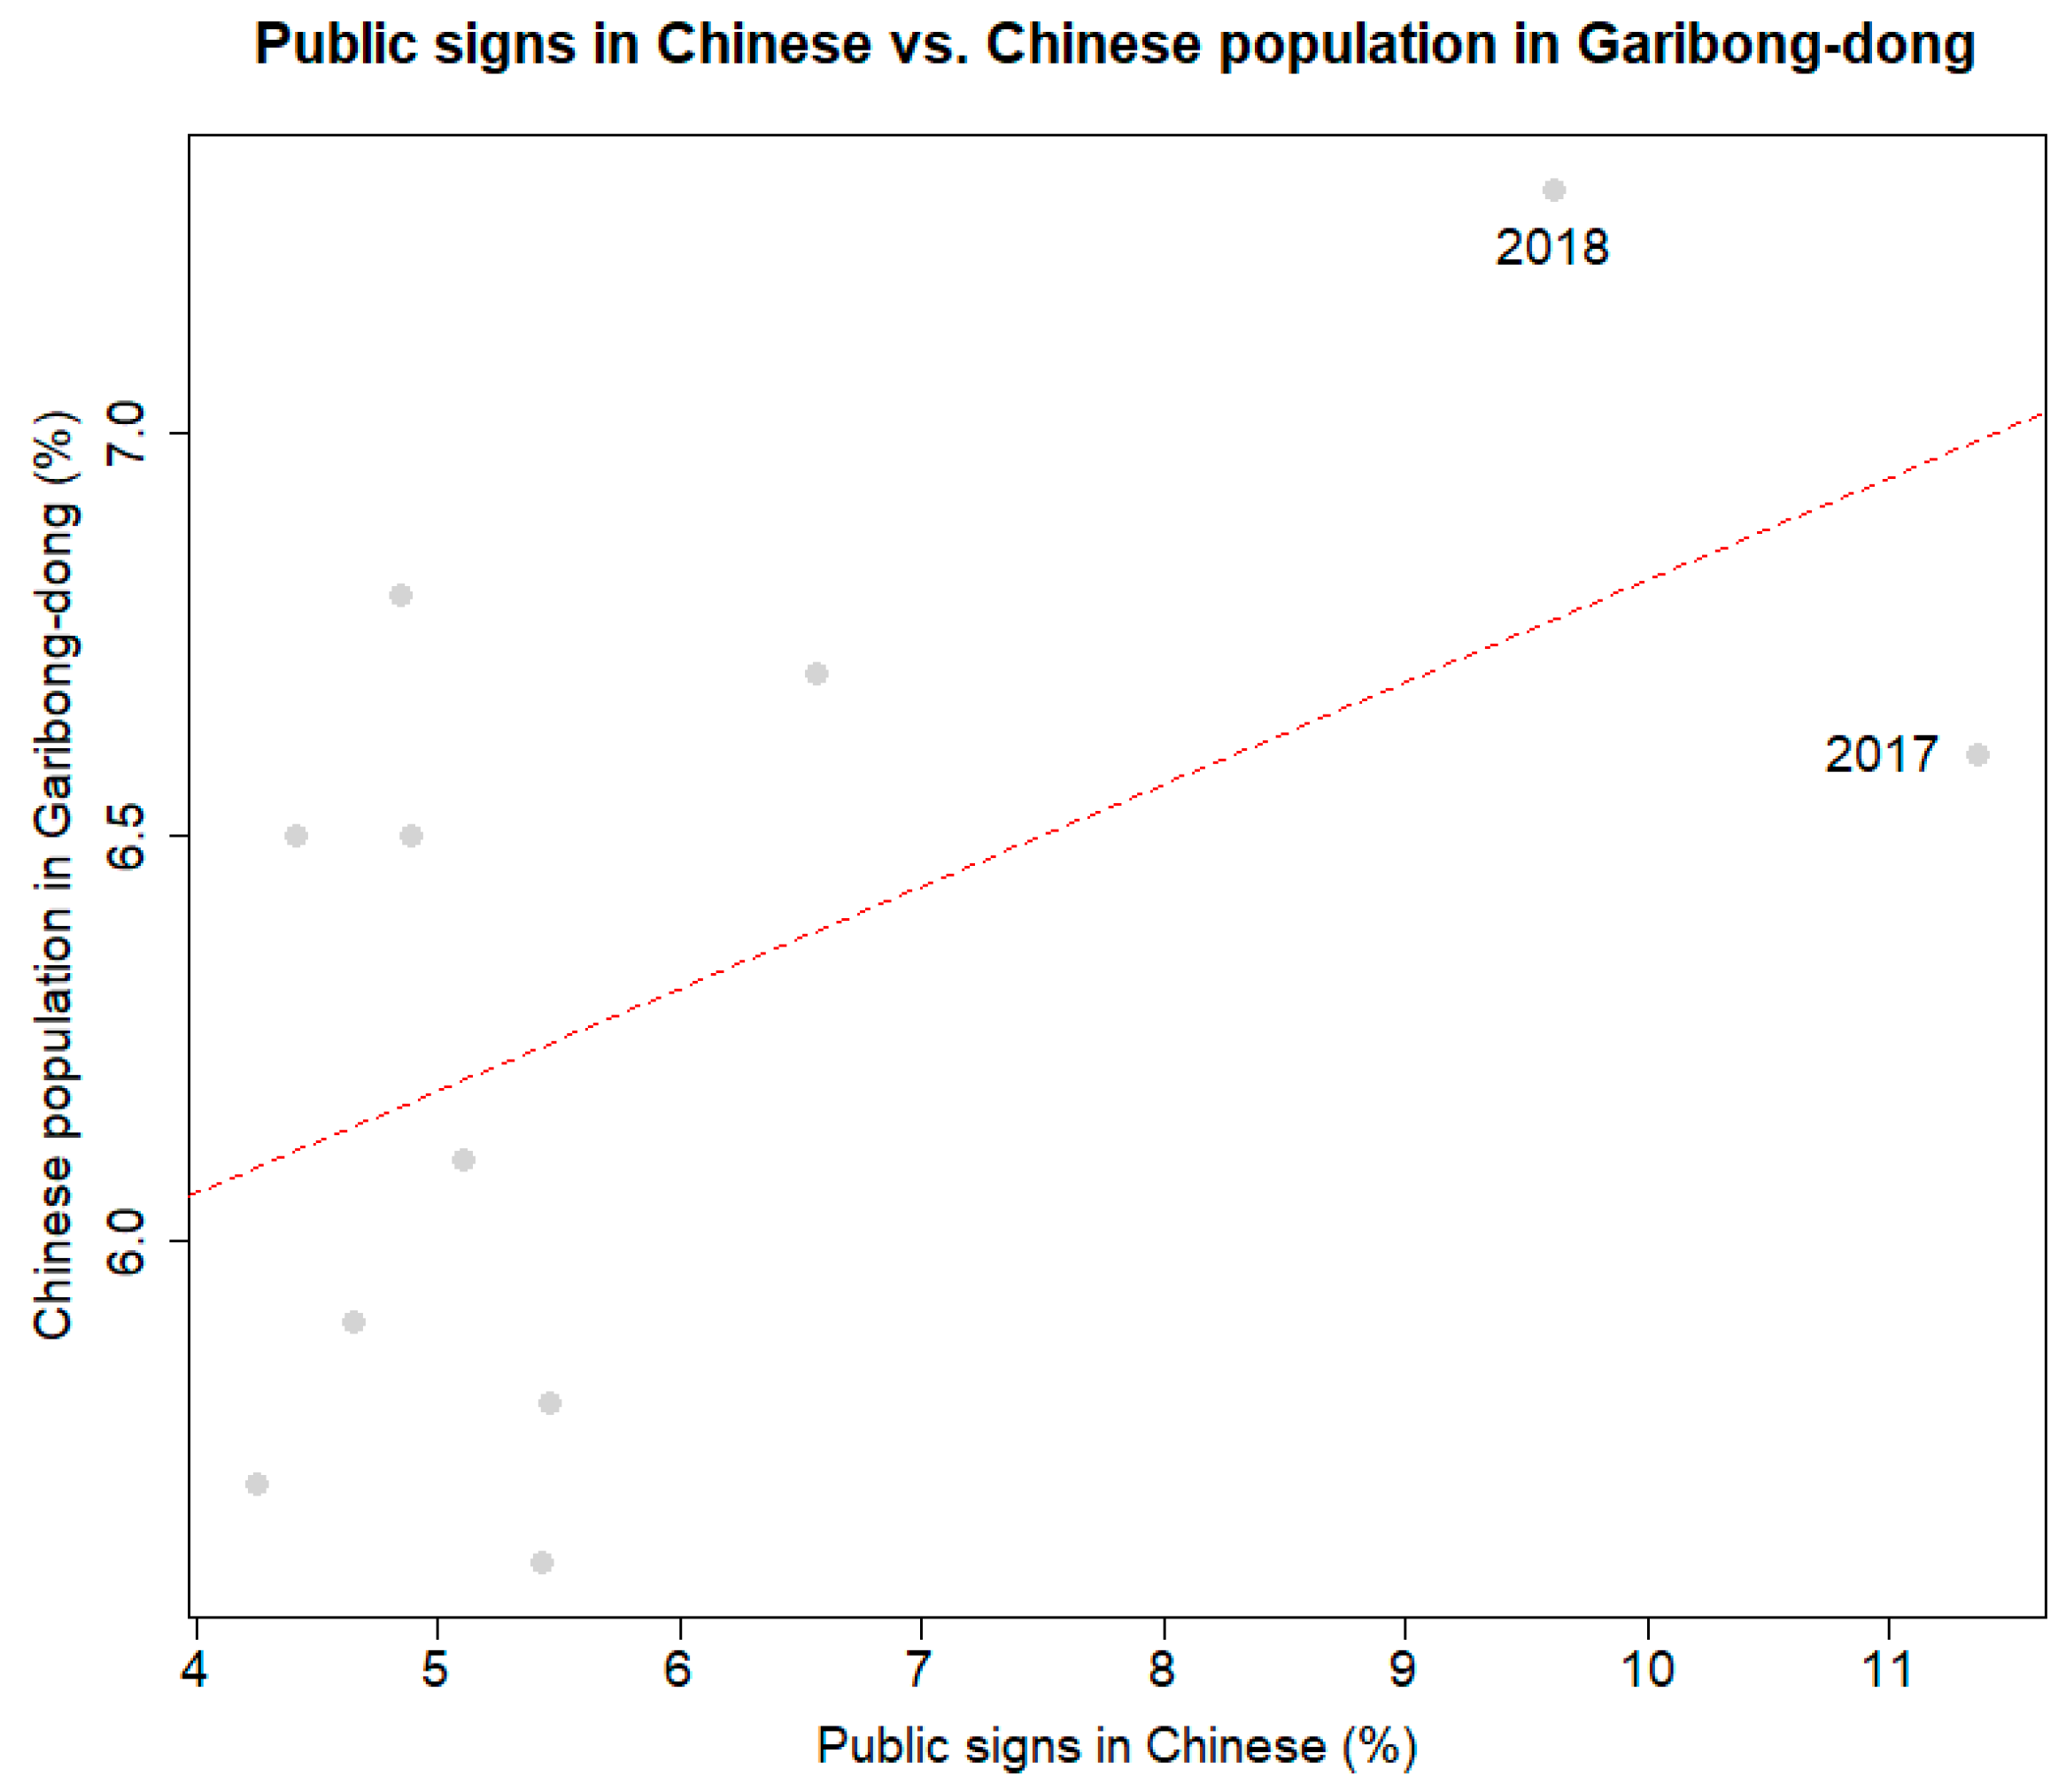
Figure 5 provides some supporting evidence for this hypothesis. The evidence depicted how the relative share of Chinese signs and billboards in the local linguistic landscape changed with the proportion of Chinese people. In 2018, the proportion of the Chinese population was about 7.4%, which was only slightly higher than in the preceding years, but the relative share of Chinese signage was almost twice that in the last year. The Chinese language comprised the most substantial proportion in 2017, but the population was largely unchanged, suggesting that the population structure itself cannot explain the increasing vitality of the Chinese language in this neighborhood. This is likely to be attributable to other factors, such as the growing favor towards ethnic food, although it needs further investigation to uncover the underlying sociolinguistic process.
5. Discussion
Linguistic diversity in a neighborhood’s landscape does not only reflect the demographic composition of an area, but it also mirrors the social and economic standing of minority population groups. A careful examination of a linguistic landscape can shed light on, for example, the formation and expansion of ethnic communities and offer a useful insight into the emergence of new retail centers for immigrants and tourists. Linguistic landscape studies have the potential to provide valuable information on how our urban areas are changing by the inflow of people with different backgrounds, but they require systematic comparative analysis across space and time.
The main contribution of this paper is the introduction of a new methodological framework that combines computer vision and machine learning techniques for assessing the diversity of languages from a large set of street-level images. While a great deal of work has been done on the evaluation of linguistic landscapes in different cities, most of the studies are based on ad-hoc interpretations of data collected from fieldwork. Relatively little focus has been given to the development of more data-driven and reproducible methods, and it has remained challenging to process an extensive collection of images. The proposed urban analytic approach can provide a way of exploring linguistic landscapes in a timely and consistent manner and consequently facilitate spatiotemporal comparisons of large geographic areas.
As a data-driven approach, it is capable of yielding a more objective interpretation of a linguistic landscape. Although field observations and interviews are imperative to uncover the underlying motivations and meanings behind the scene, it is essentially a subjective assessment of the information. The interpretations can be biased towards hypotheses or preconceptions, especially when they are made by inexperienced researchers. The present method gathers data from randomly selected locations and evaluates linguistic diversity based on numerical criteria, making it more robust to such bias. This can ultimately promote reproducible and transparent research in the field of the linguistic landscape.
The analysis of the Chinese community in Seoul, South Korea, has demonstrated the feasibility and advantages of the proposed approach to studying spatiotemporal variations of text in open spaces. The kernel density maps showed that the Chinese language was predominant in signage along commercial streets where ethnic restaurants were concentrated and that its spatial extent expanded over the years between 2010 and 2018. This result is plausible considering the increase of the Chinese population in the district and the growing popularity of Chinese food to local people. Although this paper limited the study area to a single administrative unit, it can be applied to several districts for comparisons or even to the entire city, as there are now massive sets of street-level images available from online map services and possibly more generated by dashboard cameras of vehicles. Further case studies on other cities using these data would be useful to validate and extend the methodological framework developed in this paper.
Even though the implementation of the proposed approach is somewhat at a conceptual level, it can be further developed into an unsupervised machine-based tool with rapid advances in computer vision techniques. Text detection and recognition from street-level images are a challenging task, because such scene texts vary in terms of size, color, font, and position. Images are often taken from nonuniform perspectives, and sometimes signs are only partially visible due to cars, pedestrians, or vegetation. In this paper, images were processed through several stages, from image classification to language recognition, but the image processing required considerable manual involvement. However, the technology has evolved fast since the advent of deep learning and artificial intelligence, and this computational progress will eventually lead to a more automatic exploration of the linguistic landscape.
Nonetheless, it should be noted that the development of this new methodological framework does not replace field observations nor in-depth interviews with local residents. It is not the intention of this paper to discount traditional ethnographic approaches, and the value of qualitative research as a means to understand complicated relationships between languages and society remains still. The present method provides an alternative way of exploring linguistic landscapes, which can be particularly useful for macroscale studies. The significance of this work comes from the fact that it bridges between linguistic landscape research and urban analytics, and this progress will benefit not only sociolinguists but also geographers and other social scientists, investigating various interrelated demographic and socioeconomic phenomena.
Funding
This work was supported by grants from Kyung Hee University in 2016 (KHU-20160553) and from the Ministry of Education of the Republic of Korea and the National Research Foundation of Korea (NRF-2019S1A5A2A03041161).
Acknowledgments
I would like to thank Yelin Kim, Changlock Choi, Jiye Oh, Youngho Lee, Myeong-Hun Lee, Yewon Jeong, and Soomin Kang for their help during the data collection phase of this study.
Conflicts of Interest
The author declares no conflicts of interest. The funders had no role in the design of the study; in the collection, analyses, or interpretation of data; in the writing of the manuscript, or in the decision to publish the results.
References
- Lloyd, A.; Cheshire, J. Deriving retail centre locations and catchments from geo-tagged Twitter data. Comput. Environ. Urban Syst. 2017, 61, 108–118. [Google Scholar] [CrossRef] [Green Version]
- Blackwood, R. LL explorations and methodological challenges: Analysing France’s regional languages. Linguist. Landsc. 2015, 1, 38–53. [Google Scholar] [CrossRef] [Green Version]
- Puzey, G. Linguistic Landscapes. In The Oxford Handbook of Names and Naming; Hough, C., Ed.; Oxford University Press: Oxford, UK, 2016; p. 832. [Google Scholar] [CrossRef]
- Gorter, D. Methods and techniques for linguistic landscape research: About definitions, core issues and technological innovations. In Expanding the Linguistic Landscape: Linguistic Diversity, Multimodality and the Use of Space as a Semiotic Resource; Pütz, M., Mundt, N., Eds.; Multilingual Matters: Bristol, UK, 2018; 302p. [Google Scholar]
- Landry, R.; Bourhis, R.Y. Linguistic landscape and ethnolinguistic vitality: An empirical study. J. Lang. Soc. Psychol. 1997, 16, 23–49. [Google Scholar] [CrossRef]
- Backhaus, P. Linguistic Landscapes a Comparative Study of Urban Multilingualism in Tokyo; Multilingual Matters: Clevedon, UK, 2007; 15p. [Google Scholar]
- Sebba, M. Discourses in transit. In Semiotic Landscapes: Language, Image, Space; Jaworski, A., Thurlow, C., Eds.; A&C Black: London, UK, 2010; pp. 59–76. [Google Scholar]
- Moriarty, M. Indexing authenticity: The linguistic landscape of an Irish tourist town. Int. J. Sociol. Lang. 2015, 2015, 195. [Google Scholar] [CrossRef]
- Moriarty, M. Contesting language ideologies in the linguistic landscape of an Irish tourist town. Int. J. Biling. 2014, 18, 464–477. [Google Scholar] [CrossRef]
- Gorter, D.; Cenoz, J. Knowledge about language and linguistic landscape. In Encyclopedia of Language and Education; Hornberger, N.H., Ed.; Springer: Boston, MA, USA, 2008; pp. 2090–2102. [Google Scholar] [CrossRef]
- Tulp, S. Reklame en tweetaligheid. Een onderzoek naar de geografische verspreiding van Franstalige en Nederlandstalige affiches in Brussel [Advertising and bilingualism. An investigation into the geographical distribution of French-speaking and Dutch-speaking posters in Brussels]. Taal En Soc. Integr. 1978, 1, 261–288. [Google Scholar]
- Vandenbroucke, M. Language visibility, functionality and meaning across various TimeSpace scales in Brussels’ multilingual landscapes. J. Multiling. Multicult. Dev. 2015, 36, 163–181. [Google Scholar] [CrossRef]
- Raos, V. Bilingual street signs policy in EU member states: A comparison. J. Multiling. Multicult. Dev. 2018, 39, 895–911. [Google Scholar] [CrossRef]
- Mettewie, L.; Janssens, R. Language use and language attitudes in Brussels. In Multilingualism in European Bilingual Contexts: Language Use and Attitudes; Lasagabaster, D., Huguet, A., Eds.; Multilingual Matters: Clevedon, UK; Buffalo, NY, USA, 2007; pp. 164–201. [Google Scholar]
- Wenzel, V. Reclame en tweetaligheid in Brussel. Een empirisch onderzoek naar de spreiding van Nederlandstalige en Franstalige affiches [Advertising and bilingualism in Brussels. An empirical study of the distribution of Dutch and French posters]. In Brusselse Thema’s 3; Piet, V.d.C., Ed.; Vubpress: Brussel, Belgium, 1998; pp. 45–74. [Google Scholar]
- Monnier, D. Langue d‘Accueil Et Langue De Service Dans Les Commerces à Montréal; Conseil de la langue française, Ed.; Conseil de la langue française: Québec, QC, Canada, 1989; p. 91. [Google Scholar]
- Spolsky, B.; Cooper, R.L. The Languages of Jerusalem; Clarendon Press: Oxford, UK, 1991; 166p. [Google Scholar]
- Ben-Rafael, E.; Shohamy, E.; Hasan Amara, M.; Trumper-Hecht, N. Linguistic landscape as symbolic construction of the public space: The case of Israel. Int. J. Multiling. 2006, 3, 7–30. [Google Scholar] [CrossRef]
- Leeman, J.; Modan, G. Commodified language in Chinatown: A contextualized approach to linguistic landscape. J. Socioling. 2009, 13, 332–362. [Google Scholar] [CrossRef]
- Lou, J.J. The Linguistic Landscape of Chinatown: A Sociolinguistic Ethnography; Multilingual Matters: Bristol, UK, 2016. [Google Scholar]
- Backhaus, P. Signs of multilingualism in Tokyo—A diachronic look at the linguistic landscape. Int. J. Sociol. Lang. 2005, 2005, 103–121. [Google Scholar] [CrossRef]
- Klayman, J. Varieties of confirmation bias. In Psychology of Learning and Motivation; Busemeyer, J., Hastie, R., Medin, D.L., Eds.; Academic Press: Cambridge, MA, USA, 1995; Volume 32, pp. 385–418. [Google Scholar]
- Anguelov, D.; Dulong, C.; Filip, D.; Frueh, C.; Lafon, S.; Lyon, R.; Ogale, A.; Vincent, L.; Weaver, J. Google Street View: Capturing the world at street level. Computer 2010, 43, 32–38. [Google Scholar] [CrossRef]
- Rundle, A.G.; Bader, M.D.M.; Richards, C.A.; Neckerman, K.M.; Teitler, J.O. Using Google Street View to Audit Neighborhood Environments. Am. J. Prev. Med. 2011, 40, 94–100. [Google Scholar] [CrossRef] [PubMed] [Green Version]
- Li, X.; Zhang, C.; Li, W.; Ricard, R.; Meng, Q.; Zhang, W. Assessing street-level urban greenery using Google Street View and a modified green view index. Urban For. Urban Green. 2015, 14, 675–685. [Google Scholar] [CrossRef]
- Seiferling, I.; Naik, N.; Ratti, C.; Proulx, R. Green streets—Quantifying and mapping urban trees with street-level imagery and computer vision. Landsc. Urban Plan. 2017, 165, 93–101. [Google Scholar] [CrossRef]
- Li, X.; Zhang, C.; Li, W.; Kuzovkina, Y.A.; Weiner, D. Who lives in greener neighborhoods? The distribution of street greenery and its association with residents’ socioeconomic conditions in Hartford, Connecticut, USA. Urban For. Urban Green. 2015, 14, 751–759. [Google Scholar] [CrossRef]
- Cao, R.; Zhu, J.; Tu, W.; Li, Q.; Cao, J.; Liu, B.; Zhang, Q.; Qiu, G. Integrating Aerial and Street View Images for Urban Land Use Classification. Remote Sens. 2018, 10, 1553. [Google Scholar] [CrossRef] [Green Version]
- Li, X.; Zhang, C.; Li, W. Building block level urban land-use information retrieval based on Google Street View images. GISci. Remote Sens. 2017, 54, 819–835. [Google Scholar] [CrossRef]
- Kang, J.; Körner, M.; Wang, Y.; Taubenböck, H.; Zhu, X.X. Building instance classification using street view images. ISPRS J. Photogramm. Remote Sens. 2018, 145, 44–59. [Google Scholar] [CrossRef]
- Yin, L.; Cheng, Q.; Wang, Z.; Shao, Z. ‘Big data’ for pedestrian volume: Exploring the use of Google Street View images for pedestrian counts. Appl. Geogr. 2015, 63, 337–345. [Google Scholar] [CrossRef]
- Hu, C.B.; Zhang, F.; Gong, F.Y.; Ratti, C.; Li, X. Classification and mapping of urban canyon geometry using Google Street View images and deep multitask learning. Build. Environ. 2020, 167, 106424. [Google Scholar] [CrossRef]
- Ye, Q.; Doermann, D. Text Detection and Recognition in Imagery: A Survey. IEEE Trans. Pattern Anal. Mach. Intell. 2015, 37, 1480–1500. [Google Scholar] [CrossRef] [PubMed]
- Zhu, Y.; Yao, C.; Bai, X. Scene text detection and recognition: recent advances and future trends. Front. Comput. Sci. 2016, 10, 19–36. [Google Scholar] [CrossRef]
- Liu, X.; Meng, G.; Pan, C. Scene text detection and recognition with advances in deep learning: a survey. Int. J. Doc. Anal. Recognit. 2019, 22, 143–162. [Google Scholar] [CrossRef]
- Weinman, J.J.; Learned-Miller, E.; Hanson, A.R. Scene Text Recognition Using Similarity and a Lexicon with Sparse Belief Propagation. IEEE Trans. Pattern Anal. Mach. Intell. 2009, 31, 1733–1746. [Google Scholar] [CrossRef] [PubMed] [Green Version]
- Mancas-Thillou, C.; Gosselin, B. Natural Scene Text Understanding. In Vision Systems: Segmentation and Pattern Recognition; Obinata, G., Ed.; IntechOpen: Vienna, Austria, 2007; p. 536. [Google Scholar] [CrossRef]
- Yin, X.; Yin, X.; Huang, K.; Hao, H. Robust Text Detection in Natural Scene Images. IEEE Trans. Pattern Anal. Mach. Intell. 2014, 36, 970–983. [Google Scholar] [CrossRef] [PubMed] [Green Version]
- Seoul Metropolitan Government. Number of Registered Foreigners by District (Gu) and Nationality. Available online: https://data.seoul.go.kr/dataList/datasetView.do?infId=803&srvType=S&serviceKind=2 (accessed on 20 December 2019).
- Seoul Metropolitan Government. Number of Registered Foreigners by Administrative Zone (Dong) and Nationality. Available online: http://data.seoul.go.kr/dataList/datasetView.do?infId=802&srvType=S&serviceKind=2¤tPageNo=1 (accessed on 20 December 2019).
- Lawrence, C.B. The Korean English linguistic landscape. World Engl. 2012, 31, 70–92. [Google Scholar] [CrossRef]
- Bradski, G. The OpenCV Library. Dr Dobb’s J. Softw. Tools 2000, 25, 120–125. [Google Scholar]
- Kim, M.; Choi, W. Generating a New Dataset for Korean Scene Text Recognition with Augmentation Techniques. In Proceedings of the 7th International Conference on Emerging Databases; Springer: Singapore, 2017; pp. 247–252. [Google Scholar]
Figure 1.
Geographic distribution of the Chinese population in Seoul in 2016. The location of the study area is marked as a circle.
Figure 1.
Geographic distribution of the Chinese population in Seoul in 2016. The location of the study area is marked as a circle.

Figure 2.
Maps showing the coverage of street-level images: (a) Google Street View; (b) Naver Street View; (c) Kakao Road View. Note that the maps are only approximately on the same scale and were captured on 12 October 2019.
Figure 2.
Maps showing the coverage of street-level images: (a) Google Street View; (b) Naver Street View; (c) Kakao Road View. Note that the maps are only approximately on the same scale and were captured on 12 October 2019.

Figure 3.
An example street-level image, in which signs are marked as polygons.

Figure 4.
Kernel density estimation of signs written in Chinese for three different years: (a) 2010; (b) 2014; (c) 2018. The cross symbols represent the sampling points.
Figure 4.
Kernel density estimation of signs written in Chinese for three different years: (a) 2010; (b) 2014; (c) 2018. The cross symbols represent the sampling points.

Figure 5.
Relationship between the proportions of Chinese signage and the Chinese population in the study area during the period 2000–2018.
Figure 5.
Relationship between the proportions of Chinese signage and the Chinese population in the study area during the period 2000–2018.


Table 1.
Distribution of the collected street-level images in the study area by year.
| Year | 2008 | 2009 | 2010 | 2011 | 2012 | 2013 | 2014 | 2015 | 2016 | 2017 | 2018 | Total |
|---|---|---|---|---|---|---|---|---|---|---|---|---|
| # Images | 84 | 245 | 318 | 283 | 318 | 273 | 340 | 315 | 232 | 239 | 385 | 3032 |
Table 2.
Top 30 most frequent features identified from the collected street-level imagery.
| Rank | Feature Name 1 | Count | Rank | Feature Name | Count |
|---|---|---|---|---|---|
| 1 | neighborhood | 2097 | 16 | property | 536 |
| 2 | town | 1920 | 17 | luxury vehicle | 479 |
| 3 | street | 1858 | 18 | alley | 445 |
| 4 | road | 1792 | 19 | downtown | 435 |
| 5 | vehicle | 1554 | 20 | motor vehicle | 389 |
| 6 | car | 1499 | 21 | facade | 318 |
| 7 | transport | 1420 | 22 | metropolis | 242 |
| 8 | city | 1291 | 23 | mixed use | 219 |
| 9 | lane | 1146 | 24 | advertising | 217 |
| 10 | residential area | 1091 | 25 | pedestrian | 180 |
| 11 | mode of transport | 1078 | 26 | market | 179 |
| 12 | metropolitan area | 895 | 27 | real estate | 163 |
| 13 | building | 876 | 28 | infrastructure | 161 |
| 14 | family car | 668 | 29 | tree | 157 |
| 15 | urban area | 587 | 30 | house | 152 |
1 Feature names in the table are the same as those returned by the Google Vision application programming interface (API).
Table 3.
Image classification results.
| Actual | Predicted | Producer’s Accuracy | |
|---|---|---|---|
| Images without Signs | Images with Signs | ||
| Images without signs | 200 | 353 | 36.17% |
| Images with signs | 182 | 1805 | 90.84% |
| User’s accuracy | 52.36% | 83.64% | 78.94% |
Table 4.
Relative sizes of signs written in different languages, 2008–2018.
| Year | Korean | English | Chinese | Numbers | Others |
|---|---|---|---|---|---|
| 2008 | 0.843 | 0.041 | 0.046 | 0.054 | 0.017 |
| 2009 | 0.840 | 0.033 | 0.055 | 0.051 | 0.022 |
| 2010 | 0.808 | 0.057 | 0.051 | 0.066 | 0.018 |
| 2011 | 0.828 | 0.056 | 0.044 | 0.059 | 0.013 |
| 2012 | 0.835 | 0.037 | 0.054 | 0.062 | 0.012 |
| 2013 | 0.823 | 0.060 | 0.043 | 0.060 | 0.015 |
| 2014 | 0.800 | 0.066 | 0.049 | 0.058 | 0.027 |
| 2015 | 0.801 | 0.062 | 0.048 | 0.064 | 0.024 |
| 2016 | 0.796 | 0.068 | 0.066 | 0.055 | 0.015 |
| 2017 | 0.795 | 0.037 | 0.114 | 0.039 | 0.015 |
| 2018 | 0.778 | 0.061 | 0.096 | 0.047 | 0.017 |
© 2020 by the author. Licensee MDPI, Basel, Switzerland. This article is an open access article distributed under the terms and conditions of the Creative Commons Attribution (CC BY) license (http://creativecommons.org/licenses/by/4.0/).
Share and Cite
MDPI and ACS Style
Hong, S.-Y. Linguistic Landscapes on Street-Level Images. ISPRS Int. J. Geo-Inf. 2020, 9, 57. https://doi.org/10.3390/ijgi9010057
AMA Style
Hong S-Y. Linguistic Landscapes on Street-Level Images. ISPRS International Journal of Geo-Information. 2020; 9(1):57. https://doi.org/10.3390/ijgi9010057
Chicago/Turabian StyleHong, Seong-Yun. 2020. "Linguistic Landscapes on Street-Level Images" ISPRS International Journal of Geo-Information 9, no. 1: 57. https://doi.org/10.3390/ijgi9010057
Note that from the first issue of 2016, this journal uses article numbers instead of page numbers. See further details here.