Using Intelligent Clustering to Implement Geometric Computation for Electoral Districting


1
Department of Mechatronic Engineering, Huafan University, New Taipei 22301, Taiwan
2
Department of Biotechnology, Mingchuan University, Taoyuan 33348, Taiwan
*
Author to whom correspondence should be addressed.
ISPRS Int. J. Geo-Inf. 2019, 8(9), 369; https://doi.org/10.3390/ijgi8090369
Submission received: 30 June 2019
/
Revised: 14 August 2019
/
Accepted: 21 August 2019
/
Published: 23 August 2019
(This article belongs to the Special Issue Deep Learning and Computer Vision for GeoInformation Sciences)
Abstract
:Traditional electoral districting is mostly carried out by artificial division. It is not only time-consuming and labor-intensive, but it is also difficult to maintain the principles of fairness and consistency. Due to specific political interests, objectivity is usually distorted and controversial in a proxy-election. In order to reflect the spirit of democracy, this study uses computing technologies to automatically divide the constituency and use the concepts of “intelligent clustering” and “extreme arrangement” to conquer many shortcomings of traditional artificial division. In addition, various informational technologies are integrated to obtain the most feasible solutions within the maximum capabilities of the computing system, yet without sacrificing the global representation of the solutions. We take Changhua County, Taiwan as an example of complete electoral districting, and find better results relative to the official version, which obtained a smaller difference in the population of each constituency, more complete and symmetrical constituencies, and fewer regional controversies. Our results demonstrate that multidimensional algorithms using a geographic information system could solve many problems of block districting to make decisions based on different needs.
1. Introduction
In democracies, the election and voting are representations of public opinion. A fair and reasonable election system can accurately express public opinion, because most electoral systems usually adopt the characteristics of a plurality with a single-member district or first past the post (FPTP) voting [1].
Electoral districting is a political application in four main categories of districting problems [2]. Most electoral systems tend to have a strong and stable government, which is represented by parliament members, and each government is supported by a large majority of its members [3]. The simplicity, stability, and voter representativeness of most electoral systems are relatively easy for voters to understand.
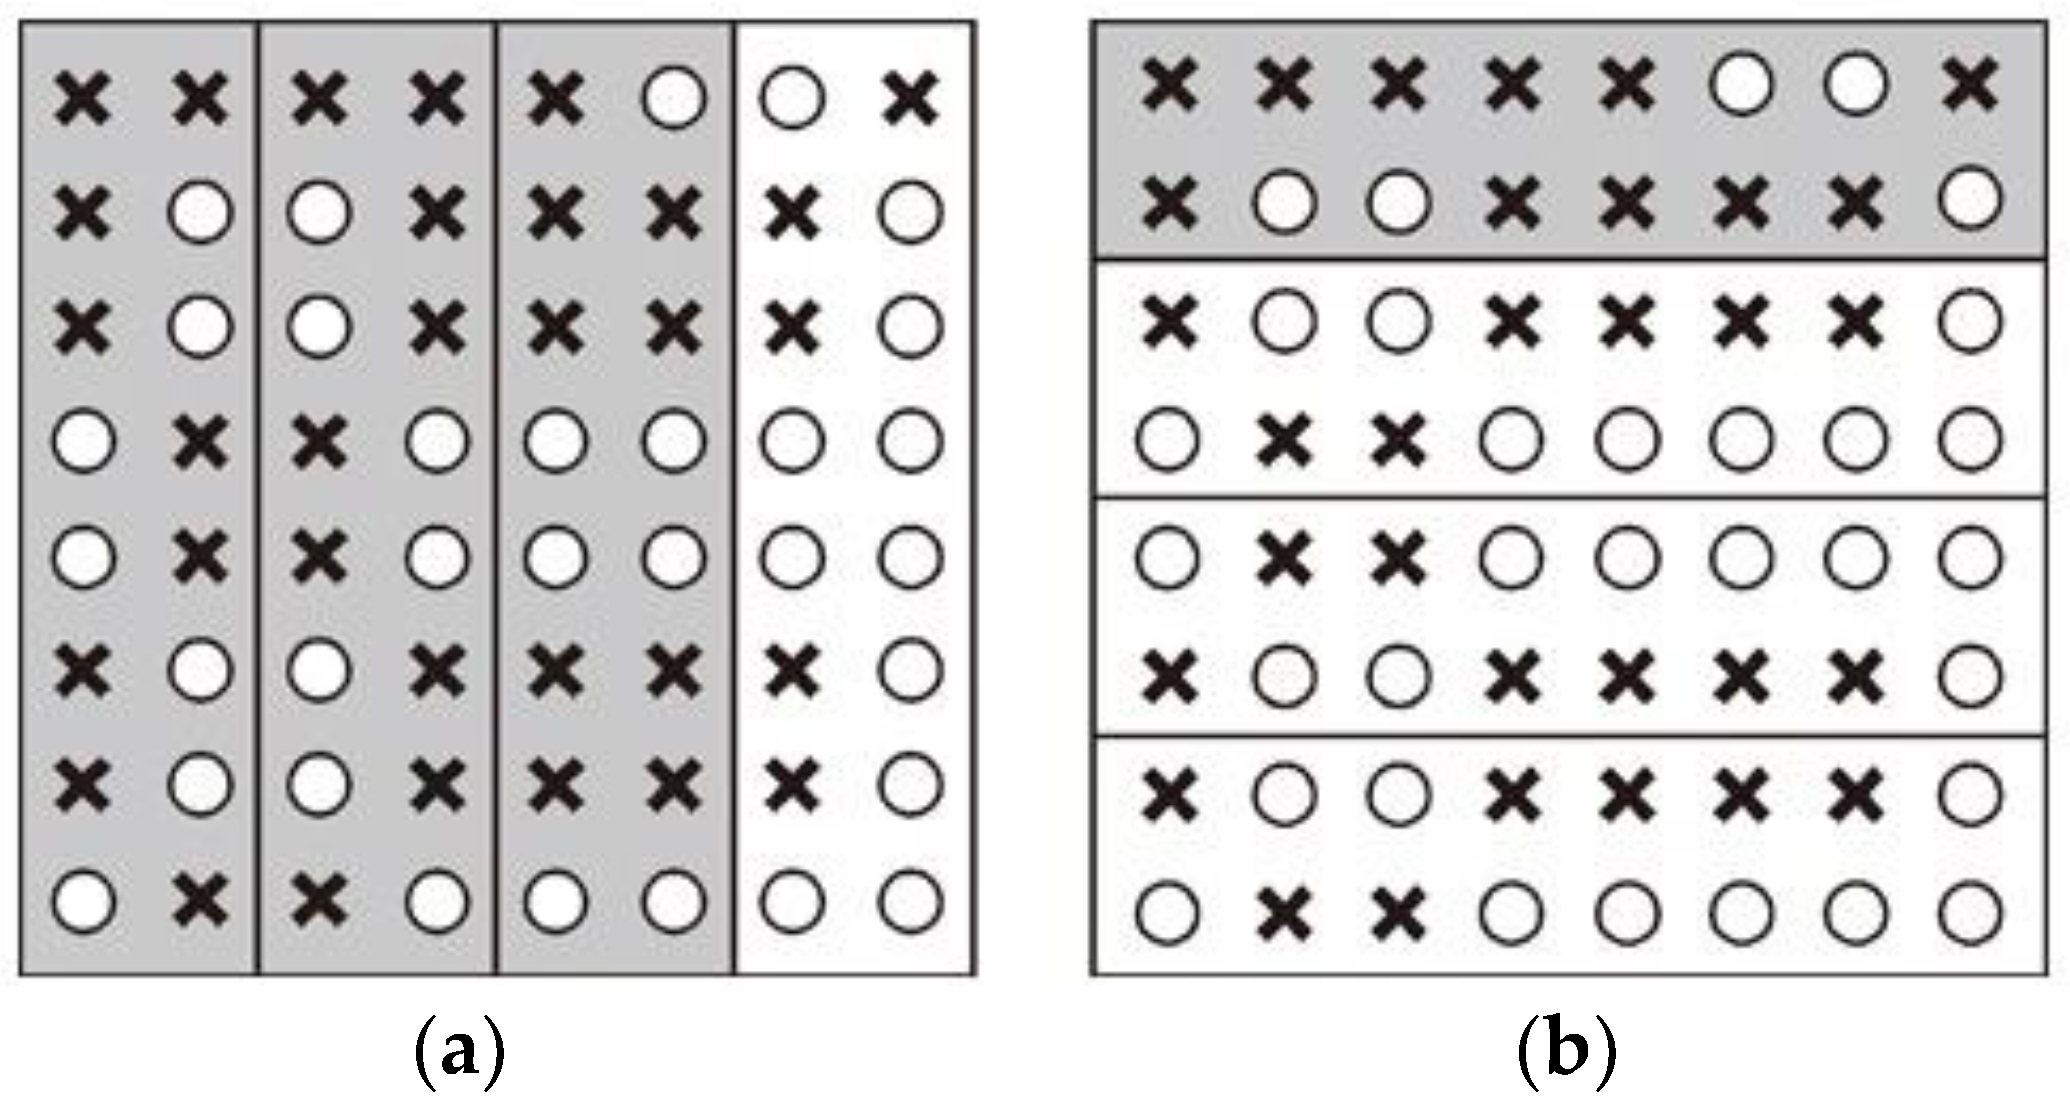
As Figure 1 shows, different representation results can be achieved by a geometric division in a proxy-election with a majority rule. Based on the simplest two-part composition, white circles represent voters on one side and black crosses represent voters on the other side. Both the number and arrangement of white circles and black crosses are the same for Figure 1a,b. The proxy-blocks of white and black are 3:1 if proxy-blocks were divided vertically, as in Figure 1a. In contrast, the proxy-blocks of white and black are 1:3 if the proxy-blocks were divided horizontally, as in Figure 1b.
Electoral districting also is a highly sensitive topic with complicities, including electorate structures, geopolitical scopes, political contexts, party interests, and candidate interests [4]. Gerrymandering was a well-known way of manipulating district boundaries to succeed in an election, named after Elbridge Gerry, the governor of Massachusetts in the United States, who practiced this in 1812. Thus, gerrymandering means manipulating constituency redistricting to obtain political benefits in a proxy election [5].
In practice, the electoral districting partitioning of administrative units into several constituencies is a non-deterministic polynomial (NP) problem. Since 1964, Harris proposed a rectangular division method to meet the requirements of electoral districting [6]. The supervised regionalization methods were reviewed and qualitatively comprised by Duque et al. [7]. The concepts of population equalization, constituency connectivity, and shape integrity were also abided by subsequent studies to avoid gerrymandering [8,9].
Current constituencies also need to be redistricted to represent actual situations and population changes of each region following a period of social development [10]. In Taiwan, a single constituency (plurality) system was enacted in 2005 and was first used in the election of legislators [11]. A politically compromised version was not even announced until 2007, after numerous versions disputed by central and local governments, political parties, and candidates for a beneficial districting. Therefore, how to partition the electoral constituency fairly is indeed a difficult task for emerging democracies [12].
Some mathematical models and algorithms were developed to optimize electoral districting [13]. Voronoi diagrams were applied to electoral districting for the completeness and symmetry of districts [14,15]. Cluster analysis was also applied in the design of a constituency to solve the problem of seats and electoral redistricting [16,17]. However, there is no specific protocol for implementing redistricting with the current constituencies using such political principles and computing theories.
As stipulated in the rule of “a village is the smallest administrative unit,” promulgated by the Central Election Commission of Taiwan (CEC), if a municipality or county (city) has n villages, these villages will be divided into r constituencies, in which the population of each constituency is roughly the same [18]. If one searches for all possible districting solutions using the exhaustive method, the complexity of the search space is rn—for example, if one divides 100 villages into two constituencies, the search space involved is 2100. This calculation is incomplete and unrealistic, and is considered an NP-hard problem [16,19].
These studies can be used to achieve fairness in redistricting of the constituency to produce some suitable solutions, but they encounter two problems: (1) If preferred standards are set loosely, NP-hard cannot be completed; and (2) if preferred standards are set strictly, only limited local solutions can be found at the end. Even for multiple electoral districting, the spatial complexity of the solution set exponentially increases. Therefore, it is extremely challenging to find a systematic method to partition a constituency and to find all solution sets in a limited resource, and analyze a comparison according to the principles of preferential electoral districting.
For NP-hard problems, such as computational complexity up to , many solutions have been proposed, such as Euclidean least-squares analysis to reduce the gradient of iterative calculations [20], a constant-factor approximation algorithm to reduce the complexity of the operation [21], and Lagrangian relaxation combined with optimal transport distance and design cost function to replace past complex operations [22].
Although the NP-hard problem could be solved effectively, manual interventions are still necessary. According to our previous study, a multi-dimensional (multiple indexes) classification system is prone to asymmetric solutions caused by information loss [23]; thus, pattern and fuzzy techniques could assist in ensuring quality and performance of computing before and after experimental operations.
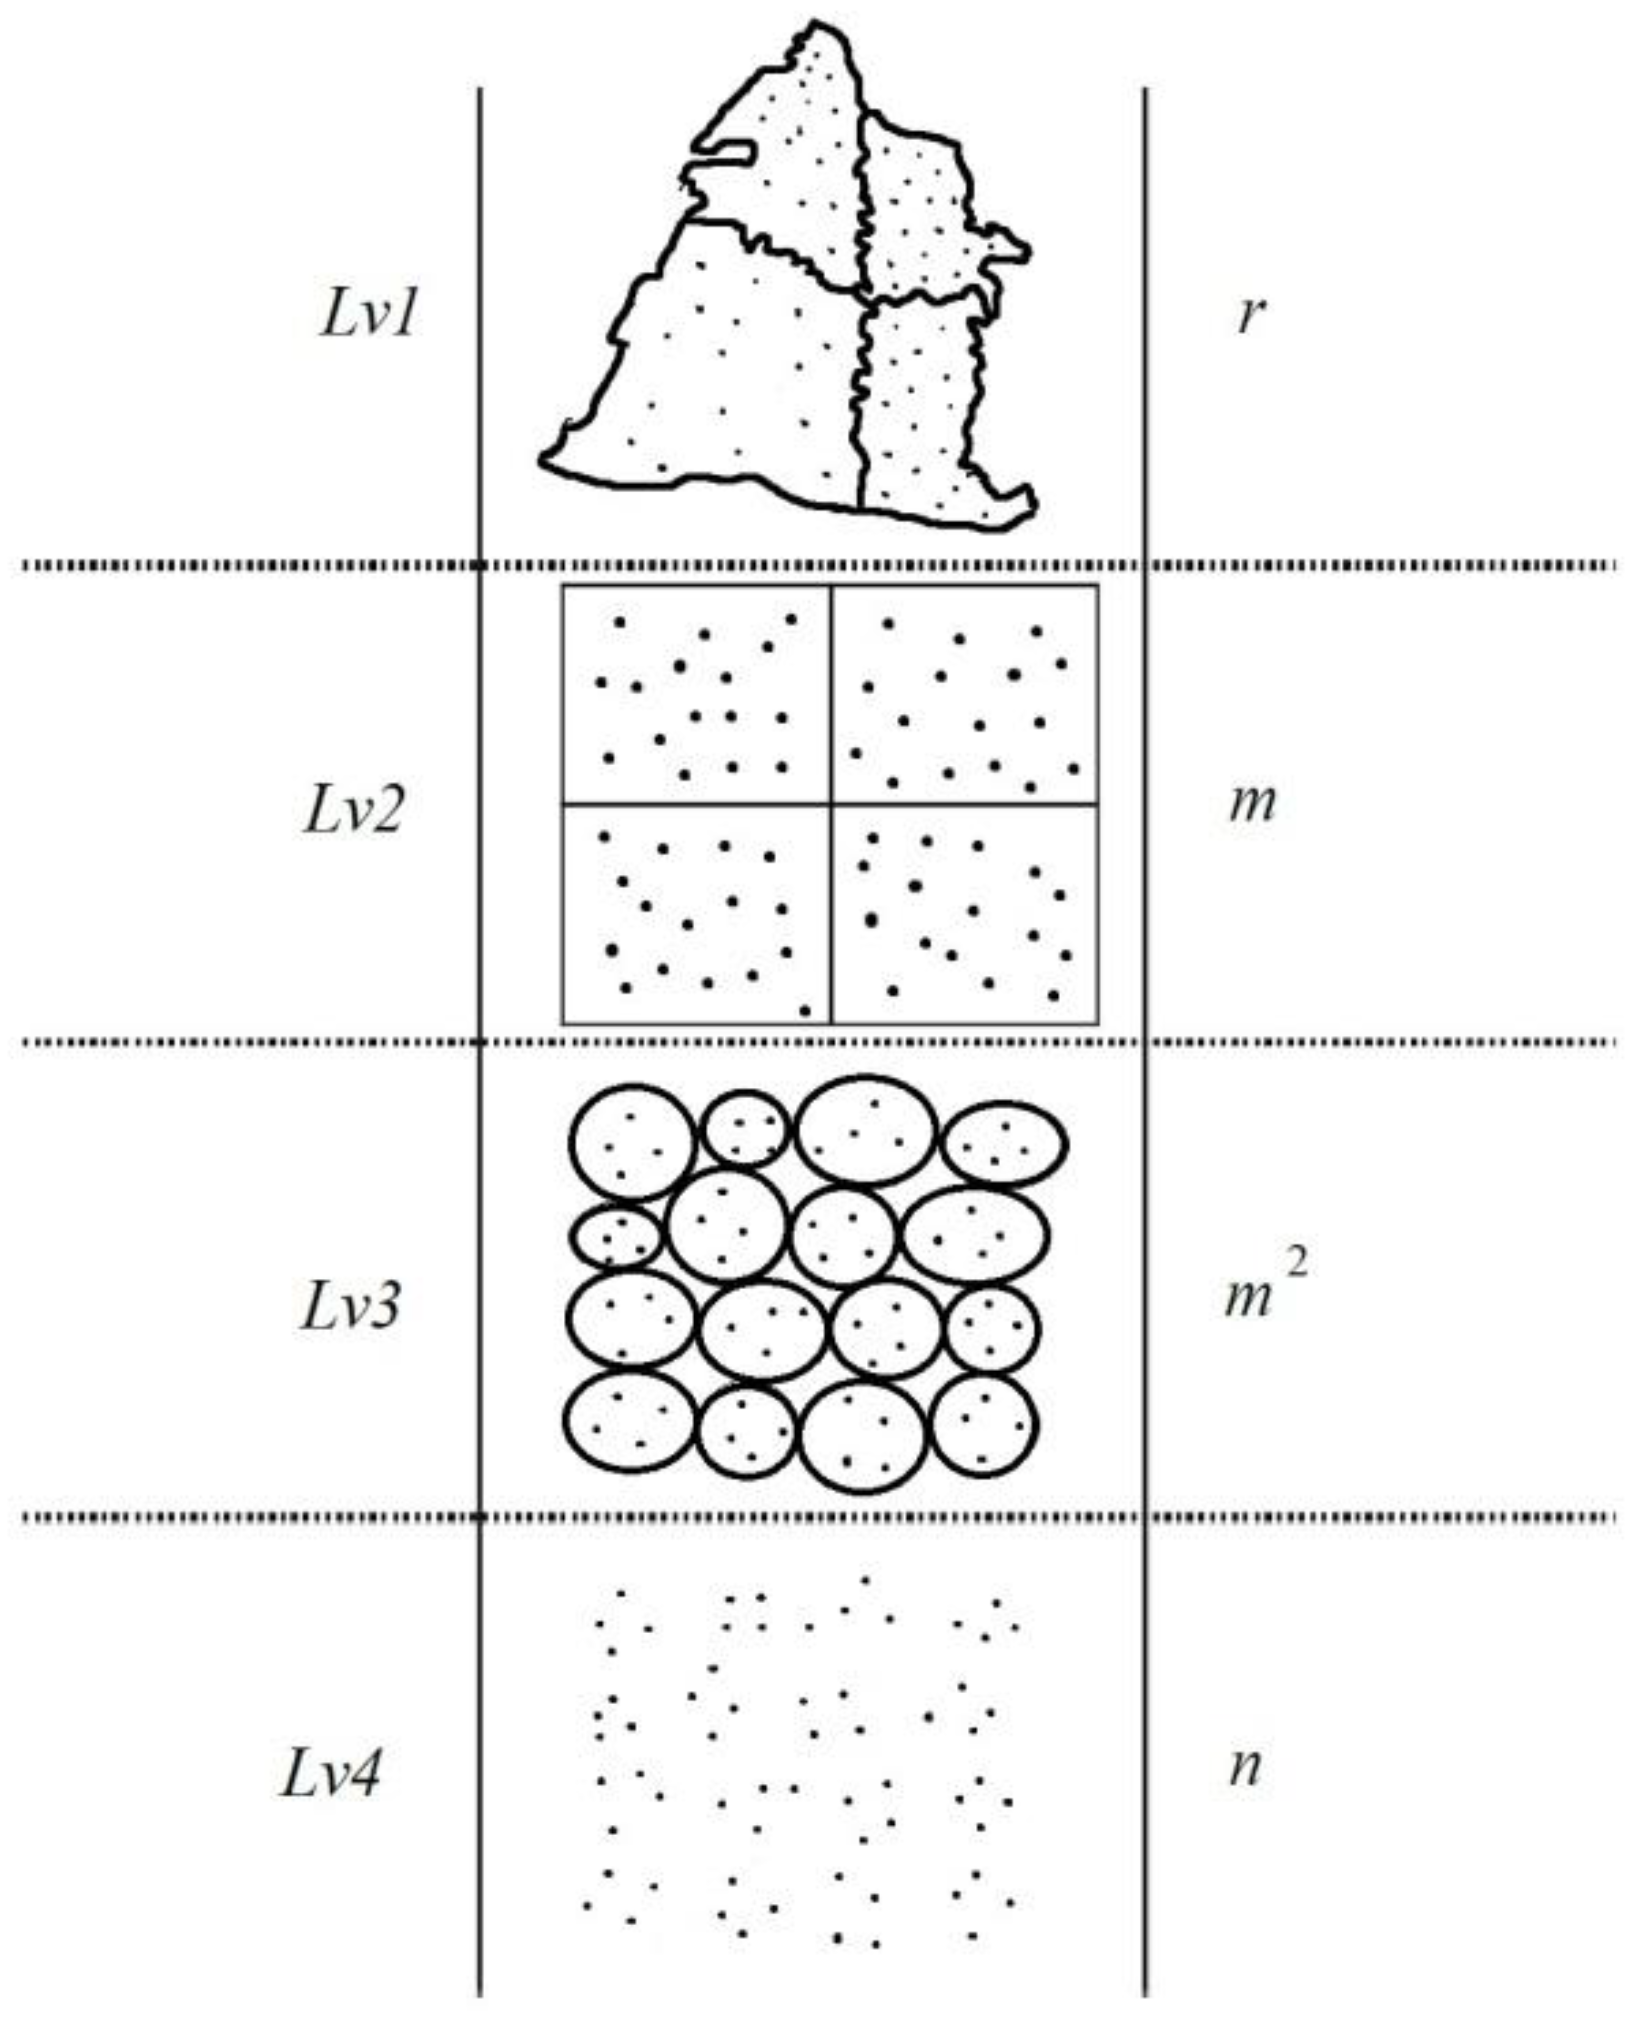
A concept from representative systems in sociology was introduced to group hierarchy for districting problems, as shown in Figure 2. There are a total of n villages in an administrative district, and these villages will be divided into r constituencies. We separate geo-informational space into four layers to propose a mechanism that bypasses the exponential complexity of rn and completes the automatic division using computers.
If we want to complete electoral districting using the limited resources of a computer, the value of n cannot be too large; here, we set an m value, where m < n. As long as m is within the appropriate range, the search space of rm can be completed using a computer. Thus, the current situation is equivalent to dividing n villages into m groups.
If m is small and the difference between the m and n values is too large, the flexibility of the division may be lost. Finally, only local optimal solutions can be found, instead of global optimal solutions. Therefore, we hope that the number of villages in each group does not exceed 5, that is, n/m ≤ 5. In terms of image geometry, it is equal to merging two to five villages into one larger village.
On the other hand, if m is large and the difference between m and n value is too small, it will also face the problem of NP-hard. For further comparison, if m2 ≤ n, continue to divide n villages into groups; if not, adjust the m value to appropriate ranges. There is no need to worry about the m value at this point, as it will be automatically calculated by artificial intelligence. In short, the relationship between m and n will eventually become n/m2 ≤ 5 or n/m ≤ 5. Since an administrative district has at least hundreds of villages in Taiwan, the latter experiment will be conducted in m2.
Through comparison and applying geometric patterns, an m2 group is directly divided into m groups. Then, the most extreme arrangement of the search space of m is made and the most feasible solutions within the maximum capabilities of the computing system are finally obtained. The purpose is to find not only local optimal solutions but also global optimal solutions.
The aim of our implementation is to reduce artificial defects and partition constituencies through a method of machine learning and automatic algorithms. Machine learning was utilized on self-driving or unmanned vehicles to be more accurately positioned and to address the errors of a global positioning system (GPS) in complex and crowded urban buildings [24]. A geographical division was applied to self-driving vehicles to allocate dynamically the best geographic service capacity [25]. Artificial intelligence can be used to cooperate with population movement results of censuses over time, if the system is capable of automatically completing the objective and fair electoral districting. Furthermore, the results of artificial intelligence and spatial distribution in this study could be applied not only to electoral districting implementation but also to fair distributions with limited resources, such as agricultural land redistricting, school district division [26], service segmentation [27], and robot network design. We believe that it is an advanced and intelligent solution on these districting problems.
2. Materials and Methods
2.1. Integrated Computing Programs
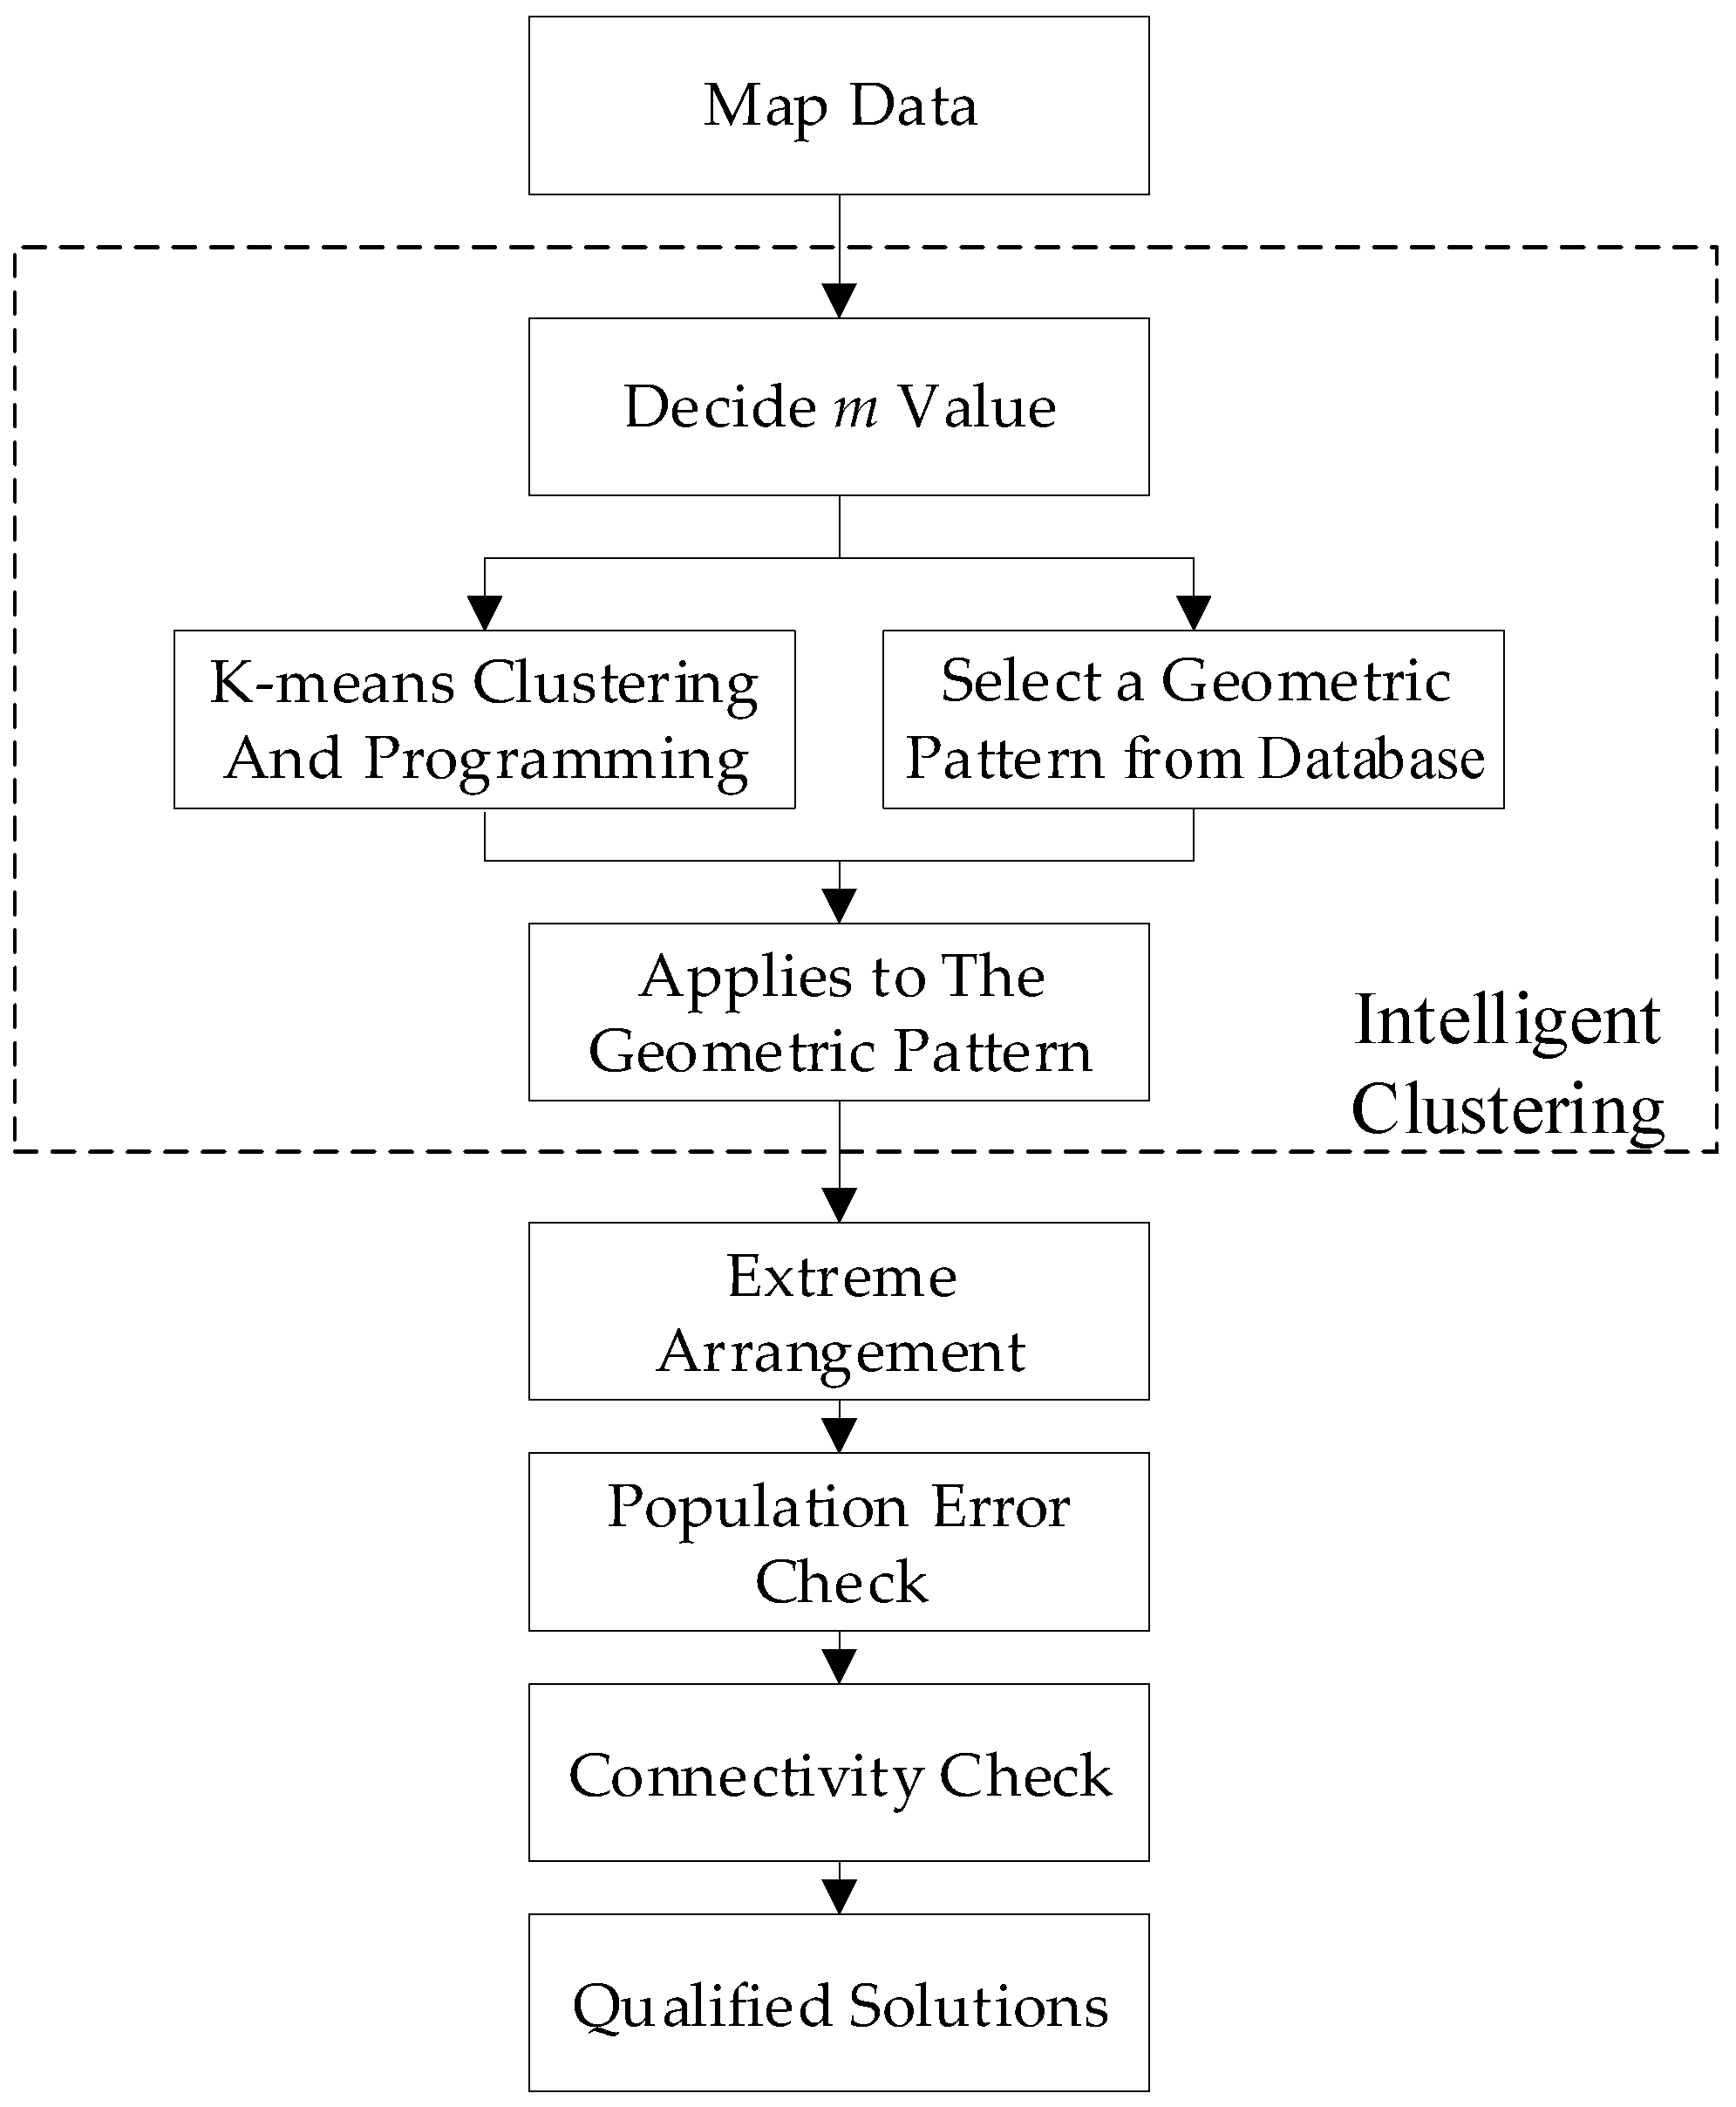
The system architecture of computing and algorithms for electoral districting is shown as a flow chart in Figure 3. Each of the operations and mechanisms in the integrated system will be stated as follows.
2.1.1. Map Data
There were a total of n villages, which would be divided into r constituencies. The relevant map information, such as population, area, boundary point coordinates, and neighboring relations with other villages, needs to be structured before partitioning.
2.1.2. Intelligent Clustering
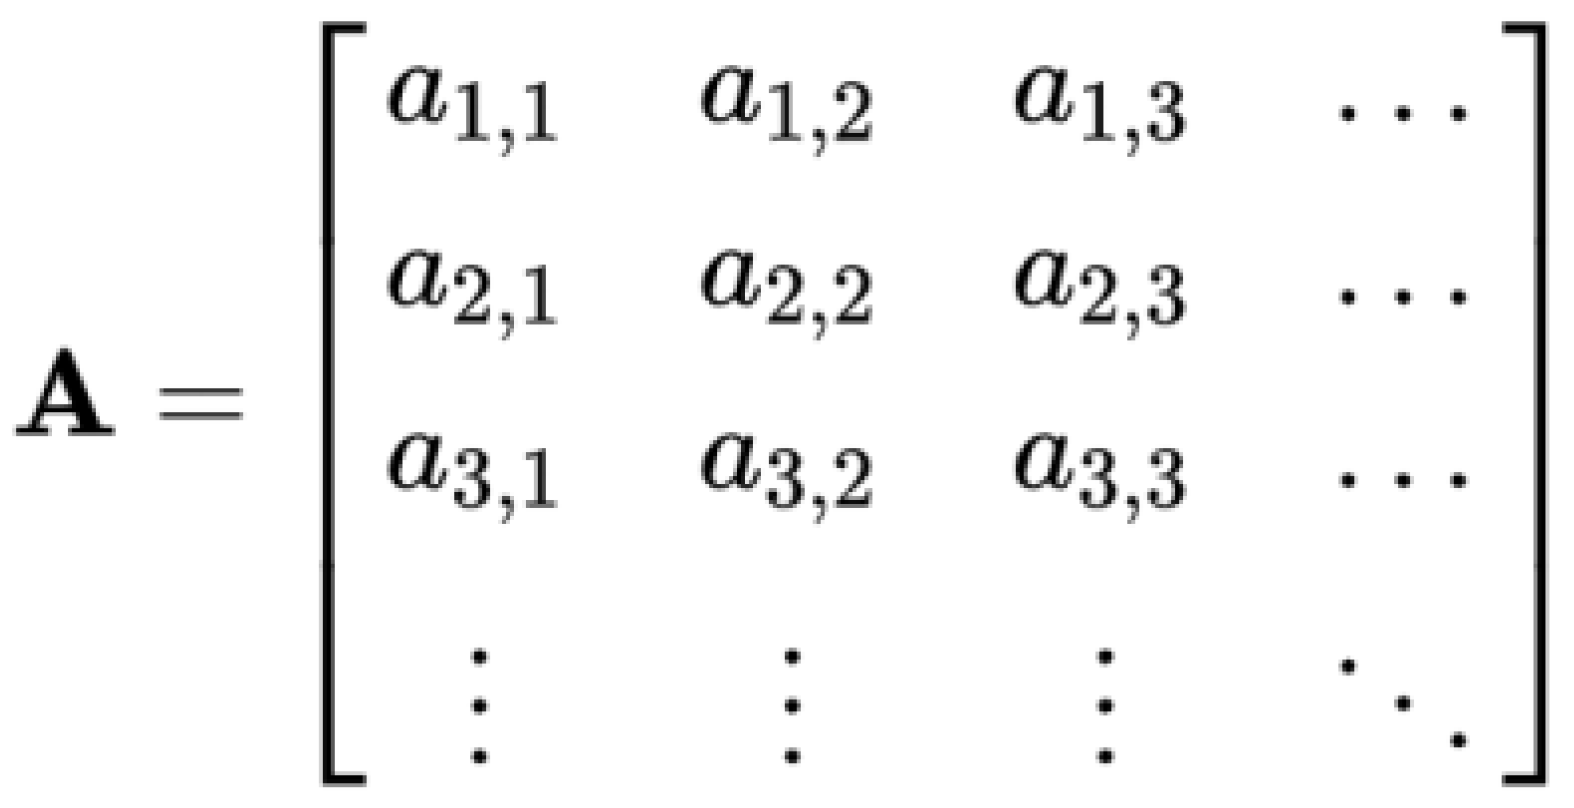
The system analyzed the computer resources, and the 2nd Stirling number was calculated for the m value, which is described in Section 2.2. Next, the n villages were evenly distributed in a matrix (m × m) according to the symmetrical geometry of K-means clustering, and called Matrix A. Then, the system randomly selected a geometric pattern of the same size m × m from the database, and applied Matrix A to the geometric pattern. After that, we could get a new set named Set B that was divided into m groups, and the total number of villages in Set B was still n.
2.1.3. Extreme Arrangement
If you put Set B into the 2nd Stirling number to perform an extreme operation, and get a lot of new electoral districting solutions, the number is S(m,r).
2.1.4. Population Error Check
For all the results from S(m,r), all constituencies of results must perform a population error check. That is, all constituencies must meet the upper limit of the population error of 15%, which is ε ≤ 0.15. If the population error of any constituency exceeds 15%, then the result is unqualified and must be abandoned.
2.1.5. Connectivity Check
In order to ensure that a constituency is not broken, a connectivity check must be done. Here, the depth-first search algorithm [28] was used to deal with the neighbor relationship between the villages. If villages in the same constituency are not all connected, then the result is unqualified and must be abandoned.
2.1.6. Qualified Solution
This step stored the qualified results through the checks in the database, and the solutions would include information such as the number of villages and the population of each constituency. Later, these solutions were exported to the geographic information system (GIS) for further analysis and discussion.
2.2. Stirling Number of the Second Kind
The 2nd Stirling number is a method for dividing m different objects into r non-empty sets, and is defined as S(m,r). Its recursive formula is as follows: let m,r∈N and m ≥ r, then S(m,r) = S(m − 1,r − 1) + r × S(m − 1,r), where S(m,1) = S(1,1) = 1. In addition, S(0,0) = 1 is specified; for all m ∈ N, S(m,0) = 0; when m < r, S(m,r) = 0.
If an electoral districting solution requires 1 KB of data for recording. A maximum of 10 million solutions can only be obtained while the computer has a memory of 10 GB. Thus, whether one is using an exhaustive method or a pure recursive algorithm, the solutions will exceed 10 million. Considering the limited resources of a computer, we could predict conditions under which the maximum amount of solutions can be found through the 2nd Stirling number. If a computer is equipped with limited memory for division, then the system will only choose a way to divide the corresponding solutions or to ensure that the computer completes the full work before the resource is exhausted. For example, if we divided the data into three districts, r = 3, then the number of villages would only be set, m = 16, because S(16,3) = 7,141,686 < 10 million.
2.3. K-Means Clustering and Programming
Geometrical data, such as area and boundary point coordinates, can be obtained from the GIS. The basic information of each village includes population, area, boundary point coordinates, and adjacent relations to other villages. There were n villages in an administrative district, and all the villages were presented in a three-dimensional space, in which the village could be expressed as , that is, and are central coordinates of village , and is population.
To divide n villages into m2 groups using K-means clustering, the system would randomly set m2 group centers so that the distance between the centers of the groups was as equal as possible and presented in a symmetrical geometric manner.
The Euclidean distance was calculated, and each village was classified into the nearest group. Each group will have a new village that was classified, and then these new villages would be used to update the center of the newly expanded group. For initialization, the total population of the administrative district is defined as P. After an iteration of batch K-means algorithm, the program was used to check the each of groups. If the population of group reached P/m2, this group did not participate in the next iterations. Finally, the population equalization of each group was achieved and the whole group was presented in a two-dimensional vector space, it could be regarded as an m × m symmetric matrix, as shown in Figure 4.
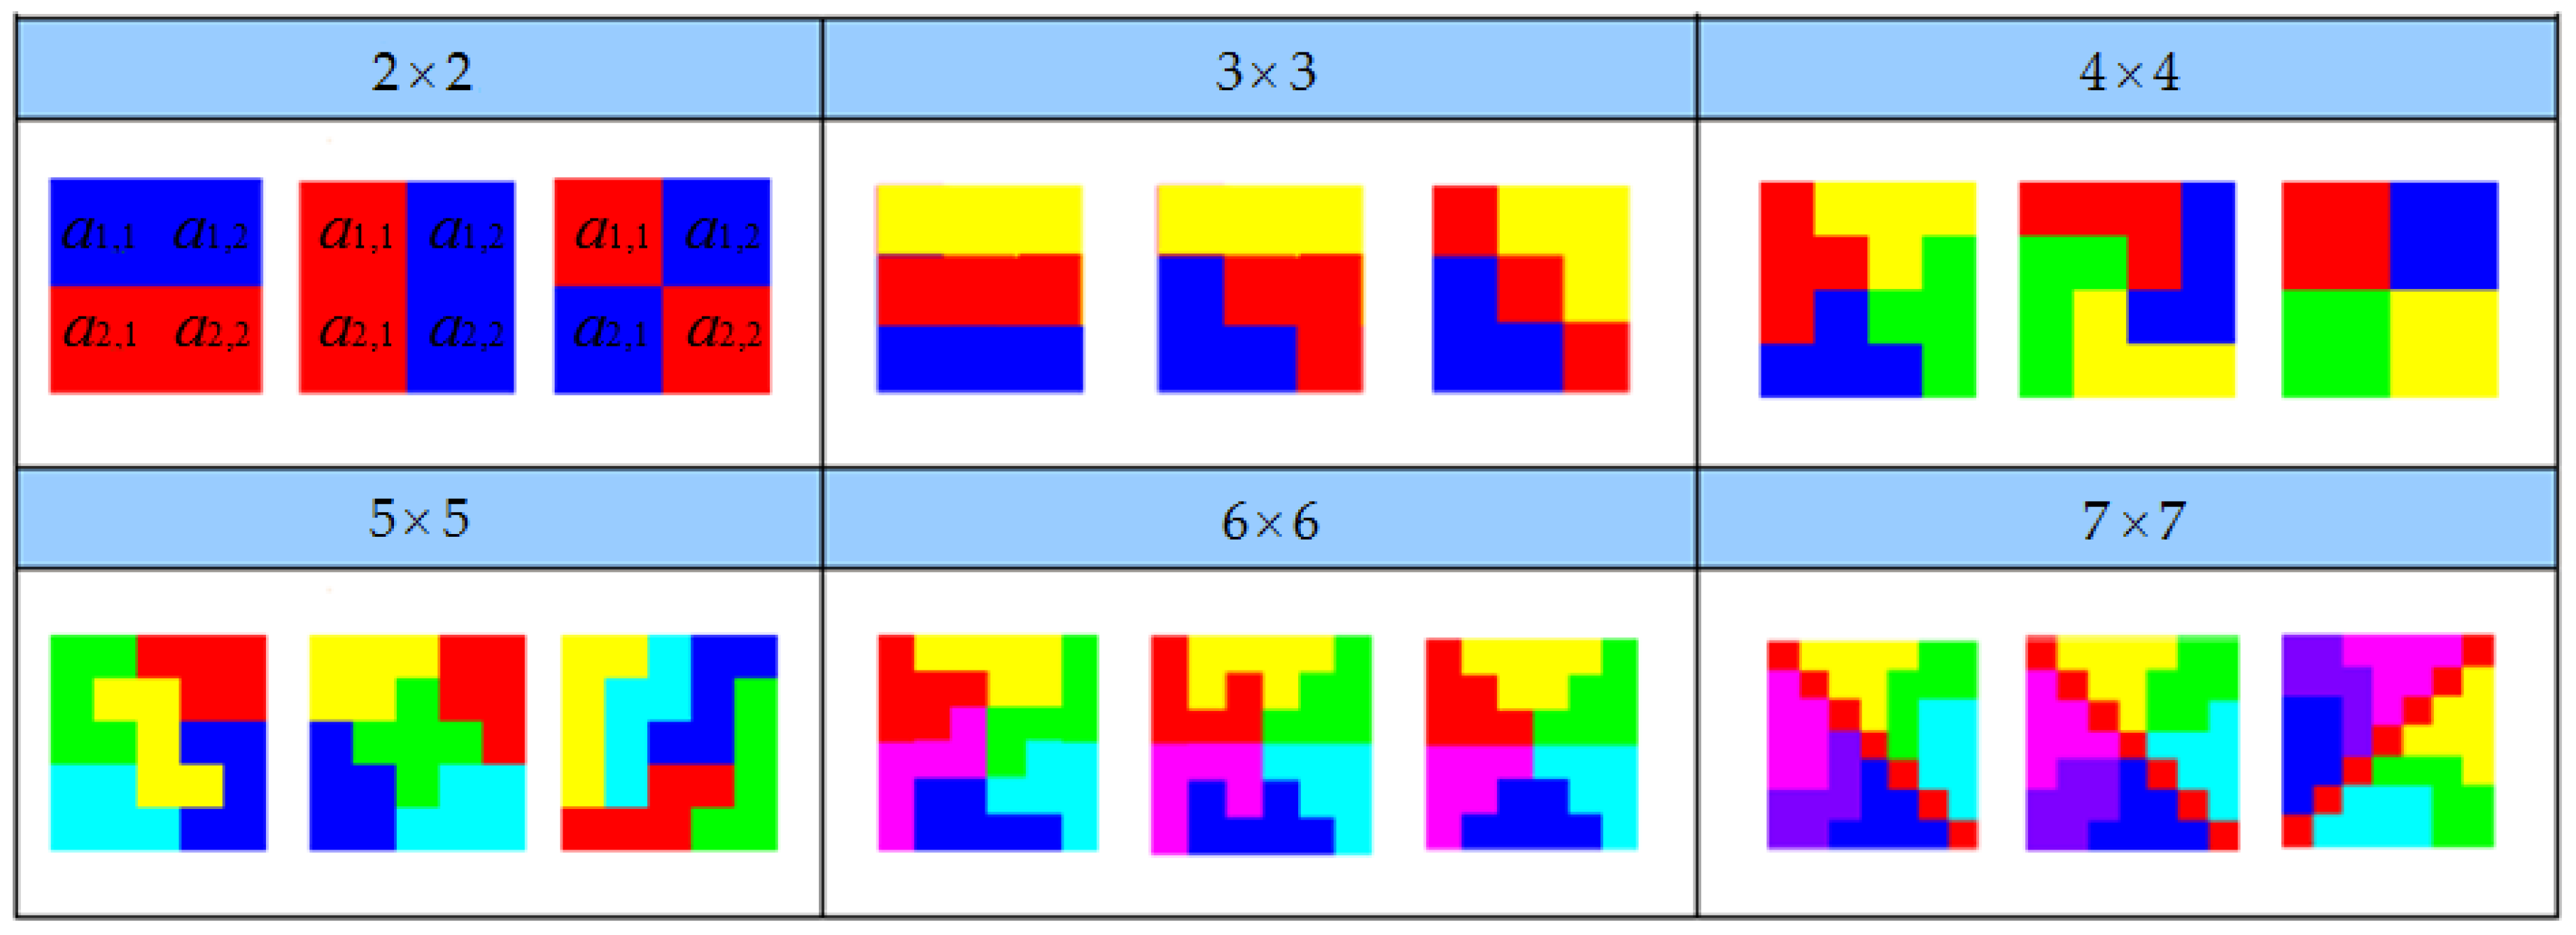
2.4. Geometric Pattern Simplification
In order to reduce the spatial complexity of electoral districting, we used computational geometry to arrange and combine various matrixes in advance, for the purpose of producing a variety of geometric patterns. The calculation results were stored in the database. Although the matrix of each geometric pattern was large or small, the rule applied to only one: A matrix of m × m must be divided into m parts, as shown in Figure 5. There were three styles for each matrix, but there were more than three actual styles. Although the largest matrix included in the figure was a 7 × 7 matrix, it could actually be extended.
If the system had generated a square matrix, we could randomly pick out a set of geometric patterns from the database, corresponding to the matrix of m × m. The pattern of the m × m group was applied directly to the partition, which saved a lot of computer resources and computing time. For example, with a block of , the system could directly divide four elements into two parts. Dividing m × m elements into m parts is hard work to complete because the search space is mm×m.
Each geometric pattern produces corresponding optimal solutions. If the computer can have more resources and can combine multiple geometric patterns at the same time, the performance can be improved by the number of combinations, and also can find more variability in local optimal solutions and the applicability of global optimal solutions.
2.5. Population Error Calculation
There were a total of n villages in an administrative district to be divided into r districts. Let denote the set of n villages . The population of village is denoted as . Electoral districting divides into r groups , , and the population of is denoted as , so that the village groups are disjointed and are roughly the same; is defined as the average population of all the electoral districts. Moreover, it can be calculated as:
The population is roughly equal, that is, the population error ratio (PER) must be less than the threshold, which can be expressed as follows:
In Taiwan, the upper limit of the PER was set as 15%, for which ε = 0.15. For the PER evaluation of the entire administrative region, the tolerance of absolute population error ratio (abbreviated as TAPER), is defined as
A smaller TAPER represents a smaller population difference and higher fairness.
2.6. Constituency Shape Calculation
In general, a circle is the most compact shape, but several circles together cannot be combined into a complete block, and there must be a gap in the middle. Although a square is not the best shape, several squares can be put together to form a complete block (no gaps in the middle). When dividing, it is often difficult to divide a constituency into circles or squares, so it is impossible to judge whether the shape is complete or not. Two primary principles in a constituency shape must be followed: All units in the same constituency must be connected and cannot be separated (contiguity principle); and a shape must be kept simple and complete, gathered around the center core, and there must be no branch (compactness principle).
A convex hull is a minimum convex that can cover a group of scattered points in a geometric plane and space, and its area or volume is the smallest [29]. With this feature, convex hull area ratio is used to quantify a constituency shape. In calculation, denominator HA is defined as a convex hull area of a constituency, and numerator DA is a constituency area, then the convex hull area ratio (convexity) of a district = DA/HA × 100%. The closer the value of convexity is to 100%, the more complete a shape it represents. Later, we define the shape of the entire administrative area with the minimum convexity, represented by Convexitymin.
3. Results
3.1. Characteristics of the Example Case for Electoral Districting
Changhua County in Taiwan was chosen as an example of electoral districting. The terrain is flat and wide, without considering obstacles such as rivers and mountains, which is conducive to equal division. The entire administrative area is complete in shape and will not be crushed or excessively narrow, so it is suitable as a case study.
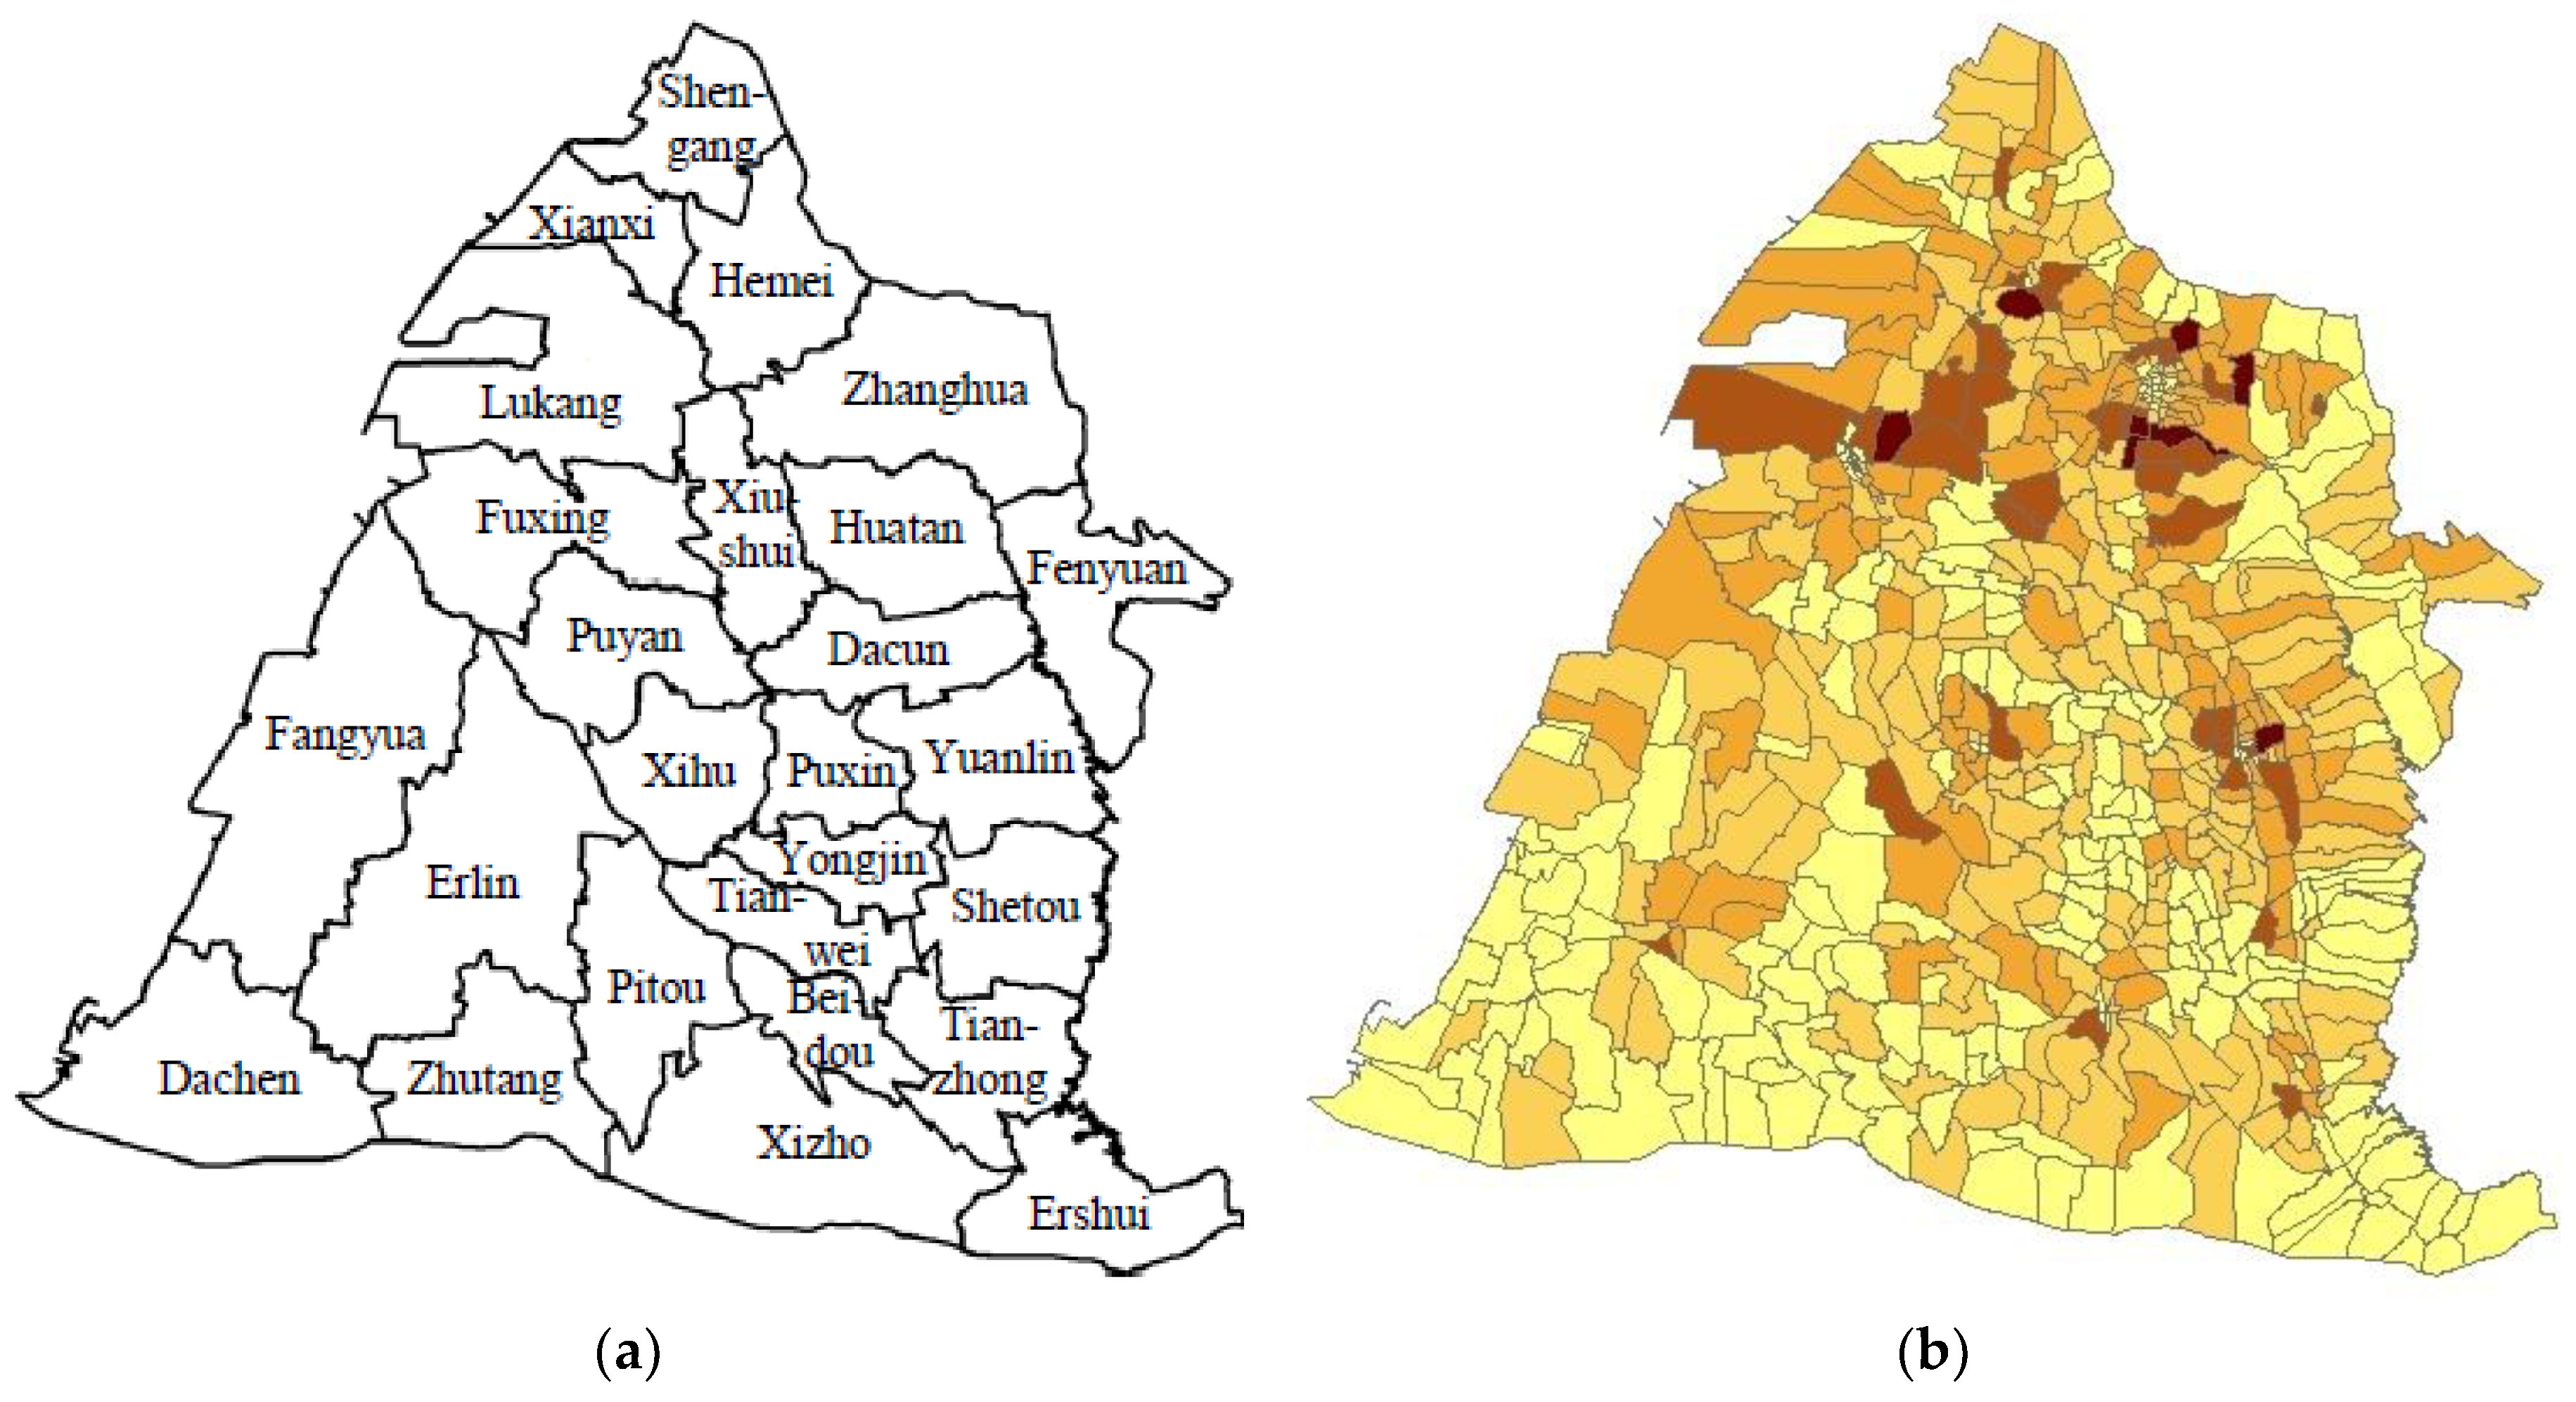
Changhua County has a population of more than 1.3 million and a total of 26 sub-districts, accounting for 588 villages. Four constituencies is an appropriate number in the election of legislators. Details of Changhua County are shown in Figure 6 (sources: https://data.gov.tw/ and GIS) and Table 1. Township boundaries are shown in Figure 6a and the villages are shown in Figure 6b, and the darker the village, the higher the population.
According to a proportion of the population as defined in the official version, the number of legislators to be elected is four. Therefore, corresponding to the legislators, Changhua County must be divided into four constituencies, and the average population of each constituency is 329,191. All of the 588 villages were partitioned into the four constituencies in Changhua County. The relevant geographic information was uploaded to the system and got n = 588, r = 4. As a preliminary evaluation, the available memory of the computer was 12 GB, and it was determined that m = 14. The system was set up according to the flow chart in Section 2.1. After calculation, a total of 678,678 districting solutions could be obtained without the preferred standards, as shown in Table 2.
There are 403,692 districting solutions with an average population error below 10%, and 27,380 districting solutions with an average population error below 5%. If the average population error is below 5% and the minimum convex hull area ratio is above 50%, there are 24,921 districting solutions. In order to take into account the integrity of the administrative region, we tried to select the division of townships for discussion in the following comparison.
These results show that the threshold of PER is the extrinsic property and dominant factor for solutions computing, and convexity is the intrinsic property. The limit of PER can significantly affect the number of suitable solutions, and choosing the appropriate limit of convexity will facilitate the selection of suitable solutions for subsequent analysis. This is because the results of the experiment must be compared with the official version to know if there is sufficient objectivity, fairness, and progress.
3.2. Official Version of Legislator Election
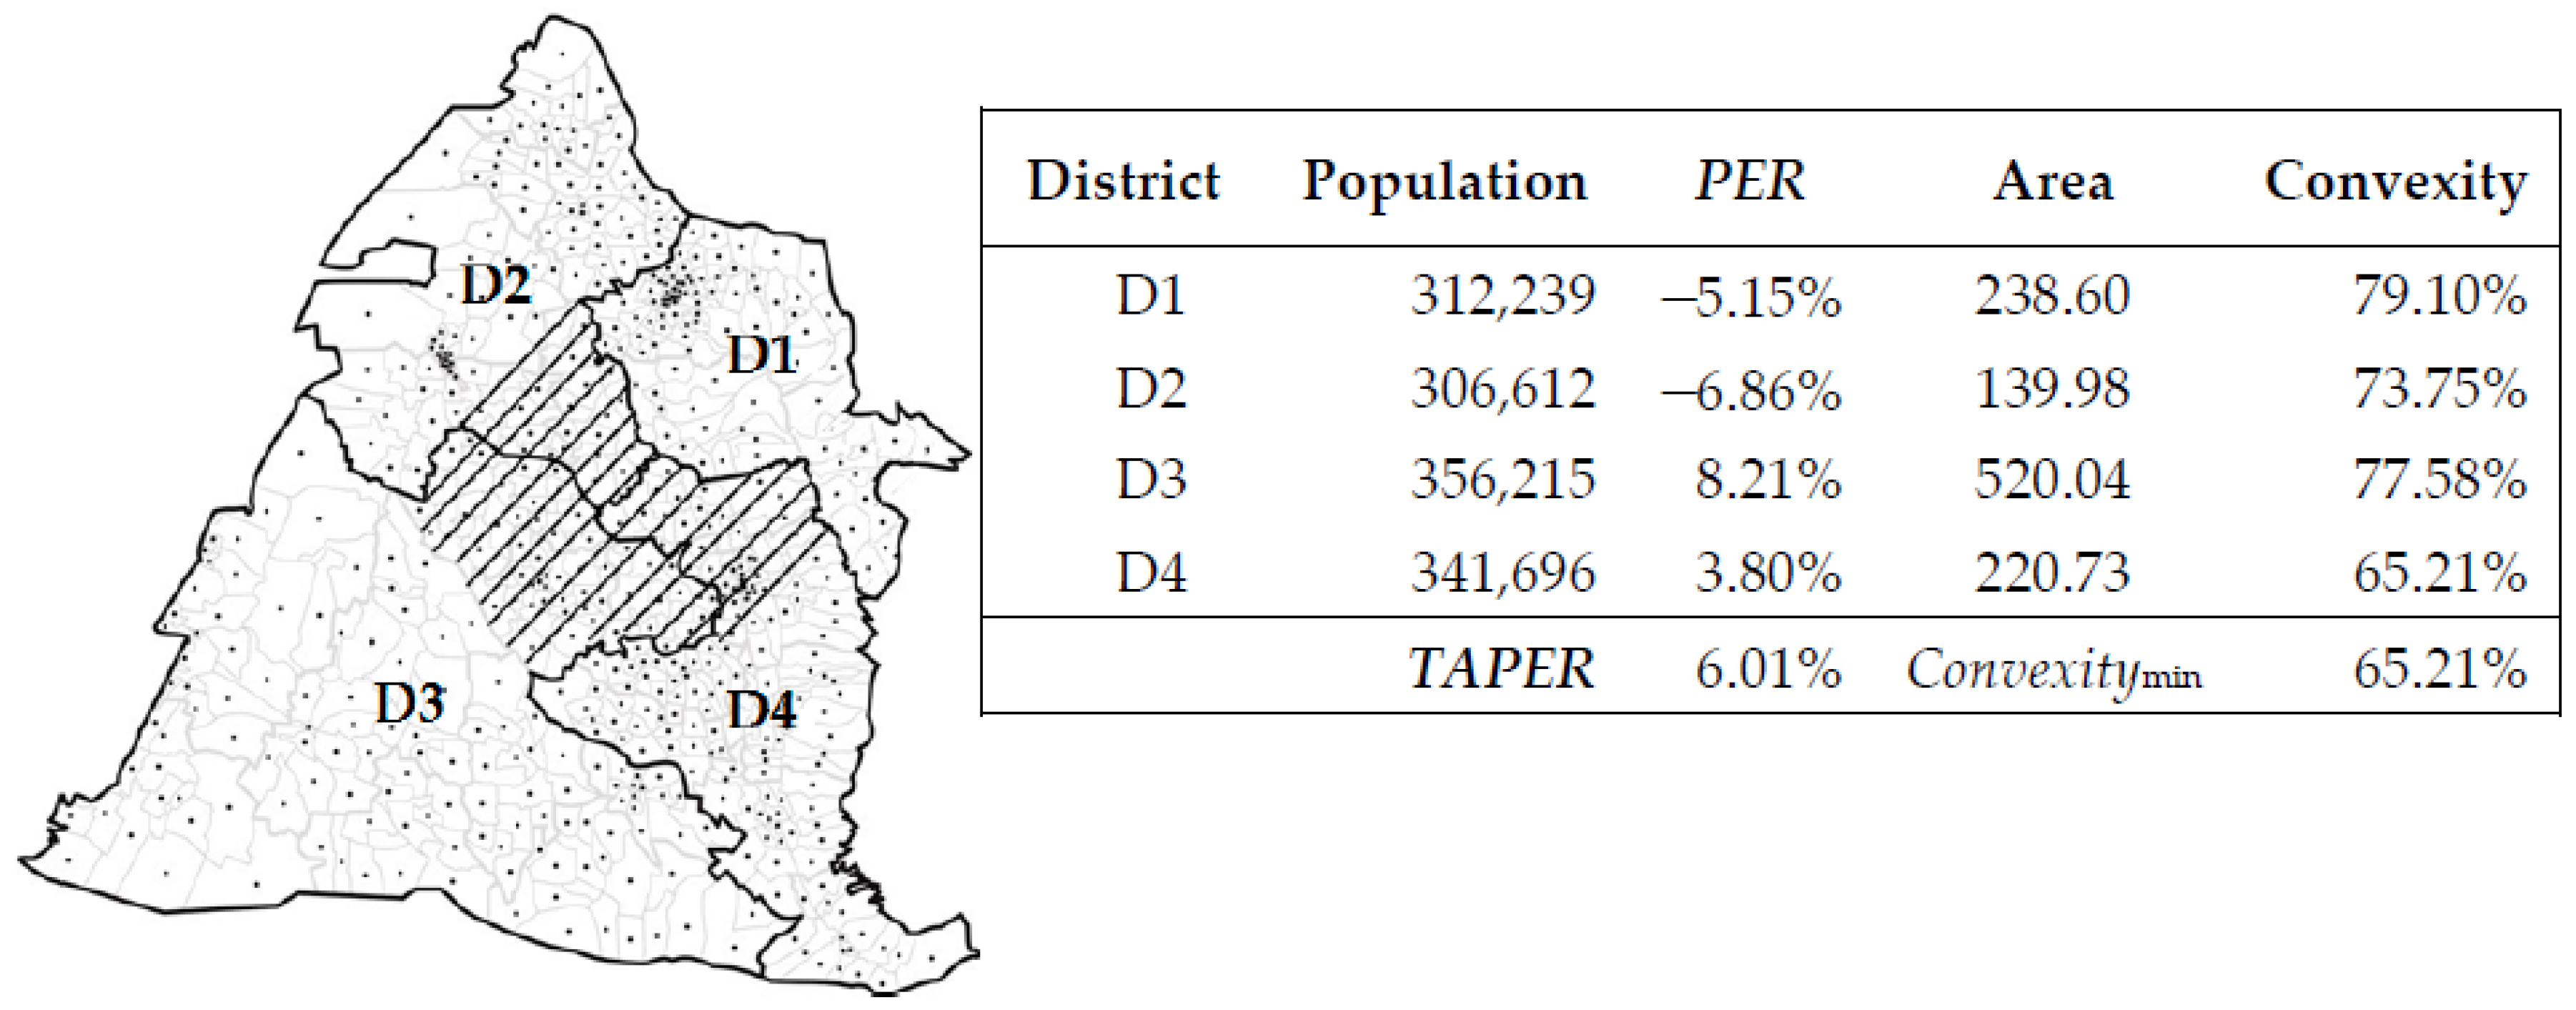
Two principles were officially announced for electoral districting: (1) The limitation of the population of the constituency; (2) villages must be connected to each other in the same constituency. The legislator election was chosen as a case study, and the constituency information in Changhua County is shown in Figure 7. Among them, the population of D1 was 312,239, and the population error was −5.15%; the area derived from GIS was 238.60 square kilometers, and the convex hull area from GIS was 301.63 square kilometers, so convexity was 238.60/301.63 = 79.10%. For the entire administrative constituencies, 6.01%, and .
Several major shortcomings will be found in details of the distribution of each constituency. First, D3 contained too many rural areas, and the population was also the largest, so compared with other constituencies, it showed an imbalance of population ratio. Moreover, the area of D3 was also the largest; in particular, the shape of an area in the upper-right corner was particularly convex, and the area indicated by an oblique line was extremely abrupt. A section of the oblique line should be cut and distributed to other districts to be balanced. Second, D2 had the smallest population and the smallest area, and should be filled in from the oblique-line area of D3 and D4. In general, the constituency divided by the official version had an uneven population distribution and an overall shape that was irregular. It could be further optimized and improved.
3.3. Comparison with the Official Version
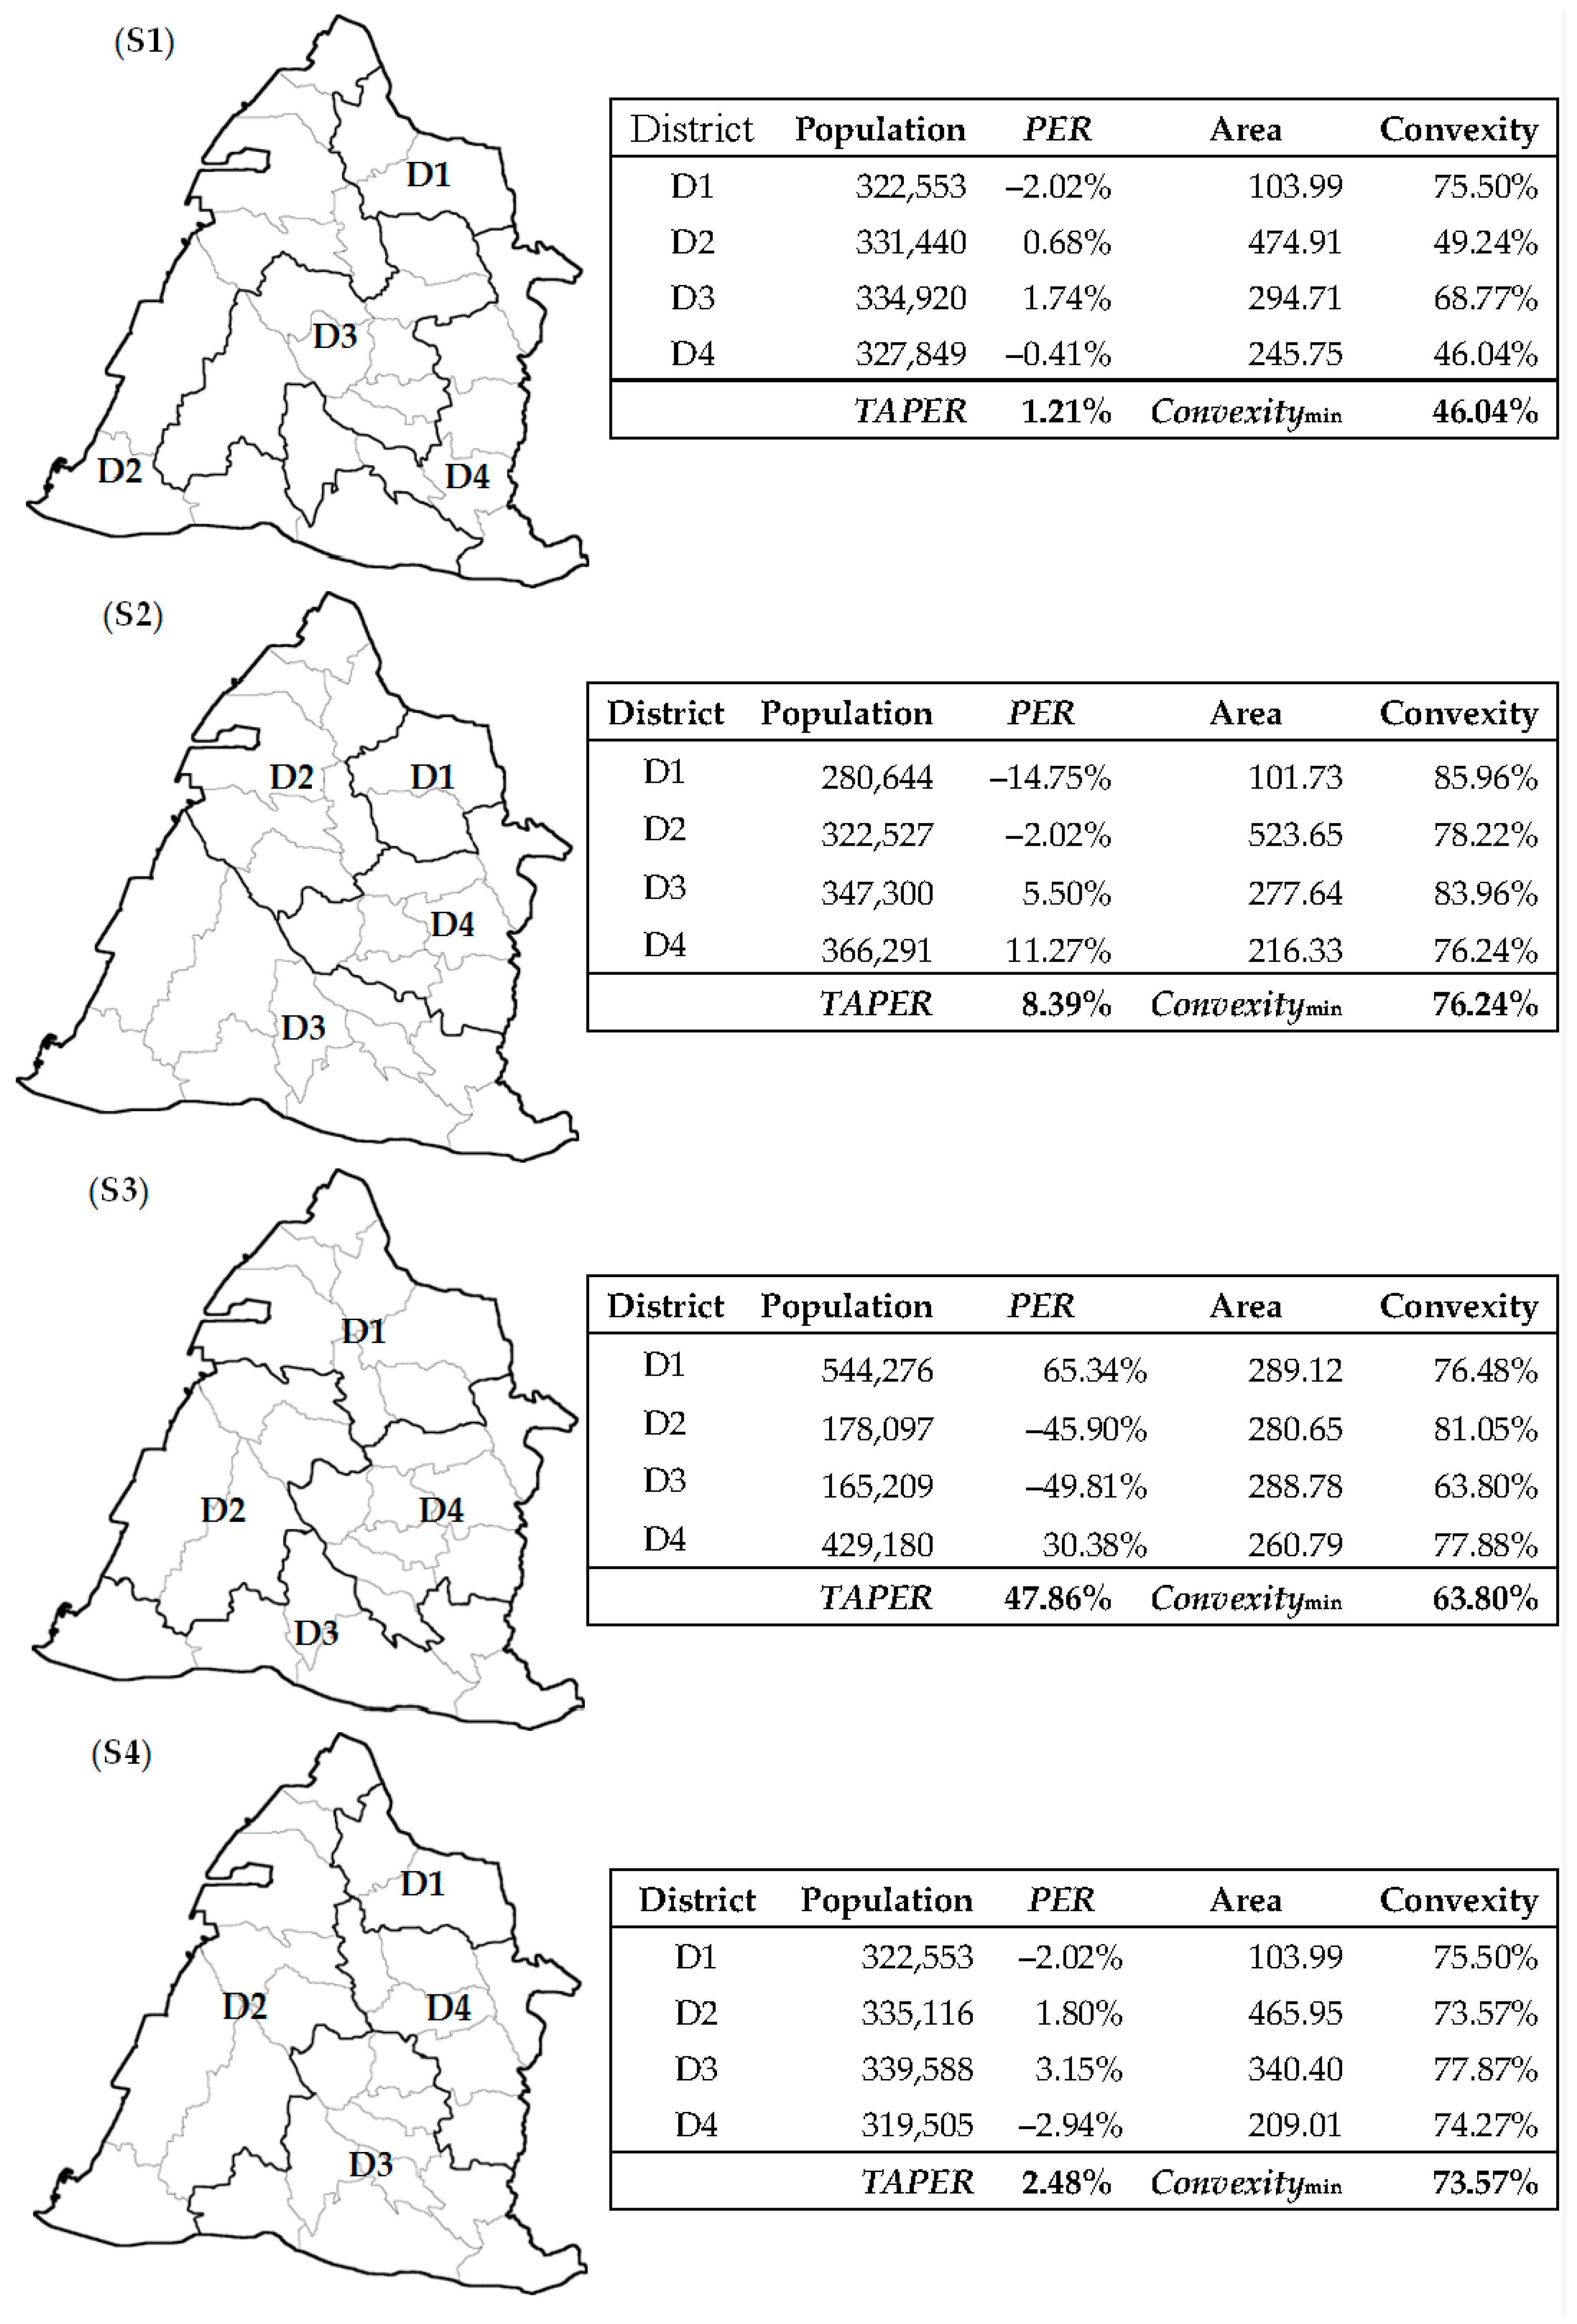
From the results of the division, some cases were selected for the smaller population error, the better shape of the constituency, and the equal area of the constituency, and several partitions of various advantages are discussed, as shown in Figure 8. These performance indicators, such as PER, TAPER, convexity, and Convexitymin for evaluation have been defined in Section 2.5 and Section 2.6, respectively.
Sorting by the TAPER as the S1 < S4 < Office < S2 < S3 to compare the fairness of the population, the S1 partition had the best equal population for each constituencies. However, the shapes of other constituencies except for D1 were irregular shapes in S1, and its Convexitymin was only 46.04%. Unfortunately, the S1 partition would not be a suitable solution due to its excessive grotesqueness. Therefore, the official requirements, population error limits, and constituency connectivity were not enough when thinking about electoral districting.
By convexity, a better-shaped district could be screened out. To compare the integrity of the constituency shape, sort by the Convexitymin, and the result was S2 > S4 > Office > S3 > S1, so the shape integrity of the S2 was the best; each district had high convexity, and the shapes of the districts were very neat. However, the PER of each district was examined: The PER of D1 was as high as −14.75%, so the TAPER was actually 8.39%.
To compare the area of the constituency, in terms of area balance, the area of each district in the S3 partition was approximately equal. Although the area size of the district was very close between each other, and there was also good symmetry between them, its TAPER was as high as 41.59%, which was higher than the 15% upper limit set by the office. Since the population of Changhua County was unevenly distributed, it was unrealistic to consider only the most average area of thinking. Therefore, this result was unqualified.
Based on the symmetric classification of overall districting, S2 and S3 had a similar geometric pattern to the official version, whereas S4 had an orthogonal pattern. Finally, the optimization result of the overall symmetry was considered: The S4 partition had a TAPER of 2.48% and Convexitymin of 73.57%. Not only did it have a very small population error, but also the shape of the constituency was very complete, and there was symmetry between the districts. The preferred standards were better than the official districting, with significant progress.
The population of Changhua County was concentrated in the northern and eastern villages, whereas the southern and western villages were less populated, so the population structure was not uniform in terms of geometric distribution in the S4 partition. A symmetrical partition result had better balance in terms of the overall shape and area. Based on the principle of population parity, and also considering the difference between the urban-rural gap and the living environment, the best geometric symmetry that could be achieved here was shown as S4.
Past researches have shown that there may be no way of considering so many factors at the same time, and there is no way to choose good results. Our method had great flexibility in finding many results and could achieve fairness and objectivity. At the same time, our system could also be intelligently clustered according to different division requirements, instead of being static, as it is progressing.
4. Discussion
4.1. Improvements of Computational Performance
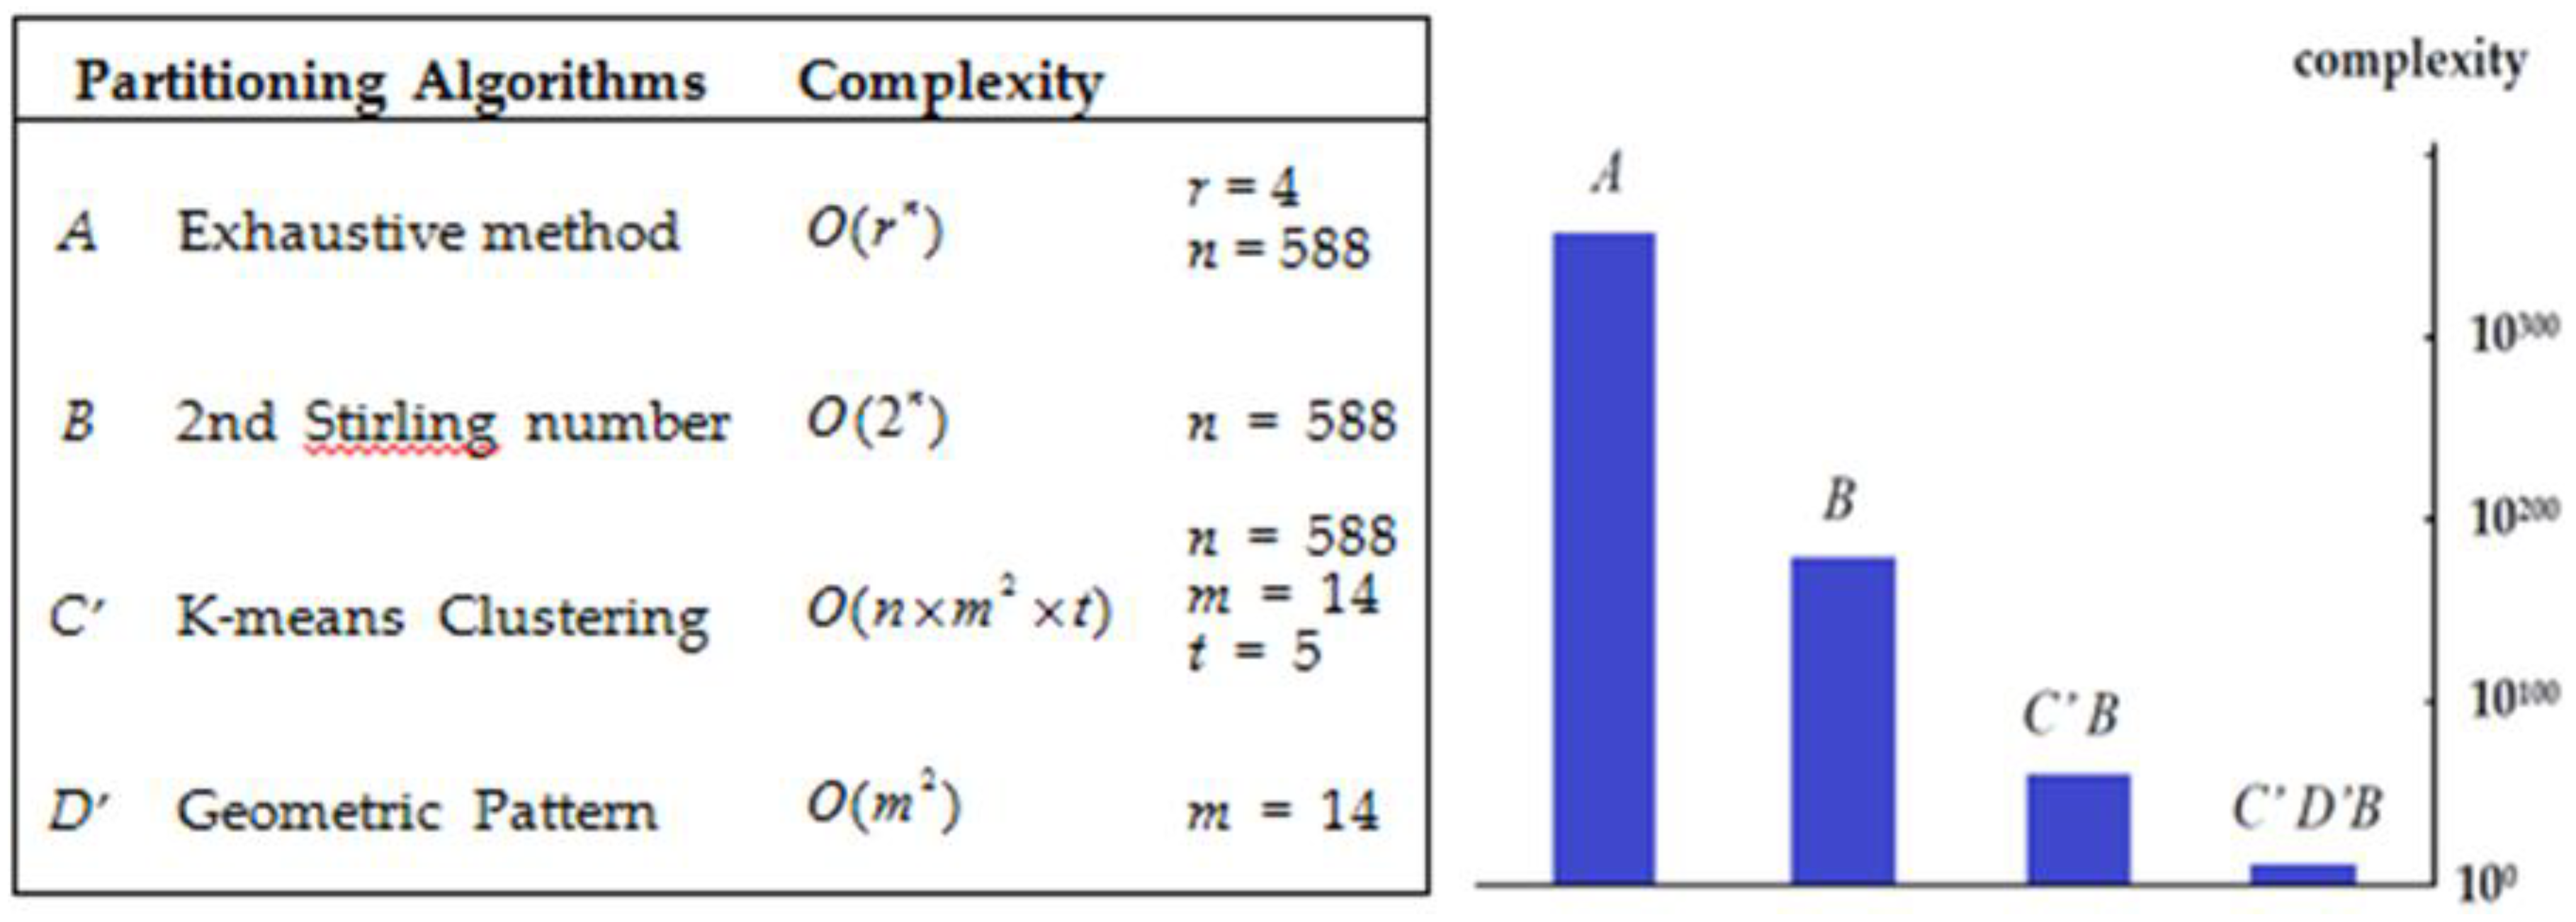
Electoral districting is usually done by an exhaustive method or by using permutation and combination as the main method, in order to produce a variety of division schemes; and the tweaked Lloyd’s algorithm with the purpose of achieving a specific requirement [30]. In terms of computational efficiency, we listed commonly used methods for partitioning, and filled in the values of the corresponding variables, and then combined complexities as shown in Figure 9.
As mentioned earlier, in the K-means clustering calculation, two to five villages were grouped together. Thus, the t in the graph would not exceed 5; here, we set t = 5. In addition, the protocol C’ and protocol D’ could not be utilized independently because the partition result was singular and non-selective in algorithms. The computational complexities of electoral districting of Changhua County were explored by methods combined with these protocols.
First, the exhaustive method (method A) was used to divide, the time complexity was , and the NP-hard operation would be incomplete. Second, method B was used only, the time complexity was , and the same situation could not be recreated. Third, method C’B was simple to group and then arrange, the number of operations was , although the complexity was lower, but still could not finish. Fourth, the number of operations used in method C’D’B was . This combined method (C’D’B) was the least complex among the four methods and could be completed, but the operation time was very long. Therefore, our strategy should improve computing efficiency and save computer system resources.
4.2. Integrated Computation and Geo-Information Applications
Dividing constituencies by an exhaustive method will cause problems that cannot be solved, and then the most inappropriate results need to be filtered out, even if the system can do it. The principles of fairness and objectiveness must be followed and are required before districting. If the population between constituencies is too different, there is a lack of connectivity, or if the shape is not good, all of them must be eliminated. Instead of spending a lot of computing time exhausting the possible division results and then discarding most of the unqualified, it is better to do cluster planning in advance to save system resources. Constrained clustering is proved as an efficient computation to pursue various conflicting demands [17]. Thus, preliminary clustering could be used to reduce the complexity of subsequent partitioning.
Principles of population equalization, constituency connectivity, and complete shape were utilized; several small villages were merged into larger units through artificial intelligence to ensure that these units had fair and objective characteristics. Accordingly, when these units were subsequently arranged, there was a greater chance of producing a fair and symmetrical constituency. Therefore, our research shows that intelligent clustering could reduce the complexity of electoral districting to speed up the calculation and preemptively solve the phenomenon of gerrymandering.
Electoral districting cannot be based solely on principles, and there must be concrete implementation. The electoral districting implementation is not only for the entire administrative region but also for the needs of each region. It uses an extreme arrangement to find the most results possible within the limits of the computer’s resources. There are enough results to fulfill variability of regional optimal solutions, and also ensure the applicability of global optimal solutions. In short, we can find many solutions that can be provided to experts, scholars, political parties, or government decision-makers for different needs, and help them to solve the actual adjacency and separation problems [2].
In the application of GIS, in order to judge the accuracy of objects, a convex hull was used to highlight boundary characteristics of objects, especially in the description of three-dimensional objects [31]. In addition, many applications must interact with users through a GIS interface. We hope that our results can be modularized and become part of the GIS suite, through practical validations with theory, to promote more users to access and understand the ubiquitous application of GIS.
5. Conclusions
In order to achieve a fair representation of votes, the spatial distribution was used to reduce the partition errors of the constituency to achieve an ideal number of equivalent votes. Our study proposed a systematic method of clustering and extreme calculation, which integrated advantages of various information technologies and could quickly obtain and analyze solution sets of multiple electoral districting. This obtained better and fairer solutions than the official version, including smaller population errors and a more complete and symmetrical shape. The experimental results showed that “intelligent clustering” and “extreme arrangement” could successfully and effectively solve problems of multiple electoral districting within the limited resources of a computer. Furthermore, an objective, fair, and equitable method of electoral districting was proposed and analyzed, and more solutions were suggested for decision-makers to take into account the various needs of constituencies.
Author Contributions
Conceptualization, methodology, Ying-Che Hung and Liang-Yü Chen; software, validation, formal analysis, and investigation, Ying-Che Hung and Liang-Yü Chen; writing—original draft preparation, Ying-Che Hung and Liang-Yü Chen; writing—review and editing, Ying-Che Hung and Liang-Yü Chen; supervision, project administration, Liang-Yü Chen; funding acquisition, Ying-Che Hung and Liang-Yü Chen.
Funding
This research received no external funding.
Acknowledgments
The authors would like to thank Tang, Cheng-Yuan in Huafan University, and Hor, Maw-Kae in National Chengchi University, for their helpful advice on data exploring and result evaluation. The authors also thank Peng, Yi-Fan in Center of GIS, RCHSS, Academia Sinica (Taiwan), for his assistance in computation.
Conflicts of Interest
The authors declare no conflict of interest in this study.
References
- Ekeli, K.S. Giving a Voice to Posterity—Deliberative Democracy and Representation of Future People. J. Agric. Environ. Ethics 2005, 18, 429–450. [Google Scholar] [CrossRef]
- Kalcsics, J. Districting Problems. In Location Science; Springer: Cham, Switzerland, 2015; pp. 595–622. [Google Scholar]
- Norris, P. Choosing Electoral Systems: Proportional, Majoritarian and Mixed Systems. Int. Politi. Sci. Rev. 1997, 18, 297–312. [Google Scholar] [CrossRef]
- Levitt, J.; Wood, E.L. A Citizen’s Guide to Redistricting, 2010th ed.; Brennan Center for Justice at New York University School of Law: New York, NY, UISA, 2008. [Google Scholar]
- Berghel, H. Chasing Elbridge’s Ghost: The Digital Gerrymander. Computer 2016, 49, 91–95. [Google Scholar] [CrossRef]
- Harris, C.C. A scientific method of districting. Behav. Sci. 1964, 9, 219–225. [Google Scholar] [CrossRef] [PubMed]
- Duque, J.C.; Ramos, R.; Suriñach, J. Supervised Regionalization Methods: A Survey. Int. Reg. Sci. Rev. 2007, 30, 195–220. [Google Scholar] [CrossRef] [Green Version]
- Hess, S.W.; Weaver, J.B.; Siegfeldt, H.J.; Whelan, J.N.; Zitlau, P.A. Nonpartisan Political Redistricting by Computer. Oper. Res. 1965, 13, 998–1006. [Google Scholar] [CrossRef]
- Kaiser, H.F. A Measure of the Population Quality of Legislative Apportionment. Am. Political Sci. Rev. 1968, 62, 208–215. [Google Scholar] [CrossRef]
- Marcinkiewicz, K. The Economy or an Urban–Rural Divide? Explaining Spatial Patterns of Voting Behaviour in Poland. East Eur. Politics Soc. 2017, 32, 693–719. [Google Scholar] [CrossRef]
- Legislative Yuan (R.O.C.). Civil Servants Election and Recall Act; Legislative Yuan (R.O.C.): Taipei, Taiwan, 2016. [Google Scholar]
- Kovács, Z.; Vida, G. Geography of the new electoral system and changing voting patterns in Hungary. Acta Geobalc. 2015, 1, 10. [Google Scholar] [CrossRef]
- Balinski, M. Fair majority voting (or how to eliminate gerrymandering). Am. Math. Mon. 2008, 115, 97–113. [Google Scholar] [CrossRef]
- Novaes, A.G.N.; de Curst, J.E.S.; da Silva, A.C.L.; Souza, J.C. Solving continuous location-districting problems with Voronoi diagrams. Comput. Oper. Res. 2009, 36, 40–59. [Google Scholar] [CrossRef]
- Ricca, F.; Scozzari, A.; Simeone, B. Weighted Voronoi region algorithms for political districting. Math. Comput. Model. 2008, 48, 1468–1477. [Google Scholar] [CrossRef] [Green Version]
- Fryer, R.G.; Holden, R. Measuring the Compactness of Political Districting Plans. J. Law Econ. 2011, 54, 493–535. [Google Scholar] [CrossRef] [Green Version]
- Brieden, A.; Gritzmann, P.; Klernm, F. Constrained clustering via diagrams: A unified theory and its application to electoral district design. Eur. J. Oper. Res. 2017, 263, 18–34. [Google Scholar] [CrossRef]
- Central Election Commission (R.O.C.). Electoral Districting Rules for the Seventh Legislator Elections; Central Election Commission (R.O.C.): Taipei, Taiwan, 2005. [Google Scholar]
- Ji, X.; Mitchell, J.E. Branch-and-price-and-cut on the clique partitioning problem with minimum clique size requirement. Discret. Optim. 2007, 4, 87–102. [Google Scholar] [CrossRef] [Green Version]
- Aurenhammer, F.; Hoffmann, F.; Aronov, B. Minkowski-type theorems and least-squares clustering. Algorithmica 1998, 20, 61–76. [Google Scholar] [CrossRef]
- Aronov, B.; Carmi, P.; Katz, M.J. Minimum-Cost Load-Balancing Partitions. Algorithmica 2009, 54, 318–336. [Google Scholar] [CrossRef]
- Hojati, M. Optimal political districting. Comput. Oper. Res. 1996, 23, 1147–1161. [Google Scholar] [CrossRef]
- Hung, Y.-C.; Chen, P.; Chen, L.-Y. Advanced Classification of Coffee Beans with Fatty Acids Profiling to Block Information Loss. Symmetry 2018, 10, 529. [Google Scholar] [CrossRef]
- Wong, K.; Javanmardi, E.; Javanmardi, M.; Kamijo, S. Estimating Autonomous Vehicle Localization Error Using 2D Geographic Information. ISPRS Int. J. Geo-Inf. 2019, 8, 288. [Google Scholar] [CrossRef]
- Carlsson, J.G.; Carlsson, E.; Devulapalli, R. Shadow Prices in Territory Division. Netw. Spat. Econ. 2016, 16, 893–931. [Google Scholar] [CrossRef]
- Prieto, L.M.; Flacke, J.; Aguero-Valverde, J.; Van Maarseveen, M. Measuring Inequality of Opportunity in Access to Quality Basic Education: A Case Study in Florida, US. ISPRS Int. J. Geo-Inf. 2018, 7, 465. [Google Scholar] [CrossRef]
- Ilijazi, V.; Milic, N.; Milidragovic, D.; Popovic, B. An Assessment of Police Officers’ Perception of Hotspots: What Can Be Done to Improve Officer’s Situational Awareness? ISPRS Int. J. Geo-Inf. 2019, 8, 260. [Google Scholar] [CrossRef]
- Tarjan, R. Depth-first search and linear graph algorithms. In Proceedings of the 12th Annual Symposium on Switching and Automata Theory (swat 1971), East Lansing, MI, USA, 13–15 October 1971; pp. 114–121. [Google Scholar] [CrossRef]
- Brodal, G.S.; Jacob, R. Dynamic planar convex hull with optimal query time and O(log n center dot log log n) update time. Algorithm Theory Swat 2000 2000, 1851, 57–70. [Google Scholar] [CrossRef]
- Cohen-Addad, V.; Klein, P.N.; Young, N.E. Balanced centroidal power diagrams for redistricting. In Proceedings of the 26th ACM SIGSPATIAL International Conference on Advances in Geographic Information Systems, Seattle, WA, USA, 6–9 November 2018; pp. 389–396. [Google Scholar] [CrossRef]
- Kalinina, D.; Ingilevich, V.; Lantseva, A.; Ivanov, S. Computing concave hull with closed curve smoothing: Performance, concaveness measure and applications. Procedia Comput. Sci. 2018, 136, 479–488. [Google Scholar] [CrossRef]
Figure 1.
Impact of different districting in (a) vertical, or (b) horizontal. White circles and black crosses are independent basic voting units and represent the different party favors, respectively.
Figure 1.
Impact of different districting in (a) vertical, or (b) horizontal. White circles and black crosses are independent basic voting units and represent the different party favors, respectively.

Figure 2.
Smallest units of the administrative district are grouped with a sociological idea.

Figure 3.
System architecture of computing and mechanism is integrated for electoral districting.

Figure 4.
Use of K-means clustering set a group into a symmetric matrix.

Figure 5.
Use of computational geometry to divide the matrix into equal parts.

Figure 6.
Administrative map of Changhua County: (a) Townships, and (b) villages, and the higher the population of the villages, the darker the shade.
Figure 6.
Administrative map of Changhua County: (a) Townships, and (b) villages, and the higher the population of the villages, the darker the shade.

Figure 7.
Electoral districting and relevant information revealed from the official version.

Figure 8.
Some partition cases obtained from computation. Corresponding to the serial number on the map, they are labeled as S1, S2, S3, and S4.
Figure 8.
Some partition cases obtained from computation. Corresponding to the serial number on the map, they are labeled as S1, S2, S3, and S4.

Figure 9.
Experimental complexities of individual and combined methods used in this study.


Table 1.
Administrative zones information (area unit: km2) of Changhua County.
| Township | Villages | Population | Area | Township | Villages | Population | Area |
|---|---|---|---|---|---|---|---|
| Changhua | 73 | 234,308 | 65.77 | Fenyuan | 15 | 25,968 | 38.25 |
| Yuanlin | 41 | 127,042 | 39.38 | Dacun | 16 | 36,137 | 30.46 |
| Lukang | 29 | 84,767 | 69.44 | Puyan | 22 | 35,061 | 39.04 |
| Hemei | 31 | 88,245 | 38.22 | Puxin | 20 | 35,082 | 20.98 |
| Beidou | 15 | 33,505 | 19.78 | Yongjing | 24 | 40,115 | 20.32 |
| Xihu | 25 | 56,356 | 31.05 | Shetou | 24 | 45,591 | 35.88 |
| Tianzhong | 22 | 45,722 | 34.43 | Ershui | 17 | 17,705 | 35.57 |
| Erlin | 27 | 56,449 | 92.21 | Tianwei | 20 | 29,384 | 24.68 |
| Xianxi | 8 | 17,010 | 21.33 | Pitou | 17 | 32,316 | 42.45 |
| Shengang | 14 | 35,179 | 29.33 | Fangyua | 26 | 37,980 | 98.20 |
| Fuxing | 22 | 48,607 | 51.21 | Dachen | 15 | 20,063 | 65.19 |
| Xiushui | 14 | 38,431 | 29.07 | Zhutang | 14 | 16,819 | 41.89 |
| Huatan | 18 | 46,336 | 35.95 | Xizho | 19 | 32,584 | 69.25 |
| Total Villages: | 588 | Total Population: | 1,316,762 | ||||
| Average Population of Constituency: 329,191 | |||||||
Table 2.
Effects of the threshold of population error ratio (PER) and convexity on solutions obtained from computing.
Table 2.
Effects of the threshold of population error ratio (PER) and convexity on solutions obtained from computing.
| Limits of PER (%) | Limits of Convexity (%) | ||||
|---|---|---|---|---|---|
| Unlimited | 50 | 60 | 70 | 80 | |
| 1 | 966 | 767 | 438 | 37 | 0 |
| 2 | 1741 | 1165 | 698 | 59 | 0 |
| 5 | 27,380 | 24,921 | 7599 | 288 | 0 |
| 10 | 403,692 | 367,322 | 142,960 | 11,415 | 0 |
| 15 | 678,678 | 500,198 | 262,285 | 51,976 | 0 |
© 2019 by the authors. Licensee MDPI, Basel, Switzerland. This article is an open access article distributed under the terms and conditions of the Creative Commons Attribution (CC BY) license (http://creativecommons.org/licenses/by/4.0/).
Share and Cite
MDPI and ACS Style
Hung, Y.-C.; Chen, L.-Y. Using Intelligent Clustering to Implement Geometric Computation for Electoral Districting. ISPRS Int. J. Geo-Inf. 2019, 8, 369. https://doi.org/10.3390/ijgi8090369
AMA Style
Hung Y-C, Chen L-Y. Using Intelligent Clustering to Implement Geometric Computation for Electoral Districting. ISPRS International Journal of Geo-Information. 2019; 8(9):369. https://doi.org/10.3390/ijgi8090369
Chicago/Turabian StyleHung, Ying-Che, and Liang-Yü Chen. 2019. "Using Intelligent Clustering to Implement Geometric Computation for Electoral Districting" ISPRS International Journal of Geo-Information 8, no. 9: 369. https://doi.org/10.3390/ijgi8090369
Note that from the first issue of 2016, this journal uses article numbers instead of page numbers. See further details here.