The present section describes both data sources for diachronic reconstruction—historical and geometrical, the methodology followed to obtain the 4D modeling; and finally, the considerations related to the 4D viewer implementation.
2.1. Historical Sources
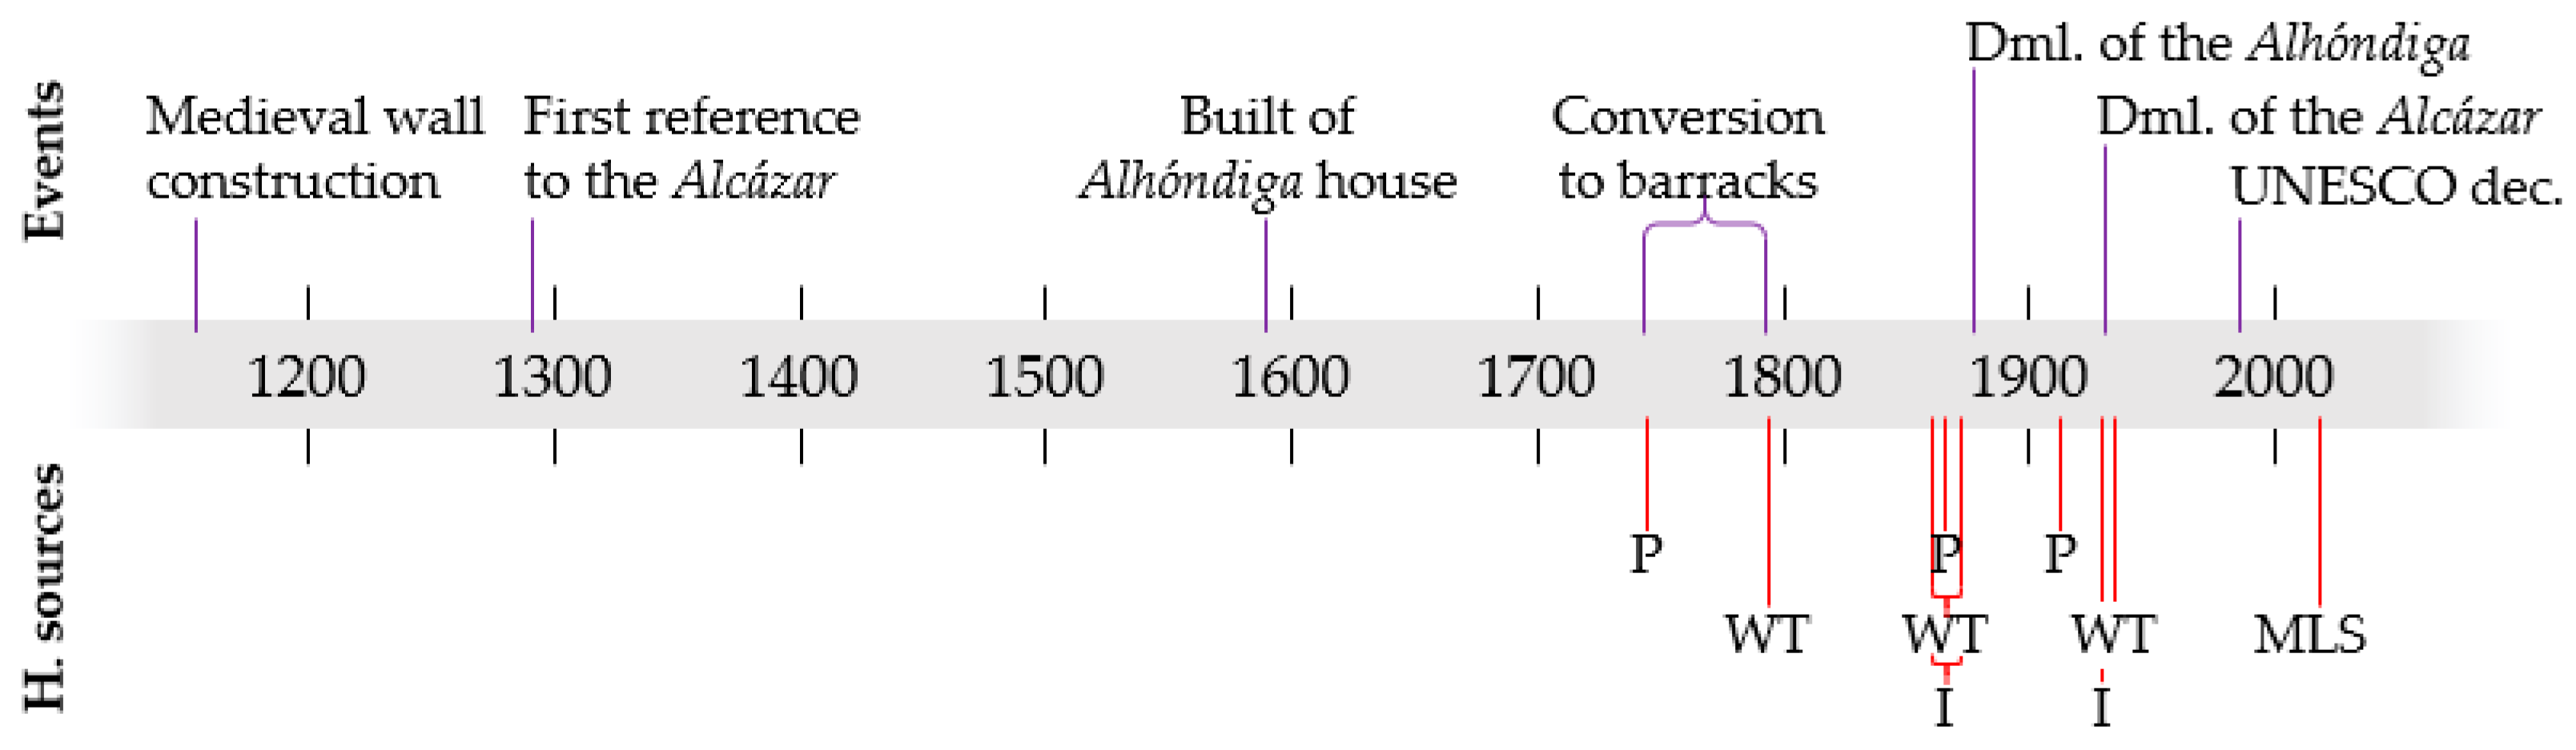
In this subsection, a description of the different historical sources that were used is presented. Through these sources, the CH transformations through time, including the evolution of the uses of the space and urban changes, are identified. To put this in context,
Figure 1 shows a simplified timeline of the historical evolution of the study case (see
Section 3.1 for further details), and the sources that were employed.
The Medieval Wall of Ávila has had different uses through its history. Most of them were related to defensive purposes. From c. 1291, a citadel (or
Álcazar in Spanish) was built inside and attached to the southeast corner of the wall enclosure. Through its life, the citadel and near buildings suffered from several changes of use, as shown in
Figure 1. It is likely that the demolishment of the citadel in 1930 was the largest transformation.
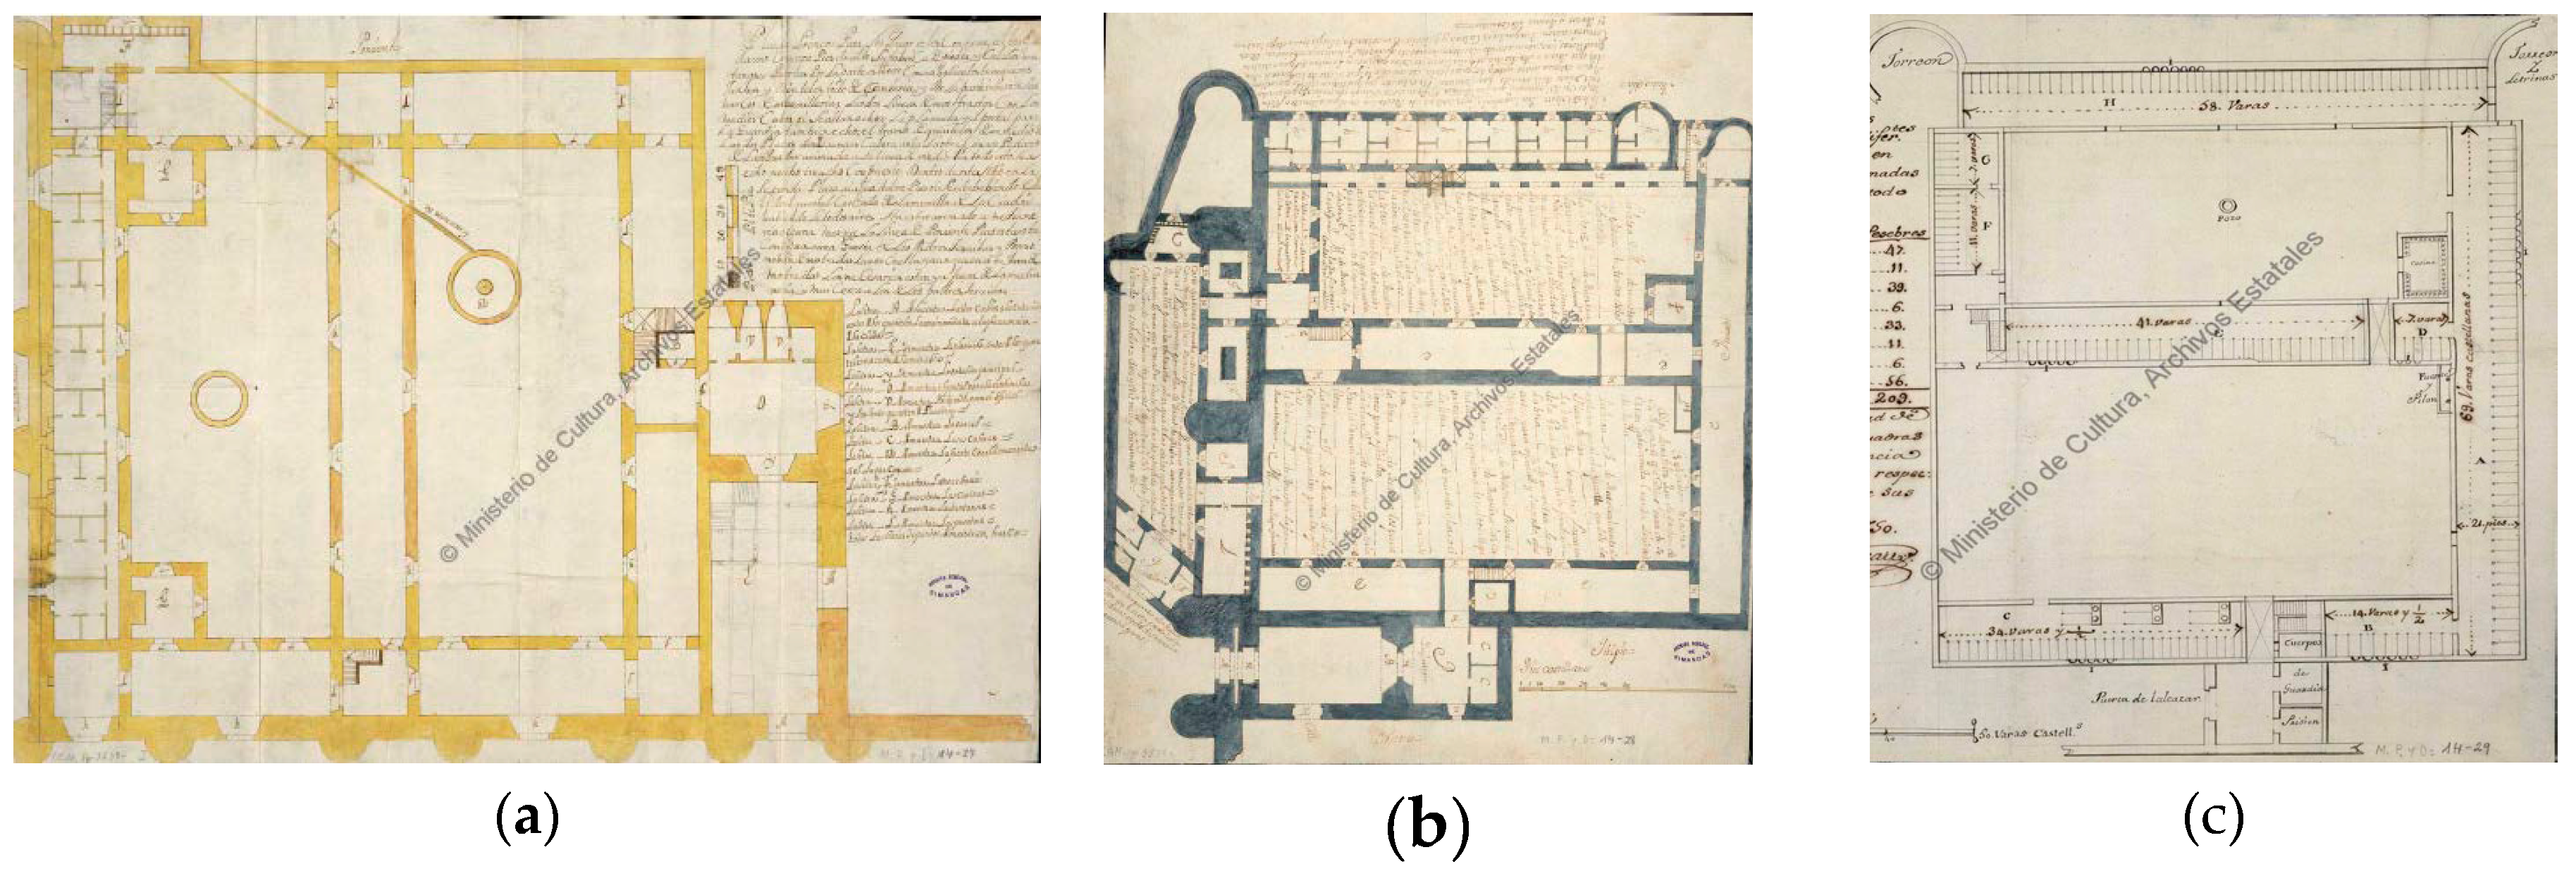
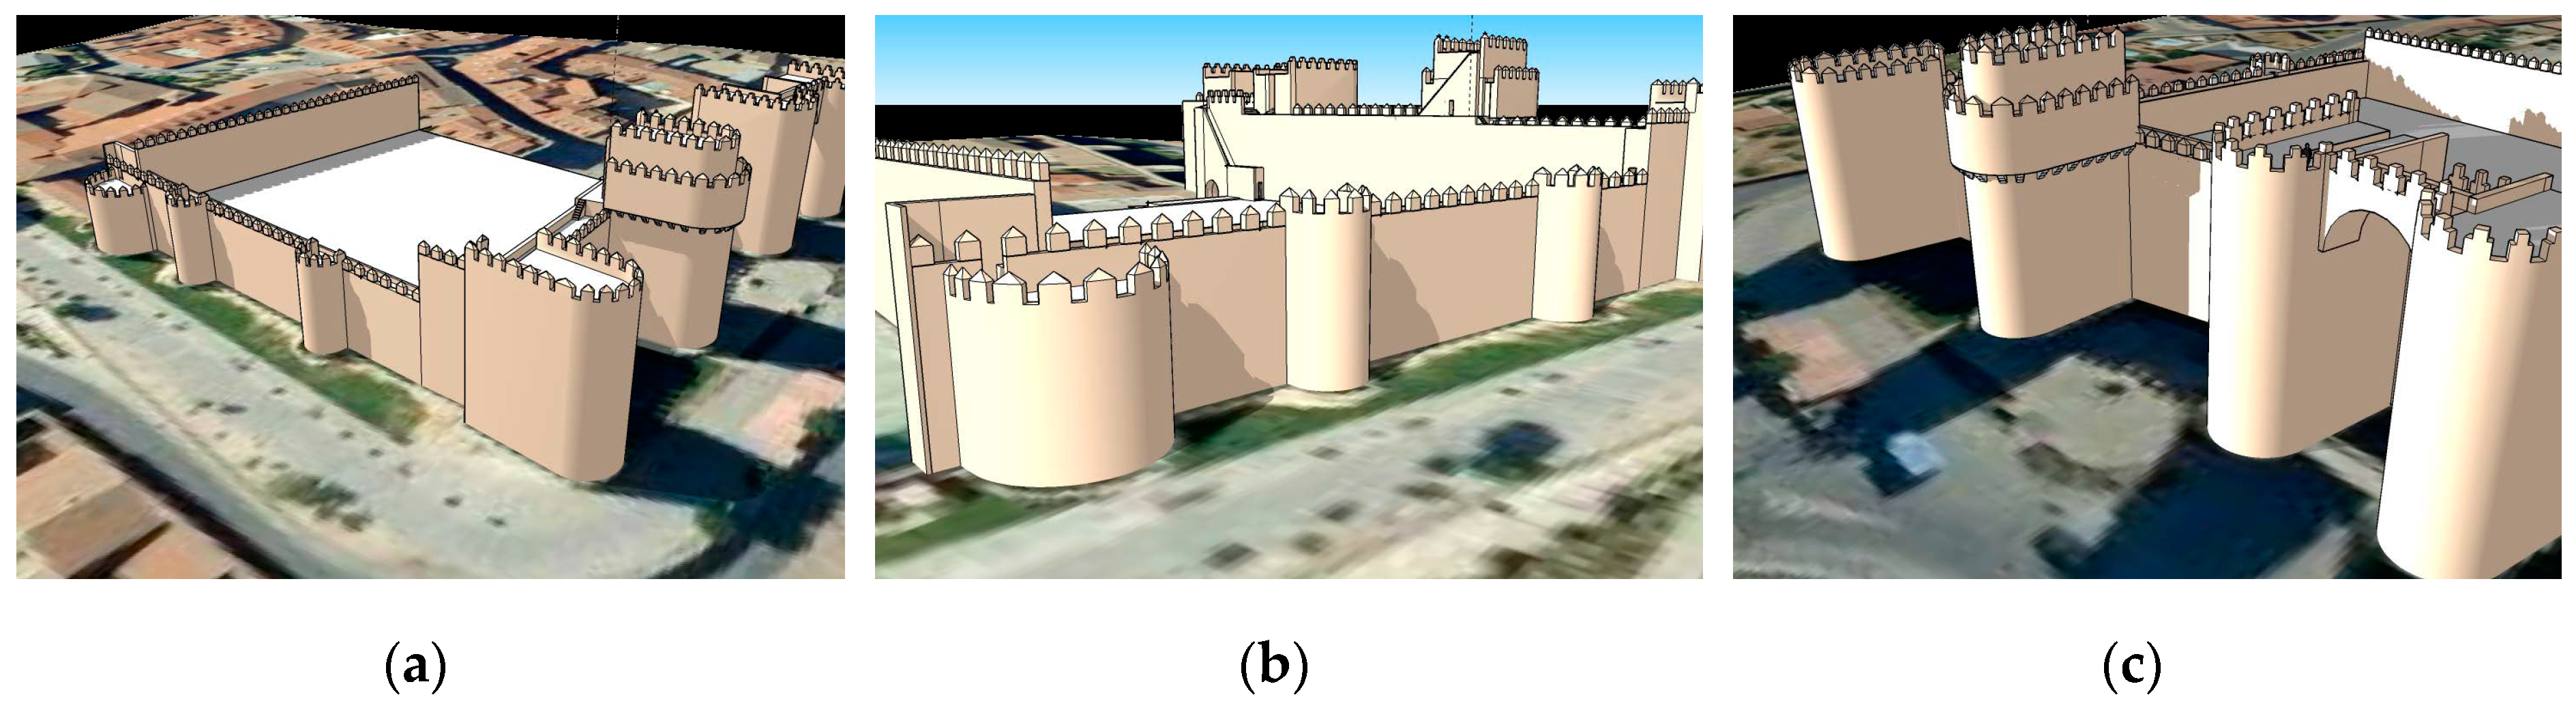
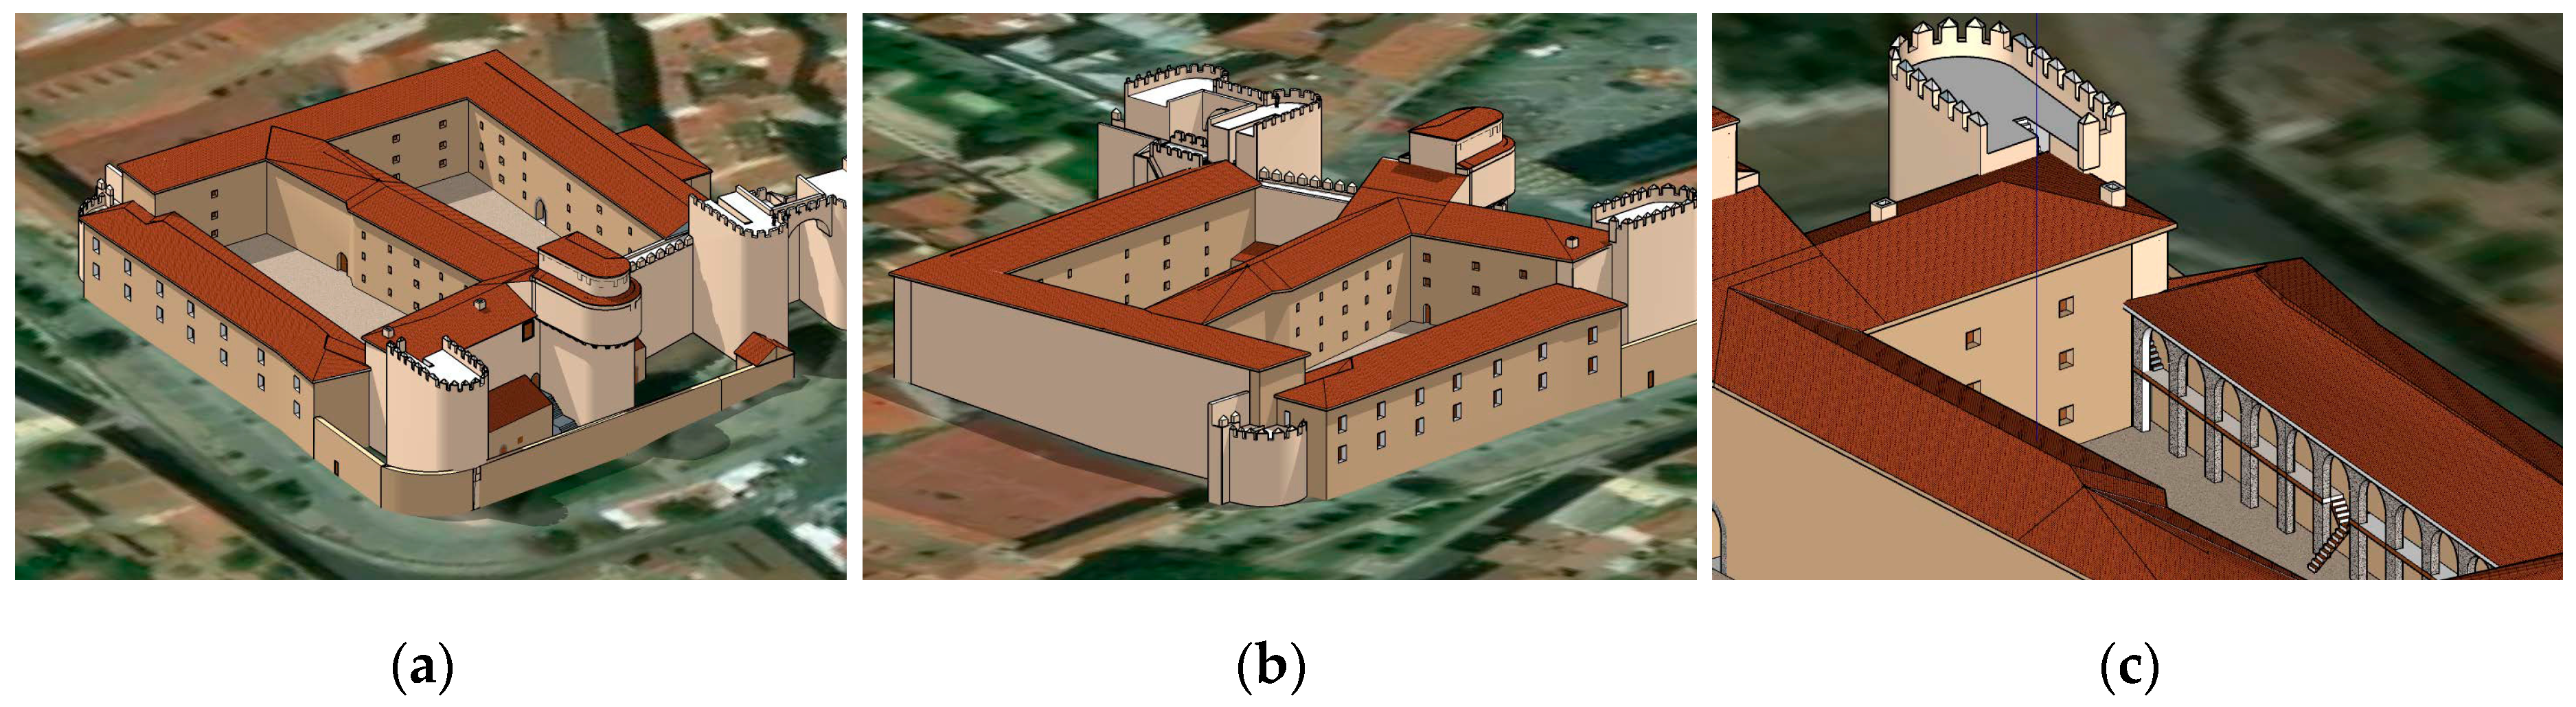
The most reliable historical sources of the citadel or
Alcázar gate of Ávila were referred to in the plans made by Juan Gómez Parral in 1749 (
Figure 2a,b), and in the plan of Pedro Moreau of 1750 (
Figure 2c) related to the works of the conversion of the citadel into barracks. According to the information provided by these plans, a new plan design was built inside for the barracks with masonry arches. Also, a courtyard and a guard portal were created, as well as bedrooms and a gallery. We must highlight the opening of windows and the construction of an officers’ gallery. This latter room is of great importance since, as a consequence, two towers belonging to the
Alcázar were demolished on the south canvas, and the height was reduced in six rows of the
Polvorín tower. The
Alcázar was again in a ruinous state according to a report dated in 1780, and the reforms that were carried out in 1806 and 1813 did not solve the serious problem of deterioration. From this moment, the 19th and 20th centuries lead to the total destruction of the
Alcázar (1930).
Additionally, for the diachronic reconstruction assessment, two documents were used, despite their simplicity: a longitudinal profile of the street entrance to the Alcázar square, coming from the municipal architect Angel Cossín in 1864 (Ref. 134–53/27), and the plan made by the municipal architect Emilio González in 1911 (Ref. AHPAv. Ayto. 00070028).
Among all of the data sources that were used for the diachronic reconstruction, the best are those based on ancient drawings, which can provide a large amount of suitable information. However, their reliability is typically unknown. These documents present great contradictions among them, as well as with reality, especially the ones dated from the 18th century.
Other types of historical documents that were employed and analyzed included:
Historical photographs.
Maps.
Written testimonies.
The knowledge coming from these sources was added and weighted in the analysis by means of constraints regarding the buildings materials, constructive techniques, and geometric shape and boundary of those buildings that do not currently exist.
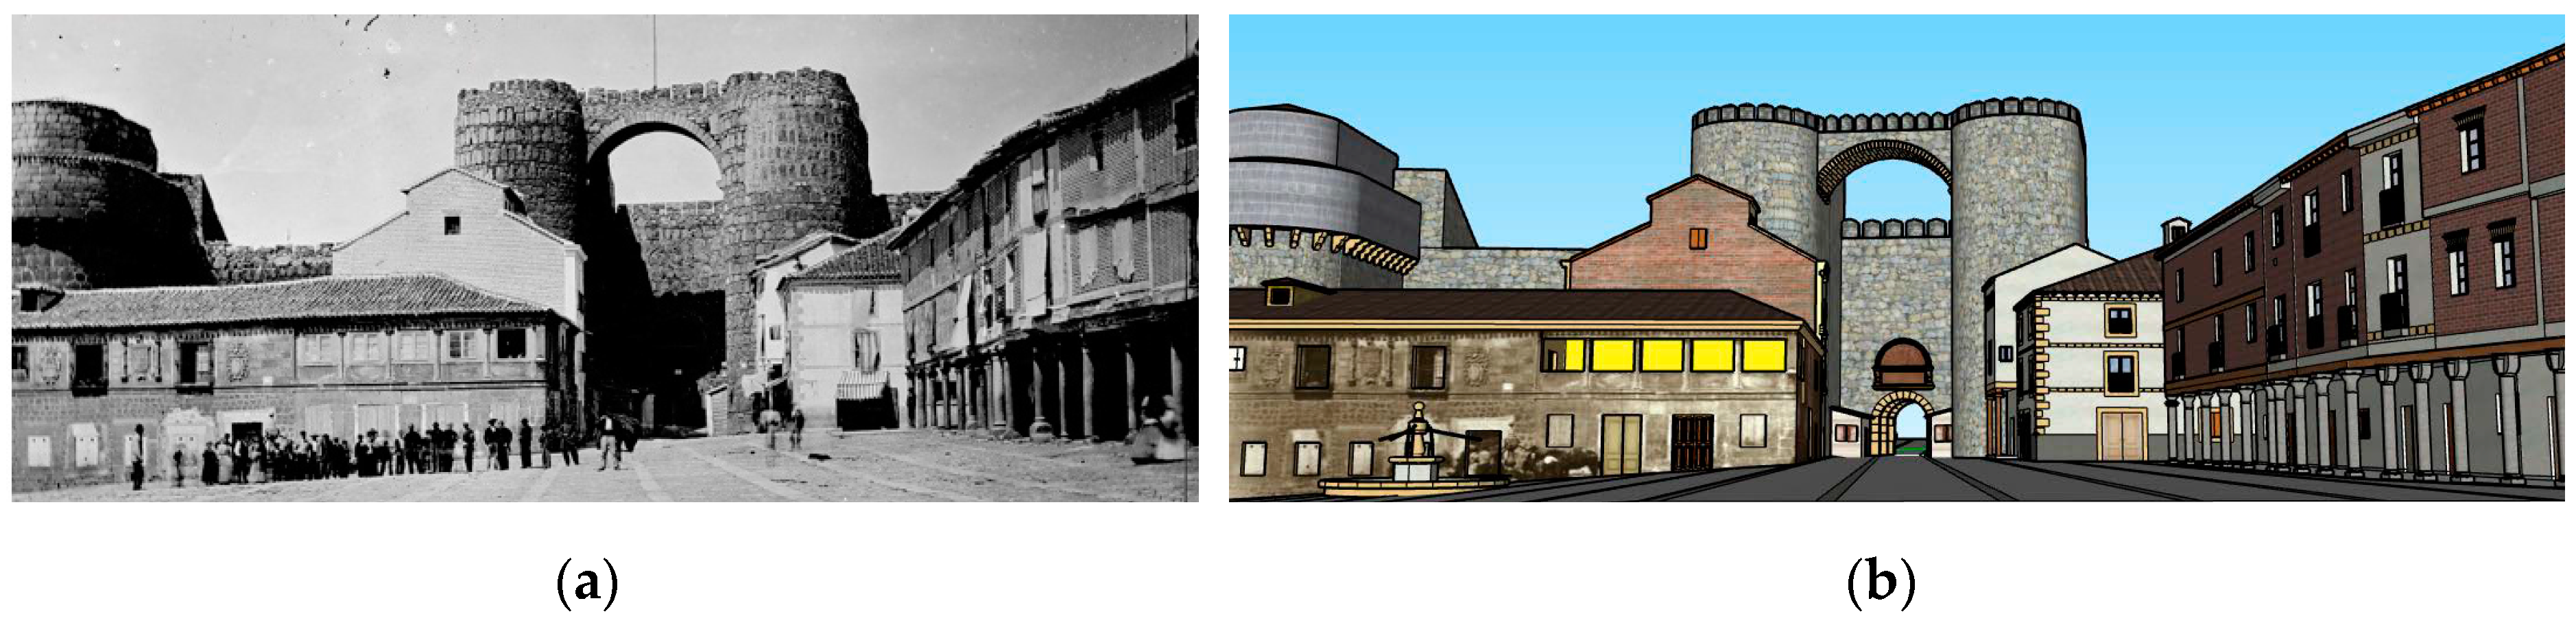
The role played by the different data sources depends on their antiquity, since intrinsic inconsistencies were shown, especially further back in time. In the case of the graphical material, old photographs are the most reliable, although they only cover a small temporal interval. These historical photographs used to be oblique, and thus enable the single-view reconstruction approach developed by [
24,
25], being able to extract geometric proportions, and even a partial reconstruction depending on the geometry of the shot.
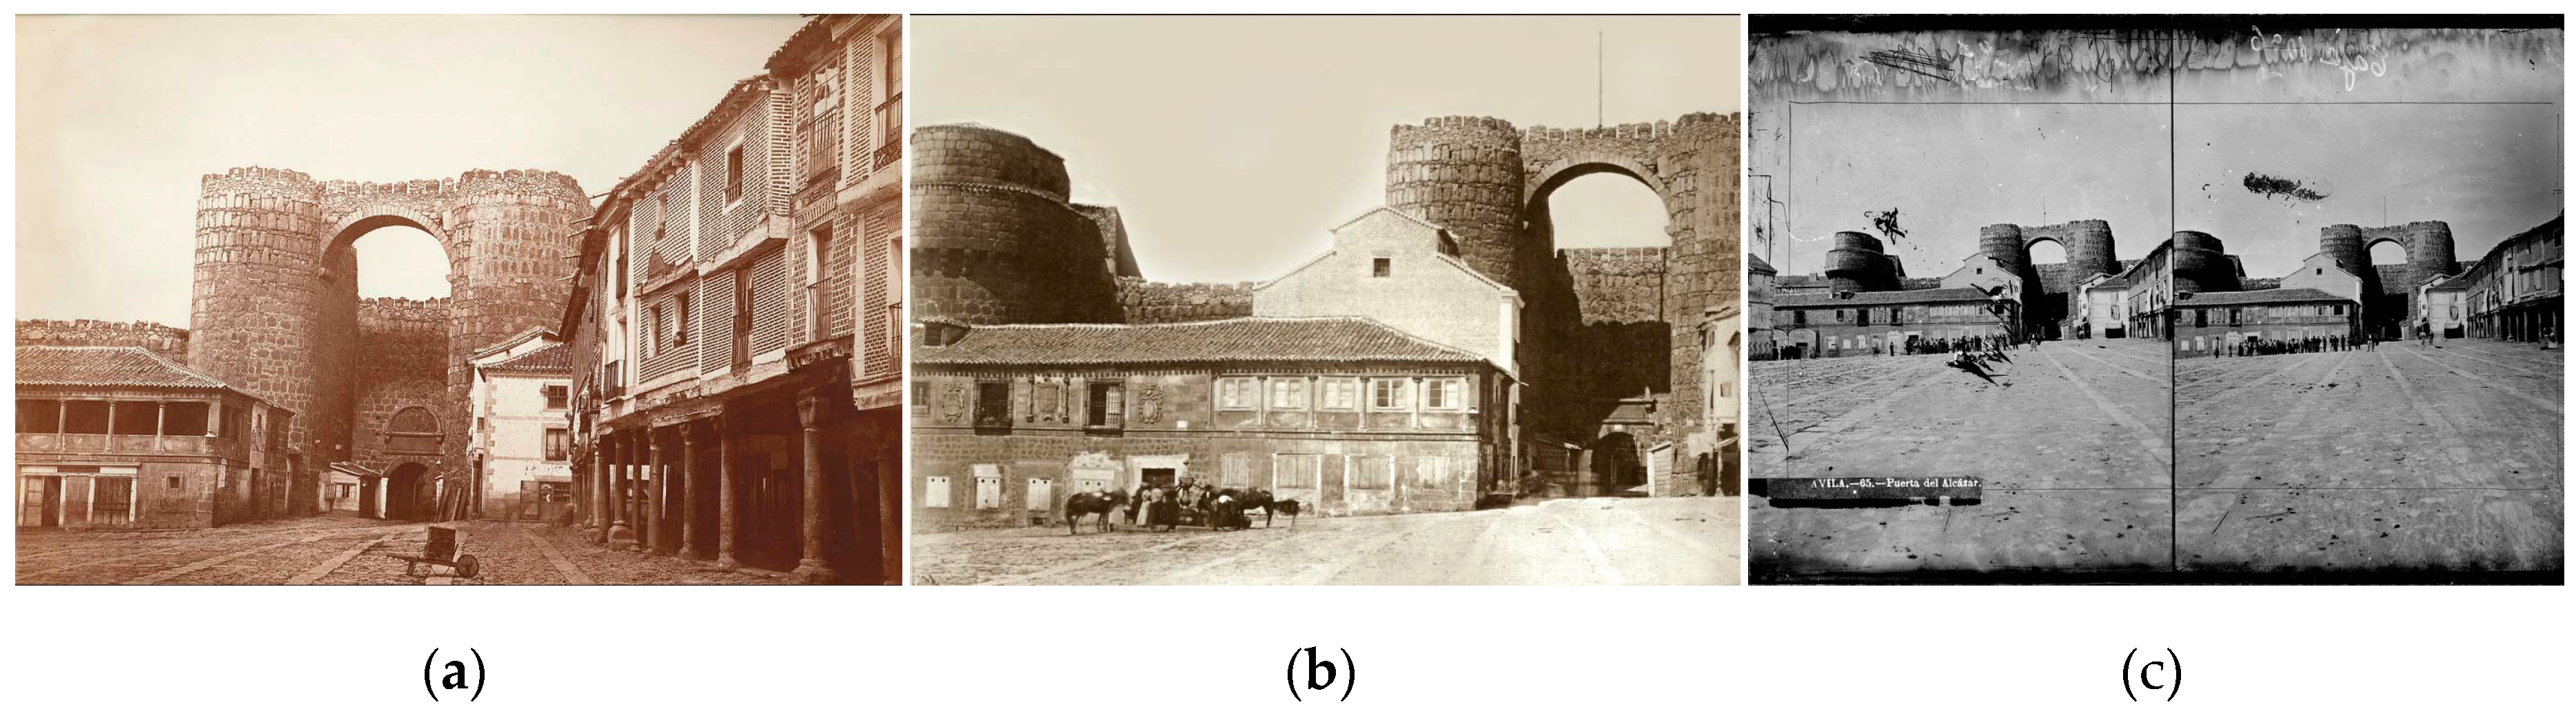
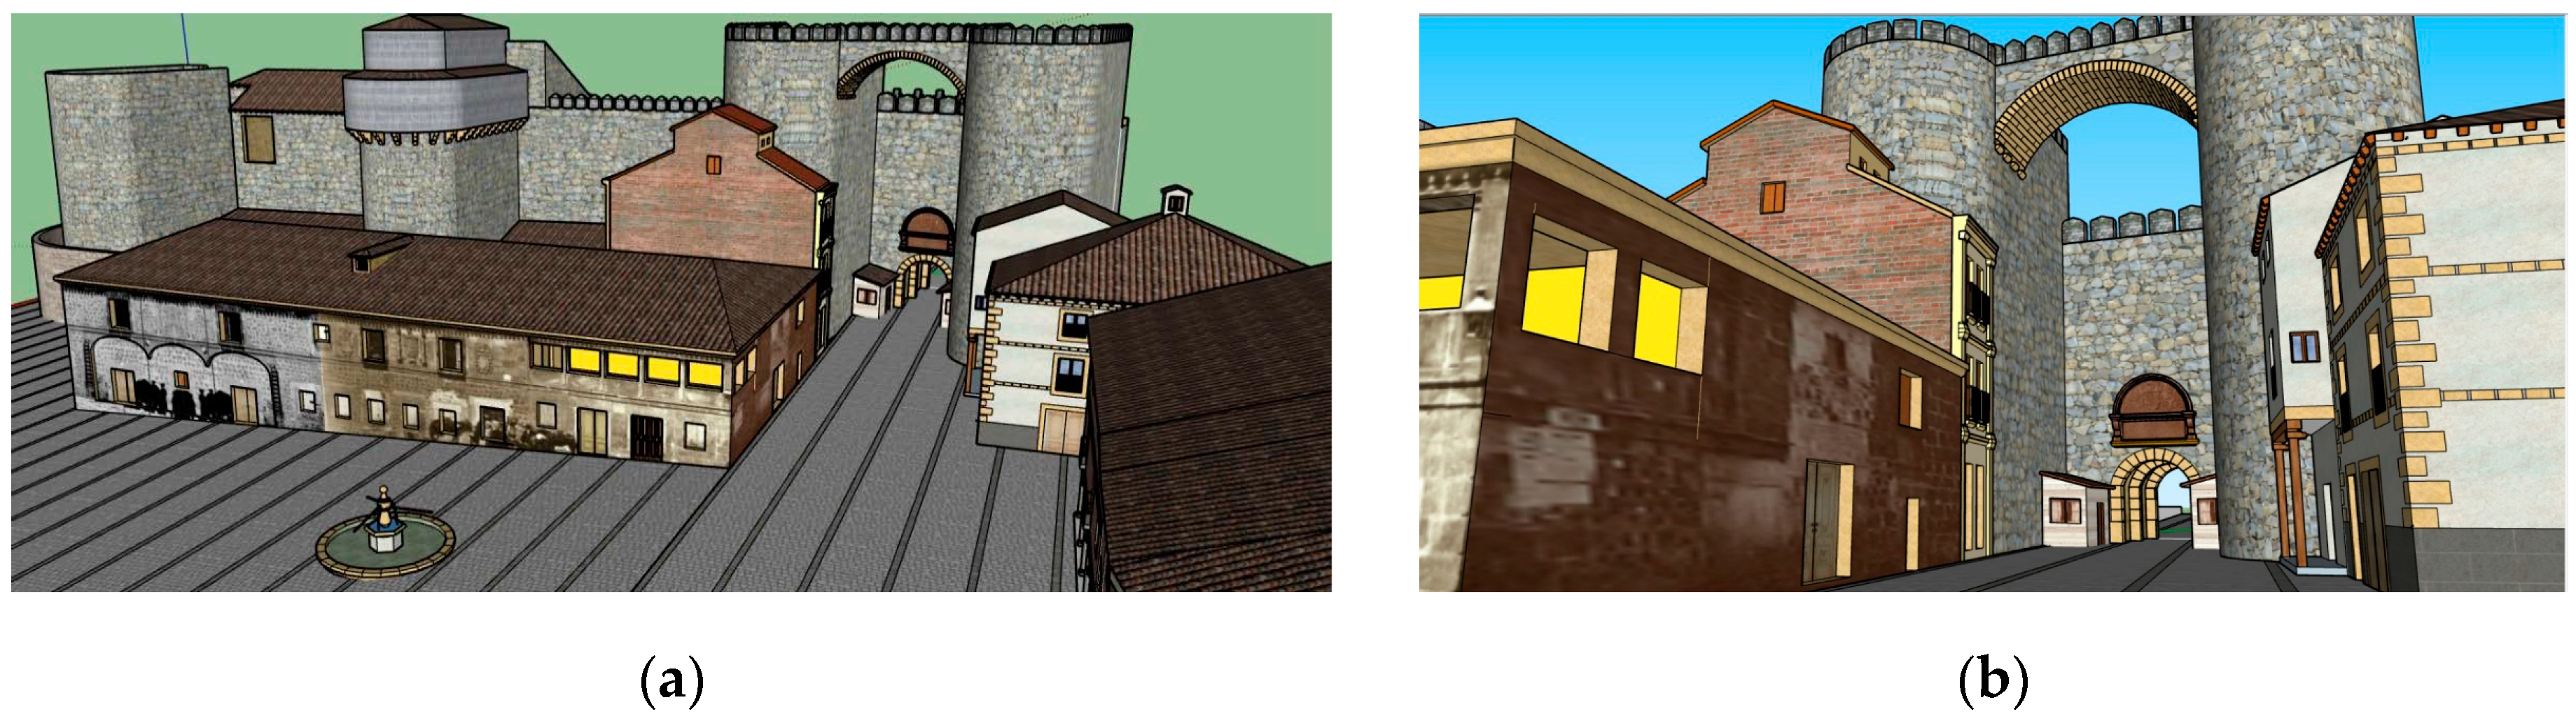
A total of three individual old images from c. 1860–1870 were considered (
Figure 3). They cover a temporal keyframe, where some extramural buildings were modified. They played a key role along with the plans, since they provided objective information, in spite of the lack of scale or another direct information metric. There is no available information about the accuracy of these images.
The other graphical source was a city plan from c. 1865, whose use in the project is marginal. Its low resolution, due to the small scale (around 1:10,000), has limited the accurate location of the surroundings of extramural buildings, e.g., the circular fountain. As in the previous source, there is no available information about the accuracy of this source.
Finally, the written testimonies, which cover a temporal framework from c. 1860 to 1870, and an isolated one from c. 1935, describe the geometry of the citadel, the defensive system, or the transformation suffered by the asset. In spite of being non-graphical, they were used as a constraint source when there was not graphical information available, or there were discrepancies between the graphical information, the constructive hypothesis, and/or the current remains.
2.2. Geomatics Techniques
Geomatics techniques and technologies have long played an important role in CH documentation and preservation [
26,
27,
28,
29]. They range from red–green–blue (RGB) and multispectral cameras to terrestrial laser scanners (TLS), airborne laser scanners (ALS), drones [
30], and even mobile laser systems (MLS) [
31]. Due to the nature of the study case (see
Section 3.1), which is placed in an urban center, and its significant extension, the MLS is employed as a data source for recording the present state of the current remains. The suitability of MLS for the documentation and dissemination of CH is described in [
32,
33]. The technical specifications of the employed MLS are listed in
Table 1. This system is composed of two light detection and ranging (LiDAR) sensors, four RGB cameras, and an Applanix POS LV 520 Inertial Navigation System (INS). The system is configured to take 500,000 points per second with a scan frequency of 200 Hz. The maximum range of the sensors is 200 m, with a precision of eight mm (one sigma) and permission to obtain up to four echoes of the signal and the intensity reflected by the objects at a 1550-nm wavelength. The MLS was boarded in a car, achieving speeds of up to 40 km/h in the data acquisition.
The MLS measurement process is not completely straightforward, and the final results will be constrained by the initial planning phase. MLS calibration uncertainty is directly propagated to the recorded object, which could cause a lack of overlapping between scans of the same scene acquired from different trajectories. The completeness of the final scenario is directly linked with the complexity of the CH site, which is usually high, as well as where the vehicle is allowed to go. Regarding the final precision, the dependence of MLS on the GNSS (Global Navigation Satellite System) signal will cause a precision degradation in scenarios with weak satellite geometry, such as narrow streets in the case of urban CH assets [
32]. Besides, the precision of the acquired point cloud is related to the laser angle of incidence [
34]. All of these issues imply a constant control of the scanning process and a rigorous planning phase. An alternative geomatic technique, the portable mobile mapping systems [
35,
36], will dismiss some of the previously mentioned constraints (such as completion and GNSS dependence).
2.3. 4D Reconstruction Methodology
According to [
10], when planning a 3D documentation of a heritage object, it is necessary to observe the data fusion requirements, the scene/object characteristics, and the availability of the equipment and sensors. The main requirements for data fusion are: accuracy level, radiometry importance, documentation purpose, and final use of the 3D products. The accuracy level enables ensuring that accuracy and details are preserved when mixing several data. A recommended approach is based on considering the geometric resolution differences among datasets, defining several accuracy levels, and adapting the level of information of each artefact to its acquisition methodology. However, in the present case study, the datasets that were employed not only have different spatial resolution, but some of them have unknown specifications. So, it was not possible to apply the proposed data fusion pipeline. As a result, the final application of the 4D model was used as a main constraint to providing a diachronic model with a high degree of reliability.
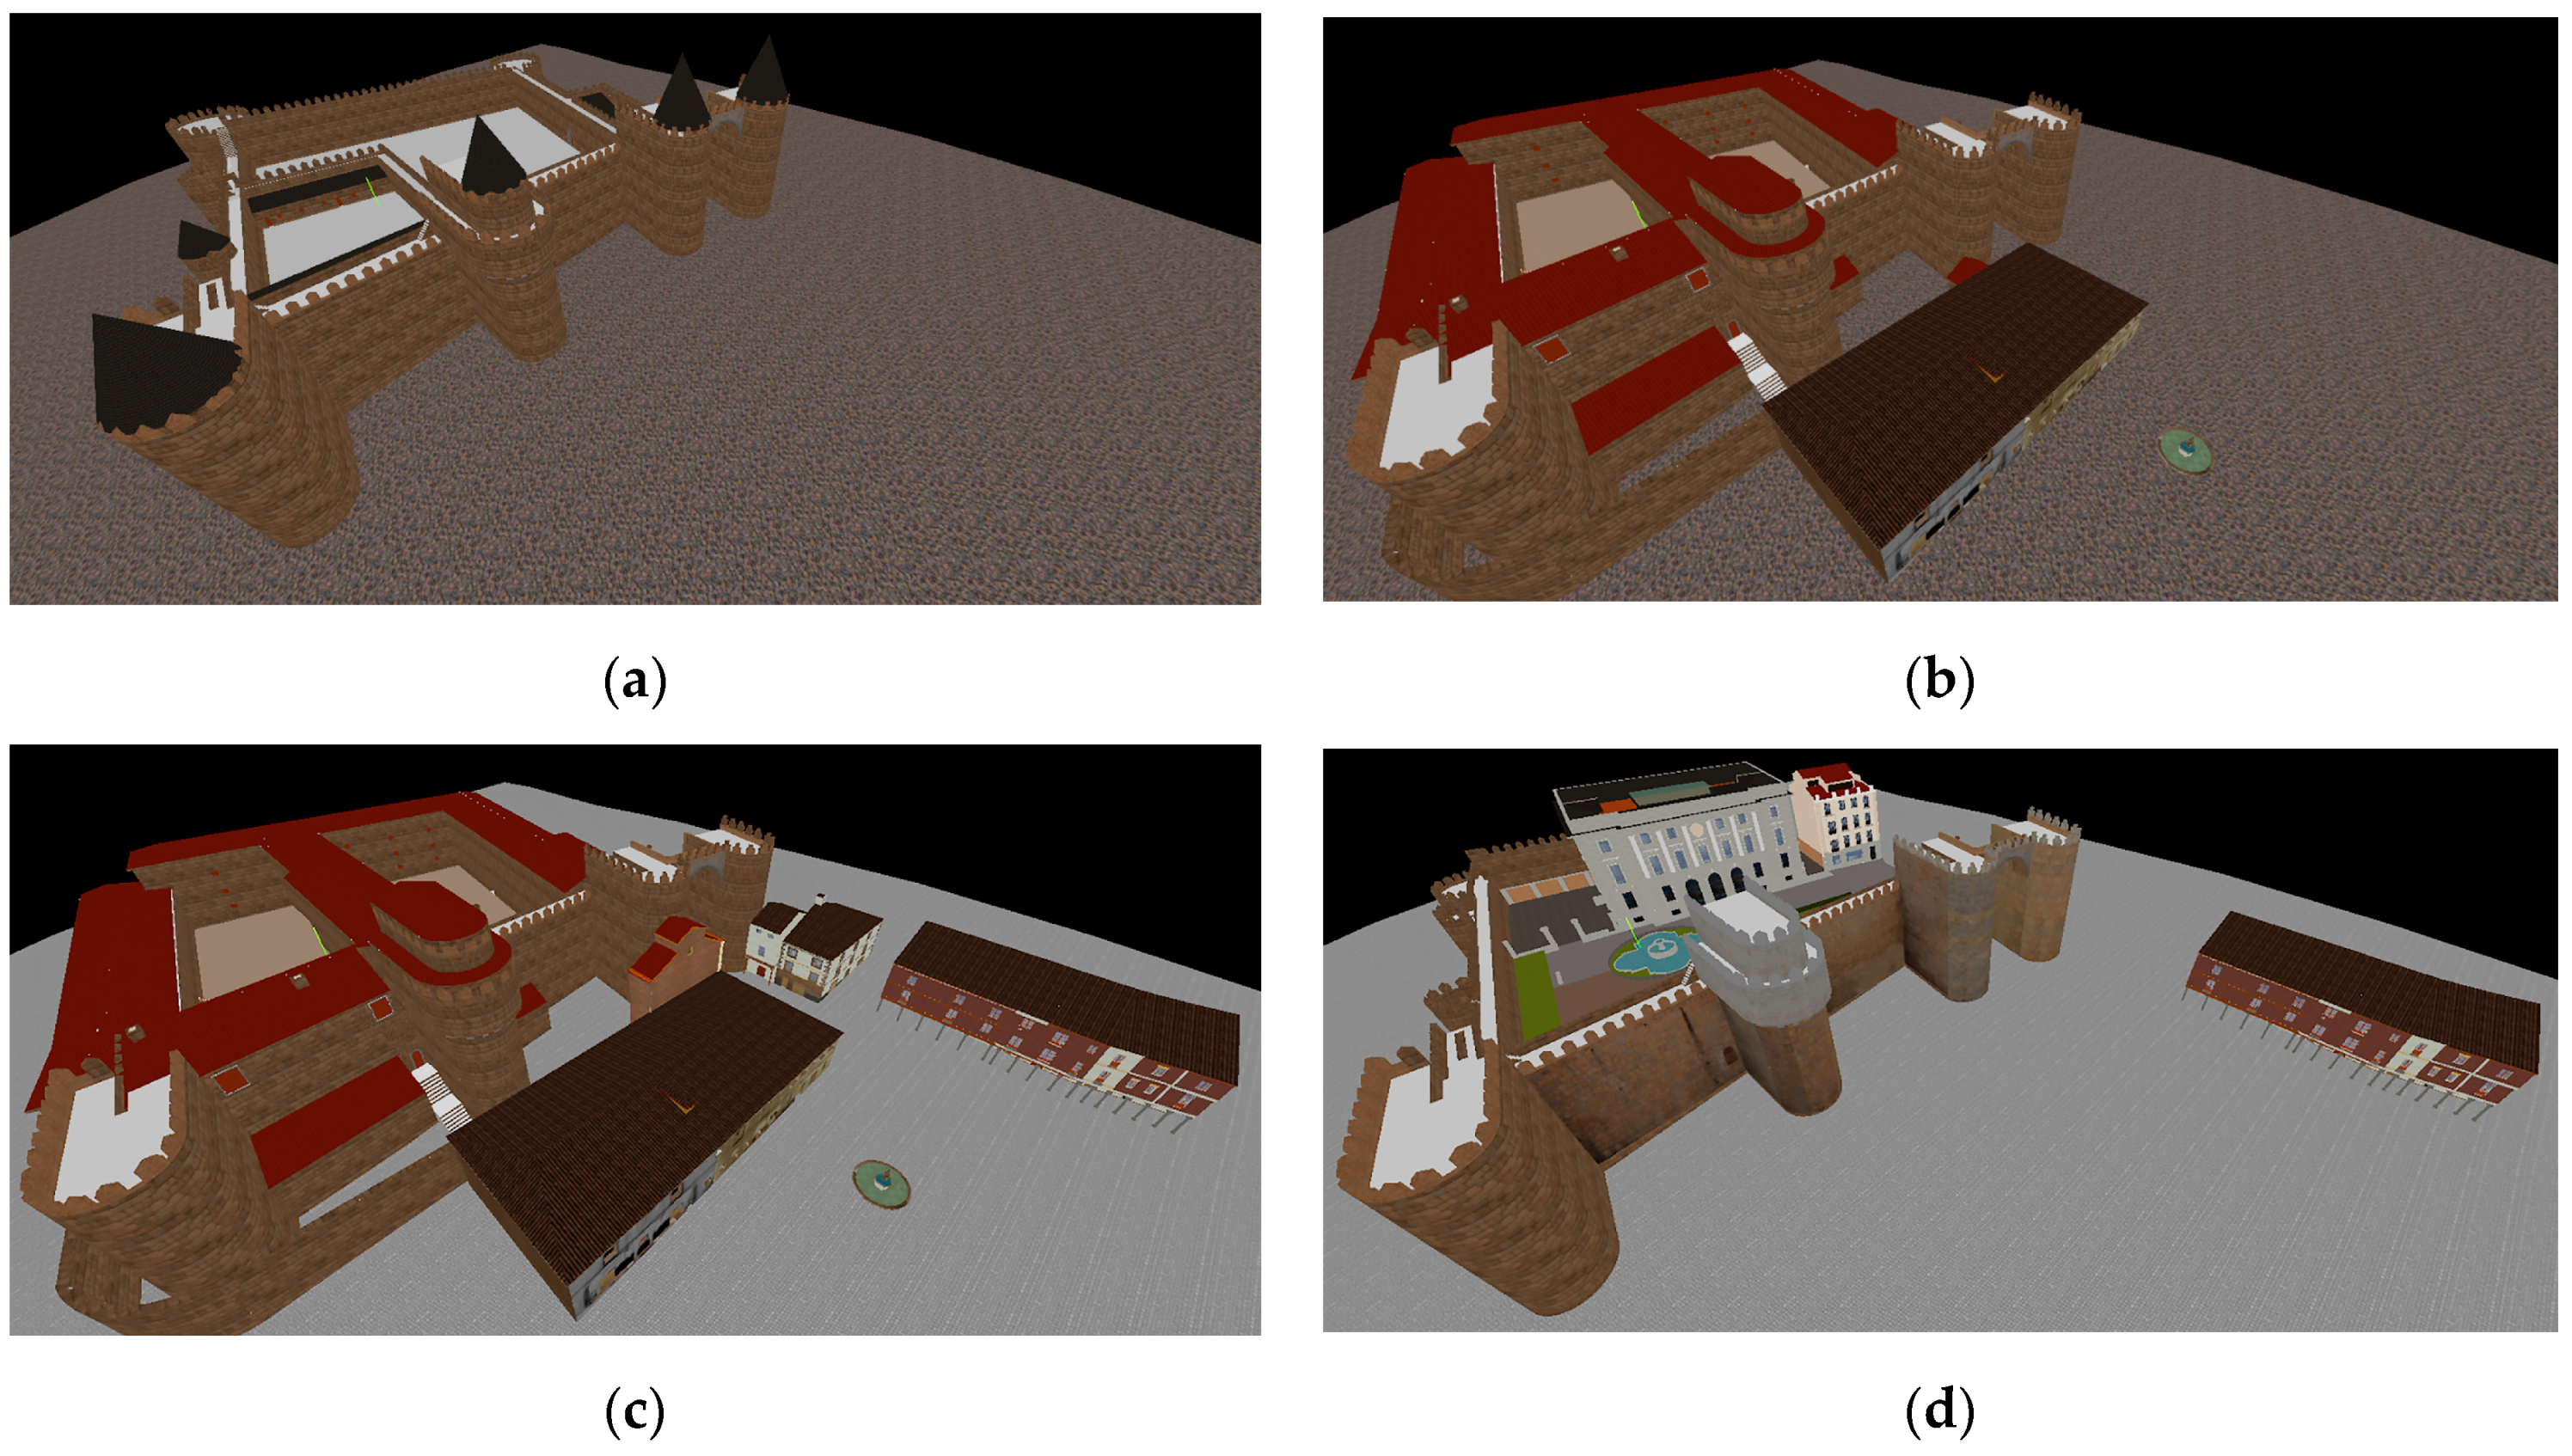
From the different geometrical and historical data sources stated previously, the reconstruction process was divided in the following steps:
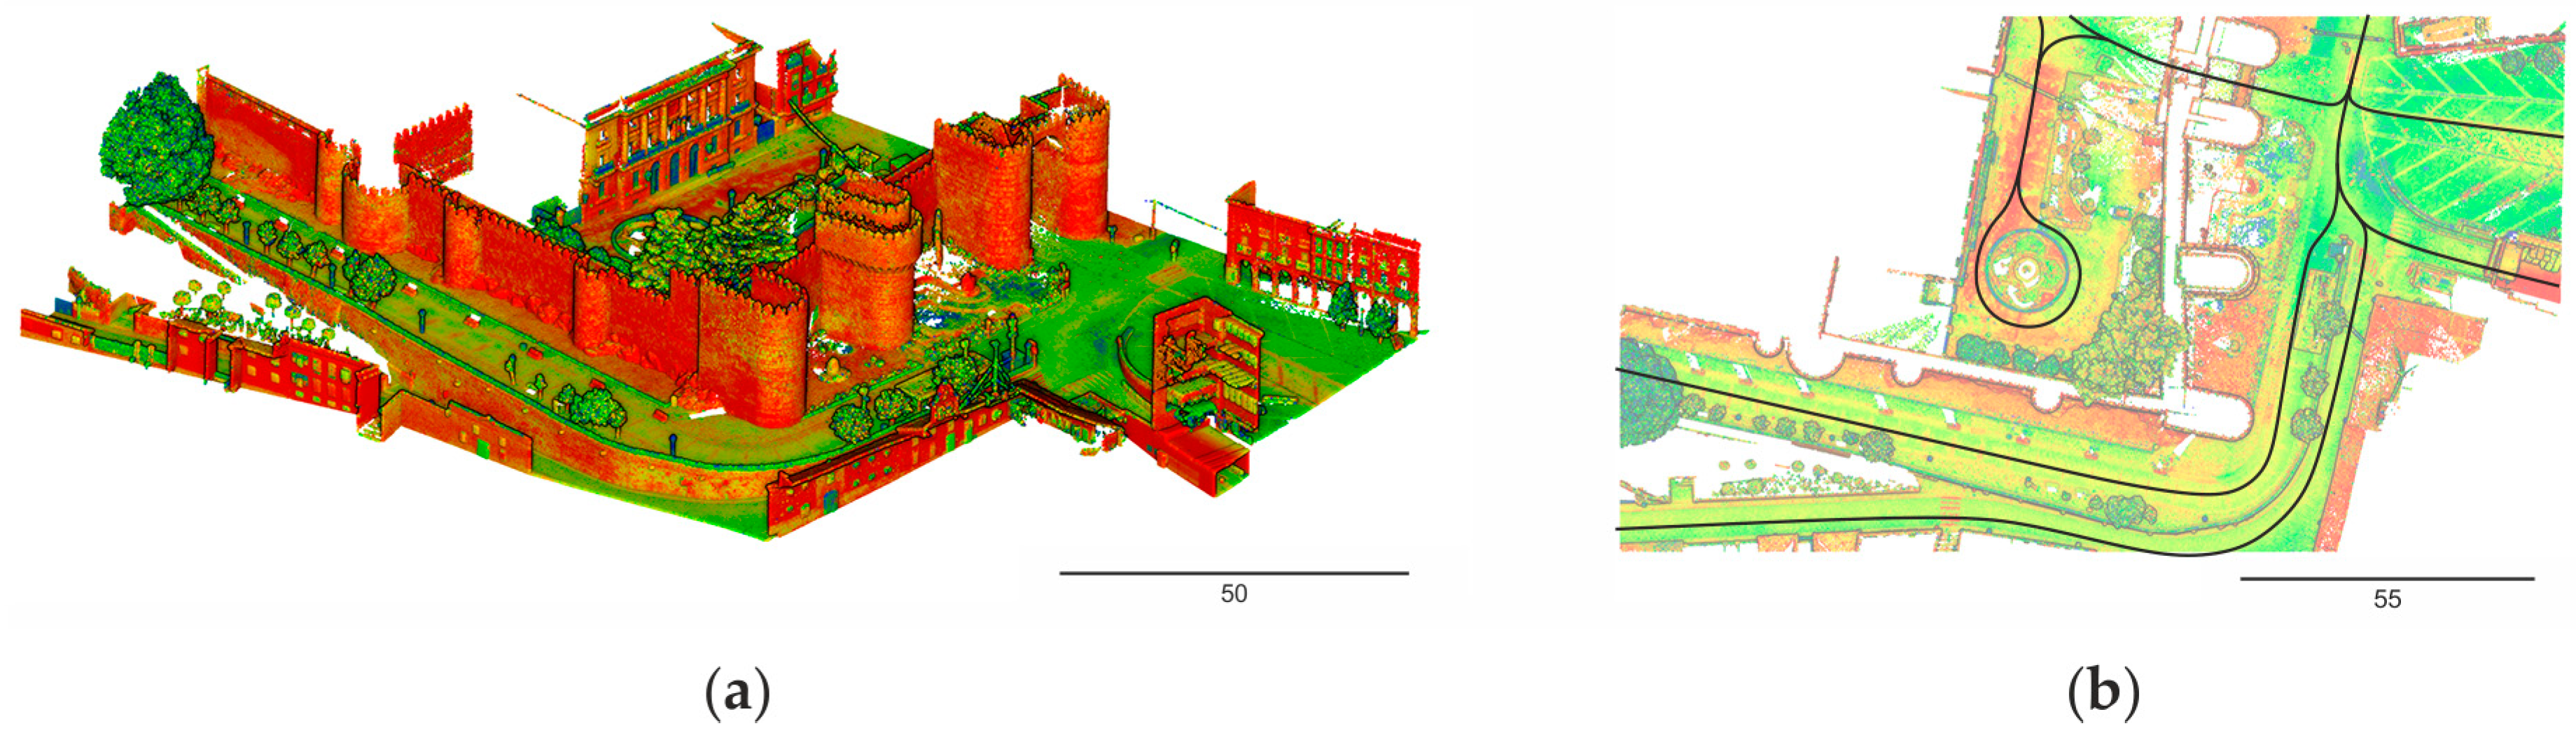
3D recording of the current remains of the Alcázar gate by means of a MLS.
Reverse modeling of the current state of the Alcázar gate and its intramural and extramural sections.
Diachronic reconstruction or 4D modeling of the Alcázar gate based on the historical documents for two different temporal intervals.
Diachronic reconstruction or 4D modeling of the extramural and intramural buildings of the Alcázar gate prior to their demolishment.
Obtaining a 3D recording of the current state by MLS requires an initial planning phase, where not only the aimed spatial resolution and average distance to the study object (constrained by the transit area) is set, but also the trajectory and GNSS availability, since the precision properties are highly dependent on them. Finally, details such as the scanning day and hour will condition the completeness, since this CH asset is located in a heavily trafficked area.
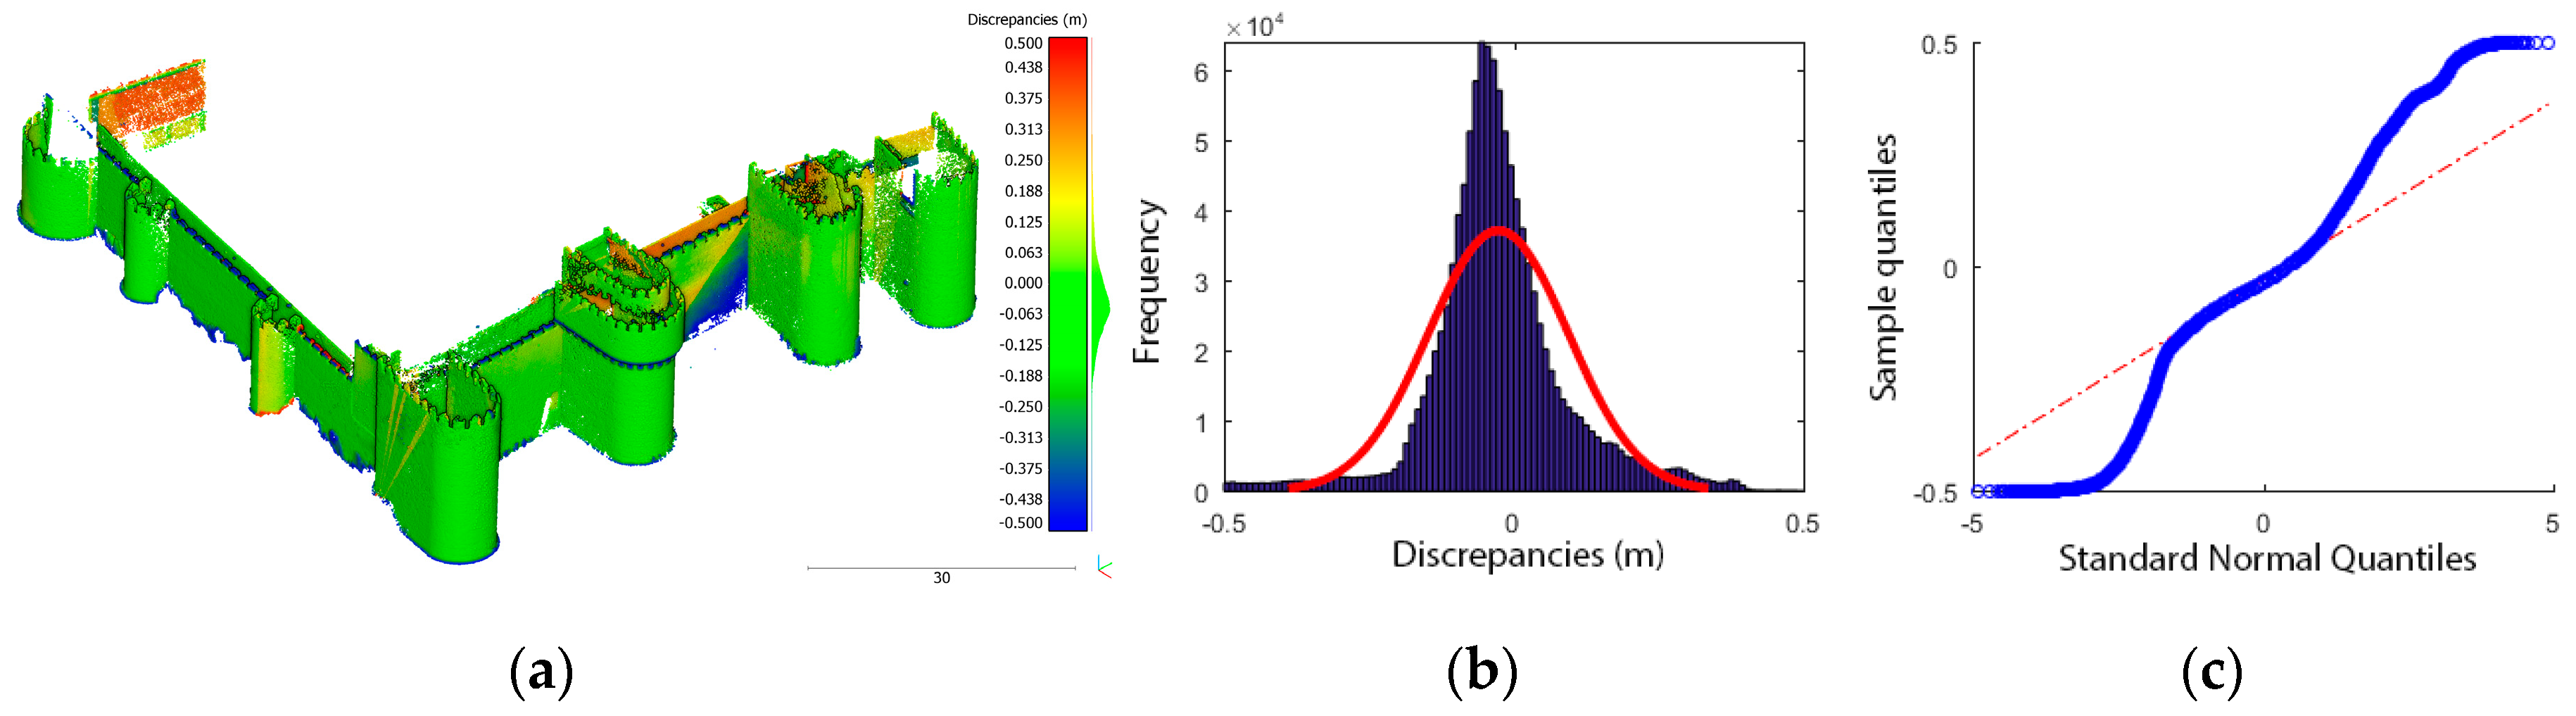
The reconstruction of the current state will provide the basis for the anastylosis process, and will also be essential to anchoring the plausible reconstruction of the lost building elements. This first phase required the classical steps of 3D modeling: filtering the non-desirable elements of the point cloud (e.g., pedestrians, cars, etc.) and extracting the geometrical data of the study area. The extraction of the basic primitives was done on the basis of cross-sections. This process involves a generalization operation and a loss of accuracy due to the idealization of regular shapes (i.e., planes, cylinders, etc.) [
37]. The addition of certain constraints, such as the parallelism of the façades with the plumb line, also contributed to idealization and a loss of reliability. The fidelity of the 3D reconstruction is addressed more deeply in
Section 3.4. For an in-depth description of the methodological procedure and a description of the different phases of multi-source data integration, please refer to [
38].
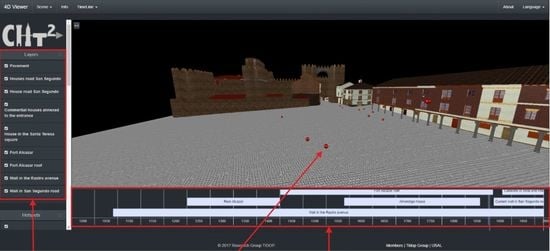
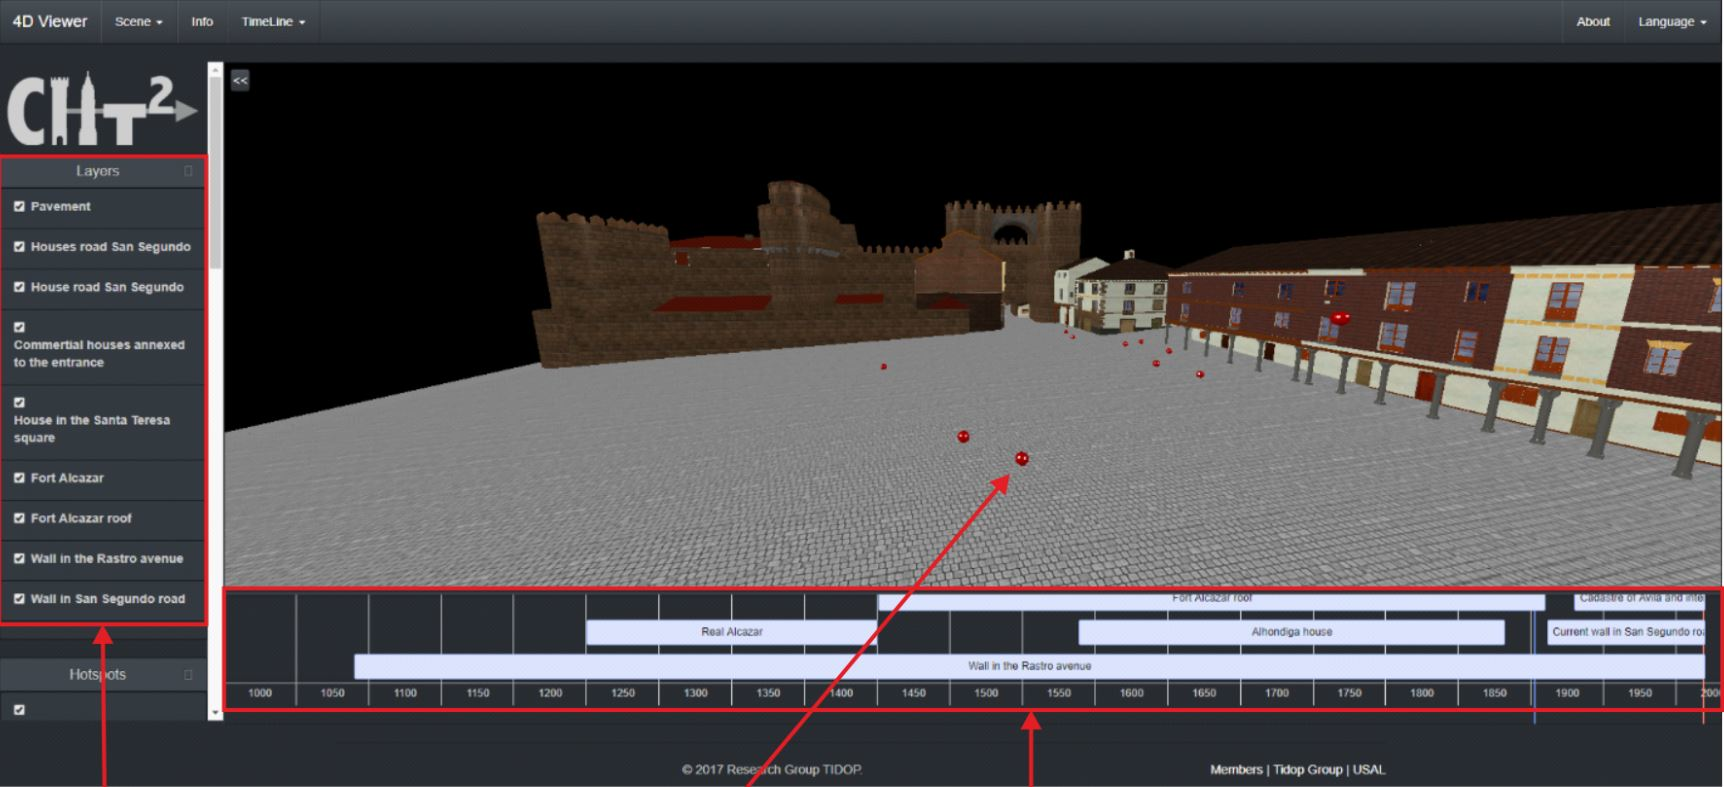
2.4. 4D Visualization Methodology
Visualization and analysis use to be the final steps in geomatics. The management of different information sources, such as stratigraphic and mensiochronologic analysis or diachronic reconstructions, among others, require the design of specific solutions to allow a metric and quality approach to the scientific analysis of the CH assets/sites, improving the benefits of an ordinary visualization [
39]. The integration of 3D models in a timeline or a 4D environment requires the development of an ad hoc software for visualizing and managing large digital datasets in real-time. With the development of the JavaScript API Web Graphics Library (WebGL), Beaverton, OR, USA, the possibility of visualizing and consulting 3D models through the use of a web browser has opened new possibilities in CH [
40].
Under this basis, there are several open-source 3D web viewers that are able to deal with complex 3D environments. Inside this group, it is possible to highlight the viewer 3DHOP (3D Heritage Online Presenter) developed by the Visual Computing Lab of ISTI-CNR (Information Science and Technologies of the Italian National Research Council) [
41]. This viewer, which is based on the WebGL engine, is able to deal with 3D models by means of meshes that are loaded following a multiresolution approach. This viewer is highlighted due to its easy combination with other web-page tools, allowing the integration of layers or even the linking of information through the use of hotspots [
41]. In this framework, the comparison between two models is done by means of integrated links. Another interesting open-source solution for rendering complex 3D scenarios is the framework that Potree developed by the Institute of Computer Graphics and Algorithms [
42]. This tool, based on the WebGL technology, enables rendering point clouds through the use of an octree visualization system [
42]. Potree is highlighted due to its capacity for loading large point clouds datasets, making measurements (i.e., distances, areas, and volumes), and including annotations (hotspots). In line with the 3DHOP tool, Potree provides the possibility of comparing several models through the use of integrated links. Within commercial software, it is worth mentioning ArcGis CityEngine [
43]. This tool is specially designed for urban purposes, accepting the simultaneous comparison of two 3D models made in different epochs (i.e., the evolution of a city through time) using a scrollbar. However, none of these platforms allow a 4D navigation where the user can navigate through a timeline and dynamically consult the 3D appearance of an architectural scenario over time.
Four-dimensional data visualization can be stated as the logical evolution of 3D dataset visualization in which time-varying visual products can be achieved. This evolution can be explained because time aspects become increasingly important in different application fields, whether analyzing or visualizing temporal changes due to anthropic activities, or simply mapping the deterioration caused by the passage of time. The advantages that 4D visualization offer are [
38]: (i) a non-destructive way for archaeologists, art historians, and other scholars to analyze and monitor CH sites, monuments, and objects through time; (ii) the user’s interaction with objects and information from the past to the present; and (iii) the possibility of building complex virtual scenarios with digitally reconstructed non-existent artefacts within their contextual background, to recreate either a real area or a non-existent environment based on a conceptual hypothesis, where the user can navigate in an interactive way.
Four-dimensional (4D) viewer implementation requires the initial task of requirements analysis; this has been grouped into functionals and non-functionals analyses, which define the specific system behavior and the criteria to judge the system operation, respectively. The functional requirements that are defined are:
It must be possible to visualize data in a three-dimensional environment in known file formats.
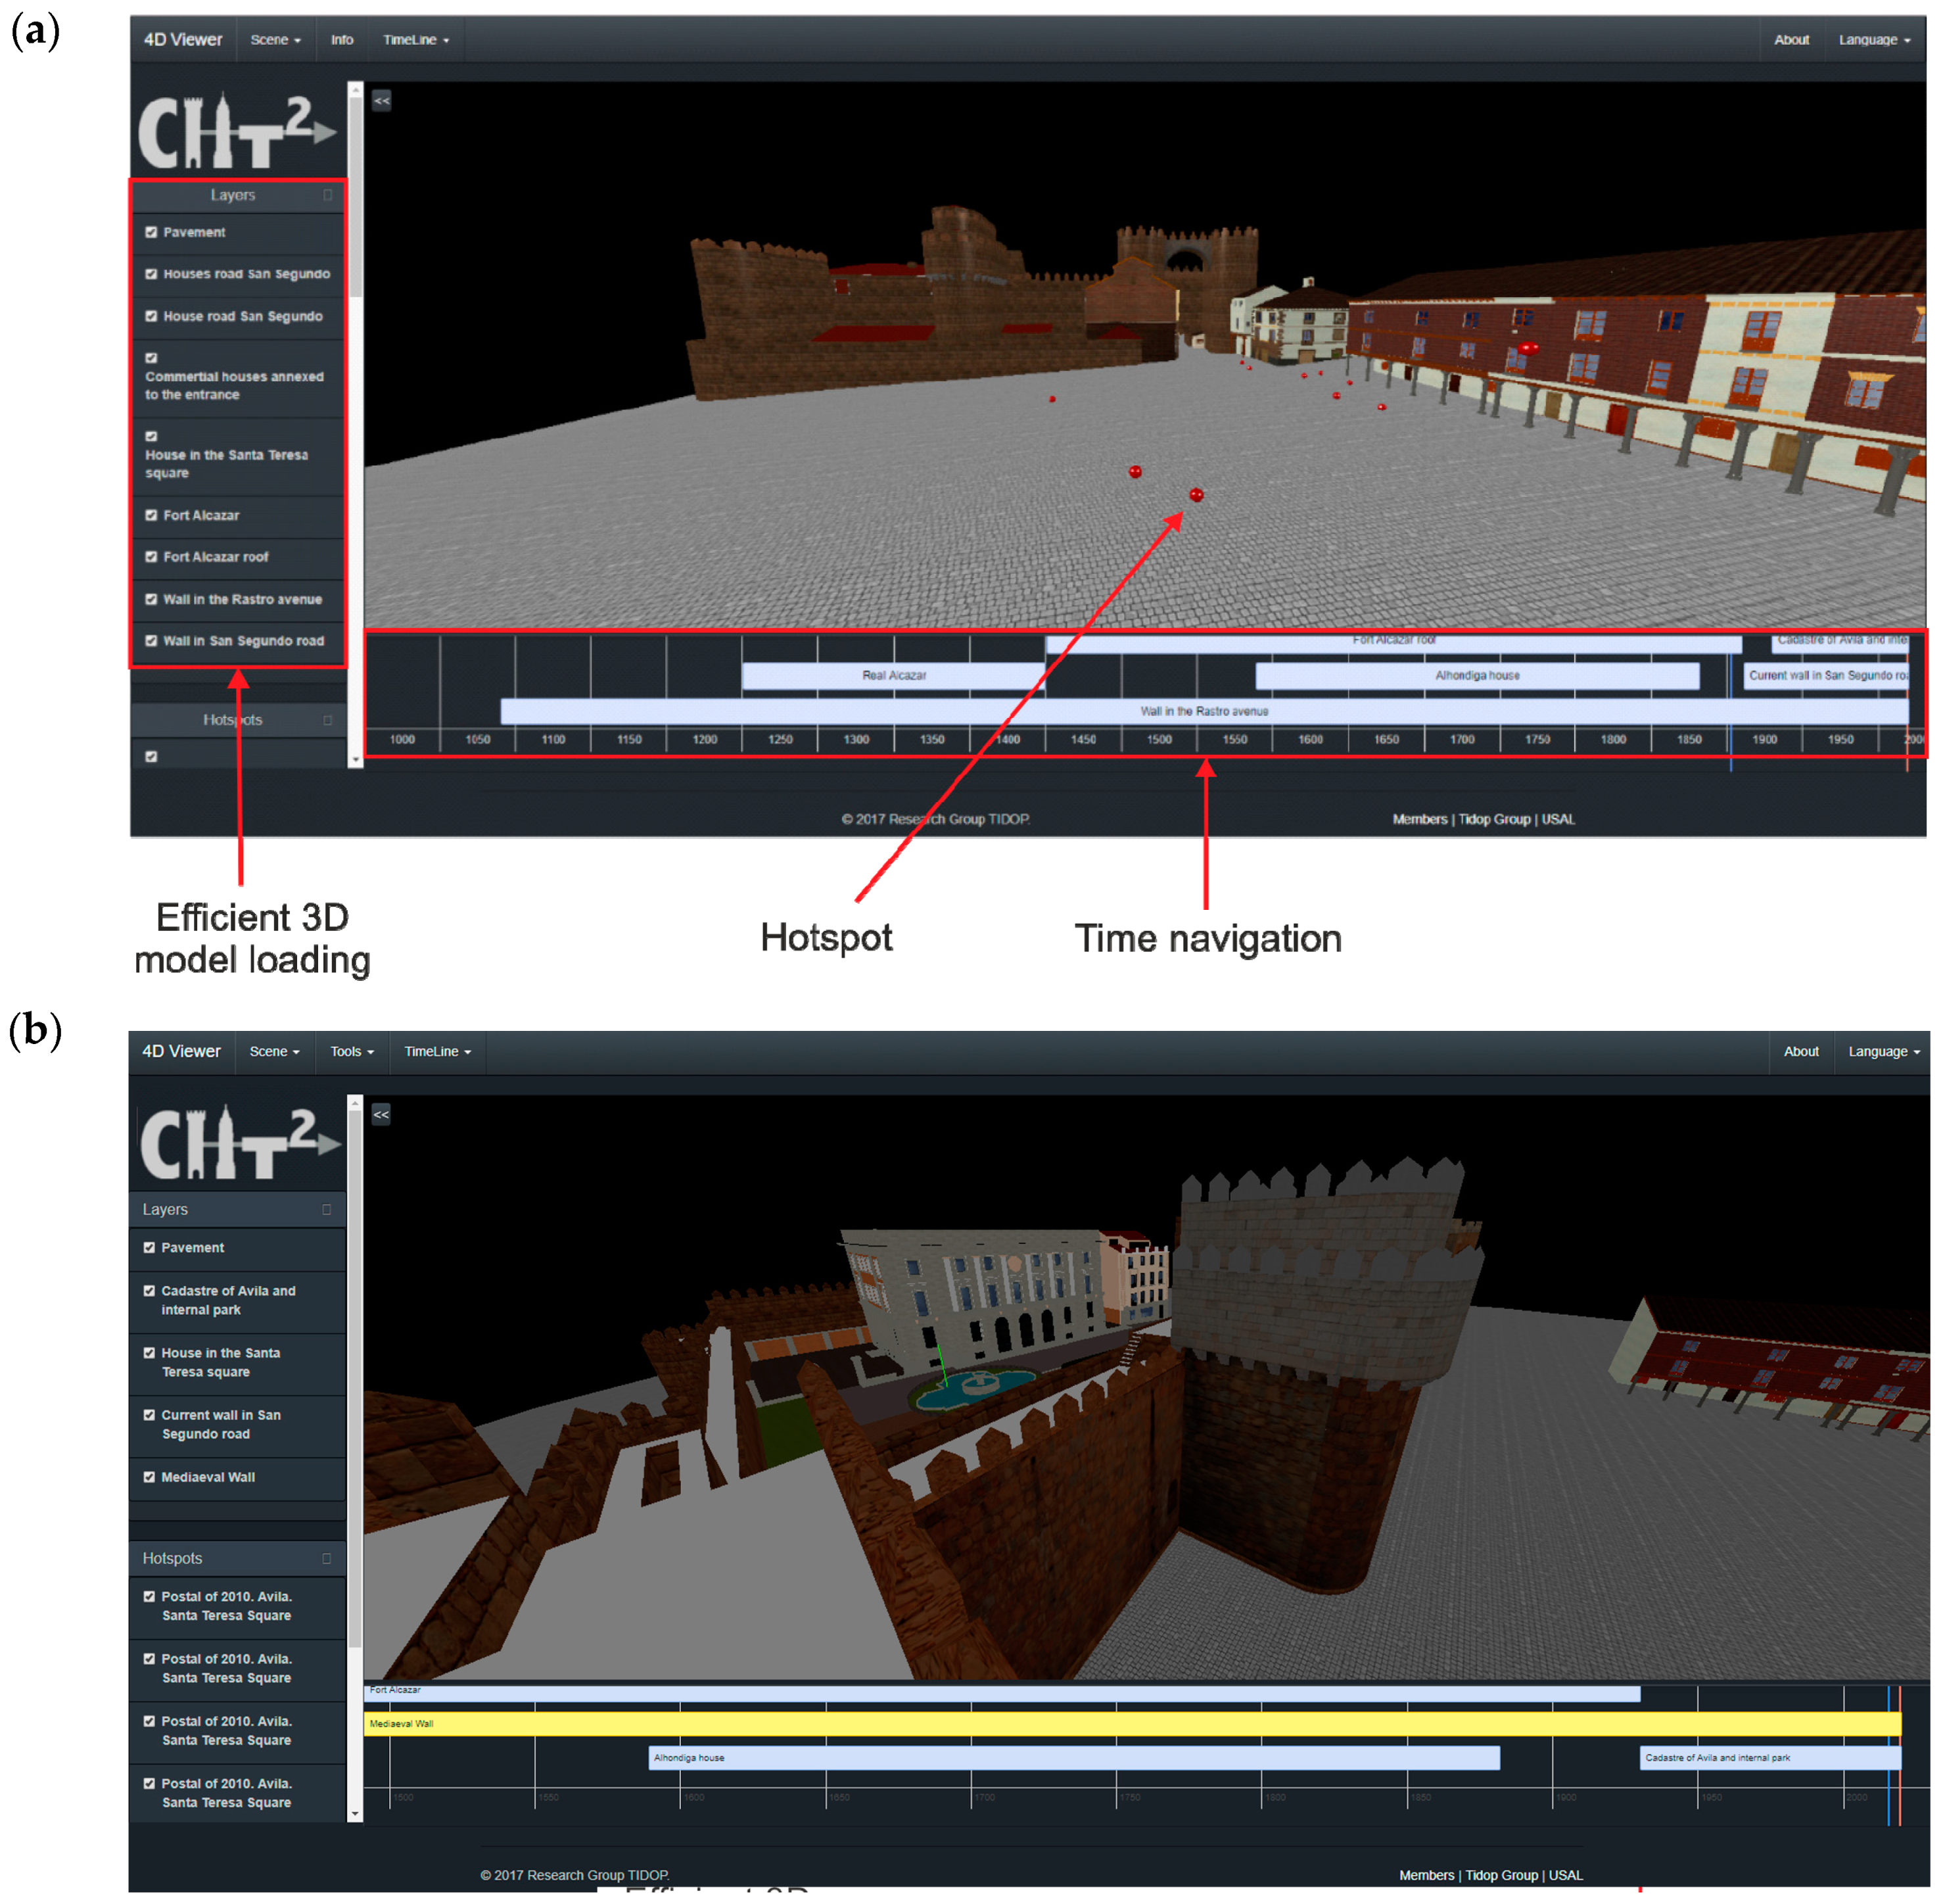
The data of each file must be organized through a system of layers, which can be displayed and hidden easily.
A dedicated tool that helps see the data in different epochs of history, namely the fourth dimension, must be available.
3D models may have hotspots to provide additional information about the element selected.
The viewer must be a web application in order to be consulted by different types of users and experts through the Internet.
In order to fulfill all the functional requirements previously shown, the render engine WebGL was chosen. This API enables rendering a 3D environment through the combination of HTML-5 and JavaScript codes. Among the different advantages that this library can offer, highlights include [
40]:
The capacity of rendering dynamically 3D environments.
Hardware acceleration to render a complex environment in a quicker way.
Compatibility with most of the desktop and mobile web browsers.
However, the main limitation of this library is the absence of a format for loading 3D models (such as .obj or .ply), as well as the absence of events (e.g., rendering actions or camera events) that allow the creation of interactive scenes. Taking this into consideration, the WebGL rendering engine was implemented through the JavaScript library Threejs (
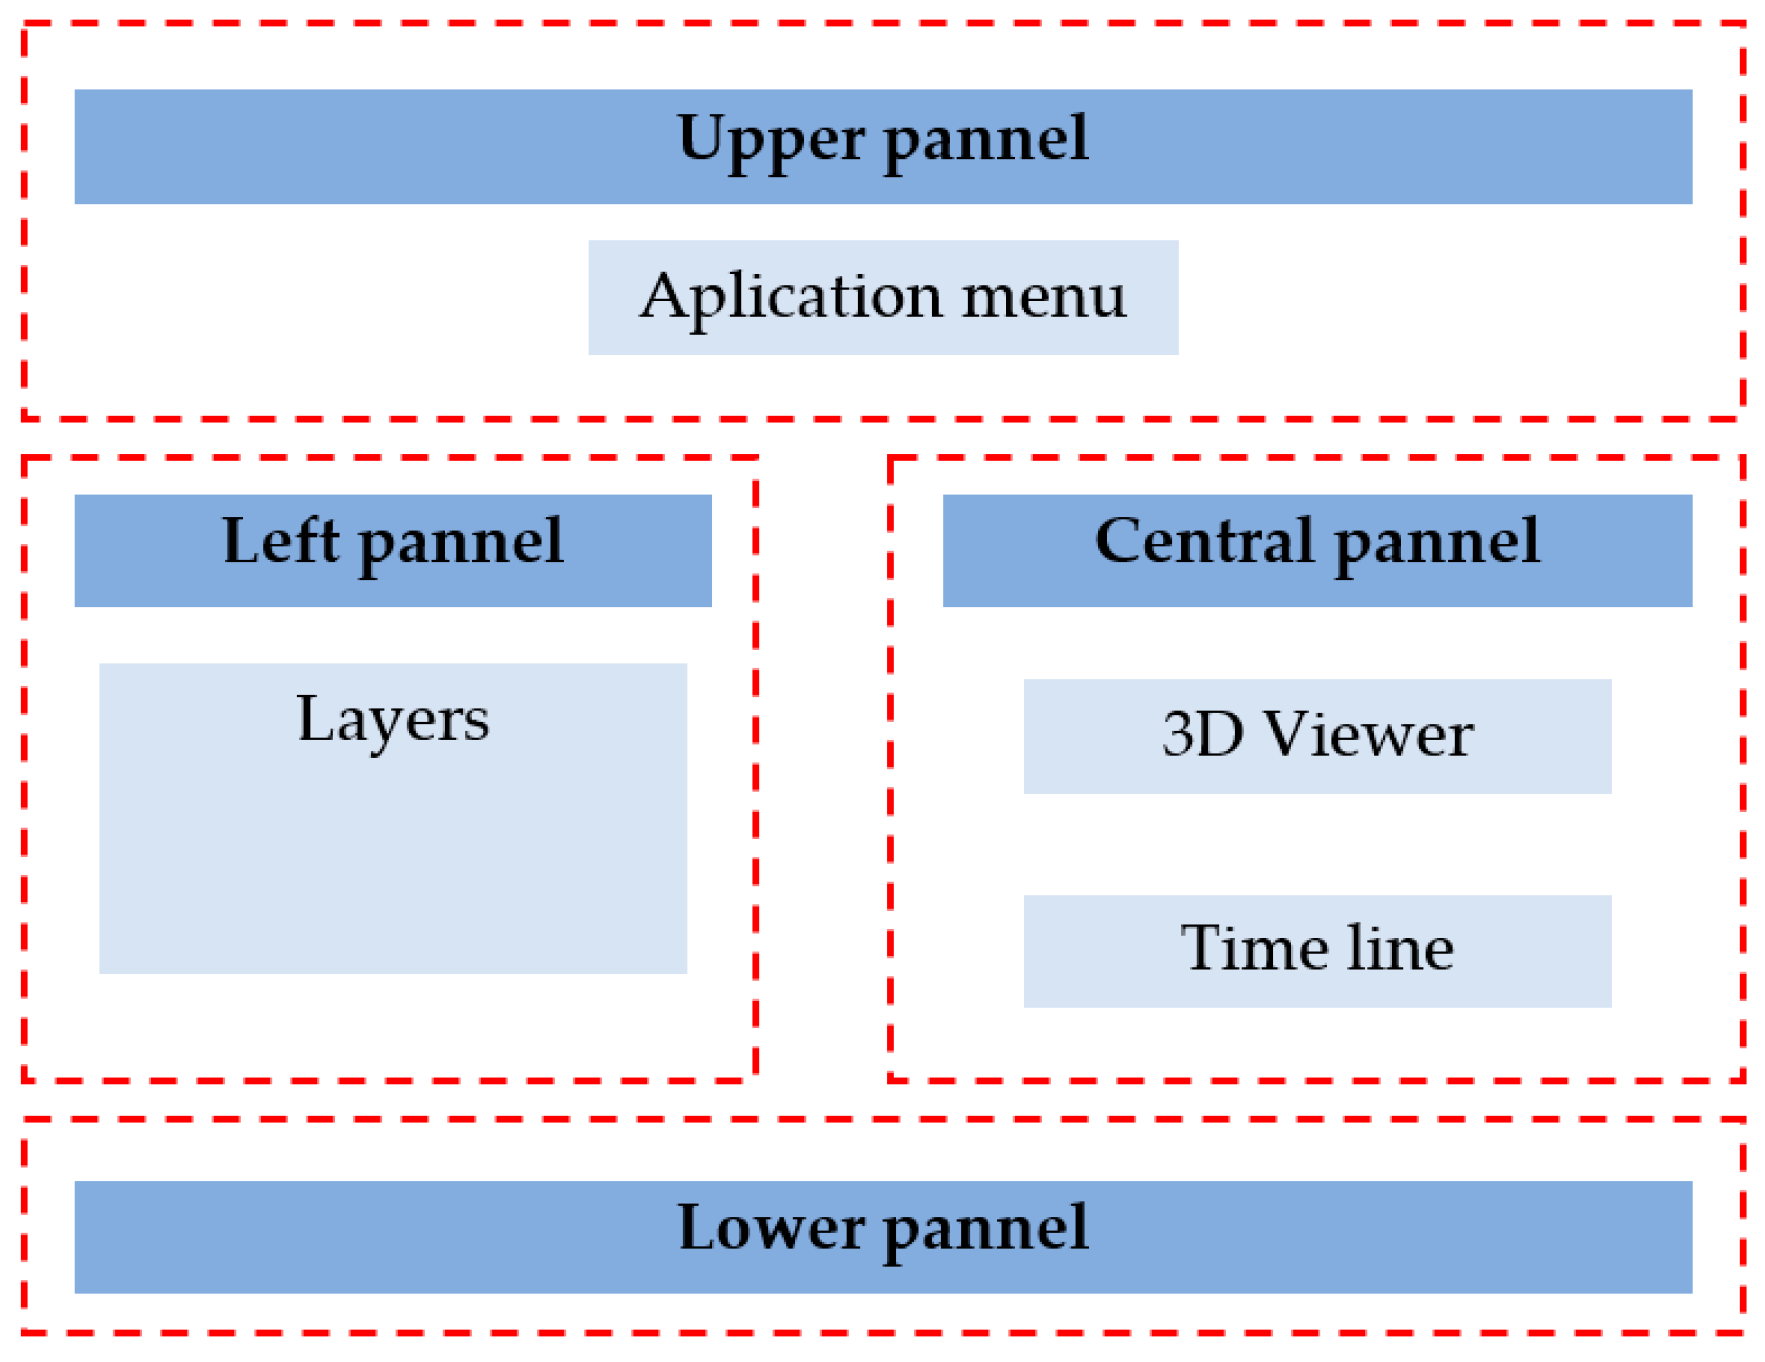
https://threejs.org/). This open-source library includes events for the camera, illumination patterns, and the ability of rendering models. Another important feature of this library is the possibility of using the Graphical Programming Unit (GPU) due to the weight of the different 4D models. As a final advantage, it works easily with other JavaScript libraries. This render engine was complemented by HTML-5, CSS-3, JSON, and standard JavaScript codes through the use of the Bootstrap environment for the interface (
https://getbootstrap.com/), and the JavaScript library React (
https://reactjs.org/) for the creation of classes. All of these components were implemented following a single page application approach (SPA). This programming strategy, the SPA, enables working in a unique page, avoiding the need to reload the application every time the user executes a function (e.g., loading a different epoch or taking measurements). To this end, the SPA follows a twofold strategy that firstly downloads the main HTML, CSS, and JavaScript codes into the client (user), and then progressively executes the different actions demanded by the user (such as the rotation of the scene or the loading of different scenes) by means of an AJAX protocol (Asynchronous Javascript and XML). In parallel to this, and in order to make the application scalable for further improvements, all of the libraries and frameworks were compiled inside the open source environment Visual Studio Code (
https://code.visualstudio.com/) with the help of the library WebPack (
https://webpack.js.org/). As a result, it was possible to create an application with the following architecture (
Figure 4).
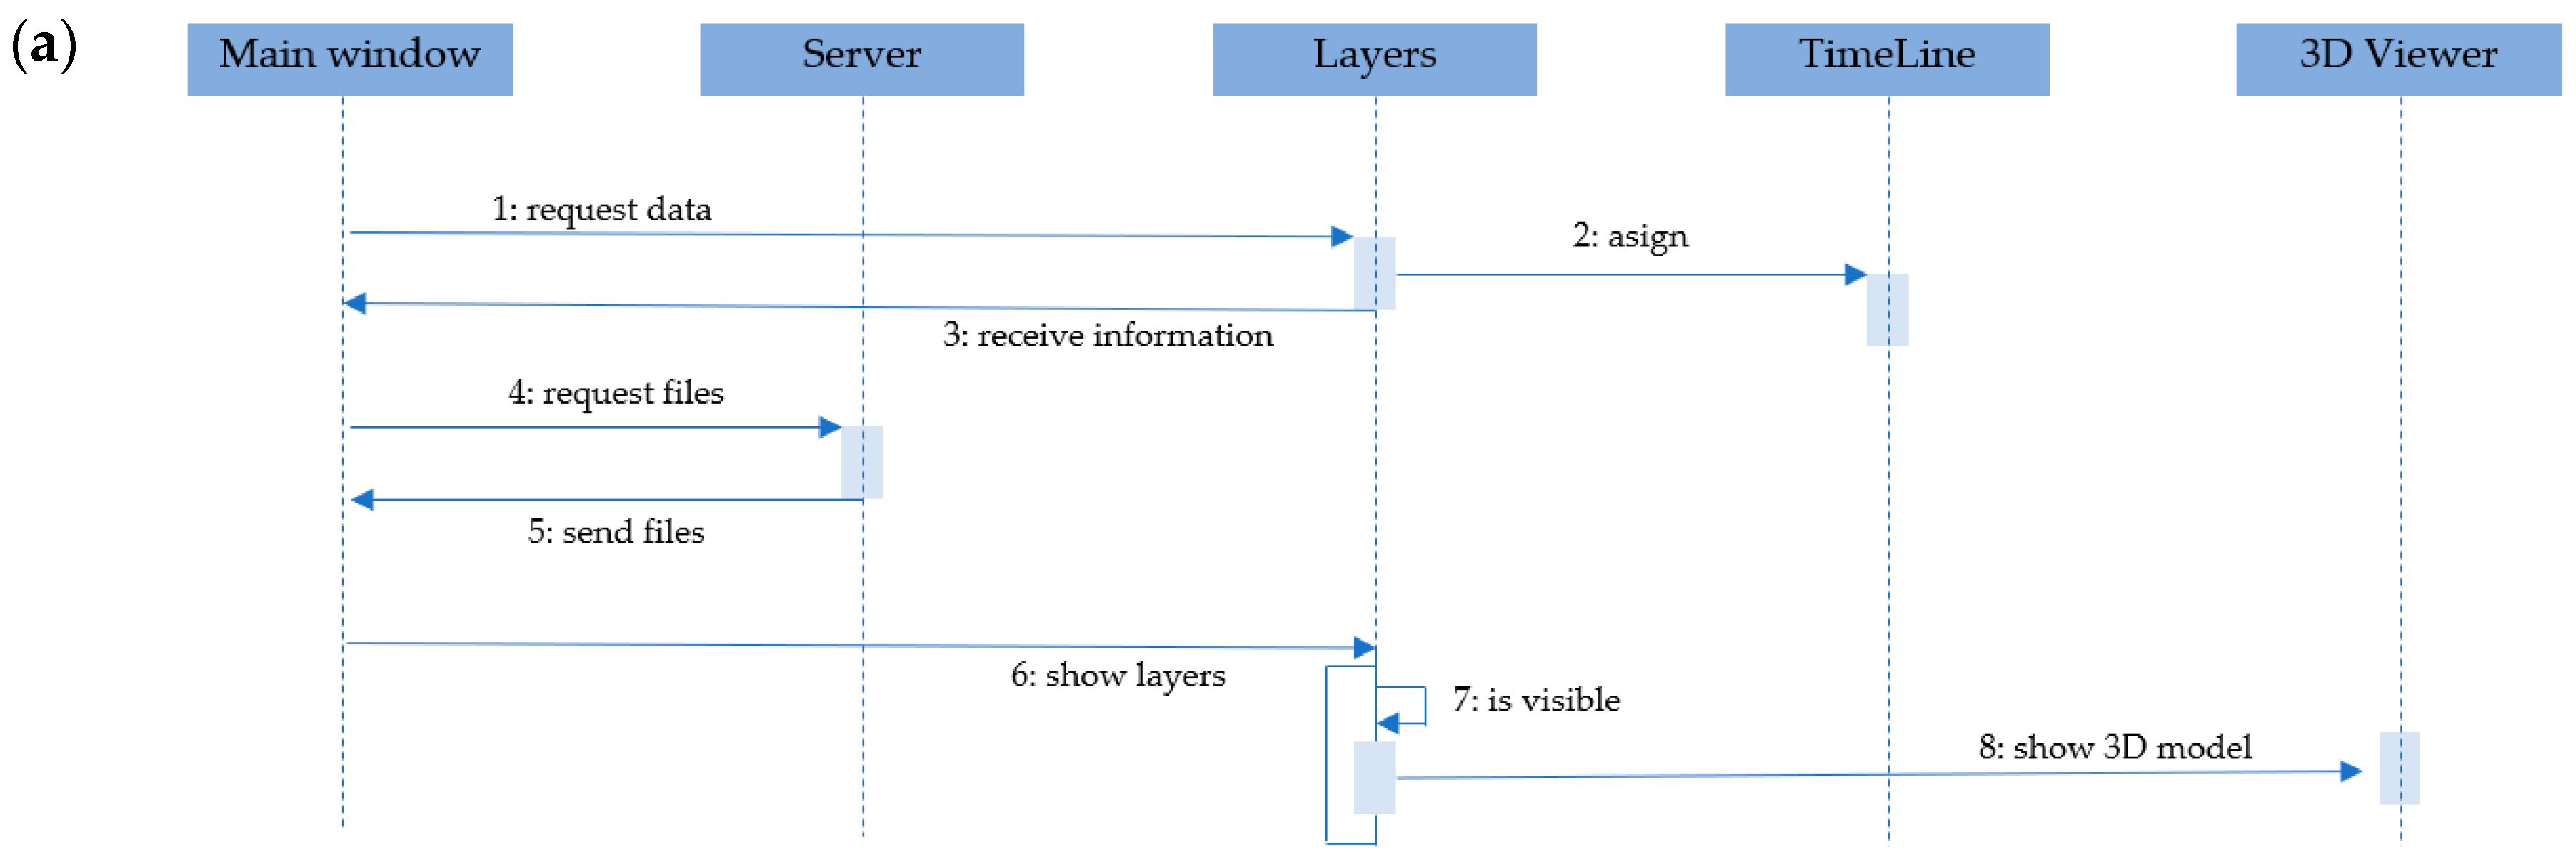
The combination of the previously shown libraries and frameworks enables the visualization of complex 3D scenes by means of a web browser. In order to provide the 4D dimension to the model, the open-source library visjs (
http://visjs.org/docs/timeline/) was used. This library enables creating, editing, and deleting items (in our case 3D models) according to a specific date or range of dates. Under these bases, the following sequential process was used in order to visualize the different models along the timeline (
Figure 5).
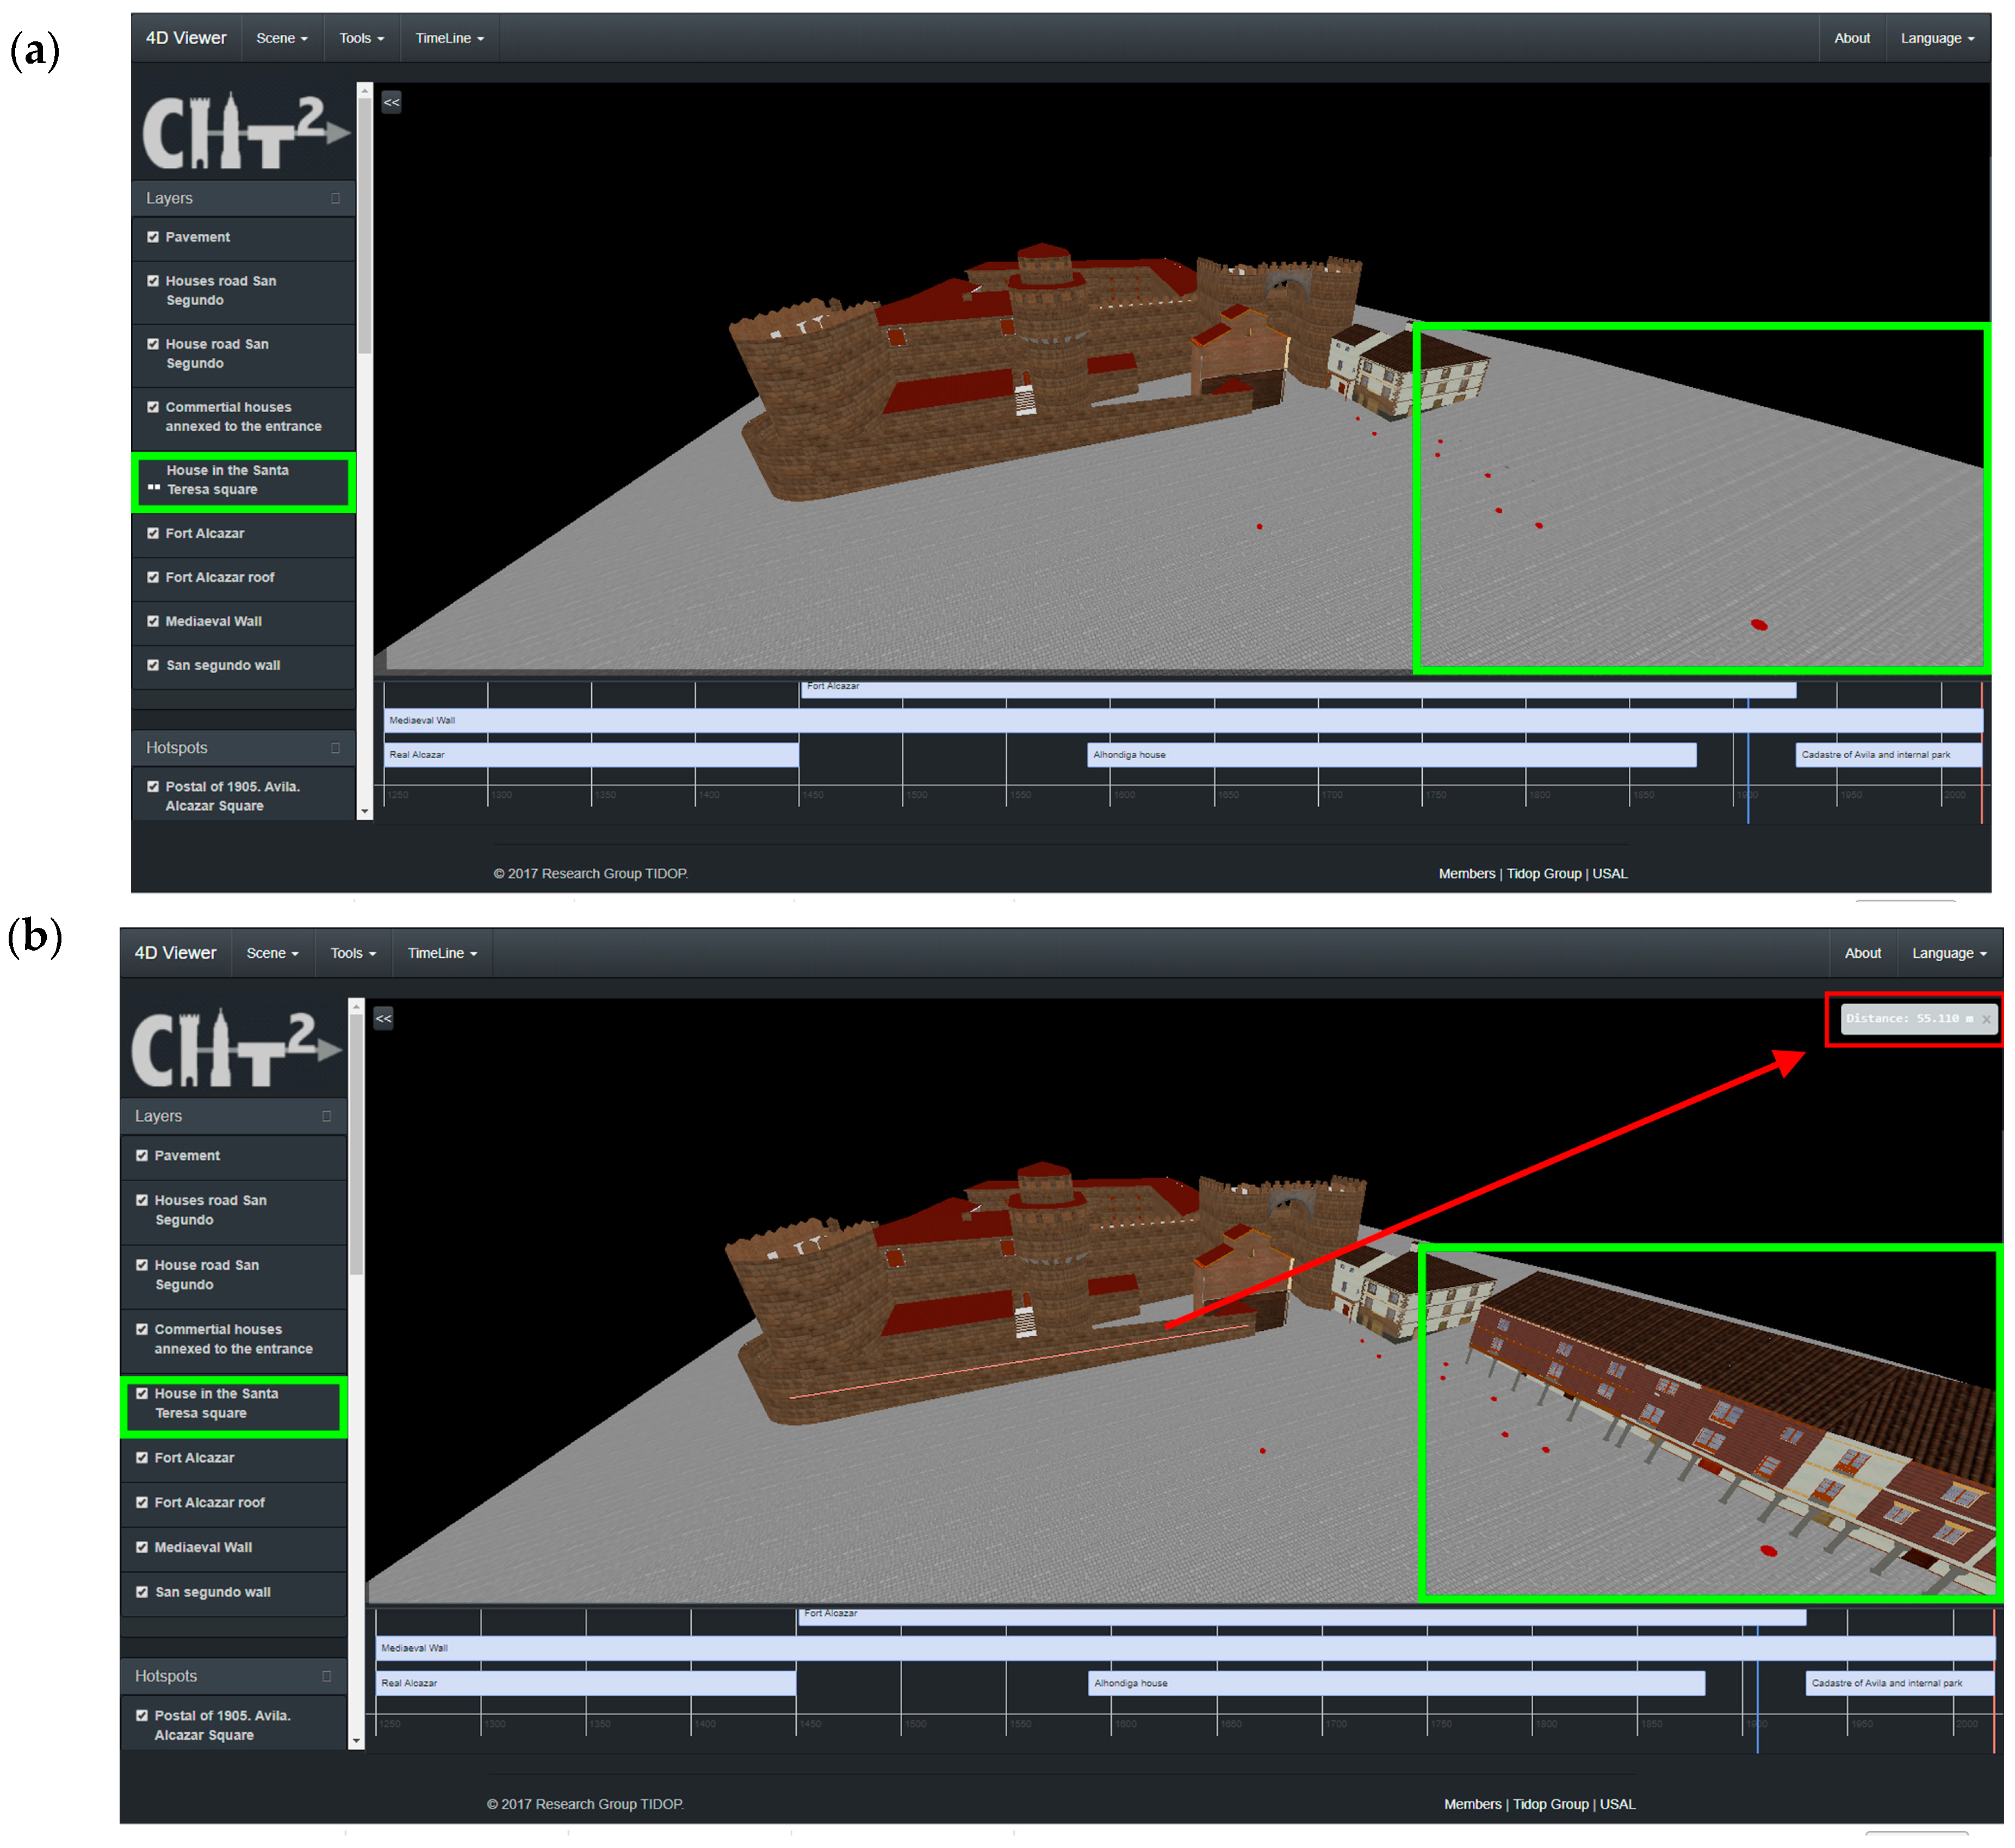
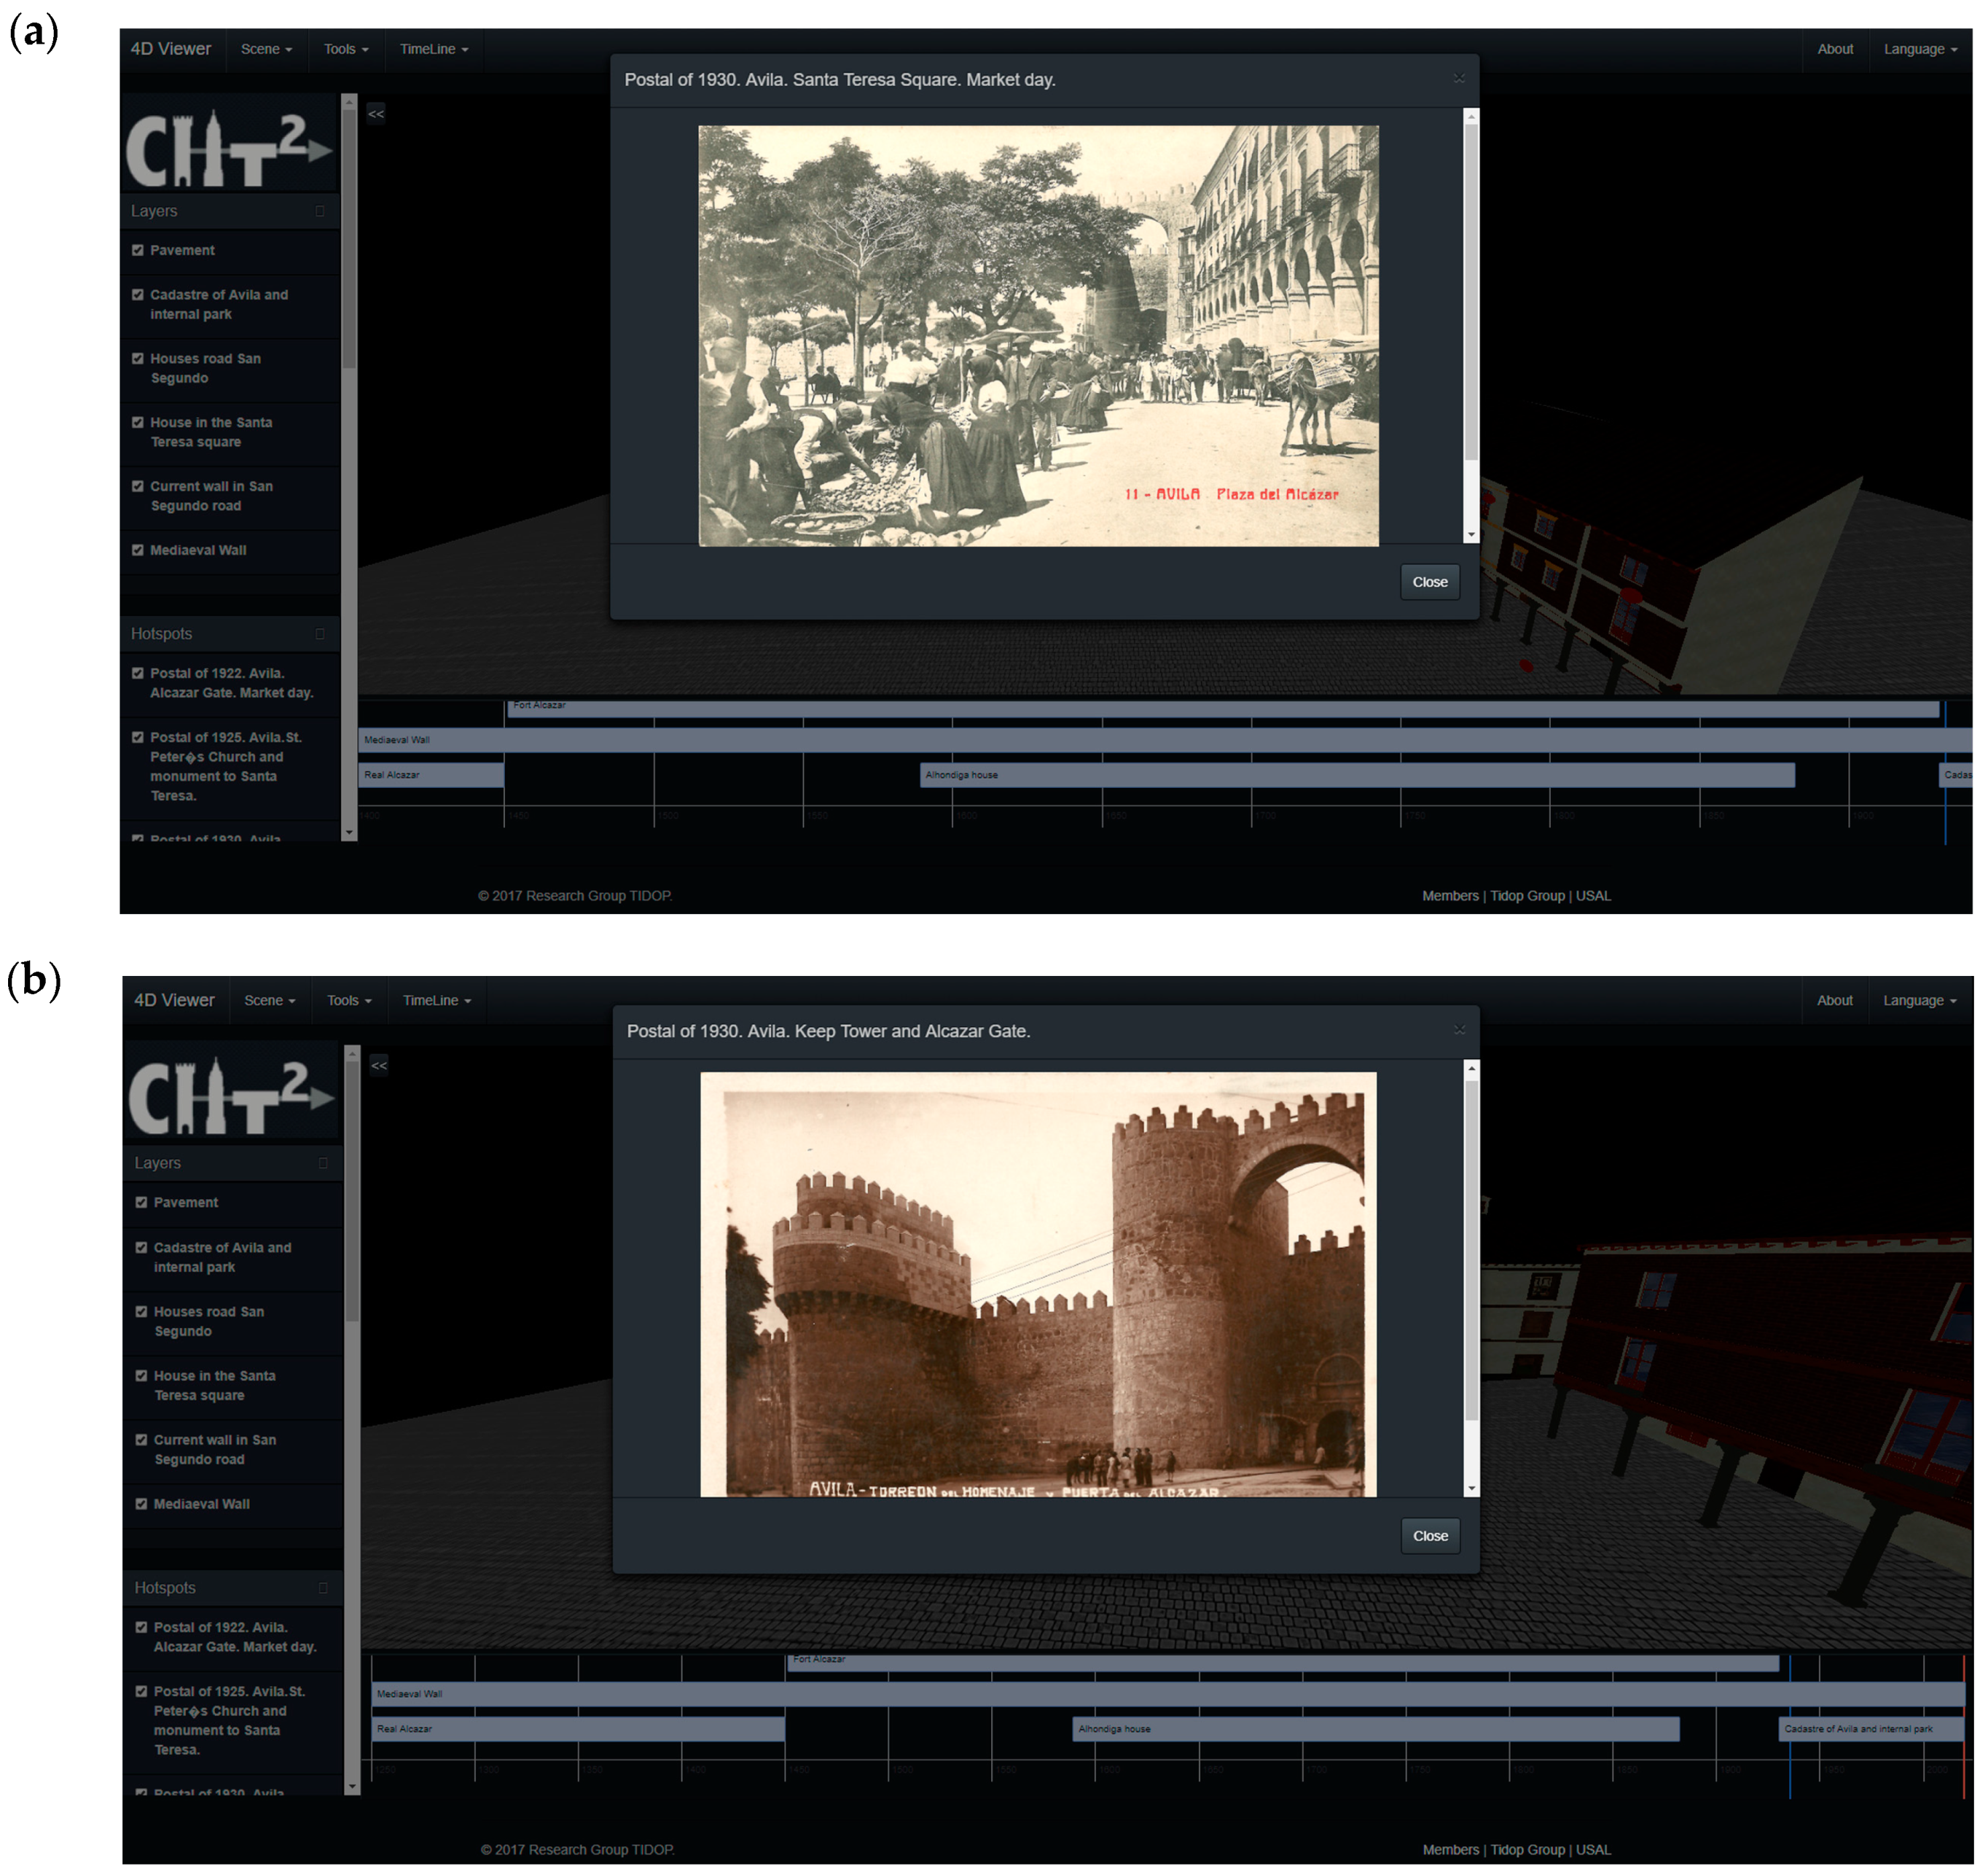
Apart from the main architecture of the application, two additional tools were included, namely: (i) a distance measuring tool, and (ii) hotspots. On the one hand, the distance measuring tool was implemented with the aim of exploiting the metric capabilities of the diachronic reconstructions. On the other hand, the hotspot viewer was designed with the purpose of showing non-geometrical data such as historical photographs, postcards, and historical/didactical texts. This information appears in the form of an emergent window, which is also called a modal window. This window is loaded in an asynchronous way by means of an AJAX protocol that is executed when the user clicks on the hotspot. In the same way as the 3D models, this information appears in accordance with the date chosen by the user in the timeline.
According to the information exposed above, the application is able to deal with two types of data: (i) geometrical data coming for the 3D models obtained during the diachronic reconstruction, and (ii) non-geometrical data, such as historical photographs or texts, by means of the use of hotspots and modal windows. On the one hand, the geometrical data is uploaded to the viewer in .obj format. Then, the data is linked to the layer and timeline layouts by means of a JSON (JavaScript Object Notation) file. This file has the following main fields: (i) name of the layer; (ii) start date; (iii) end date; and (iv) path of the file. Additionally, to these fields, the JSON file includes information about the visibility of the 3D model in the layer and timeline bars. On the other hand, the non-geometrical data is uploaded to the viewer through the use of a HTML-5 modal page, linking this information with the timeline and the 3D environment through the use of a JSON file. This JSON file has the same fields as those defined for the geometrical data.

 ,
, 


