
Identifying Spatial Determinants of Rice Yields in Main Producing Areas of China Using Geospatial Machine Learning
1
Faculty of Veterinary and Agricultural Sciences, The University of Melbourne, Melbourne 3010, Australia
2
School of Resources and Environmental Sciences, China Agricultural University, Beijing 100193, China
*
Author to whom correspondence should be addressed.
ISPRS Int. J. Geo-Inf. 2024, 13(3), 76; https://doi.org/10.3390/ijgi13030076
Submission received: 12 January 2024
/
Revised: 25 February 2024
/
Accepted: 26 February 2024
/
Published: 28 February 2024
(This article belongs to the Special Issue Advances in AI-Driven Geospatial Analysis and Data Generation)
Abstract
:Rice yield is essential to global food security under increasingly frequent and severe climate change events. Spatial analysis of rice yields becomes more critical for regional action to ensure yields and reduce climate impacts. However, the understanding of the spatially varied geographical, climate, soil, and environmental factors of rice yields needs to be improved, leading to potentially biased local rice yield prediction and responses to climate change. This study develops a spatial machine learning-based approach that integrates machine learning and spatial stratified heterogeneity models to identify the determinants and spatial interactions of rice yields in the main rice-producing areas of China, the world’s largest rice-producing nation. A series of satellite remote sensing-derived variables are collected to characterize varied geographical, climate, soil, and environmental conditions and explain the spatial disparities of rice yields. The first step is to explore the spatial clustering patterns of the rice yield distributions using spatially global and local autocorrelation models. Next, a Geographically Optimal Zones-based Heterogeneity (GOZH) model, which integrates spatial stratified heterogeneity models and machine learning, is employed to explore the power of determinants (PD) of individual spatial variables in influencing the spatial disparities of rice yields. Third, geographically optimal zones are identified with the machine learning-derived optimal spatial overlay of multiple geographical variables. Finally, the overall PD of various variables affecting rice yield distributions is calculated using the multiple variables-determined geographically optimal zones and the GOZH model. The comparison between the developed spatial machine learning-based approach and previous related models demonstrates that the GOZH model is an effective and robust approach for identifying the spatial determinants and their spatial interactions with rice yields. The identified spatial determinants and their interactions are essential for enhancing regional agricultural management practices and optimizing resource allocation within diverse main rice-producing regions. The comprehensive understanding of the spatial determinants and heterogeneity of rice yields of this study has a broad impact on agricultural strategies and food security.
1. Introduction
Rice yield is crucial for global food security and a key indicator of agricultural and environmental sustainability [1,2]. Efficient rice cultivation is necessary due to the expanding global population and climate change uncertainty, which threatens conventional agricultural methods [3]. However, there are essential challenges in examining the spatial disparity of rice yield and understanding the factors influencing this spatial disparity [4]. Spatial analysis provides effective approaches and tools for describing geographical patterns and their underlying causes, which is crucial for solving this challenge [5]. By exploring the intricate geographical factors of rice production, we can better understand the diverse aspects that impact crop yields [6]. This study aims to examine the geographical variables that impact rice productivity within the framework of an intricate agricultural terrain. The examination extensively examines China as a prominent case study. By examining the spatial factors affecting rice output, we not only fulfil the critical requirement for well-informed decision-making in agriculture but also provide valuable contributions to sustainable food production and global food security [7].
The variations in rice yield among different regions are not only a subject of agricultural importance but also have broader consequences for socioeconomic progress, environmental conservation, and sustainable development [8]. Spatial analysis, with its ability to examine the complex interaction of spatial and environmental conditions, is a crucial tool for understanding the causes of these disparities [9]. We can identify the exact variables contributing to productivity variances by examining the geographical measurements of rice yield disparities [10]. These factors may include variations in climate, soil qualities, land use patterns, or other geographical components [11]. These valuable observations are crucial for implementing specific actions and developing strategies by considering the rice production differences between locations [12]. In addition, spatial analysis provides the ability to predict the future effects of climate change, urbanization, and other dynamic processes on rice production, allowing for proactive adaptation methods [13]. This study explores the complex field of spatial factor analysis, investigating its importance in understanding the complex spatial disparities in rice yield. It aims to provide valuable insights to improve agricultural productivity, support sustainable development, and tackle current challenges.
A wide range of approaches has been used in spatial factor analysis to understand the complex relationships between rice yield and geographical variables. Regression analysis, a conventional statistical method, has been the primary tool for investigating spatial factors [14]. It enables a practical model and measures the impact of different factors on spatial patterns. In addition, machine learning algorithms have become more prominent as datasets become more intricate and extensive [15]. Deep learning is an essential emerging technology for more accurate prediction of rice yield, as explained by cases in Indonesia [16] and China [17]. These algorithms can handle large amounts of geographical data and reveal intricate patterns and nonlinear relationships [18]. Simultaneously, spatial statistics and geospatial approaches have become essential for capturing spatial autocorrelation, heterogeneity, and other geographical characteristics [19]. These techniques, which include spatial autocorrelation tests and geostatistical modelling, allow for considering geographical dependencies and offering more precise evaluations of the influence of spatial factors on rice yield [20]. Incorporating these methodologies, encompassing traditional statistical methods, state-of-the-art machine learning algorithms, and spatial techniques, provides recent studies with powerful tools for analyzing spatial factors [21]. This enables the revealing of concealed patterns, generates reliable predictions, and supports decision-making based on empirical evidence across various domains.
However, further advancements are required in the current methodologies employed to examine spatial factors. First, the hierarchical configuration and characteristics of geographical heterogeneity are neglected [20]. In order to avoid oversimplified or deceptive observations, the latest geospatial methods increasingly need to account for the inherent disparities in spatial factors among different geographical zones or locations [22,23]. In addition, evaluating individual variables neglects the interactions and combinations of factors from a spatial perspective [24]. Nevertheless, actual patterns are often determined by the interaction of various spatial elements [25]. A complete understanding of the complex spatial relationships that govern numerous phenomena will result from completing these gaps. Geographically stratified heterogeneity and the intricate interactions of associated factors can enable rice yield studies to develop more informed policies and decisions [26,27,28].
Remote sensing technology has become a transformative tool with multiple advantages in studying the geographical factors that affect rice yield [29]. Remote sensing allows studies to thoroughly evaluate the dynamic factors impacting rice yield by offering high-quality and up-to-date data on several environmental parameters [30]. Remote sensing images can accurately monitor the rice planting areas, such as through the red edge band of Gaofen-6 (GF-6) satellite [31]. Remote Sensing also provides a comprehensive perspective on the complex geographical factors that affect rice yield, including monitoring changes in land cover, assessing crop health, measuring soil moisture fluctuations, and observing climate patterns [32]. Furthermore, remote sensing data can be smoothly combined with geospatial and statistical techniques, enabling the development of reliable predictive models and spatial analyses that consider intricate interconnections and geographical variability [33]. This technique also enables efficient and economical data collecting, facilitating the monitoring of extensive rice-growing regions [34]. In summary, the ability of remote sensing to offer prompt and comprehensive data over vast areas enables researchers and decision-makers to make better-informed decisions, optimize the allocation of resources, and conduct focused interventions to improve rice production and food security [35].
Moreover, the studies on geographical determinants affecting rice output are of great significance in the specific context of China [1,5,36]. China is the world’s largest rice producer, with an annual yield consistently exceeding 200 million tons. This production represents approximately 28% of the global rice output, which was around 755 million tons in the year 2021. Rice cultivation plays a crucial role in the nation’s food and is a fundamental pillar of its agricultural economy, and it faces critical challenges such as global climate change [37]. To achieve food security and safeguard the livelihoods of millions of farmers, it is crucial to comprehend the factors that affect rice yield, given the task of feeding a population exceeding one billion people [38]. The geographical terrain of China is extensive and varied, with a diverse range of climates, soil types, and land-use patterns [39]. This leads to significant differences in rice production across different areas [40]. Policymakers, agricultural specialists, and farmers can use practical spatial analysis to customize policies and interventions for specific regions, thereby maximizing crop yields and efficiently allocating resources [41]. In addition, as China deals with the difficulties of urbanization, environmental deterioration, and climate change, spatial analysis offers a way to adjust and create new methods for rice farming [42]. This promotes sustainability and the ability to withstand changing conditions [3,43]. Overall, examining the spatial determinants affecting rice output in China is crucial for ensuring the country’s food security and the sustainability of its agriculture and environment [4].
This study employs a Geographically Optimal Zones-based Heterogeneity (GOZH) model for identifying spatial determinants of rice yield in the principal rice-producing regions in China, including Hubei, Hunan, Anhui, and Jiangxi Provinces. GOZH is an effective spatial machine learning approach for identifying the power of determinants based on the spatial stratified heterogeneity and machine learning-based optimization of spatial stratification [22,28,44]. The GOZH-based spatial determinant exploration of rice yield includes the following steps. First, we employ spatial global and local autocorrelation models to uncover spatial clustering patterns within rice yield data, shedding light on localized variations and identifying potential hotspots and coldspots. Subsequently, we delve into the examination of individual spatial variables using the innovative GOZH model, enabling us to quantify the impact of individual factors on rice yield. Furthermore, we introduce a novel approach that combines multiple spatial variables and machine learning techniques to identify geographically optimal zones, revealing nuanced interactions and interdependencies among factors. We assess the relative influence and power of determinants by applying the GOZH model to the amalgamated factors, offering a comprehensive understanding of their combined effect on rice yield. Finally, we validate our models by comparing the results with the optimal parameters-based geographically detectors (OPGD) model [45], ensuring the robustness and accuracy of our spatial factor analysis. By following this systematic methodology, we aim to advance our knowledge of the spatial determinants of rice yield in China and provide actionable insights for policymakers, researchers, and practitioners to optimize rice production practices and bolster food security in this vital agricultural landscape.
2. Study Area and Data
2.1. Study Area and Rice Yield Data
The study region comprises four principal rice-producing provinces in China: Hubei, Hunan, Anhui, and Jiangxi. Data on county-level rice production in 2020 in the four provinces are collected from the respective provincial survey yearbooks [46,47,48,49]. Figure 1 shows the spatial distribution and statistics of rice yield in these principal rice-producing regions. These provinces comprise a substantial part of the country’s rice production [50,51,52,53]. These provinces play a crucial role in China’s agricultural environment as they are the prominent locations for rice production, supported by various variables. First, their favorable climatic conditions, characterized by abundant sunlight and optimal temperatures for rice production [3], make them highly favorable for paddy rice farming. Moreover, their advantageous geographical positioning in central and southern China grants them convenient access to ample water resources, such as many rivers and lakes, essential for rice cultivation [54].
Moreover, these regions possess a profound historical heritage of rice agriculture, characterized by centuries of conventional farming techniques transmitted throughout generations [55]. The vast amount of knowledge and experience gathered has dramatically enhanced the efficiency of rice farming methods, leading to consistently impressive crop yields. These locations have extensive areas of land suitable for growing crops, particularly rice. This allows for the establishment of large-scale rice farms to produce various rice to meet different market needs [56]. The highly advanced agricultural infrastructure, characterized by a vast system of irrigation canals and state-of-the-art farming equipment, enhances the efficiency of rice production [57].
The four provinces collectively accounted for approximately 38.3% of China’s total rice yield in 2020, with Hunan leading the way at 26.39 million tons, followed closely by Jiangxi with 20.51 million tons, Hubei with 18.64 million tons, and Anhui with 15.61 million tons [46,47,48,49]. Given their critical importance in rice production, these provinces are the study area for the comprehensive spatial factors analysis to enhance our understanding of the determinants influencing rice yield in this critical agricultural landscape.
2.2. Explanatory Variables Data
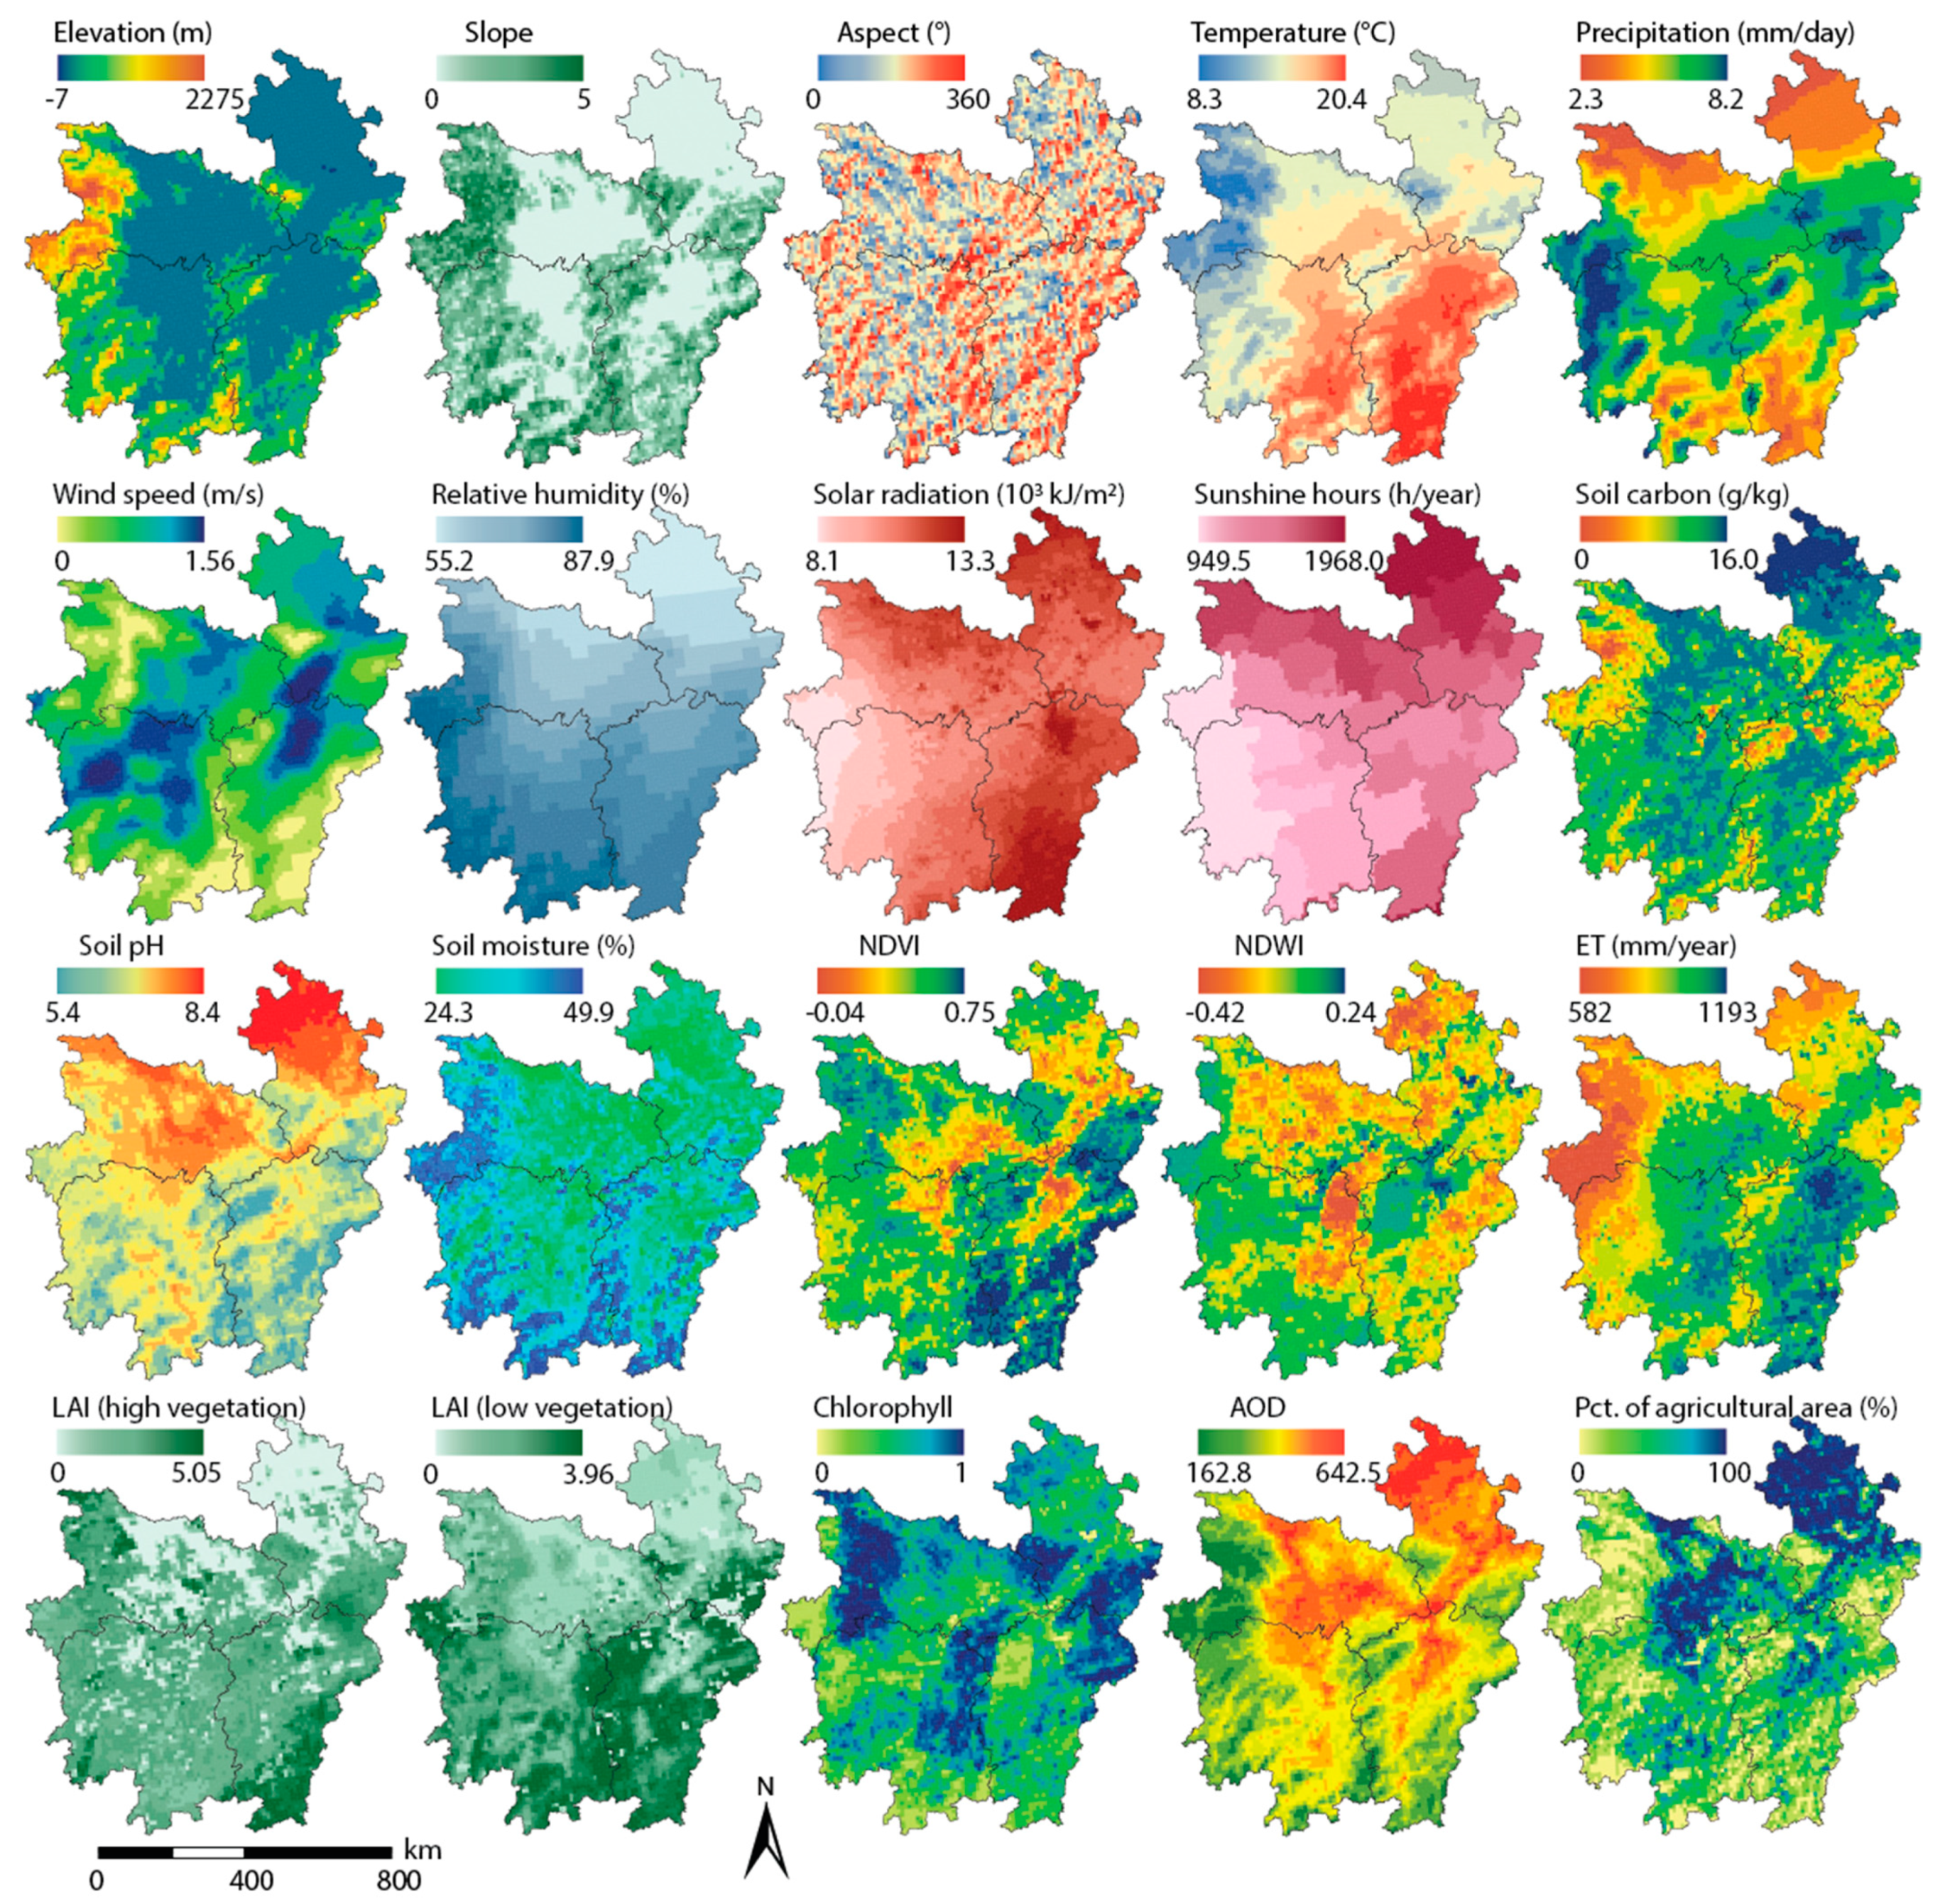
The potential variables for explaining the spatial disparity of rice yield are classified into four categories: geographical, climate, soil, and vegetation and environmental variables. Table 1 shows the variables collected for explaining the spatial distribution of rice yield in the principal rice-producing regions. Figure 2 shows the spatial distributions of potential factors influencing the rice yield. All the explanatory variables data have the same spatial and temporal coverages with the rice yield data. The explanatory variables are calculated to the same spatial unit with that of the rice yield.
The geographical variables considered in this study include elevation, slope, and aspect, critical components in understanding the spatial determinants of rice yield. Elevation data were sourced from the ASTER Global Digital Elevation Model V002 [58], available at https://asterweb.jpl.nasa.gov/GDEM.asp (accessed on 20 December 2023). This high-resolution digital elevation model offers comprehensive coverage of terrain elevation, enabling the characterization of landforms and elevation differences across the study area. Slope, a measure of the steepness or inclination of the terrain, was derived from this elevation data, providing insights into the topographical variations that may influence rice cultivation practices. Aspect, which describes the orientation of land surfaces about cardinal directions, was also derived from the same dataset. These geographical variables, acquired from the ASTER Global Digital Elevation Model, serve as foundational components in our spatial factors analysis, aiding in exploring the topographical influences on rice yield across the study area.
The climate variables used in the analysis represent a comprehensive set of meteorological parameters essential for a holistic understanding of the spatial determinants of rice yield. These variables encompass temperature, precipitation, wind speed, relative humidity, surface solar radiation, and sunshine duration. Temperature, sourced from the Copernicus Climate Data Store’s ERA5-Land Monthly Means dataset (https://cds.climate.copernicus.eu/cdsapp#!/dataset/reanalysis-era5-land-monthly-means (accessed on 20 December 2023)) [59] and measured at a standard height of 2 m above the Earth’s surface, serves as a fundamental indicator of thermal conditions, influencing rice growth stages. Precipitation data from the same dataset, encompassing both liquid and frozen forms of water, provide vital insights into water supply for rice cultivation. Surface net solar radiation, wind speed and direction (represented by the 10 m u-component and 10 m v-component of wind), relative humidity, and sunshine duration, all obtained from the Copernicus Climate Data Store’s ERA5-Land Monthly Means dataset, contribute to our analysis by illuminating energy availability, atmospheric circulation patterns, water balance, and sunlight influences on rice crops. These variables offer a comprehensive environmental context, allowing us to explore the intricate relationships between meteorological conditions and rice yield variations.
The soil variables include essential parameters that provide insights into the soil conditions affecting rice yield. The soil-related variables include soil pH, soil carbon, and soil moisture. Soil pH, measured at a depth of 10 cm in H2O, is a vital indicator of soil acidity or alkalinity, which can profoundly impact nutrient availability and root health. Soil Carbon Content, also measured at a 10-cm depth, informs us about the soil’s organic carbon content, which plays a central role in soil fertility and microbial activity. Soil moisture, measured at 10 cm depth with a focus on water content at 33 kPa (field capacity), offers critical information on soil water availability to rice plants during their growth stages. These soil variables were sourced from a reputable data repository [60], specifically from the dataset available at https://doi.org/10.5281/zenodo.1475459 (accessed on 20 December 2023) and processed through Google Earth Engine [61], ensuring the integration of accurate and comprehensive soil data into our spatial factors analysis, which will aid in deciphering the intricate relationships between soil properties and rice yield variations across our study area.
The last category is the vegetation and environmental variables, contributing to an essential understanding of the factors influencing rice yield. The Normalized Difference Vegetation Index (NDVI) offers insights into vegetation density and health, with high values indicating robust vegetation cover [62]. NDVI data is sourced from the MOD13A1.061 Terra Vegetation Indices with the spatial resolution of 500 m https://doi.org/10.5067/MODIS/MOD13A1.061 (accessed on 20 December 2023). The Normalized Difference Water Index (NDWI) provides information about water content in vegetation and surrounding areas. Evapotranspiration (ET), representing the accumulated water evaporation from the Earth’s surface, informs us about water loss in the study regions [63,64]. The leaf area index (LAI) is divided into two components: LAI for high vegetation and LAI for low vegetation, which measure the green leaf area per unit of horizontal ground surface area for high and low vegetation types. LAI is sourced from the MCD15A3H.061 MODIS Leaf Area Index/FPAR product with the spatial resolution of 500 m https://doi.org/10.5067/MODIS/MCD15A3H.061 (accessed on 20 December 2023). Chlorophyll content is calculated based on NDVI, offering insights into plant health and vitality, and sourced from the GCOM-C/SGLI L3 Chlorophyll-a Concentration product [65]. Aerosol Optical Depth (AOD) data over land is retrieved in the MODIS Green band (0.55 μm), providing information on atmospheric aerosol concentrations, and sourced from the MCD19A2.061: Terra & Aqua MAIAC Land Aerosol Optical Depth product https://doi.org/https://lpdaac.usgs.gov/products/mcd19a2v061/ (accessed on 20 December 2023). Finally, the percentage of agricultural area quantifies the proportion of land dedicated to agricultural practices in the study area. These variables are sourced from a reputable data repository, contributing to a comprehensive environmental context for our spatial factors analysis. The variables are also essential for exploring the interactions between vegetation, environmental conditions, and land use patterns in rice yield variations.
3. Spatial Machine Learning Methods
This study employs a Geographically Optimal Zones-based Heterogeneity (GOZH) model for identifying spatial determinants of rice yield in the principal rice-producing regions in China, namely Hubei, Hunan, Anhui, and Jiangxi Provinces. The GOZH-based spatial determinant exploration of rice yield includes the following steps.
3.1. Spatial Clustering Analysis
In this first stage of our methodology, we employ spatial global and local autocorrelation models to uncover spatial clustering patterns within the rice yield data. The hotspot and coldspot regions of rice yield are explored using the local indicators of spatial association (LISA) [66]. The LISA maps displayed areas with high-high (H-H) hotspot regions and low-low (L-L) coldspot regions. Hotspot regions indicate a high rice yield in a specific spatial unit and a high rice yield in its surrounding units. Conversely, coldspot regions indicate the reverse. This analysis is crucial for identifying localized variations and pinpointing potential hotspots and coldspots in rice yield across the study area. By employing these autocorrelation models, we gain valuable insights into the spatial dynamics of rice production, highlighting regions with distinct production outcomes. This information is a foundation for subsequent steps in our analysis, enabling us to focus on areas with specific yield patterns.
3.2. Examination of Individual Spatial Variables
In the second step, we examine individual spatial variables using the innovative Geographically Optimal Zones-based Heterogeneity (GOZH) model. GOZH is an effective spatial machine learning approach for identifying the power of determinants based on the spatial stratified heterogeneity and machine learning-based optimization of spatial stratification [22,28,44]. GOZH has been successfully implemented in soil moisture analysis [22], carbon emissions analysis [67], and treatment seeking behavior studies [23]. Thus, this study employs the GOZH model to quantify the impact of individual factors on rice yield.
In the general geographical detector, the power of determinants (PD) is quantified using the following equation [28]:
where is the sum of squares within geographical strata determined by explanatory variables, is the sum of squares total of rice yield in the whole study area, and are the number and standard deviation of rice yield within the th () geographical stratum, and and are the number and standard deviation of rice yield in the whole study area.
GOZH improves the general geographical detector by using machine learning to derive the optimal geographical zones. The PD of GOZH is the maximum value of q and expressed as value, which is calculated as [22]:
We use an optimization process to determine geographical zones that maximize variance among zones while minimizing variance within them. This enables us to assess how individual factors influence rice production across the study area. By isolating the impact of each variable, we gain insights into their relative importance in shaping yield patterns.
3.3. Identifying Geographically Optimal Zones
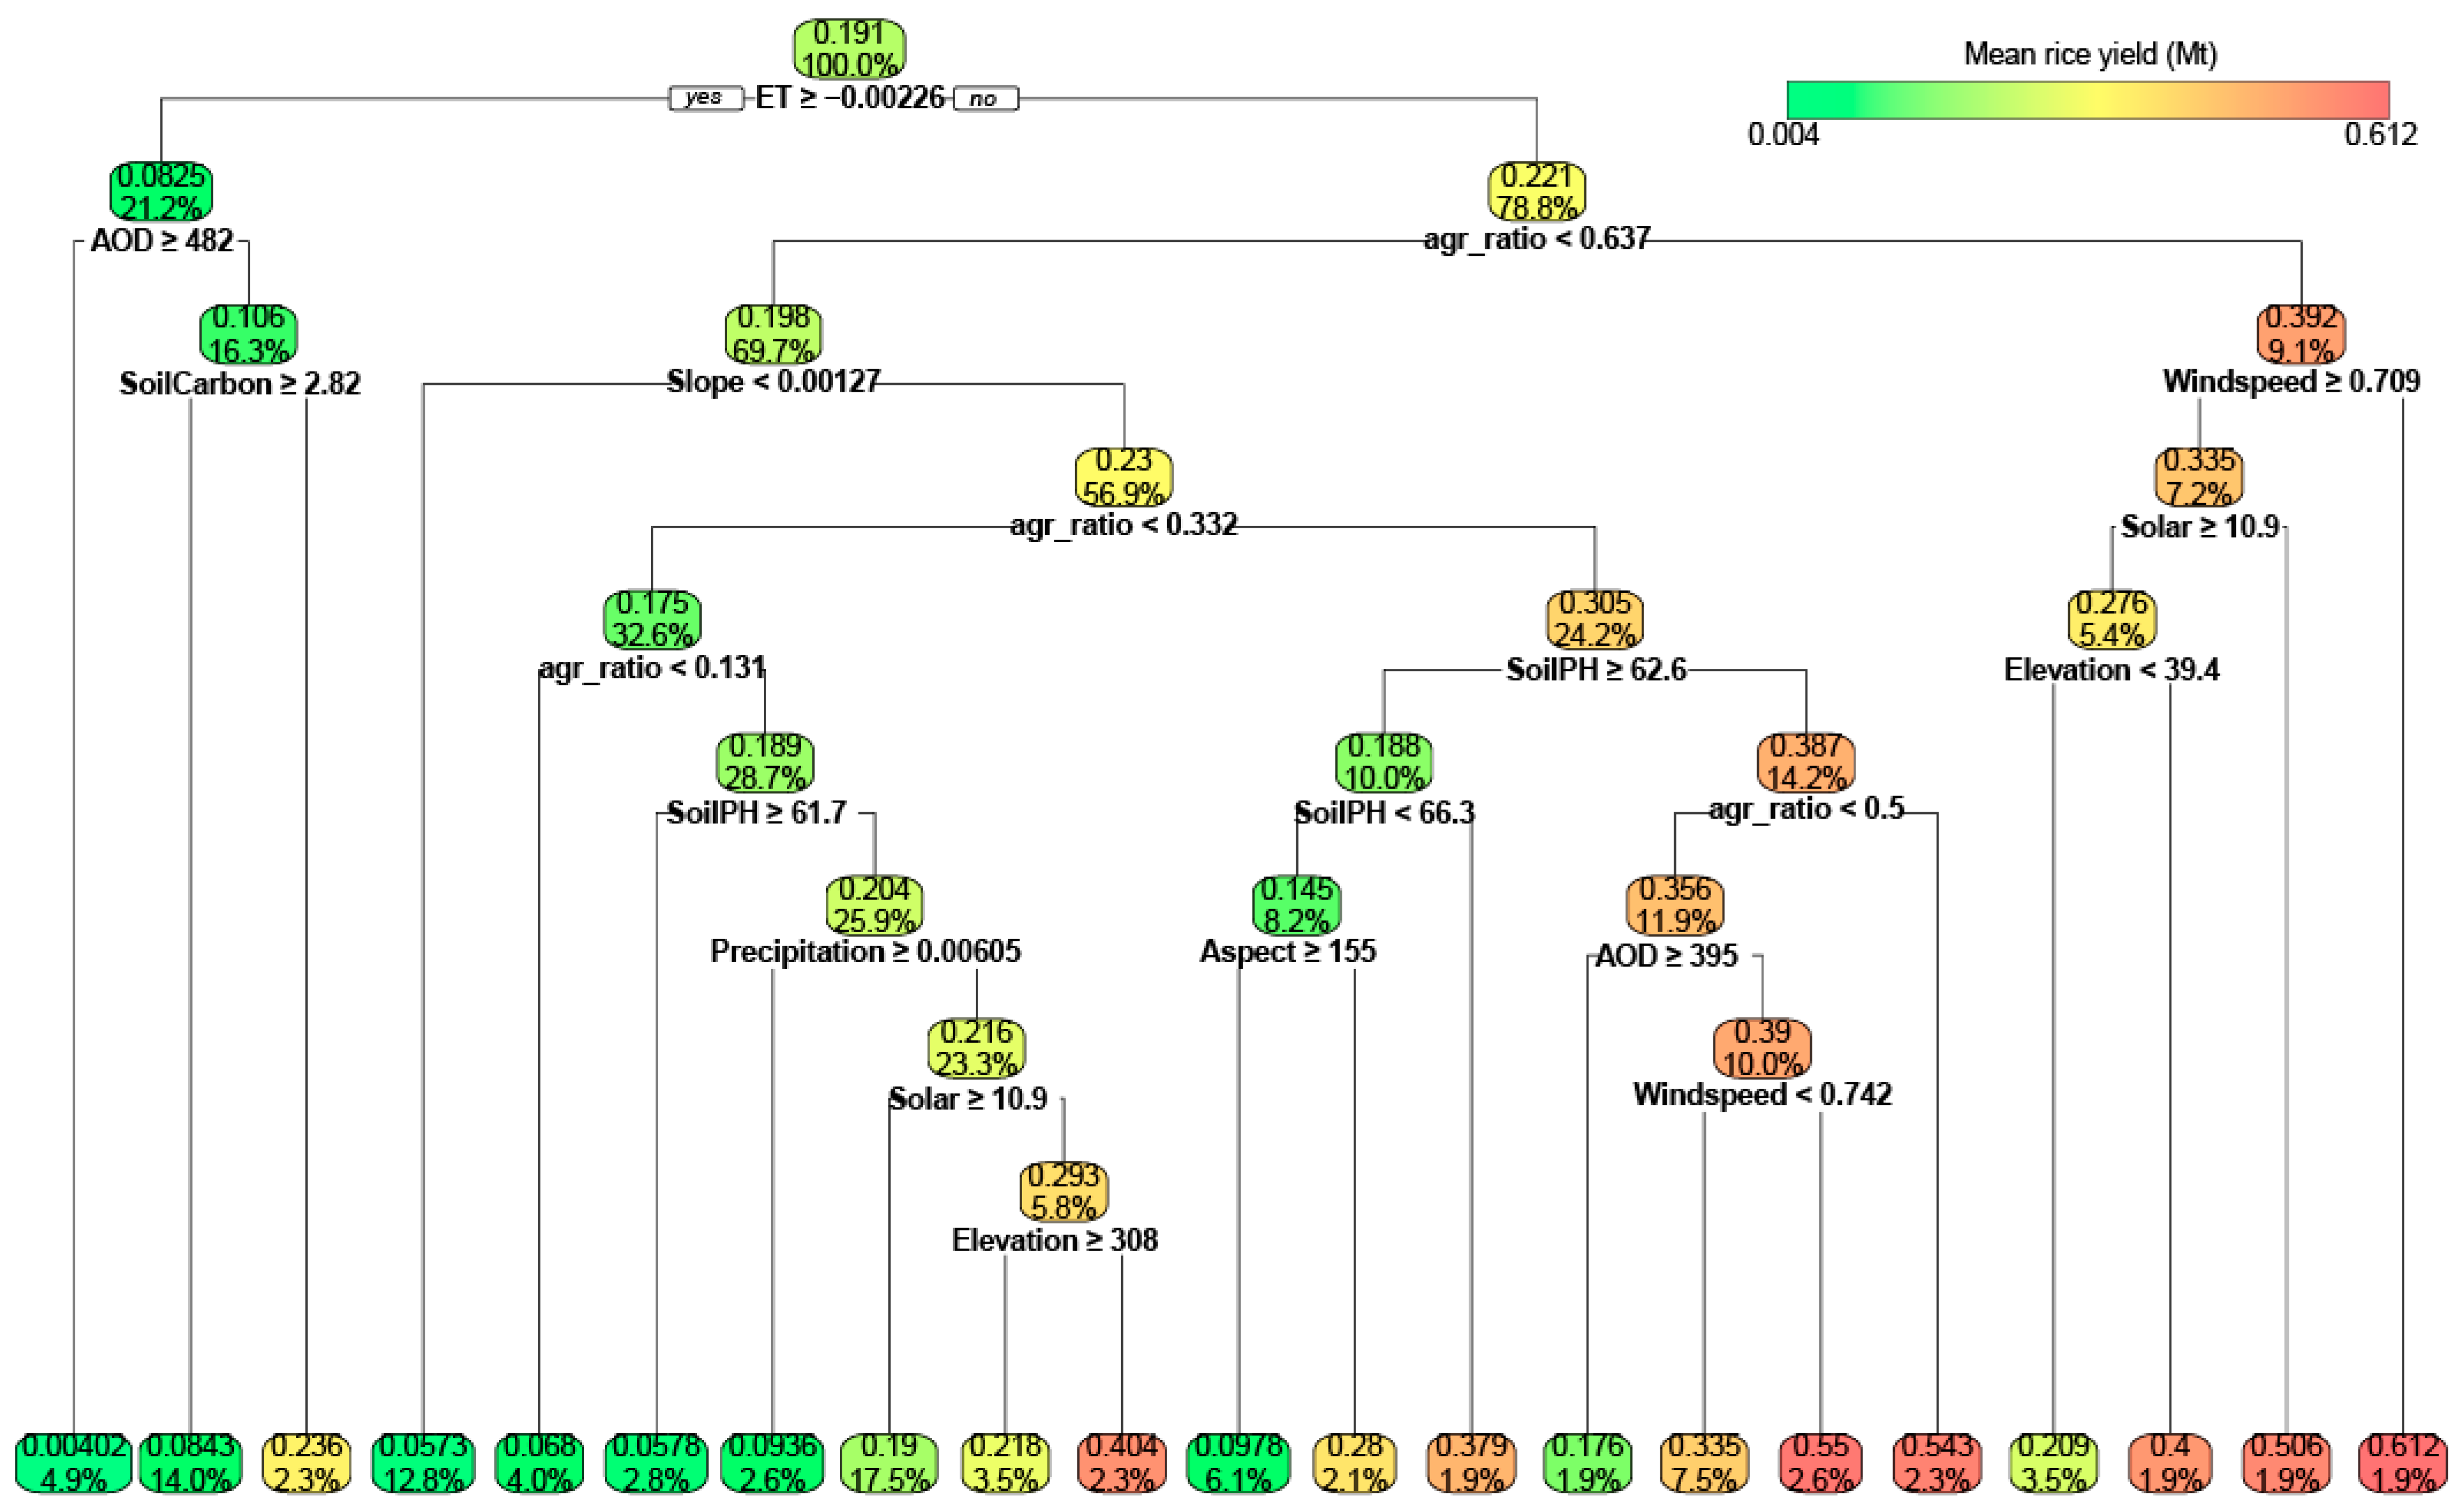
Building on the insights gained from examining individual variables, the third step introduces a novel approach that combines multiple spatial variables and incorporates machine learning techniques. This step is a critical component of GOZH in identifying geographically optimal zones, revealing nuanced interactions and interdependencies among various factors influencing rice yield. This procedure resembles the classification and regression tree (CART) technique [68]. The entire process of spatial discretization can be represented as a binary tree structure. Using the GOZH model, we systematically analyze how these variables interact and contribute to spatial disparities in rice production. This comprehensive view of the combined effects of multiple determinants explains the complex dynamics shaping rice yield.
3.4. Assessing the Power of Determinants of Spatial Variable Interactions
We apply the GOZH model to the amalgamated set of factors identified in the previous step to assess the relative influence and power of determinants. This stage presents a comprehensive understanding of the combined effect of these determinants on rice yield. Importantly, it emphasizes which determinants hold the most significant sway over production outcomes and how their interactions contribute to spatial disparities. Through this analysis, we quantify the significance of each determinant within the context of the broader set of factors, shedding light on the critical drivers of rice yield variations.
3.5. Model Validation
In the final step of our methodology, we ensure the robustness and accuracy of our spatial factors analysis by validating our models. We achieve this by comparing our results with those obtained from the commonly used optimal parameters-based geographically detectors (OPGD) model, which is conducted using the R “GD” package [45]. This validation process is a crucial quality check, affirming our findings’ integrity and reinforcing our methodology’s credibility. By validating our models against a trusted benchmark, we enhance the reliability of our insights into the spatial determinants of rice yield.
4. Results
4.1. Spatial Patterns of Rice Yield
Figure 3 comprehensively depicts the spatial patterns and characteristics of rice yield within the principal rice-producing regions in our study area. Analyzing the spatial distribution of rice yield reveals valuable insights into the regional variations in production outcomes. The overall spatial global Moran’s I, a measure of spatial autocorrelation, is calculated at 0.226 (p < 0.01), indicating a statistically significant level of spatial clustering in rice yield. This highlights that rice production is not uniform across the study area but exhibits distinct spatial dependence patterns.
Hotspots and coldspots of rice yield are identified within the regions, offering a more nuanced understanding of where rice production excels and faces challenges. Specifically, the analysis reveals 34 counties designated as hotspots, collectively accounting for 7.9% of the study area, where rice yield is notably high. Conversely, 75 counties are classified as coldspots, comprising 17.5% of the study area, with low rice yield. The remaining 320 counties fall into the “Others” category, accounting for 74.6% of the study area.
To further elucidate the characteristics of the hotspot regions, we have classified them into four distinct regions based on their spatial distributions. This categorization allows us to explore the unique features and factors contributing to the high rice yield observed in these hotspot areas. The identified spatial patterns and characteristics provide a foundational framework for our spatial factors analysis, aiding in identifying key determinants influencing rice yield disparities across the study area.
Figure 4 shows detailed statistics of the spatial clusters of rice yield within the study area. The clusters are categorized into three distinct regions: hotspot, coldspot, and other regions, each representing counties with varying levels of rice yield.
In the hotspot regions, counties exhibit a notably higher average rice yield per county, with an average of 0.428 million tons. This region, characterized by its elevated rice production, is further subdivided into four subclusters denoted as “hotspot region 1”, “hotspot region 2”, “hotspot region 3”, and “hotspot region 4.” These subclusters showcase varying levels of rice yield within the broader hotspot region. For instance, “hotspot region 3” stands out with the highest average rice yield at 0.575 million tons per county, indicating areas of exceptional rice production within the hotspot cluster.
Conversely, the coldspot region comprises counties with a considerably lower average rice yield per county, averaging just 0.023 million tons. These counties face notable challenges in rice production, resulting in significantly lower yields than their counterparts in the “hotspot” region. Other regions include counties that do not fall into either the hotspot or coldspot regions and show an intermediate average rice yield of 0.206 million tons per county. These counties represent diverse production outcomes, showcasing the heterogeneity in rice yield across the study area.
4.2. Impacts of Individual Variables
Figure 5 provides a comprehensive overview of the individual determinants contributing to the spatial distribution of rice yield within our study area. These determinants are categorized into four groups, each representing a set of variables that impacts rice yield. The impact of these variables is quantified using Omega values, which indicate the relative importance of each determinant in shaping the spatial patterns of rice yield.
First, geographical factors significantly influence rice yield. Elevation (16.7%) is pivotal as it affects temperature and climate. Lower elevations typically provide milder climates, ideal for rice cultivation. Additionally, slope (18.1%) and aspect (15.5%) impact water runoff and soil erosion, directly affecting rice field conditions. Lower aerosol optical depth (AOD) (16.6%) signifies cleaner air, which can benefit rice plants by ensuring better air quality. Moreover, the percentage of agricultural area (15.4%) influences land use patterns, potentially impacting resource availability and competition.
In addition, climate variables are fundamental determinants of rice yield. Temperature (18.1%) is crucial for the rate of rice growth and development. The ideal temperature during the growing season is critical for maximizing yield. Precipitation (9.0%) ensures an adequate water supply for rice plants, especially during the growing season. Wind speed (8.5%), relative humidity (8.7%), solar radiation (8.8%), and sunshine duration (22.4%) collectively influence the microclimate, affecting rice photosynthesis, transpiration, and overall growth. Areas with favorable temperature and moisture conditions and abundant sunshine tend to exhibit higher rice yields.
Further, soil characteristics play a fundamental role in rice production. Soil pH (17.4%) is crucial as it impacts nutrient availability and microbial activity. Balanced soil pH is essential for optimal nutrient uptake by rice plants. Soil carbon content (17.5%) measures soil organic matter, enhancing soil structure and water-holding capacity. Adequate soil moisture (6.6%) is indispensable for rice cultivation, influencing plant hydration and nutrient absorption. Areas with suitable soil pH, high organic matter content, and consistent moisture levels will likely exhibit higher rice yields.
Finally, vegetation-related variables are crucial in determining rice yield. The Normalized Difference Vegetation Index (NDVI) (20.3%) is the most influential determinant, measuring the density and health of vegetation. Higher NDVI values indicate robust vegetation associated with increased photosynthetic activity and higher rice yields. Additionally, the Leaf Area Index for high and low vegetation contributes to understanding green leaf area per unit ground surface area, indicating vegetation coverage. Chlorophyll content (6.6%) is calculated based on NDVI, reflecting chlorophyll levels and photosynthetic potential. These factors collectively influence the spatial distribution of rice yield, highlighting the importance of lush and healthy vegetation in optimizing rice production.
These determinants collectively contribute to the spatial distribution of rice yield by influencing various aspects of rice growth and development. The relative importance of each determinant highlights their contributions, but it is essential to recognize that these factors often interact and operate synergistically. Understanding these relationships is crucial for optimizing rice production practices, as it allows for targeted interventions to enhance rice yield in specific regions while considering the unique combinations of determinants present in each area.
4.3. Geographically Optimal Zones
Figure 6 shows the geographically optimal zones identified to explain the spatial distribution of rice yield within the study area. These zones play a crucial role in characterizing regions with similar rice yield patterns, where the variables’ data exhibit similarity within each zone and differentiate among zones. By categorizing the study area into 21 distinct zones, this visualization comprehensively represents the geographical heterogeneity in rice yield. Each zone encapsulates specific combinations of geographical, climatic, soil-related, and vegetation/environmental factors that collectively influence rice production outcomes. Identifying these geographically optimal zones enables a more detailed understanding of the intricate interactions and interdependencies among determinants, offering valuable insights into optimizing rice cultivation practices and resource allocation in the critical agricultural landscape.
4.4. Interactions of Determinants on Spatial Disparities
The spatial interactions among determinants play a critical role in shaping the spatial disparities of rice yield, and this complexity is encapsulated in the analysis of the overall Power of Determinants (PD). In the context of the GOZH model, the overall PD represents the cumulative influence of various geographical, climatic, soil-related, and vegetation/environmental factors on the spatial distribution of rice yield. The striking finding is that the overall PD, as explored within the geographically optimal zones, accounts for a substantial 57.1%. This substantial contribution underscores these diverse determinants’ intricate interplay and synergistic effects. It demonstrates that the combined impact of these variables within their respective zones significantly shapes the spatial patterns of rice yield across the study area.
4.5. Model Evaluation
4.5.1. Model Evaluation for Individual Variables
Figure 7 compares the PD for individual variables derived from the Geographically Optimal Zones-based Heterogeneity (GOZH) and the Optimal Parameters-based Geographically Detectors (OPGD) models. This comparative analysis reveals the significant enhancements brought about by GOZH in elucidating the spatial determinants of rice yield. On average, GOZH improves spatial PD by approximately 8.2% compared to OPGD, with a maximum improvement of 19.9% and a minimum of 2.1%. This enhancement in exploring individual determinants varies across different variables, showcasing the versatility and efficacy of the GOZH model.
We find improvements in understanding their impact on rice yield by examining specific variables. For instance, variables like Aerosol Optical Depth (AOD) exhibit a substantial increase in PD when explored with GOZH, with an impressive improvement of 14.2%. This signifies that GOZH unveils previously overlooked nuances in the role of AOD in shaping rice yield patterns, offering a more comprehensive understanding of its influence. Similarly, variables such as Soil Carbon Content and Elevation experience significant improvements of 10.2% and 7.1%, respectively, under GOZH. These enhancements underscore the model’s ability to capture the intricate interactions between topographical and environmental factors and their collective impact on rice yield.
Furthermore, the GOZH model is particularly effective in refining the exploration of variables like Evapotranspiration (ET) and Agricultural Area Percentage, with substantial improvements of 7.8% and 8.8%, respectively. These improvements emphasize GOZH’s capacity to uncover the interplay between climatic and land-use factors, offering valuable insights into optimizing rice production practices.
In summary, Figure 7 demonstrates that GOZH consistently enhances the exploration of individual spatial determinants compared to OPGD, with improvements ranging from 2.1% to 19.9%. This highlights the model’s versatility in uncovering nuanced interactions among geographical, climatic, soil-related, and vegetation/environmental factors, ultimately contributing to a more robust and comprehensive understanding of the spatial determinants influencing rice yield.
4.5.2. Model Evaluation for Variable Interactions
In addition, comparing the benefits of the GOZH model with the OPGD model in examining variable interactions influencing rice yield reveals two significant advantages for GOZH. First, GOZH effectively explores the overall Power of Determinants (PD) by considering the spatial overlay of multiple variables simultaneously, while OPGD is limited to assessing interactions between pairs of variables. This fundamental improvement allows GOZH to capture complex synergies and dependencies among various geographical, climatic, soil-related, and vegetation/environmental factors, offering a more holistic perspective on their combined influence on rice yield.
Second, GOZH yields a substantial Overall Power of Determinants of 57.1%, surpassing the maximum PD observed in the interactions of two variables under OPGD, as illustrated in Figure 8. This notable difference underscores the enhanced ability of GOZH to unveil the collective impact of a broader set of determinants on rice yield. From a methodological perspective, these advantages stem from the systematic approach employed by GOZH, which progressively optimizes geographical zones and quantifies heterogeneity among these zones. By considering multiple variables simultaneously and within the context of geographically optimal zones, GOZH provides a comprehensive understanding of the intricate relationships and interdependencies among determinants. This methodological approach contributes to GOZH’s effectiveness in identifying the combined effects of diverse factors on rice yield, offering valuable insights for optimizing rice cultivation practices and promoting food security in the study area.
5. Discussion
This study employs an innovative geospatial machine learning approach in identifying spatial determinants and their interactions in understanding the spatial determinants of rice yield in China. It provides insights into the factors shaping rice production outcomes in the study area. It explores the potential applications of these findings in agriculture, research, and policy development from the following aspects.
First, the results of this study reveal that rice yield in China is influenced by a complex interplay of geographical, climatic, soil-related, and vegetation/environmental factors. Among these determinants, several variables stand out as particularly influential. In particular, sunshine hours, the Normalized Difference Vegetation Index (NDVI), soil pH, soil carbon content, and temperature emerge as critical factors affecting rice yield. Higher NDVI values indicate healthier vegetation conducive to increased rice yields. Balanced soil pH and adequate soil organic matter content are crucial in nutrient availability and overall soil health. At the same time, optimal temperatures during the growing season are vital for maximizing yield. While many of the variables we evaluated are known within the agricultural community, the application of geospatial machine learning provides a novel dimension, allowing us to analyze these variables in combination and at a large spatial scale. This approach enables us to uncover patterns and relationships that were not systematically explored before, providing actionable evidence to improve rice yield management significantly.
Second, this study highlights substantial regional disparities in rice yield within the study area, with distinct clusters of high and low rice yield. These spatial patterns underscore the need for region-specific agricultural practices and interventions. Tailoring strategies to local conditions, such as optimizing soil management, irrigation, and crop selection, can help bridge these yield gaps and enhance rice production. For instance, regarding regions unsuitable for rice production, this study suggests making informed decisions about crop suitability and land use. This study provides crucial evidence for policymakers and farmers in regions unsuitable for rice cultivation to transition to more suitable alternatives to yield better economic returns and sustainability outcomes. This adaptive strategy optimizes resource allocation and promotes agricultural diversification, essential for enhancing resilience against climate change and market fluctuations.
Third, the developed Geographically Optimal Zones-based Heterogeneity (GOZH) model emerges as a powerful tool for exploring the spatial determinants of rice yield. It offers several advantages over traditional approaches, including considering multiple variables simultaneously and assessing their collective impact on rice yield. This comprehensive approach enables a more nuanced understanding of the interdependencies among determinants, leading to improved predictions and management strategies.
Finally, the findings of this study have practical implications for rice production in China, the world’s largest rice-producing nation. Our research can inform agricultural practices that optimize rice yield by identifying the key determinants and their spatial patterns. Based on our findings, implementing region-specific strategies can contribute to increased food security, sustainable agriculture, and economic development in the study area. The methodologies developed in this study can be modified and utilized in other rice-producing areas globally to evaluate and improve rice production efficiency worldwide. By customizing these models to specific local factors such as climate, soil properties, and farming techniques, other areas can use our findings to attain comparable enhancements in rice production monitoring and management.
This study still has limitations. First, it is essential to recognize the possible impacts of spatial resolution, spectral sensitivity, and temporal coverage of remote sensing images on the errors and uncertainties of rice yield analysis. In addition, further research in this field can explore additional determinants and their interactions, providing a more comprehensive understanding of rice yield dynamics. For instance, major soil fertility components are not included in the study due to data unavailability but should be considered in future studies, such as electrical conductivity, nitrogen, sulphur, phosphorus, and potassium levels. Finally, long-term analysis of historical data and analysis for various regions are recommended to assess the reliability of the developed geospatial machine learning approach.
In conclusion, this study advances our knowledge of China’s spatial determinants of rice yield. It demonstrates the potential of the GOZH model in exploring complex interactions among multiple variables. The findings promise to improve agricultural practices, optimize resource allocation, and ultimately contribute to food security in this vital agricultural landscape.
6. Conclusions
This study has made significant contributions in advancing our understanding of the spatial determinants of rice yield in China, particularly within the primary rice-producing regions of Hubei, Hunan, Anhui, and Jiangxi Provinces. Employing the innovative Geographically Optimal Zones-based Heterogeneity (GOZH) model, we comprehensively explored the multifaceted factors shaping rice yield outcomes. Our research responds to the pressing need to unravel the complexities of rice production in a nation characterized by diverse geographical and environmental conditions. We have uncovered pronounced regional disparities in rice yield through rigorous analysis and systematic methodology, with distinctive determinant patterns observed across geographical zones and seasons. These findings underscore the necessity of tailoring agricultural strategies to specific geographical and climatic contexts, a crucial consideration for enhancing food security and sustainable rice production in China.
In addition, the developed spatial machine learning approach has emerged as a robust tool capable of untangling the intricate web of spatial determinants affecting rice yield. By examining individual spatial variables, assessing their collective impact, and validating our models against established approaches, we have contributed pivotal insights for advancing rice yield prediction, enhancing agricultural management practices, and optimizing resource allocation within China’s diverse rice-growing regions. As rice production remains a cornerstone of global food security, our findings hold far-reaching implications for China and for shaping best practices in rice cultivation worldwide. This study offers a comprehensive understanding of the spatial heterogeneity of rice yield, underscoring the importance of tailored agricultural strategies to promote sustainable food production and enhance food security in the world’s largest rice-producing nation. This study highlights the adaptive strategy that urges policymakers and farmers to adopt alternative methods, efficiently use resources, and encourage diversification based on the critical evidence provided in this study, including spatial disparities and the interaction impacts of geographical, environmental, and climate factors on yield production. This adaptive strategy is essential for resilience against climate change and market fluctuations, ensuring a sustainable and economically viable agricultural future.
Author Contributions
Conceptualization, Qingyan Wang; methodology, Qingyan Wang; formal analysis, Qingyan Wang, Longzhi Sun and Xuan Yang; data curation, Qingyan Wang, Longzhi Sun and Xuan Yang; writing—original draft preparation, Qingyan Wang; writing—review and editing, Qingyan Wang, Longzhi Sun and Xuan Yang; visualization, Qingyan Wang. All authors have read and agreed to the published version of the manuscript.
Funding
This research received no external funding.
Data Availability Statement
Data are available on request to the authors.
Conflicts of Interest
The authors declare no conflicts of interest.
References
- Deng, N.; Grassini, P.; Yang, H.; Huang, J.; Cassman, K.G.; Peng, S. Closing yield gaps for rice self-sufficiency in China. Nat. Commun. 2019, 10, 1725. [Google Scholar] [CrossRef]
- Allen, T.; Prosperi, P.; Cogill, B.; Flichman, G. Agricultural biodiversity, social–ecological systems and sustainable diets. Proc. Nutr. Soc. 2014, 73, 498–508. [Google Scholar] [CrossRef]
- Hussain, S.; Huang, J.; Huang, J.; Ahmad, S.; Nanda, S.; Anwar, S.; Shakoor, A.; Zhu, C.; Zhu, L.; Cao, X. Rice production under climate change: Adaptations and mitigating strategies. In Environment, Climate, Plant and Vegetation Growth; Springer: Cham, Switzerland, 2020; pp. 659–686. [Google Scholar]
- Zhang, H.; Tao, F.; Zhou, G. Potential yields, yield gaps, and optimal agronomic management practices for rice production systems in different regions of China. Agric. Syst. 2019, 171, 100–112. [Google Scholar] [CrossRef]
- Cao, J.; Zhang, Z.; Tao, F.; Zhang, L.; Luo, Y.; Zhang, J.; Han, J.; Xie, J. Integrating multi-source data for rice yield prediction across China using machine learning and deep learning approaches. Agric. For. Meteorol. 2021, 297, 108275. [Google Scholar] [CrossRef]
- Xin, F.; Xiao, X.; Dong, J.; Zhang, G.; Zhang, Y.; Wu, X.; Li, X.; Zou, Z.; Ma, J.; Du, G. Large increases of paddy rice area, gross primary production, and grain production in Northeast China during 2000–2017. Sci. Total Environ. 2020, 711, 135183. [Google Scholar] [CrossRef] [PubMed]
- Tang, L.; Risalat, H.; Cao, R.; Hu, Q.; Pan, X.; Hu, Y.; Zhang, G. Food security in China: A brief view of rice production in recent 20 years. Foods 2022, 11, 3324. [Google Scholar] [CrossRef]
- Soriano-González, J.; Angelats, E.; Martínez-Eixarch, M.; Alcaraz, C. Monitoring rice crop and yield estimation with Sentinel-2 data. Field Crops Res. 2022, 281, 108507. [Google Scholar] [CrossRef]
- Luo, P.; Song, Y.; Zhu, D.; Cheng, J.; Meng, L. A generalized heterogeneity model for spatial interpolation. Int. J. Geogr. Inf. Sci. 2023, 37, 634–659. [Google Scholar] [CrossRef]
- Zheng, J.; Song, X.; Yang, G.; Du, X.; Mei, X.; Yang, X. Remote sensing monitoring of rice and wheat canopy nitrogen: A review. Remote Sens. 2022, 14, 5712. [Google Scholar] [CrossRef]
- Urmi, T.A.; Rahman, M.M.; Islam, M.M.; Islam, M.A.; Jahan, N.A.; Mia, M.A.B.; Akhter, S.; Siddiqui, M.H.; Kalaji, H.M. Integrated nutrient management for rice yield, soil fertility, and carbon sequestration. Plants 2022, 11, 138. [Google Scholar] [CrossRef]
- Lavane, K.; Kumar, P.; Meraj, G.; Han, T.G.; Ngan, L.H.B.; Lien, B.T.B.; Van Ty, T.; Thanh, N.T.; Downes, N.K.; Nam, N.D.G. Assessing the effects of drought on rice yields in the Mekong Delta. Climate 2023, 11, 13. [Google Scholar] [CrossRef]
- Liu, Y.; Wang, S.; Chen, J.; Chen, B.; Wang, X.; Hao, D.; Sun, L. Rice yield prediction and model interpretation based on satellite and climatic indicators using a transformer method. Remote Sens. 2022, 14, 5045. [Google Scholar] [CrossRef]
- Pazhanivelan, S.; Geethalakshmi, V.; Tamilmounika, R.; Sudarmanian, N.; Kaliaperumal, R.; Ramalingam, K.; Sivamurugan, A.; Mrunalini, K.; Yadav, M.K.; Quicho, E.D. Spatial rice yield estimation using multiple linear regression analysis, semi-physical approach and assimilating SAR satellite derived products with DSSAT crop simulation model. Agronomy 2022, 12, 2008. [Google Scholar] [CrossRef]
- Satpathi, A.; Setiya, P.; Das, B.; Nain, A.S.; Jha, P.K.; Singh, S.; Singh, S. Comparative Analysis of Statistical and Machine Learning Techniques for Rice Yield Forecasting for Chhattisgarh, India. Sustainability 2023, 15, 2786. [Google Scholar] [CrossRef]
- Thorp, K.; Drajat, D. Deep machine learning with Sentinel satellite data to map paddy rice production stages across West Java, Indonesia. Remote Sens. Environ. 2021, 265, 112679. [Google Scholar] [CrossRef]
- Chu, Z.; Yu, J. An end-to-end model for rice yield prediction using deep learning fusion. Comput. Electron. Agric. 2020, 174, 105471. [Google Scholar] [CrossRef]
- Son, N.-T.; Chen, C.-F.; Cheng, Y.-S.; Toscano, P.; Chen, C.-R.; Chen, S.-L.; Tseng, K.-H.; Syu, C.-H.; Guo, H.-Y.; Zhang, Y.-T. Field-scale rice yield prediction from Sentinel-2 monthly image composites using machine learning algorithms. Ecol. Inform. 2022, 69, 101618. [Google Scholar] [CrossRef]
- Singha, C.; Swain, K.C. Evaluating the NDVI based Rice and Potato Yield Prediction map Using GIS Geostatistical Environment. In Proceedings of the 2022 Second International Conference on Advances in Electrical, Computing, Communication and Sustainable Technologies (ICAECT), Bhilai, India, 21–22 April 2022; pp. 1–7. [Google Scholar]
- Shiu, Y.-S.; Chuang, Y.-C. Yield estimation of paddy rice based on satellite imagery: Comparison of global and local regression models. Remote Sens. 2019, 11, 111. [Google Scholar] [CrossRef]
- Derdouri, A.; Murayama, Y. A comparative study of land price estimation and mapping using regression kriging and machine learning algorithms across Fukushima prefecture, Japan. J. Geogr. Sci. 2020, 30, 794–822. [Google Scholar] [CrossRef]
- Luo, P.; Song, Y.; Huang, X.; Ma, H.; Liu, J.; Yao, Y.; Meng, L. Identifying determinants of spatio-temporal disparities in soil moisture of the Northern Hemisphere using a geographically optimal zones-based heterogeneity model. ISPRS J. Photogramm. Remote Sens. 2022, 185, 111–128. [Google Scholar] [CrossRef]
- Tang, Y.; Song, Y.; Wang, Y.; Lai, S.; Alegana, V.A.; Liu, X. National variation in patterns of bone disease treatment-seeking behaviors: A study of more than 50,000 hospital admissions between 2008 and 2021. Int. J. Appl. Earth Obs. Geoinf. 2023, 117, 103219. [Google Scholar] [CrossRef]
- Song, Y.; Wu, P. An interactive detector for spatial associations. Int. J. Geogr. Inf. Sci. 2021, 35, 1676–1701. [Google Scholar] [CrossRef]
- Haynes, K.E.; Fotheringham, A.S. Gravity and Spatial Interaction Models; Regional Research Institute, West Virginia University: Morgantown, WV, USA, 2020. [Google Scholar]
- Zhang, Z.; Song, Y.; Wu, P. Robust geographical detector. Int. J. Appl. Earth Obs. Geoinf. 2022, 109, 102782. [Google Scholar] [CrossRef]
- Wang, Y.; Wang, S.; Li, G.; Zhang, H.; Jin, L.; Su, Y.; Wu, K. Identifying the determinants of housing prices in China using spatial regression and the geographical detector technique. Appl. Geogr. 2017, 79, 26–36. [Google Scholar] [CrossRef]
- Wang, J.F.; Li, X.H.; Christakos, G.; Liao, Y.L.; Zhang, T.; Gu, X.; Zheng, X.Y. Geographical detectors-based health risk assessment and its application in the neural tube defects study of the Heshun Region, China. Int. J. Geogr. Inf. Sci. 2010, 24, 107–127. [Google Scholar] [CrossRef]
- dela Torre, D.M.G.; Gao, J.; Macinnis-Ng, C. Remote sensing-based estimation of rice yields using various models: A critical review. Geo-Spat. Inf. Sci. 2021, 24, 580–603. [Google Scholar] [CrossRef]
- Mosleh, M.K.; Hassan, Q.K.; Chowdhury, E.H. Application of remote sensors in mapping rice area and forecasting its production: A review. Sensors 2015, 15, 769–791. [Google Scholar] [CrossRef] [PubMed]
- Guo, Y.; Ren, H. Remote sensing monitoring of maize and paddy rice planting area using GF-6 WFV red edge features. Comput. Electron. Agric. 2023, 207, 107714. [Google Scholar] [CrossRef]
- Kuenzer, C.; Knauer, K. Remote sensing of rice crop areas. Int. J. Remote Sens. 2013, 34, 2101–2139. [Google Scholar] [CrossRef]
- Arumugam, P.; Chemura, A.; Schauberger, B.; Gornott, C. Remote sensing based yield estimation of Rice (Oryza sativa L.) using gradient boosted regression in India. Remote Sens. 2021, 13, 2379. [Google Scholar] [CrossRef]
- Paul, G.C.; Saha, S.; Hembram, T.K. Application of phenology-based algorithm and linear regression model for estimating rice cultivated areas and yield using remote sensing data in Bansloi River Basin, Eastern India. Remote Sens. Appl. Soc. Environ. 2020, 19, 100367. [Google Scholar]
- Zhao, R.; Li, Y.; Ma, M. Mapping paddy rice with satellite remote sensing: A review. Sustainability 2021, 13, 503. [Google Scholar] [CrossRef]
- Li, R.; Li, M.; Ashraf, U.; Liu, S.; Zhang, J. Exploring the relationships between yield and yield-related traits for rice varieties released in China from 1978 to 2017. Front. Plant Sci. 2019, 10, 543. [Google Scholar] [CrossRef]
- He, W.; Liu, Y.; Sun, H.; Taghizadeh-Hesary, F. How does climate change affect rice yield in China? Agriculture 2020, 10, 441. [Google Scholar] [CrossRef]
- Li, Z.; Wu, X.; Wang, X.; Zhong, H.; Chen, J.; Ma, X. Measurement and Analysis of Contribution Rate for China Rice Input Factors via a Varying-Coefficient Production Function Model. Agriculture 2022, 12, 1431. [Google Scholar] [CrossRef]
- Wang, D.-y.; Li, X.-y.; Chang, Y.; Xu, C.-m.; Song, C.; Guang, C.; Zhang, Y.-b.; Zhang, X.-f. Geographic variation in the yield formation of single-season high-yielding hybrid rice in southern China. J. Integr. Agric. 2021, 20, 438–449. [Google Scholar] [CrossRef]
- Xu, X.; He, P.; Pampolino, M.F.; Qiu, S.; Zhao, S.; Zhou, W. Spatial variation of yield response and fertilizer requirements on regional scale for irrigated rice in China. Sci. Rep. 2019, 9, 3589. [Google Scholar] [CrossRef] [PubMed]
- Jiang, M.; Li, X.; Xin, L.; Tan, M. Paddy rice multiple cropping index changes in Southern China: Impacts on national grain production capacity and policy implications. J. Geogr. Sci. 2019, 29, 1773–1787. [Google Scholar] [CrossRef]
- He, G.; Wang, Z.; Cui, Z. Managing irrigation water for sustainable rice production in China. J. Clean. Prod. 2020, 245, 118928. [Google Scholar] [CrossRef]
- Shen, X.; Zhang, L.; Zhang, J. Ratoon rice production in central China: Environmental sustainability and food production. Sci. Total Environ. 2021, 764, 142850. [Google Scholar] [CrossRef]
- Guo, J.; Wang, J.; Xu, C.; Song, Y. Modeling of spatial stratified heterogeneity. GISci. Remote Sens. 2022, 59, 1660–1677. [Google Scholar] [CrossRef]
- Song, Y.; Wang, J.; Ge, Y.; Xu, C. An optimal parameters-based geographical detector model enhances geographic characteristics of explanatory variables for spatial heterogeneity analysis: Cases with different types of spatial data. GISci. Remote Sens. 2020, 57, 593–610. [Google Scholar] [CrossRef]
- National Bureau of Statistics Hubei Survey Corps Press. Hubei Survey Yearbook 2020; National Bureau of Statistics Hubei Survey Corps Press: Wuhan, China, 2021. [Google Scholar]
- National Bureau of Statistics Hunan Survey Corps Press. Hunan Survey Yearbook 2020; National Bureau of Statistics Hunan Survey Corps Press: Changsha, China, 2021. [Google Scholar]
- National Bureau of Statistics Anhui Survey Corps Press. Anhui Survey Yearbook 2020; National Bureau of Statistics Anhui Survey Corps Press: Hefei, China, 2021. [Google Scholar]
- National Bureau of Statistics Jiangxi Survey Corps Press. Jiangxi Survey Yearbook 2020; National Bureau of Statistics Jiangxi Survey Corps Press: Nanchang, China, 2021. [Google Scholar]
- Zhou, S.; Xu, L.; Chen, N. Rice Yield Prediction in Hubei Province Based on Deep Learning and the Effect of Spatial Heterogeneity. Remote Sens. 2023, 15, 1361. [Google Scholar] [CrossRef]
- Wang, C.; Zhang, Z.; Zhang, J.; Tao, F.; Chen, Y.; Ding, H. The effect of terrain factors on rice production: A case study in Hunan Province. J. Geogr. Sci. 2019, 29, 287–305. [Google Scholar] [CrossRef]
- Sheng, W.; Awei, S.; Wusan, X.; Weian, T.; Juan, D.; Xiaojun, D.; Rong, W. Impact Assessment of Future Climate Change on Climatic Productivity Potential of Single-season Rice in the South of the Huaihe River of the Anhui Province. J. Arid Meteorol. 2020, 38, 179–187. [Google Scholar]
- Huang, M.; Chen, J.; Cao, F. Estimating the expected planting area of double-and single-season rice in the Hunan-Jiangxi region of China by 2030. Sci. Rep. 2022, 12, 6207. [Google Scholar] [CrossRef] [PubMed]
- Rahman, M.M.; Thompson, J.R.; Flower, R.J. Hydrological impacts of climate change on rice cultivated riparian wetlands in the Upper Meghna River Basin (Bangladesh and India). Hydrol. Sci. J. 2020, 65, 33–56. [Google Scholar] [CrossRef]
- Li, W.; Ruiz-Menjivar, J.; Zhang, L.; Zhang, J. Climate change perceptions and the adoption of low-carbon agricultural technologies: Evidence from rice production systems in the Yangtze River Basin. Sci. Total Environ. 2021, 759, 143554. [Google Scholar] [CrossRef]
- Min, S.; Paudel, K.P.; Chen, F.-B. Mechanization and efficiency in rice production in China. J. Integr. Agric. 2021, 20, 1996–2008. [Google Scholar]
- Qazi, S.; Khawaja, B.A.; Farooq, Q.U. IoT-equipped and AI-enabled next generation smart agriculture: A critical review, current challenges and future trends. IEEE Access 2022, 10, 21219–21235. [Google Scholar] [CrossRef]
- Abrams, M.; Crippen, R.; Fujisada, H. ASTER global digital elevation model (GDEM) and ASTER global water body dataset (ASTWBD). Remote Sens. 2020, 12, 1156. [Google Scholar] [CrossRef]
- Muñoz-Sabater, J.; Dutra, E.; Agustí-Panareda, A.; Albergel, C.; Arduini, G.; Balsamo, G.; Boussetta, S.; Choulga, M.; Harrigan, S.; Hersbach, H. ERA5-Land: A state-of-the-art global reanalysis dataset for land applications. Earth Syst. Sci. Data 2021, 13, 4349–4383. [Google Scholar] [CrossRef]
- Hengl, T. Soil pH in H2O at 6 Standard Depths (0, 10, 30, 60, 100 and 200 cm) at 250 m Resolution. 2018. Available online: https://zenodo.org/records/2525664 (accessed on 20 December 2023).
- Gorelick, N.; Hancher, M.; Dixon, M.; Ilyushchenko, S.; Thau, D.; Moore, R. Google Earth Engine: Planetary-scale geospatial analysis for everyone. Remote Sens. Environ. 2017, 202, 18–27. [Google Scholar] [CrossRef]
- Gu, Y.; Brown, J.F.; Verdin, J.P.; Wardlow, B. A five-year analysis of MODIS NDVI and NDWI for grassland drought assessment over the central Great Plains of the United States. Geophys. Res. Lett. 2007, 34, 1–6. [Google Scholar] [CrossRef]
- Mu, Q.; Zhao, M.; Running, S.W. Improvements to a MODIS global terrestrial evapotranspiration algorithm. Remote Sens. Environ. 2011, 115, 1781–1800. [Google Scholar] [CrossRef]
- Mu, Q.; Heinsch, F.A.; Zhao, M.; Running, S.W. Development of a global evapotranspiration algorithm based on MODIS and global meteorology data. Remote Sens. Environ. 2007, 111, 519–536. [Google Scholar] [CrossRef]
- Murakami, H. ATBD of GCOM-C Chlorophyll-a Concentration Algorithm. 2021. Available online: https://suzaku.eorc.jaxa.jp/GCOM_C/data/ATBD/ver2/V2ATBD_O3AB_Chla_Murakami.pdf (accessed on 20 December 2023).
- Anselin, L. Local indicators of spatial association—LISA. Geogr. Anal. 1995, 27, 93–115. [Google Scholar] [CrossRef]
- Wang, P.; Wu, P.; Song, Y.; Hampson, K.; Zhong, Y. A novel spatio-temporally stratified heterogeneity model for identifying factors influencing carbon emissions. Energy Build. 2023, 280, 112714. [Google Scholar] [CrossRef]
- Breiman, L. Classification and Regression Trees; Routledge: Boca Raton, FL, USA, 2017. [Google Scholar]
Figure 1.
Spatial distribution and statistics of rice yield in the principal rice-producing regions in China.
Figure 1.
Spatial distribution and statistics of rice yield in the principal rice-producing regions in China.

Figure 2.
Spatial distributions of potential factors influencing the rice yield in the principal rice-producing regions in China.
Figure 2.
Spatial distributions of potential factors influencing the rice yield in the principal rice-producing regions in China.

Figure 3.
Spatial patterns and characteristics of the rice yield in the principal rice−producing regions.
Figure 3.
Spatial patterns and characteristics of the rice yield in the principal rice−producing regions.

Figure 4.
Statistics of spatial clusters of rice yield.

Figure 5.
Individual determinants of the spatial distribution of rice yield.

Figure 6.
Geographically optimal zones of the spatial distribution of rice yield.

Figure 7.
Comparison of the power of determinants of individual variables derived from the GOZH and OPGD models.
Figure 7.
Comparison of the power of determinants of individual variables derived from the GOZH and OPGD models.

Figure 8.
Power of determinants of variable interactions derived from the OPGD model.


Table 1.
Variables collected for explaining the spatial distribution of rice yield in the principal rice-producing regions.
Table 1.
Variables collected for explaining the spatial distribution of rice yield in the principal rice-producing regions.
| Category | Variable | Code | Unit |
|---|---|---|---|
| Geography | Elevation | Elevation | m |
| Slope | Slope | / | |
| Aspect | Aspect | ° | |
| Climate | Temperature | Temperature | °C |
| Precipitation | Precipitation | mm/year | |
| Wind speed | Windspeed | m/s | |
| Relative humidity | Humidity | % | |
| Surface solar radiation | Solar | 103 kJ/m2 | |
| Sunshine duration | Sunshine | h/year | |
| Soil | Soil carbon | SoilC | g/kg |
| Soil pH | SoilpH | / | |
| Soil moisture | Soilmoisture | % | |
| Vegetation and environment | Normalized Difference Vegetation Index | NDVI | / |
| Normalized Difference Water Index | NDWI | / | |
| Evapotranspiration | ET | mm/year | |
| Leaf area index, high vegetation | LAIhv | / | |
| Leaf area index, low vegetation | LAIlv | / | |
| Chlorophyll content | Chlorophyl | / | |
| Aerosol optical depth | AOD | / | |
| Percentage of agricultural area | PctAgr | % |
Disclaimer/Publisher’s Note: The statements, opinions and data contained in all publications are solely those of the individual author(s) and contributor(s) and not of MDPI and/or the editor(s). MDPI and/or the editor(s) disclaim responsibility for any injury to people or property resulting from any ideas, methods, instructions or products referred to in the content. |
© 2024 by the authors. Licensee MDPI, Basel, Switzerland. This article is an open access article distributed under the terms and conditions of the Creative Commons Attribution (CC BY) license (https://creativecommons.org/licenses/by/4.0/).
Share and Cite
MDPI and ACS Style
Wang, Q.; Sun, L.; Yang, X. Identifying Spatial Determinants of Rice Yields in Main Producing Areas of China Using Geospatial Machine Learning. ISPRS Int. J. Geo-Inf. 2024, 13, 76. https://doi.org/10.3390/ijgi13030076
AMA Style
Wang Q, Sun L, Yang X. Identifying Spatial Determinants of Rice Yields in Main Producing Areas of China Using Geospatial Machine Learning. ISPRS International Journal of Geo-Information. 2024; 13(3):76. https://doi.org/10.3390/ijgi13030076
Chicago/Turabian StyleWang, Qingyan, Longzhi Sun, and Xuan Yang. 2024. "Identifying Spatial Determinants of Rice Yields in Main Producing Areas of China Using Geospatial Machine Learning" ISPRS International Journal of Geo-Information 13, no. 3: 76. https://doi.org/10.3390/ijgi13030076
Note that from the first issue of 2016, this journal uses article numbers instead of page numbers. See further details here.