Article

Evolution of the Urban Network in the Upper Yellow River Region of China: Enterprise Flow, Network Connections, and Influence Mechanisms—A Case Study of the Ningxia Urban Agglomeration along the Yellow River

School of Geographical Science and Planning, Ningxia University, Yinchuan 750021, China
*
Author to whom correspondence should be addressed.
ISPRS Int. J. Geo-Inf. 2023, 12(9), 367; https://doi.org/10.3390/ijgi12090367
Submission received: 20 June 2023 / Revised: 22 August 2023 / Accepted: 30 August 2023 / Published: 5 September 2023

Abstract

:
Given the significant role of the Ningxia Urban Agglomeration along the Yellow River in reshaping the urban network and promoting coordinated development in the upper Yellow River region of China, this paper takes enterprise flow as the explicit manifestation of the regional urban network and interprets the evolution of the regional urban network structure and its influencing mechanisms through the different types of enterprise flow. The results indicate the following: (1) The external network is primarily focused on outflow investments towards North China, East China, and Northwest China. The overall inflow sources form a multi-origin structure dominated by North China and East China. Jinfeng and Xingqing serve as core hubs for enterprise exports in the external network and destinations for incoming enterprises. However, in terms of productive manufacturing connections, there is a spatial organizational pattern driven by multiple cities. (2) In the internal network, there is a concentric connection structure centered around Jinfeng and Xingqing. The productive service connections are relatively active, while the productive manufacturing connections are relatively concentrated between Jinfeng, Xingqing, Ningdong, and Lingwu. (3) In the external network, the main feature is the absorption of external elements to foster development momentum. In the internal network, Jinfeng and Xingqing serve as the contact and radiation sources, influencing various nodes. However, the driving capacity is weak. (4) The market demand and coordinated development both demonstrate significant promoting effects on the connections within the external and internal networks. The sluggish adjustment and transformation of the regional industrial structure resulted in a temporary negative inhibitory effect on the development of transformation. The negative impact of urban investment activities and the positive impact of government management are reflected within the internal network. (5) Improvements in urban management and service functions as well as external borrowing can promote connection in different networks. However, borrowing economic activity can have a negative impact in different networks. (6) Industrial agglomeration can promote enterprise connections in different networks and generate spatial spillover effects.

1. Introduction

In the era of high-quality development, the flow of businesses can be used to analyze the changes in different types of networks in a region from multiple perspectives, scales, and scenarios, such as innovation networks [1], production networks [2], and financial networks [3]. This holds a unique advantage in deciphering the regional network structure. Within the context of ecological conservation and high-quality development in the Yellow River Basin, the ability of enterprise flow to interpret multiple networks resonates with the region’s pursuit of networked development paths. Innovations in research methods for enterprise network connections are beneficial for both expanding the scope of enterprise flow studies and enriching the study of urban networks in the Yellow River Basin.
The emergence of central place theory has dominated the ideological framework of urban systems research for a long time. However, since the mid to late 20th century, with the accelerated flow of various factors, it has reshaped the global urban spatial pattern and challenged the logic paradigm of the original space. In this context, Alonso first proposed the concept of using the borrowing scale to elucidate the interactions of urban networks [4]. Subsequently, Friedmann [5] and Sassen [6] put forward hypotheses of world cities and global cities, respectively, establishing the theoretical foundation for the study of urban networks. The theory of flow space proposed by Castells further extends the concept of flow from virtual space to geographical space [7], marking a shift in the paradigm of urban research from hierarchical diffusion to multidimensional networks. From the central place theory and agglomeration externalities to network externalities, the urban network research focus has also shifted from urban hierarchy and agglomeration effects to network externalities that transcend geographic boundaries [8] (Figure 1).
In the process of urban networking, enterprises break geographical barriers through market-oriented activities, such as cross-city investments, joint ventures, and branch establishments, enriching intercity interactions. The network constructed based on enterprise connections naturally becomes the explicit representation of the urban networks, sparking a research trend of exploring the dynamic networks of cities through the multilocation organizational patterns of enterprises. Pioneering research was led by scholars such as Taylor, Derudder, and the GaWC group, who used APS enterprises as an example to translate enterprise connections into intercity connections [9,10,11,12,13]. They utilized the interlocking network model (INM) to analyze the formation, flow, and spatial characteristics of urban networks, thereby promoting the evolution and development of the enterprise translation model. These two scholars also proposed the central flow theory in their subsequent research [14]. The interaction between flow and spatiality is a key focus of research on enterprise flow, where one aspect involves the analysis of the regional urban spatial structure [15,16,17] and agglomeration effects [18] based on the analysis of enterprise flow connections. On the other hand, it explores how “flow” connects regional or global cities into a unified whole [19,20,21] and the role of cities in the flow networks [22]. Inspired by the research of the GaWC group, scholars continued to conduct urban network studies based on advanced producer services and explore urban networks at different spatial scales, such as investigating the relationship between global-scale transnational corporate production networks and urban networks [23], the spatial and nonspatial factors influencing the formation of global city regions [24], and the centrality characteristics of metropolitan flow at the urban scale [25]. On the other hand, they expanded their research to examine the internal dynamics of cities under different industry connections [26] or the process of integration into a global urban network [27]. Simultaneously, they deepened quantitative methods and foundational theory research on enterprise flow, for example, by complementing the INM’s response at various spatial scales [28] and exploring patterns of geographical centrality under enterprise flow [29].
In addition, Chinese scholars have primarily focused their research on all-industry enterprises and productive service industries. Their research has been focused on the national scale [30] or on specific regions, such as the Guangdong–Hong Kong–Macao Greater Bay Area [31,32,33], the Yangtze River Basin [34,35,36], and Northeastern China [37,38]. They have mainly utilized the INM to translate enterprise service values into urban connectivity matrices or quantify ownership structures as relational matrices. They have utilized methods such as social network analysis, multiple regression analysis, and spatial econometric models to analyze the mechanisms of urban network evolution. The research field has also expanded from focusing on changes in the internal network to the evolution of the external–internal network [39]. It has shifted from studying flow to examining the interaction between flow and spatiality [40]. Furthermore, the research focus has shifted from studying regional networks to analyzing the integration process of networks at different scales [41]. Additionally, aspects such as corporate collaboration networks [42], service recipients [43], equity investments [44], transaction activities [45], and more have been added to the research scope, thereby deepening the exploration of urban network externalities under enterprise flows. However, due to limitations in data availability and the distribution of large enterprises, previous studies have focused primarily on developed or relatively developed regions in the central and eastern regions of China, while the western regions have been relatively neglected. Additionally, the sole consideration of the number of enterprises, total branches, or investment relationships can easily overlook certain partial chains among enterprises. Furthermore, most research has tended to focus on the evolution of internal networks under the enterprise flows, while the study of the flow dynamics between internal and external networks has been relatively insufficient.
The Yellow River Basin is an important region for ecological protection in China. Since the proposal of the strategy for ecological protection and high-quality development, it has become a research focus area for Chinese geographers. The Ningxia Urban Agglomeration along the Yellow River, one of the urban agglomerations in the upstream region of the Yellow River, plays an intermediary role in connecting the upstream region and midstream region due to its geographical location. In addition, this region holds a strategic position in China’s energy development, while it also bears the important responsibilities of ecological civilization development, the manufacturing industry’s strategic position, and the construction of a leading area for ecological protection and high-quality development in the Yellow River Basin. In the era of high-quality development, China will promote new urbanization, with 19 urban agglomerations as the fulcrum. The trend of urban connection networks at multiple scales is becoming increasingly prominent, with the cross-regional spatial integration of various production factors and the coordinated development of cities taking the lead [46,47]. As a relatively underdeveloped region in China, the upstream region of the Yellow River plays a significant role in high-quality development. Coordinated development among cities in urban agglomerations and with external regions has important implications. Understanding the evolution of urban network structures and spatial influencing mechanisms of regional urban agglomerations under factor flow can provide important guidance for enhancing urban connectivity, cooperation, and coordinated development. Therefore, this paper takes the Ningxia Urban Agglomeration along the Yellow River as the research object and uses enterprise flows as an example. This is based on the branch–investment relationship, and we use the INM model to construct directed weighted matrices for the external and internal networks. By incorporating the social network analysis method, in this paper, we analyzed the structural characteristics of urban networks under different flow scenarios. Furthermore, we utilized spatial panel econometric models to analyze the influence mechanisms of different factors and their effects on external and internal network connections.

2. Study Area, Data, and Methods
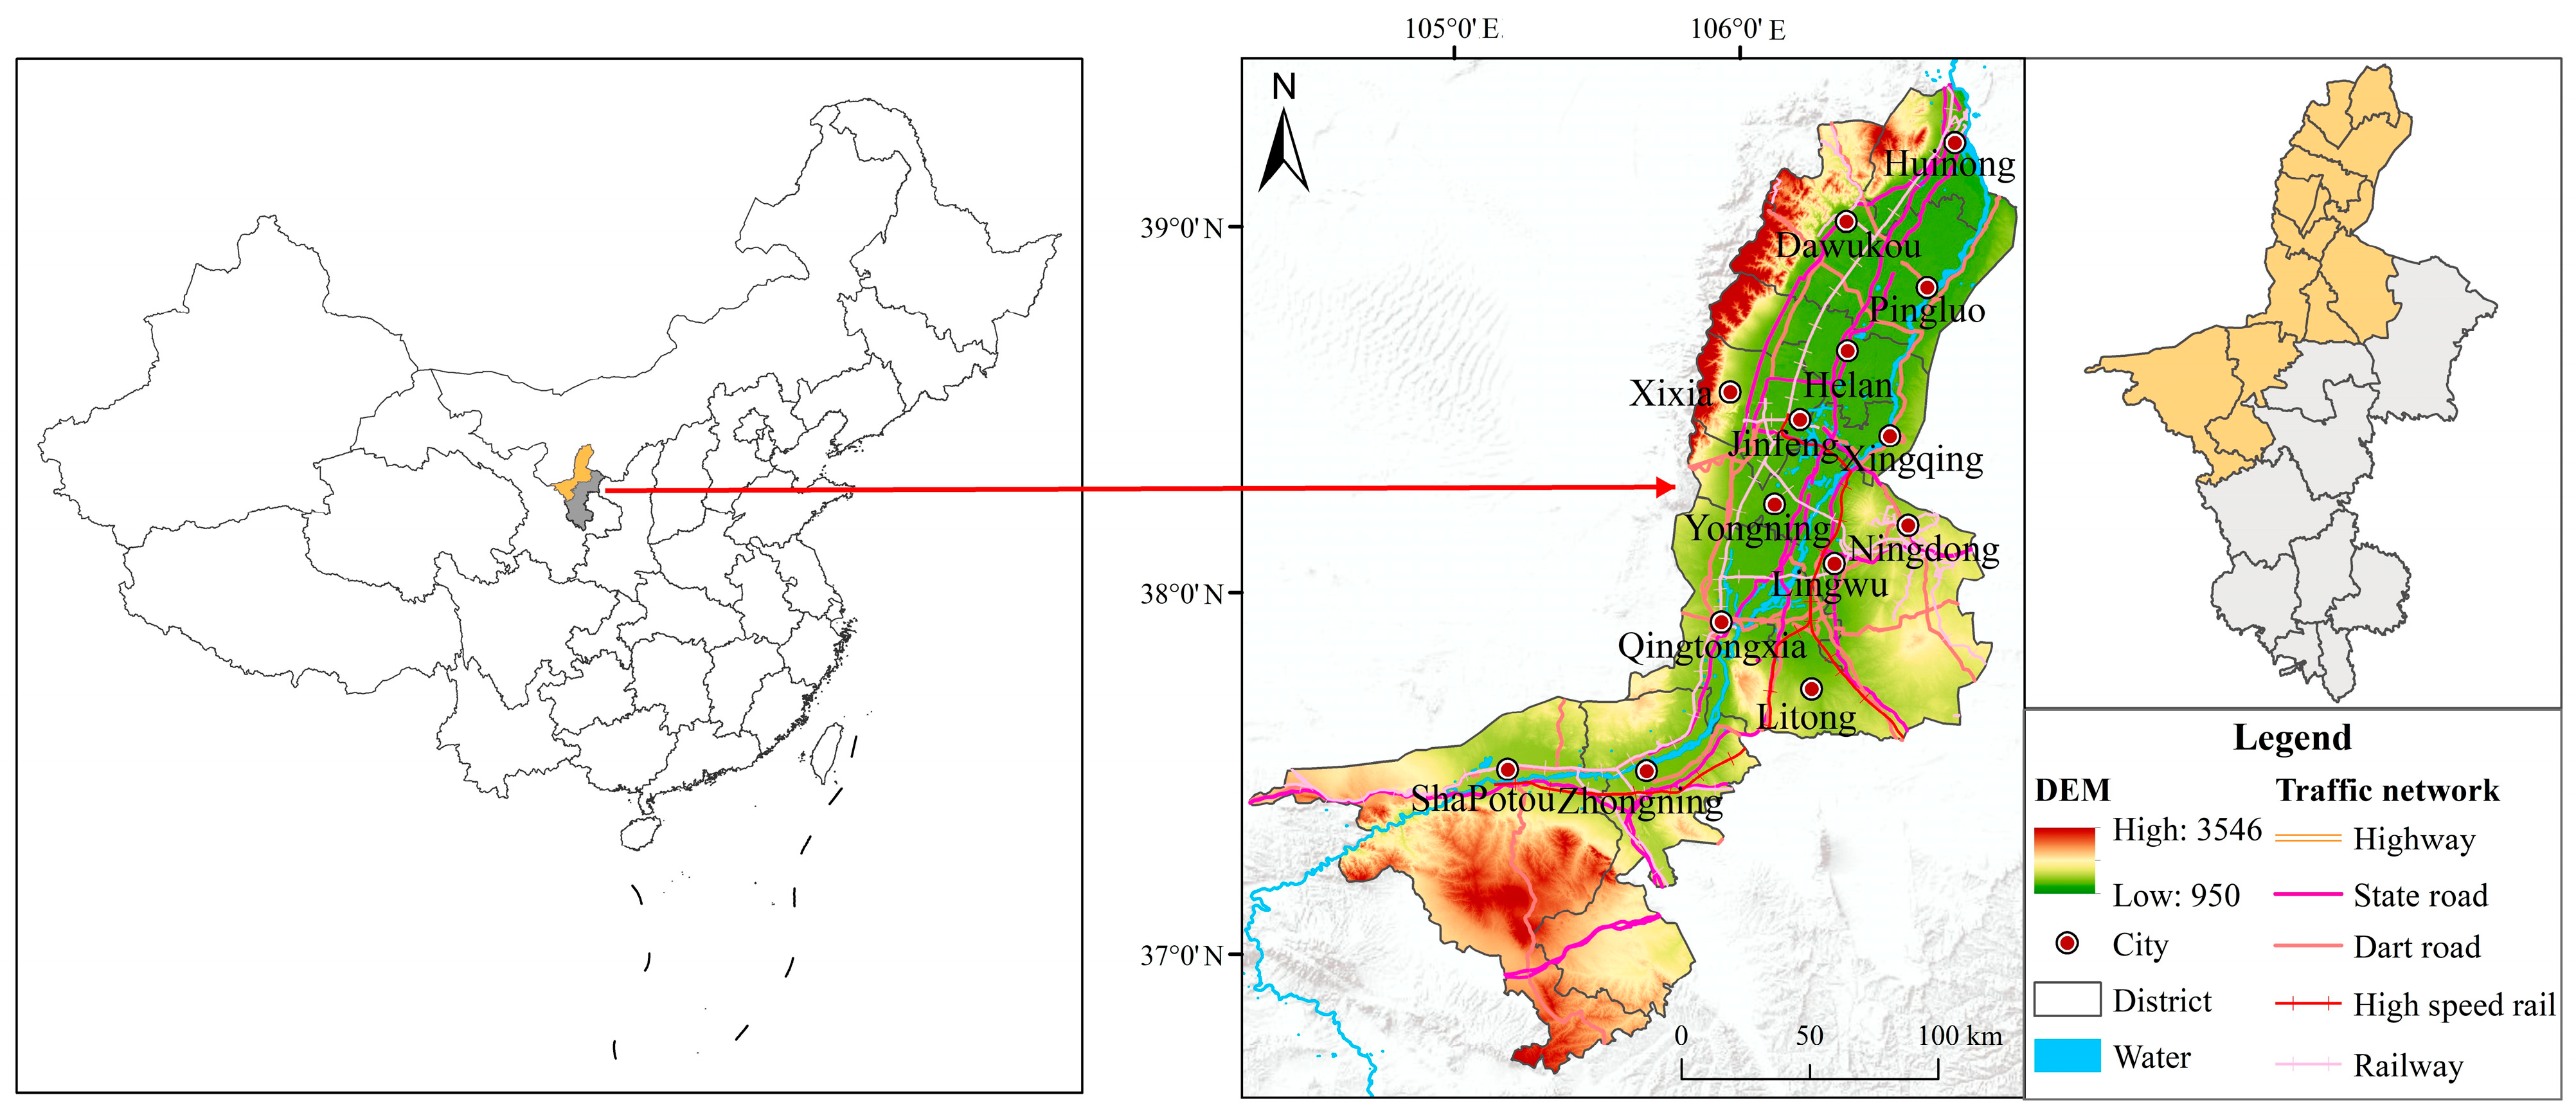
2.1. Study Area

The Ningxia Urban Agglomeration along the Yellow River is located in the oasis area of the northern part of the Ningxia Hui Autonomous Region, encompassing the Weining Plain and Yinchuan Plain in the upstream region of the Yellow River (104°22′ E–107°50′ E, 36°43′ N–39°22′ N) (Figure 2). According to the “Development Plan for Ningxia Along the Yellow River Economic Zone City Belt”, the Ningxia Urban Agglomeration along the Yellow River consists of 13 counties (as shown in Figure 1), including Jinfeng (JFQ), Xingqing (XQQ), Xixia (XXQ), Yongning (YNX), Helan (HLX), Lingwu (LWS), Litong (LTQ), Qingtongxia (QTX), Dawukou (DWK), Huinong (HNQ), Pingluo (PLX), Shapotou (SPT), and Zhongning (ZNX). It covers a total area of 22,700 km2, accounting for approximately 44% of the entire region. Considering that the Ningdong Energy and Chemical Base (ND) is an important concentration area for corporate headquarters in the region, it was included in the overall network analysis when analyzing urban network connections. However, due to the limitation of relevant data availability, when analyzing spatial influence mechanisms, it was incorporated into the Lingwu data at the county level.

2.2. Study Data

This paper initially collected business registration data from the Tianyancha platform for 2005–2021. Through spatial geocoding, industry classification, and filtering based on time utility, a total of 289,909 valid enterprises were obtained. Each data entry includes information such as the registered capital, company type, time utility, industry affiliation, and spatial coordinates. At the same time, referring to China’s National Economic Industry Classification, the 20 industries were reclassified into four types: living service industry, productive service industry, productive manufacturing industry, and other industries (Table 1). The social statistical data were sourced from the Ningxia Statistical Yearbook and various local social and economic statistical bulletins. The night light data were sourced from the DMSP_OLS and NPP_VIIRS series data of NASA. The NPP_VIIRS data were transformed into a fitted DMSP (2012–2020) dataset through calibration and fitting processes and then combined with the DMSP (2005–2020) dataset.

2.3. Research Methods

2.3.1. Enterprise Connections Value Assessment

After screening, a total of 38,158 enterprises with branch–investment relationships in the Ningxia Urban Agglomeration along the Yellow River during the study period were identified. By simply considering the number of enterprises, total branches, or investment relationships, one can easily overlook certain chains among enterprises. Due to limitations in the data attributes and the comprehensive consideration of inter-enterprise connections, in this paper, we constructed a standard system for valuing enterprises based on four aspects: registered capital, innovation potential, openness atmosphere, and capital utilization (Table 2). Among them, registered capital, to some extent, reflects the basic operational scale and project capacity of the enterprises; the Chinese Private Enterprises 500, Fortune China 500 list, and high-tech enterprises typically exhibit strong research and development capabilities, sustained investment in research and development, and innovation efficiency, while foreign-owned enterprises, as well as holding or joint ventures from Hong Kong, Macau, and Taiwan, reflect the regional policy environment and their ability to utilize foreign investment. Furthermore, these enterprises can enhance their interaction with the external market and create a favorable atmosphere of openness through their engagement with foreign capital and leveraging foreign relationship networks. Listed companies, corporate groups, and state-owned enterprises have strong capital, financing capabilities, and operational abilities. They possess significant advantages for capital utilization.

2.3.2. Enterprise Interlocking Network Model

Drawing on the principles of graph theory, cities were treated as nodes, and the branch–investment connections between cities’ enterprises were assigned as edge weights. By constructing a directed weighted matrix using the enterprise interlocking network model, the directionality and weightage of urban network connections were represented. Subsequently, based on the spatial scale of the external and internal network connections, a network of enterprise connections was constructed among the 14 cities within the Ningxia Urban Agglomeration along the Yellow River and with other provinces outside the region. The spatio-temporal dynamics of urban network connections were analyzed from the perspectives of the external and internal networks. The calculation formula for the enterprise interlocking network model is as follows.
V i j = [ ( v a i × v a j ) / 5 ] + v b i + v c i + v d i
C S ( i ) = i = 1 n V i j + i = 1 n V j i
In the equation, CS(i) represents the urban connectivity of the external or internal network of city i. Vij represents the enterprise connection value between the investing company or parent company in city i and the contacting institution or branch in city j, while Vji represents the reverse case (ij). vai and vaj represent the assigned registered capital values for the investing company or parent company and the contacting institution or branch. Since the registered capital of the enterprise considers both the parent and subsidiary companies, it is calculated by multiplying the assigned registered capital values for the parent and subsidiary companies and then dividing the result by 5. This ensures that the evaluation of this indicator carries equal importance to other factors. vbi indicates whether the investment target or branch institution belongs to China’s Top 500 Enterprises or high-tech enterprises, considering the innovation potential of the company. vci indicates whether the investment target or branch institution belongs to foreign-invested, Hong Kong, Macau, or Taiwan joint ventures, considering the company’s openness and business environment. vdi indicates whether the investment target or branch institution belongs to listed companies, enterprise groups, or state-owned enterprises, considering the company’s capital utilization capability.

2.3.3. Social Network Analysis Method

Due to the advantage of the social network analysis method in depicting the interactive characteristics of network nodes, in this study, we selected indicators of urban connectivity and the dominant connection direction (Table 3) to comprehensively measure the structural features of urban networks under enterprise relationships. Among them, urban connectivity measures the positions of cities in different networks, while the dominant connection direction reflects the symmetry of interactions between cities.

2.3.4. Spatial Panel Econometric Model

(1)
Spatial weight matrix. In this study, we constructed two types of spatial weight matrices. The first type is the geographic distance weight matrix, which is calculated based on the driving distance between each city obtained from the Amap (a Chinese mapping service). It was constructed by using the reciprocal of the driving distance (Formula (3)). The second type of economic distance weight matrix was constructed based on the inverse of the per capita GDP difference between cities (Formula (4)). The formulas are as follows:
W i j 1 = 1 / D ij
W i j 2 = 1 / | G D P ¯ i G D P j ¯ |
where Dij represents the driving distance between city i and j, and G D P ¯ i and G D P j ¯ are the average per capita GDP values of cities i and j.
(2)
Spatial Dubin Model (SDM). To improve the accuracy of the regression results, in this study, we estimated the SAR (Spatial Autoregressive), SEM (Spatial Error), and SDM (Spatial Durbin) models, which consider spatial effects for estimation. These models were compared with LM (Lagrange Multiplier) and LR (Likelihood Ratio) results. The findings indicate that the regression effects are relatively better with the SDM. Furthermore, a Wald test was conducted to compare the models, and the p-value for the SDM was significant at the 1% level, suggesting that the SDM cannot be reduced to the SAR or SEM models. Finally, a Hausman test was performed, and the test results show a p-value of less than 0.05, thereby failing to reject the null hypothesis. Therefore, in this paper, the SDM with two-way fixed effects was chosen to investigate the influence mechanisms of external network connections and internal network connections. Considering the lagged effect of macro urban development on enterprises and its influence on the construction of enterprise network connections, the independent variables were lagged by one period. The formula used was as follows:
ln ( Y i , t ) = ρ j = 1 n W i j ln ( Y i , t ) + β ln ( X i , t 1 ) + j = 1 n W i j ln ( X i , t 1 ) γ + u i + λ t + ε i , t
In the equation: Yi,t represents the total connectivity value of the external and internal networks for each node. Xi,t−1 represents the various influencing factors of city i in year t − 1. ρ is the spatial lag regression coefficient, which indicates that the external and internal network connectivity of neighboring cities influences the external and internal network connectivity of the focal city. γ is the coefficient of spatial lagged regression for the independent variable. μi represents fixed spatial effects. λt represents fixed time effects. εi,t is the spatial autocorrelation error term. Wij is the spatial weight matrix. Wijln(Yi,t) represents the ln(Yi,t) of city i on the ln(Yi,t) of neighboring cities. Wijln(Xi,t−1) represents the ln(Xi,t−1) of city i on the ln(Xi,t−1) of neighboring cities.

3. Evolutionary Characteristics of the Enterprise Flow Structure

Research on urban networks from the perspective of enterprise flows has mainly focused on the productive service industry. However, the Ningxia Urban Agglomeration along the Yellow River is an important region for receiving the transfer of manufacturing industries from central and eastern China. The urban network connections formed under the flows of the productive service industry and productive manufacturing industry exhibit differences. Therefore, in this study, we primarily conducted a spatiotemporal dynamic analysis of regional urban network connections, focusing on the overall connections, productive service industry connections, and productive manufacturing industry connections. This study aims to describe the homogeneity and heterogeneity of urban network connections.

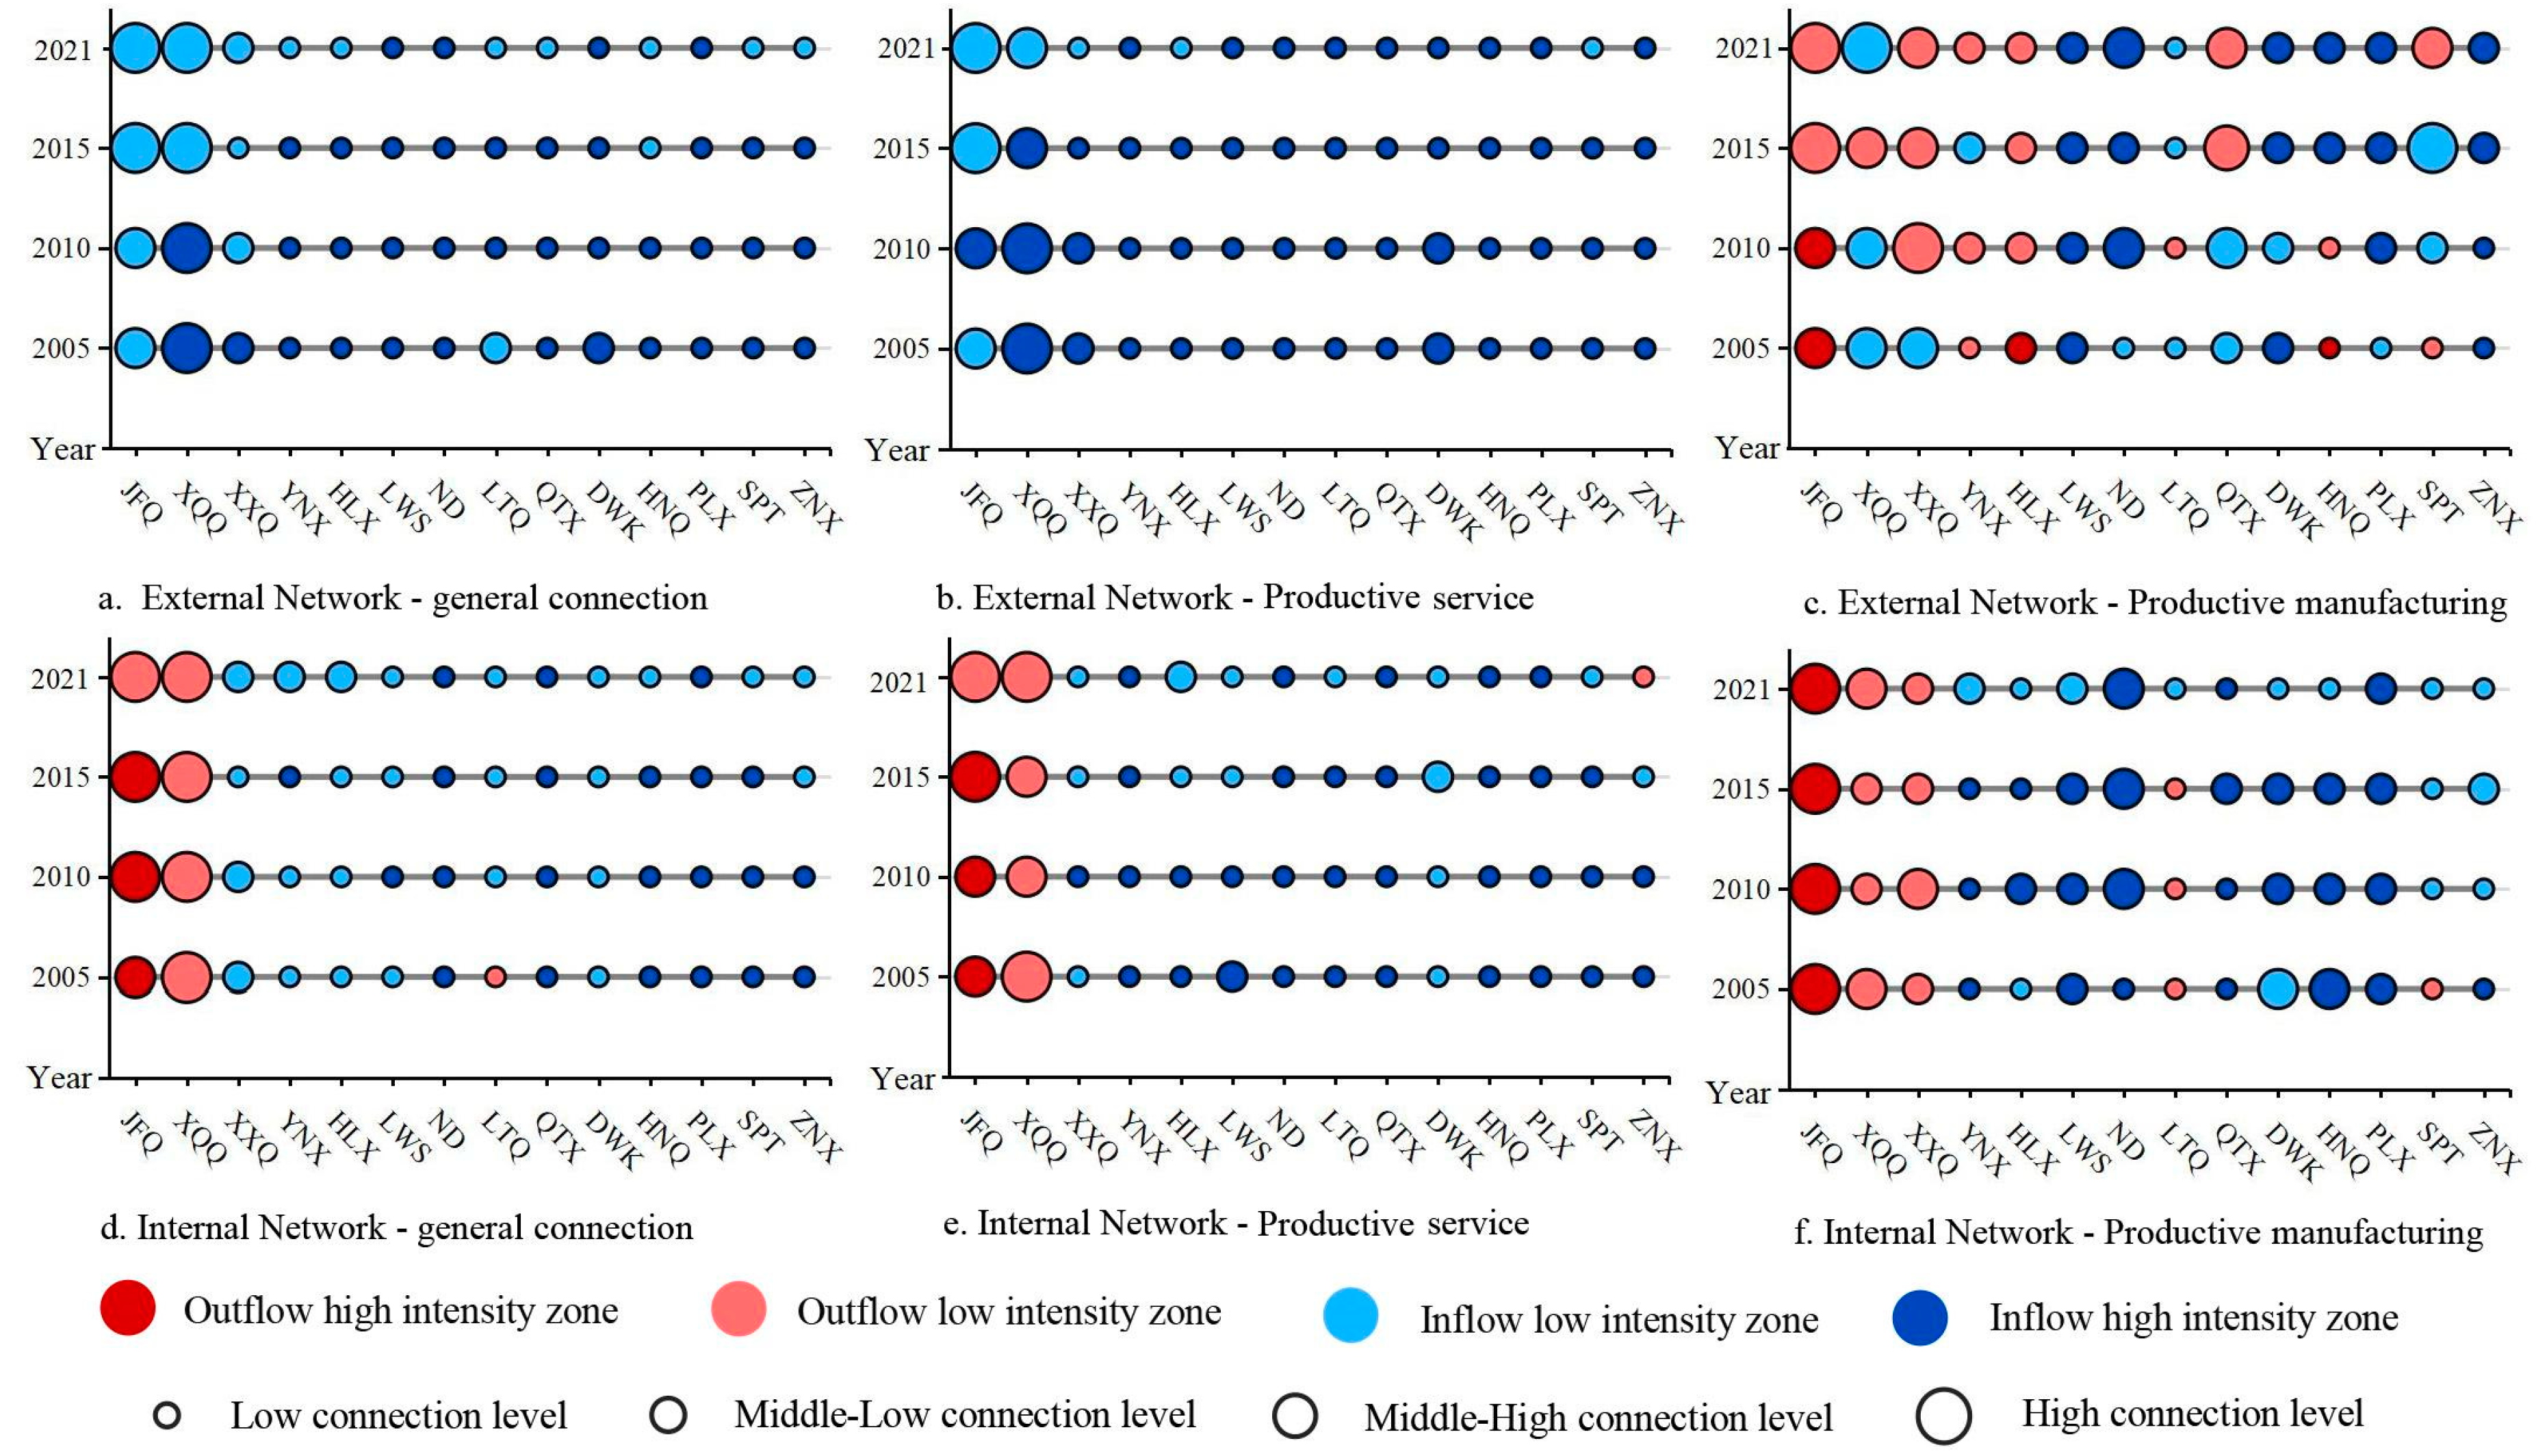
3.1. The Enterprise Flow Connections in the External Network

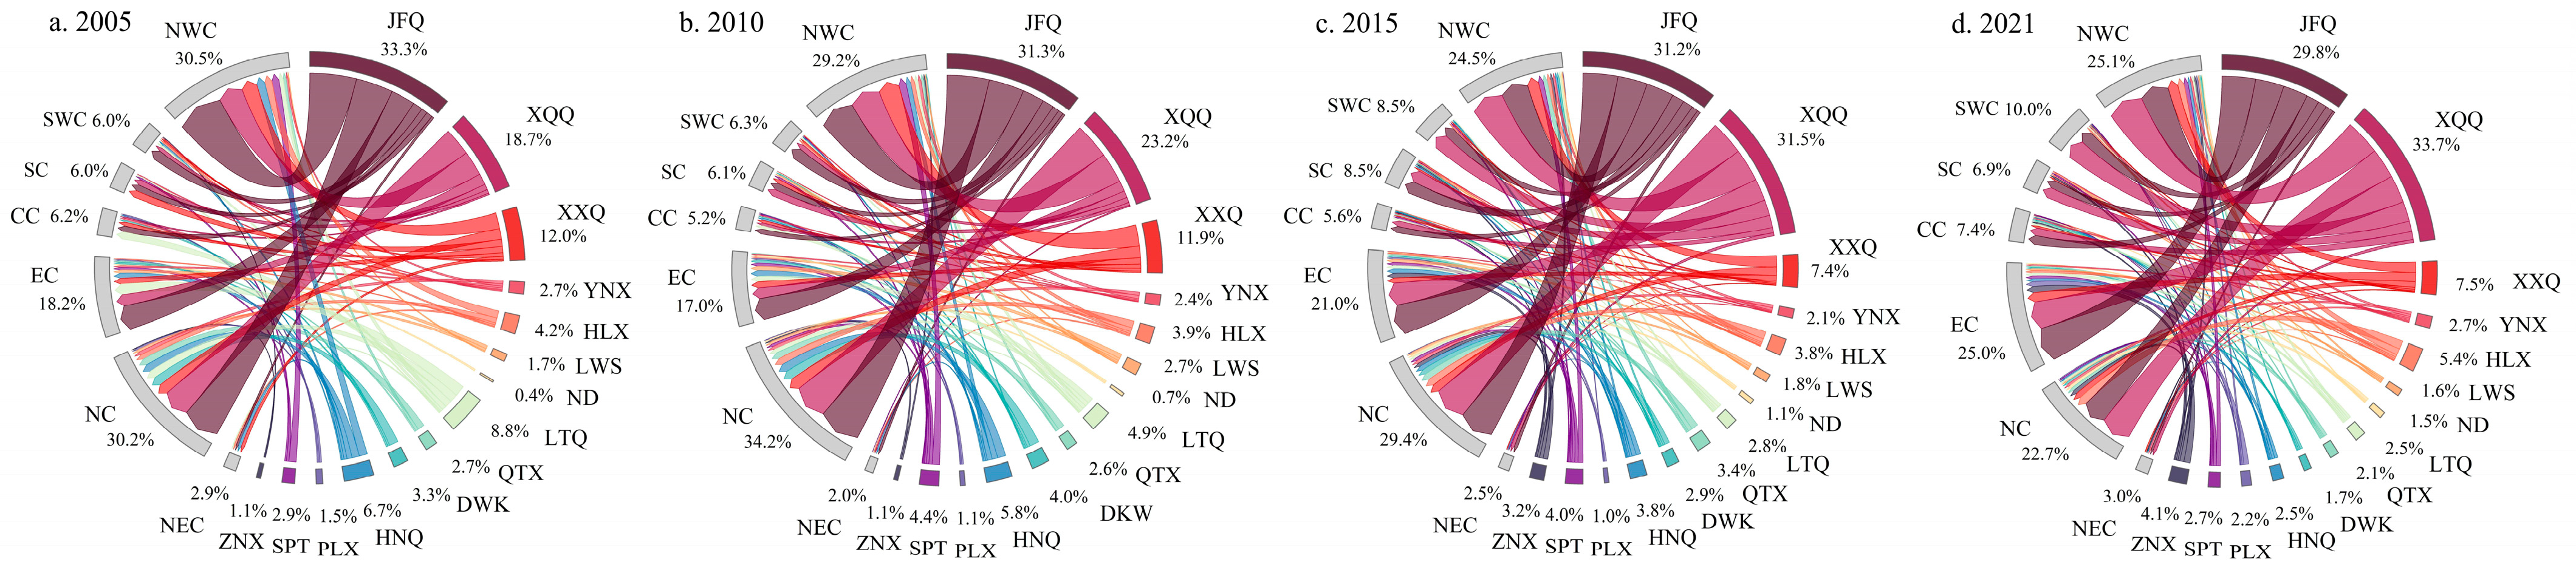
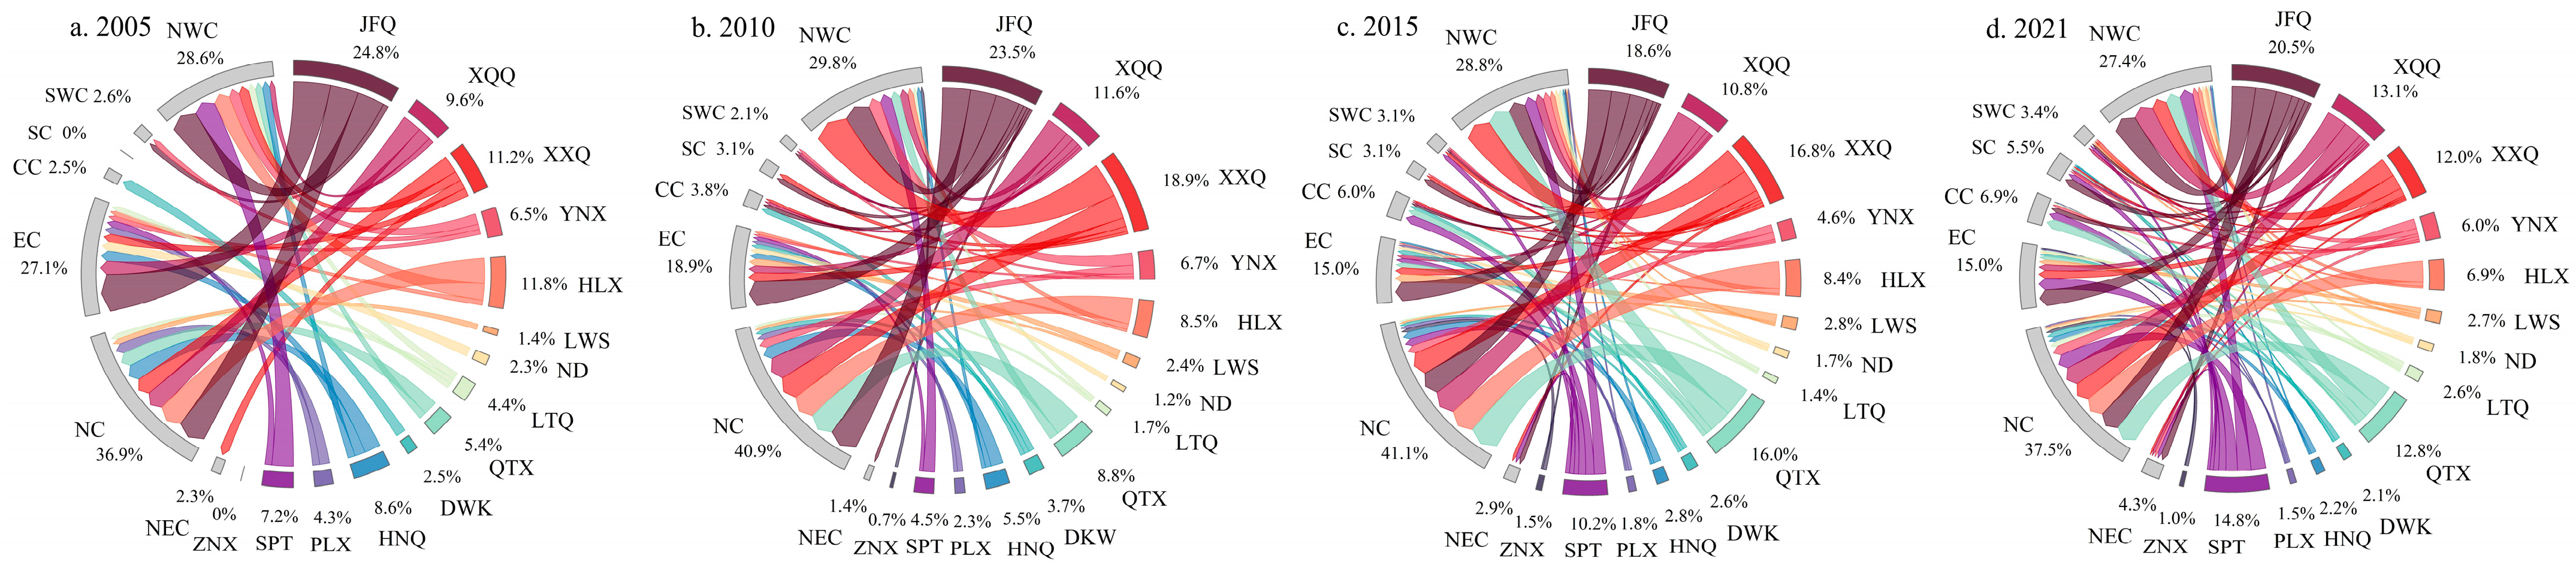
3.1.1. The Enterprise Outflow Connections in the External Network

Origin software was used to visualize the enterprise outflow connections in the external network and compare the changes at four time points, namely 2005, 2010, 2015, and 2021. Regarding the evolution of the overall pattern of enterprise outflow connections (Figure 3), the Ningxia Urban Agglomeration along the Yellow River exhibited a spatial organizational structure characterized by a single polar outflow investment source and a diversified inflow of investment recipients. From the perspective of outflow investment sources, the core area consisting of Jinfeng and Xingqing maintained an outflow proportion of over 50%, dominating the discourse power in the regional outflow investment scenario. In comparison to the core area, the external connectivity of Xixia, Litong, and Huinong was relatively weakened. With outflow investments from energy companies, the outflow proportion of Shapotou increased from 2.9 to 5.5%. The changes in other nodes were not significant. In terms of the investment destination selection, the proportion of enterprise outflow to North China, East China, and Northwest China remained above 70%, especially with the outflow proportion to East China increasing from 18.2 to 23.7%. Beijing, Inner Mongolia, Shanghai, Shandong, Jiangsu, Shaanxi, Gansu, and Guangdong are the main investment destinations for enterprises in the Ningxia Urban Agglomeration along the Yellow River.
Comparing the outflow patterns of the productive service industry and productive manufacturing industry (Figure 4 and Figure 5), the evolution of the enterprise outflow in the productive service industry is generally consistent with the overall outflow pattern of regional enterprises. However, significant differences can be observed in the case of the productive manufacturing industry. On one hand, the outflow sources are becoming more diversified with the external investment activities of regional manufacturing enterprises gradually shifting from being dominated by Jinfeng, Xingqing, Xixia, Qingtong, and Shapotou. On the other hand, the proportion of outflow to the East China region decreased from 27.1 to 15.0%, while investments in the North China region and the Northwest China region continued to dominate.

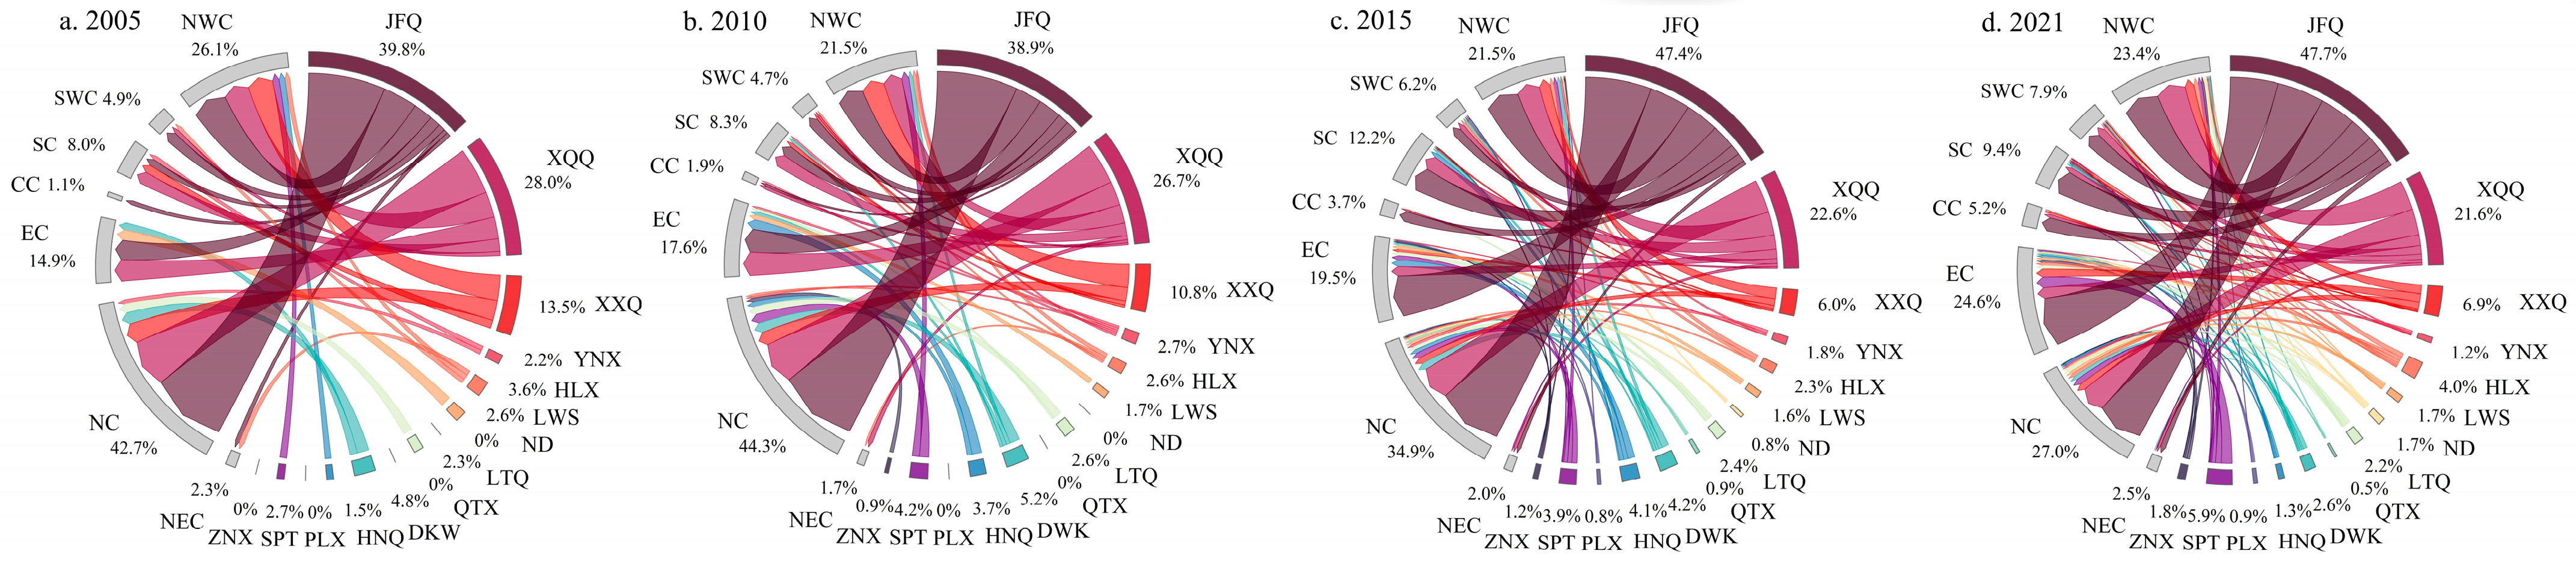
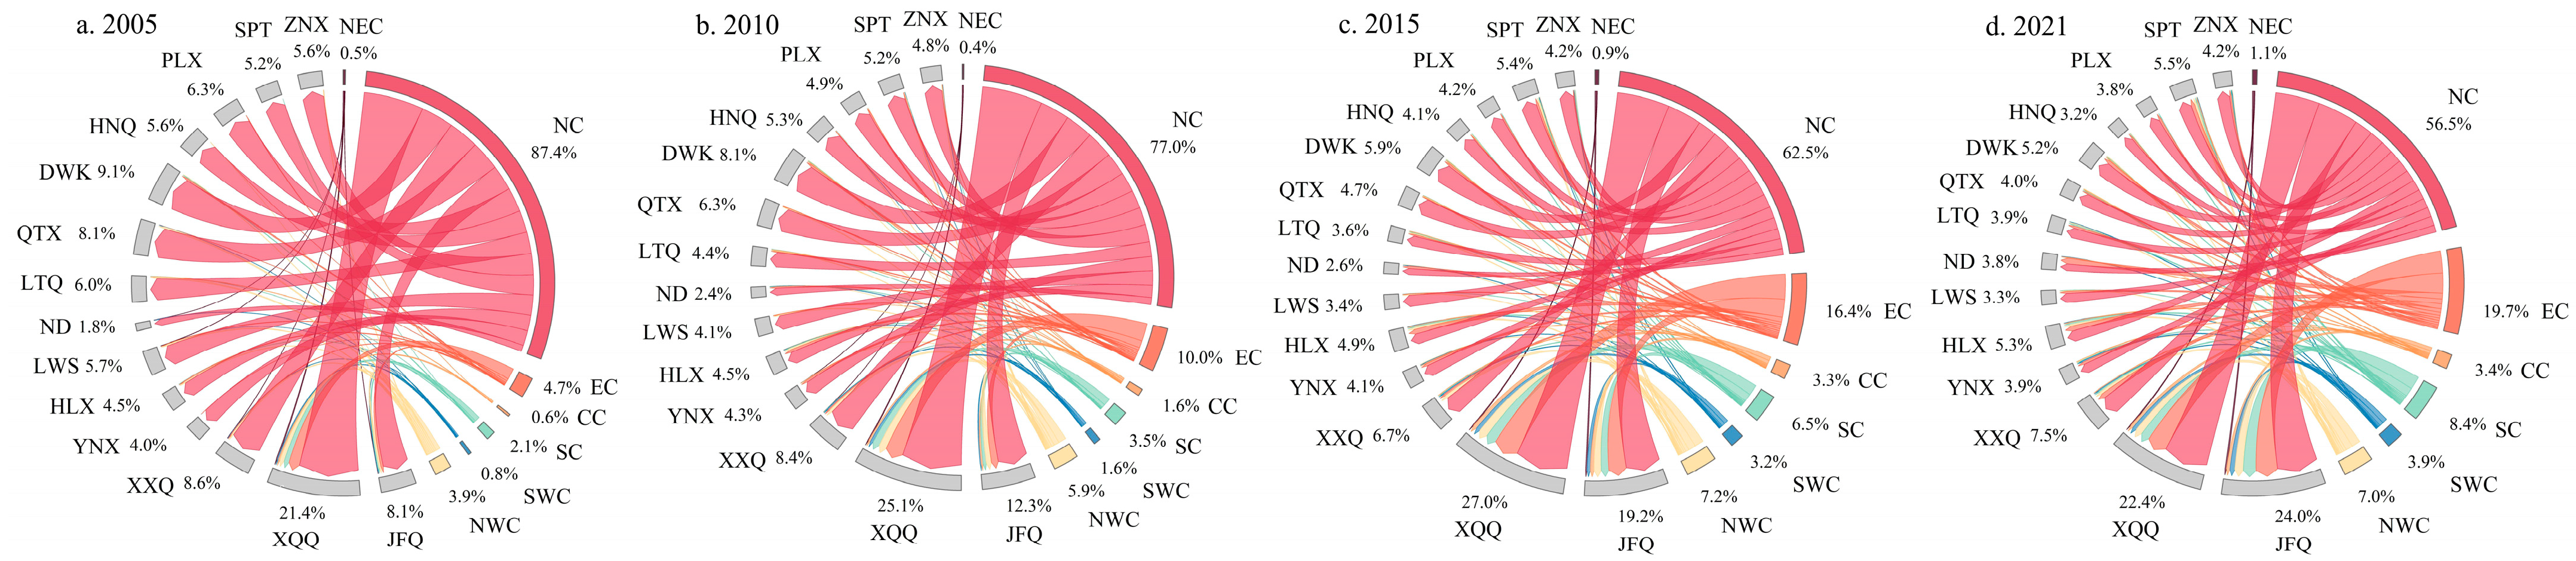
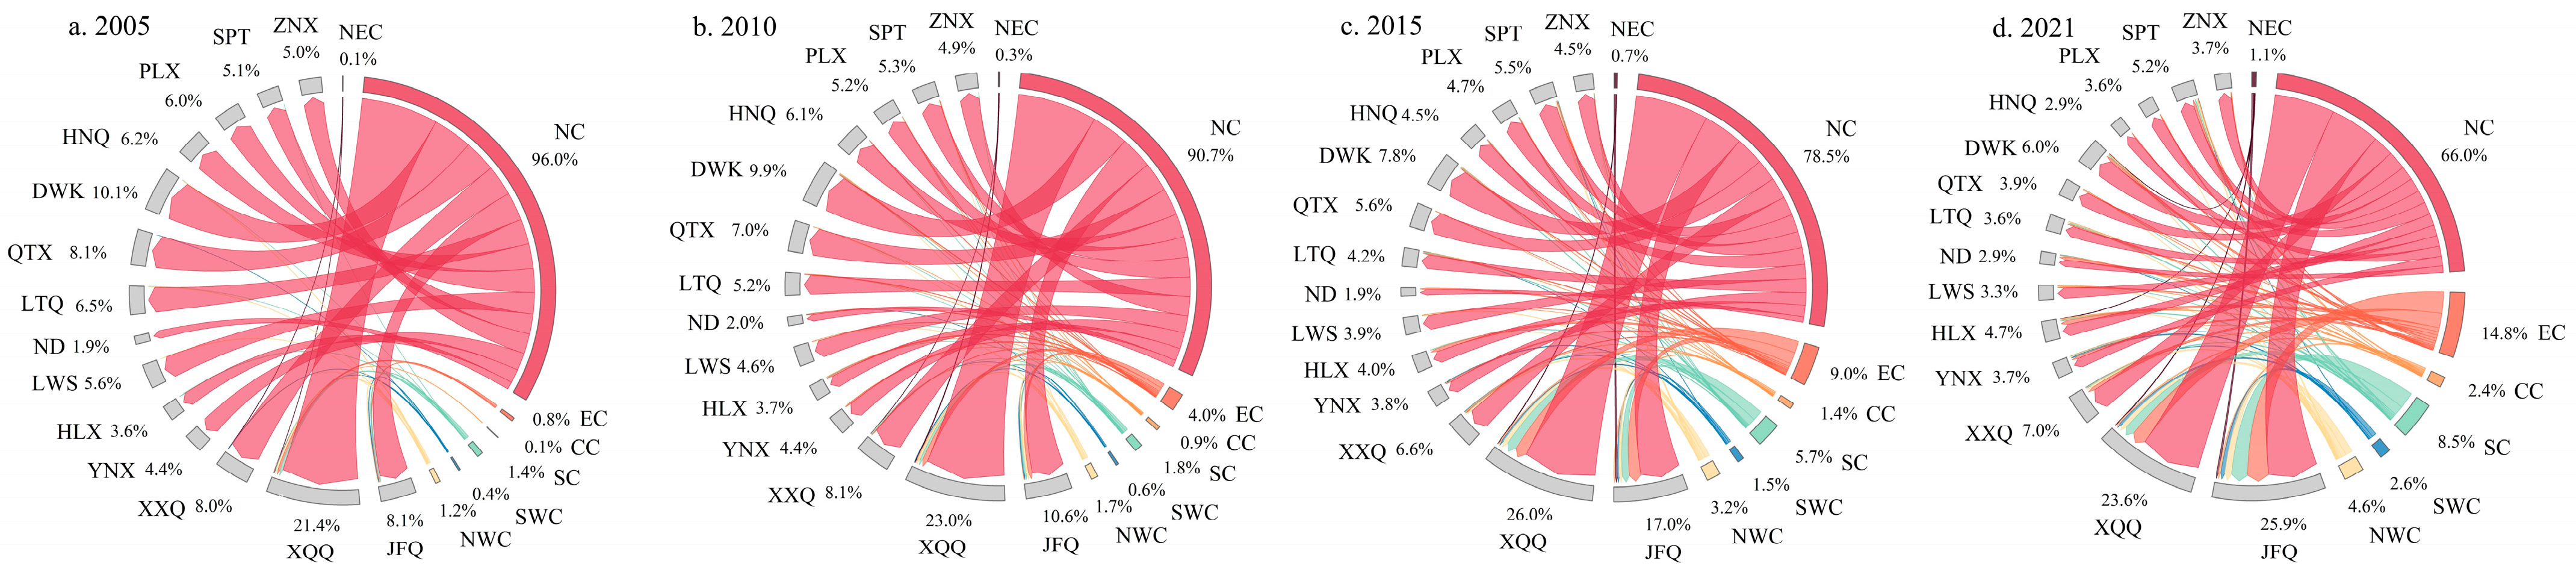
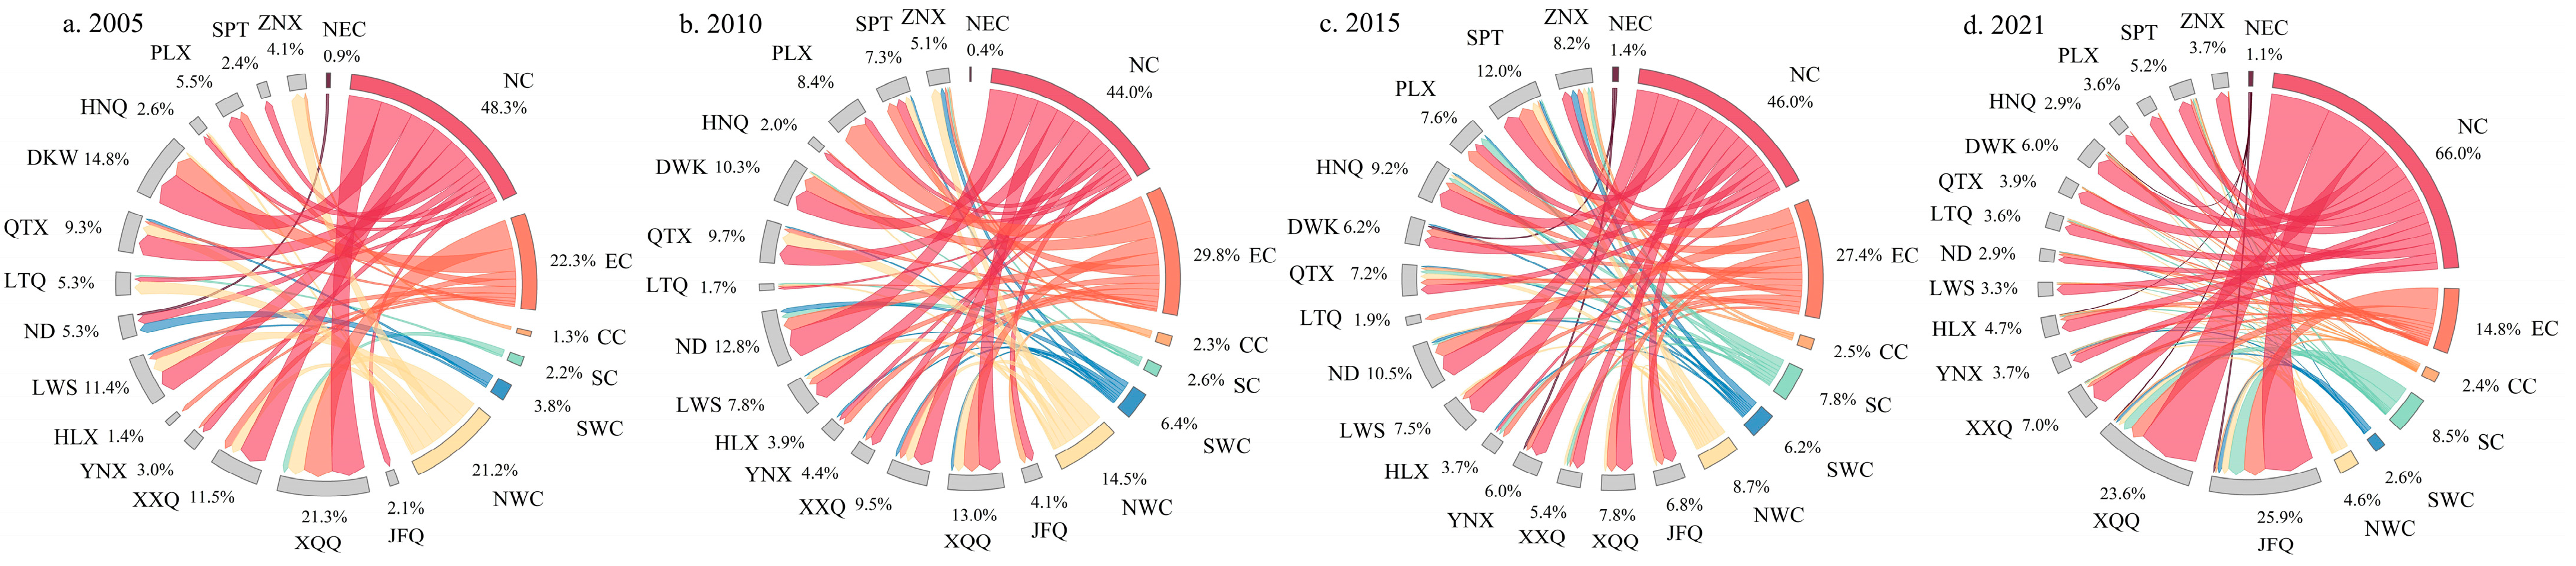
3.1.2. The Enterprise Inflow Connections in the External Network

Regarding the evolution of the overall enterprise inflow pattern in the external network (Figure 6), it was found that the inflow of external network enterprises formed a spatial pattern of diversified inflow sources and concentrated inflow destinations. From the perspective of inflow sources, from 2005 to 2021, the inflow proportion of North China decreased from 87.4 to 56.5%, while the proportion of East China increased from 4.7% to 19.7%. The inflow proportions of Central China, South China, Southwest China, and Northwest China also increased to 3.4%, 8.4%, 3.9%, and 7.0%, respectively. The changes in Northeast China were relatively small. On the whole, the inflow sources formed a multisource structure dominated by North China and East China.
In the evolution of inflow destinations, the most significant change was the increase in the inflow proportion to Jinfeng from an initial 8.1% to 24.0%. The inflow proportion of Xingqing remained relatively stable at around 25%. The inflow proportions of other areas underwent small and relatively weak changes. Overall, a spatial pattern of enterprise inflow aggregation formed, with Jinfeng and Xingqing being the core areas.
When comparing the inflow patterns of the productive service industry and the productive manufacturing industry (Figure 7 and Figure 8), the inflow pattern of the productive service industry followed the evolution of the overall enterprise inflow. However, in the case of the productive manufacturing industry, the dominant inflow destinations were not exclusively from North China. The inflow proportions of North China and Northwest China decreased from 48.3% and 21.2% to 38.9% and 7.2%, respectively. In contrast, the inflow proportions of East China and South China increased from 22.3% and 2.2% to 35.8% and 7.7%, respectively. Overall, the inflow sources exhibited a spatial organizational structure controlled jointly by North China and East China. Due to factors such as industrial transformation and upgrading, the decline of traditional manufacturing industries (such as coal, thermal power, petrochemicals, etc.), and the adjustment of internal manufacturing base layouts, the enterprise inflow evolved from being primarily directed towards Xingqing, Xixia, Lingwu, Qingtongxia, and Dawukou to a spatial organizational pattern driven by multiple cities. Among them, the inflow proportions of Ningdong and Xingqing exceeded 10%.

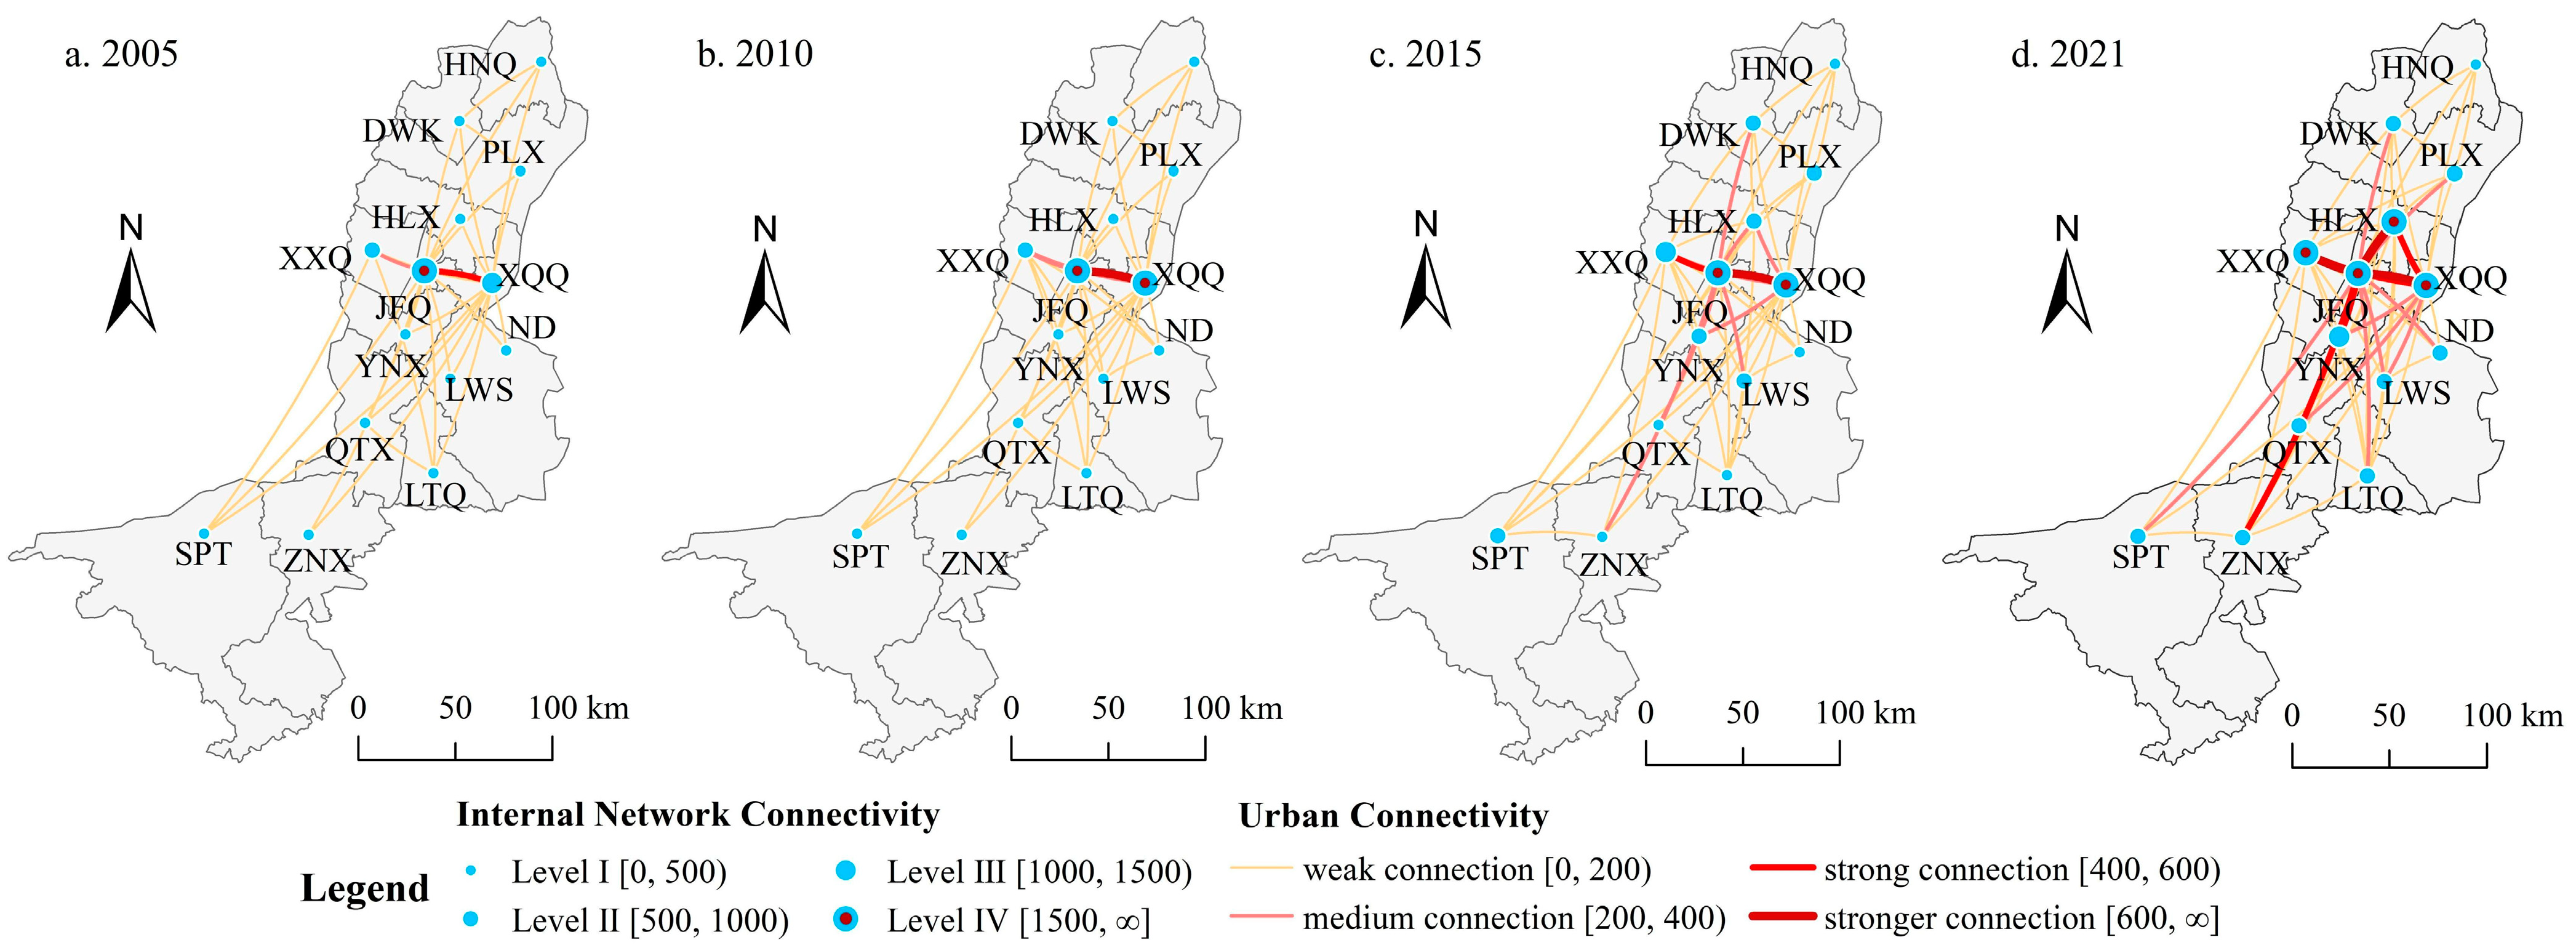
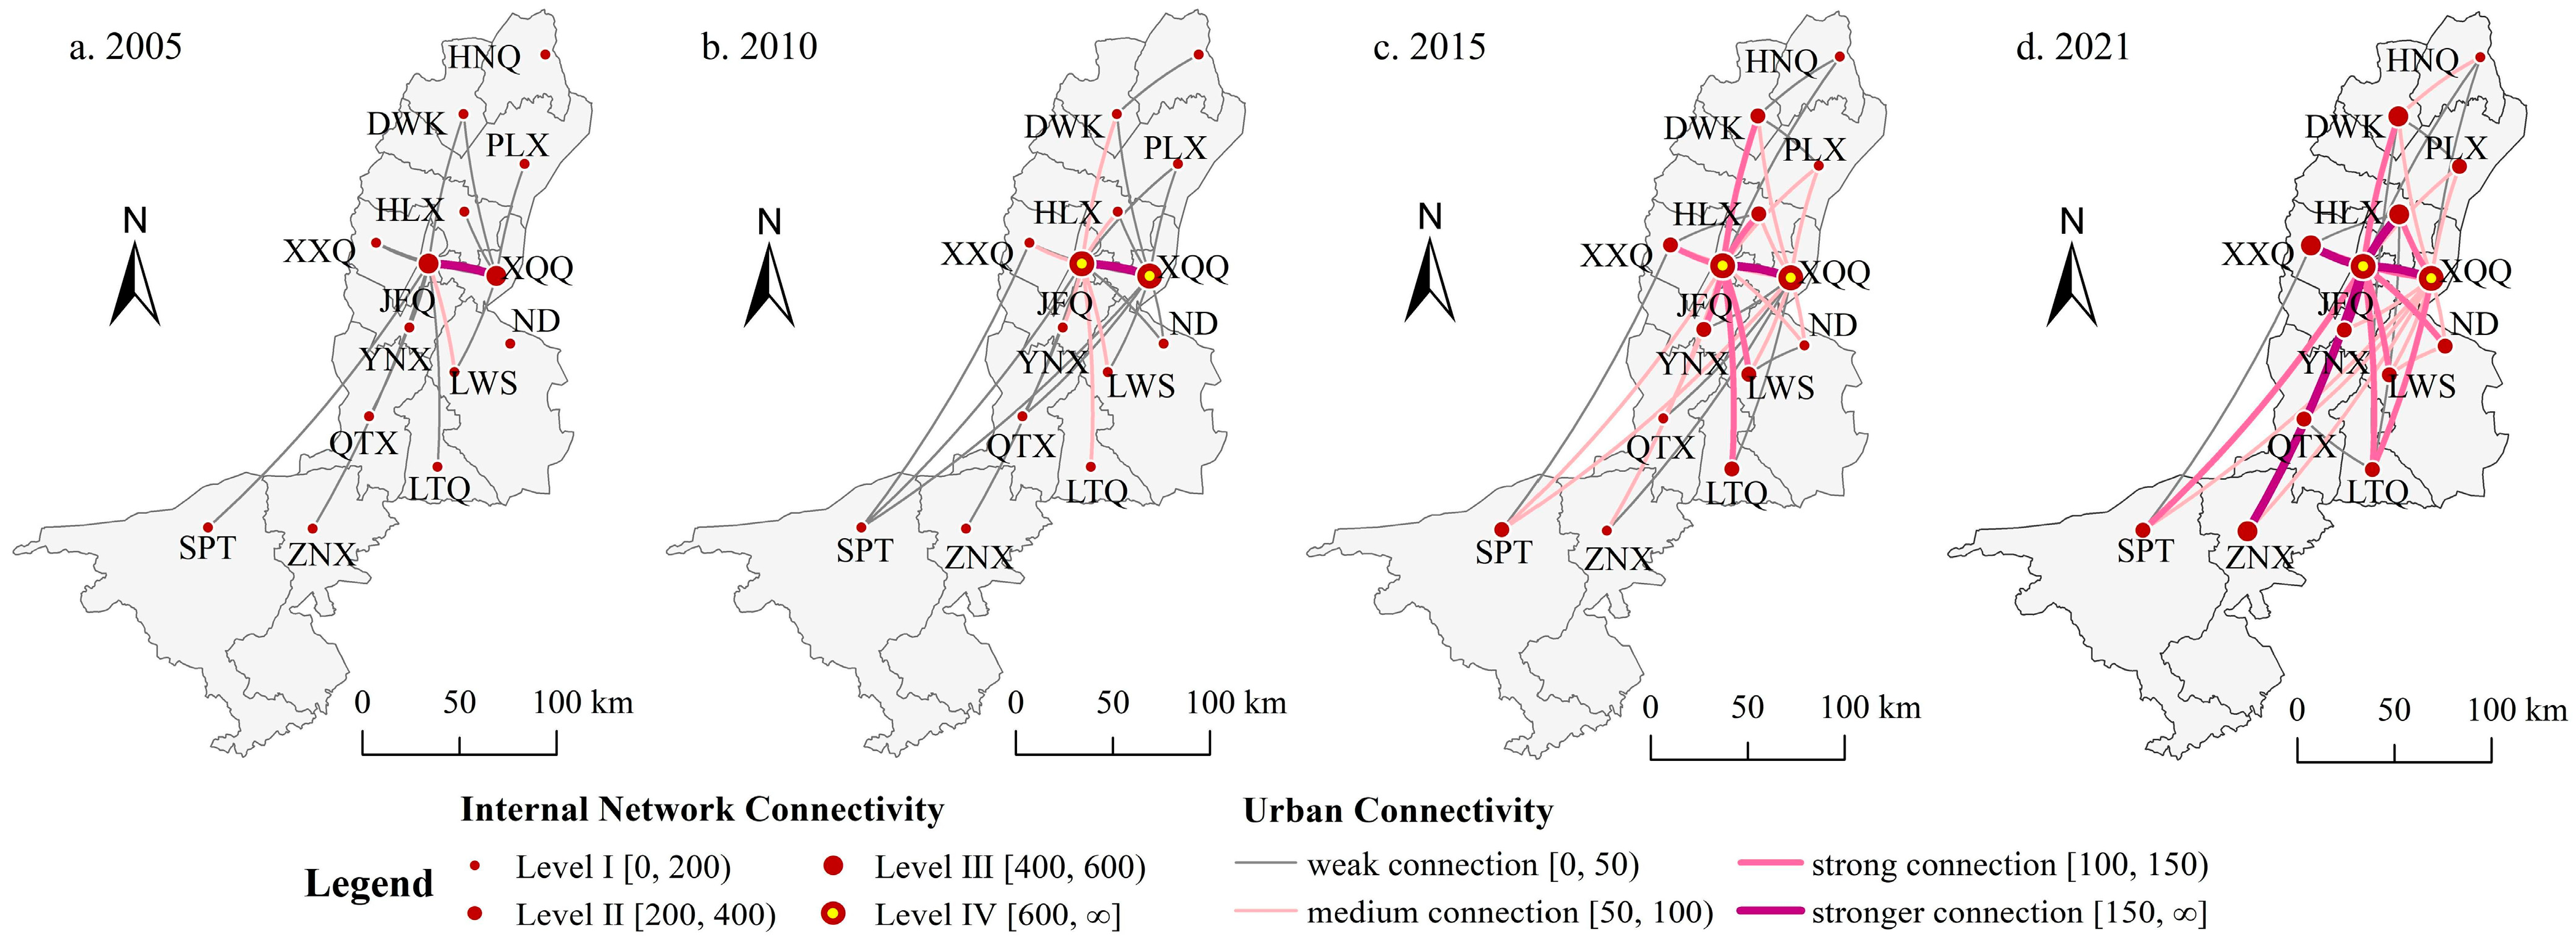
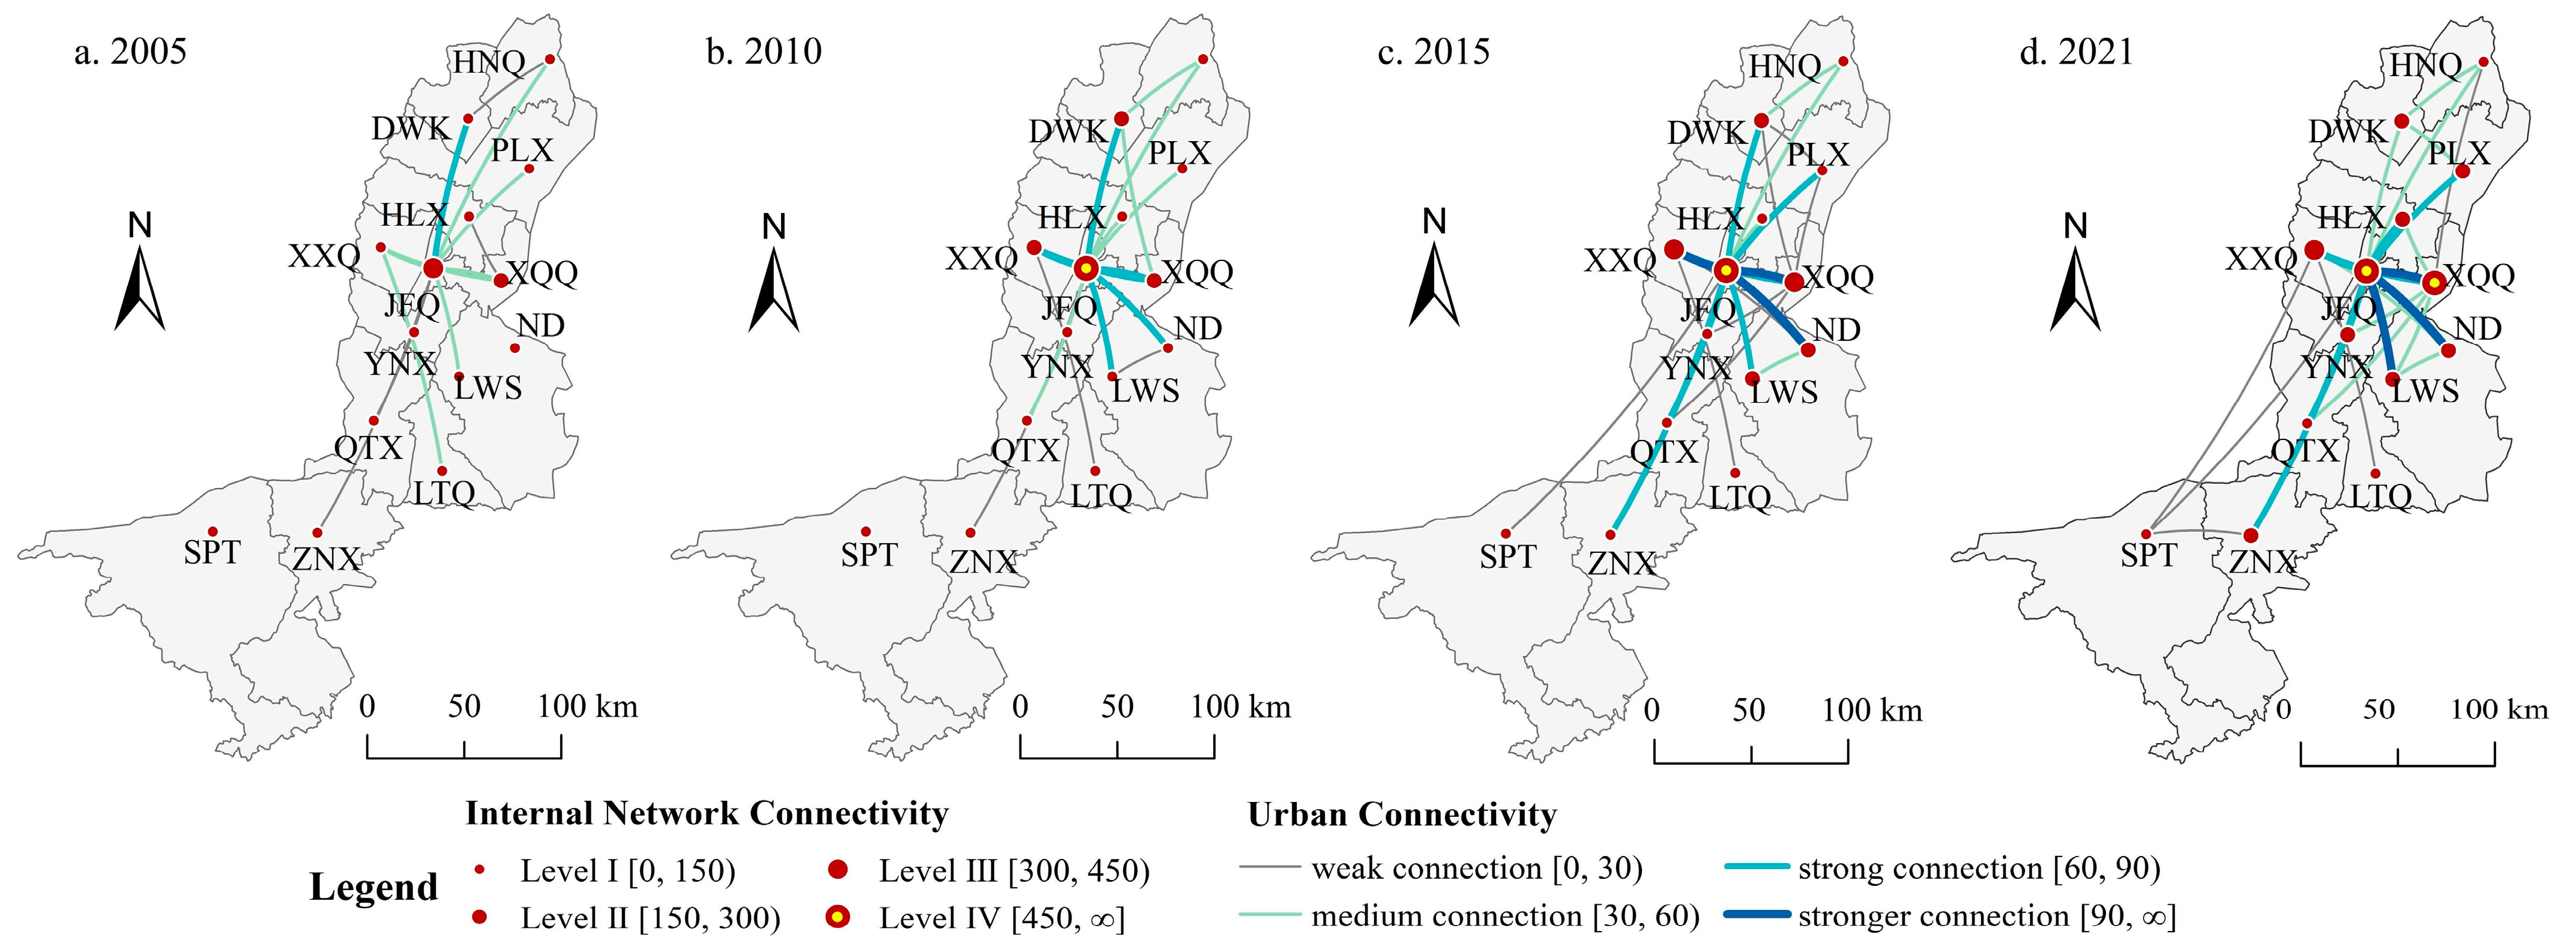
3.2. The Enterprise Flow Connections in the Internal Network

To objectively depict the evolution of enterprise flows within the internal network, an equal interval method was used to categorize the internal network connectivity and urban connectivity. Looking at the evolution of internal network enterprises’ overall flows (Figure 9), a concentric connectivity structure forms, with Jinfeng and Xingqing at its core. Additionally, the interconnections between urban nodes are strengthened. The strong connections and stronger connections, initially limited to the areas between Jinfeng and Xingqing, evolved into a diamond-shaped spatial pattern characterized by strong interactions among Jinfeng, Xingqing, Xixia, Yongning, and Helan. By 2021, on one hand, the internal network connectivity structure evolved from Level IV-1/Level III-1/Level II-1/Level I-11 to Level IV-4/Level III-1/Level II-8/Level I-1. The internal network connectivity of Jinfeng, Xingqing, Xixia, and Helan reached Level IV, forming a radiating network structure with these four areas as the core. On the other hand, the overall spatial network connectivity was unbalanced, with the radiating influences of Jinfeng and Xingqing, mainly on the surrounding cities, failing to exert positive driving effects on the northern and southern regions. As a result, the development gap between the urban nodes in these regions and the core nodes gradually widened. In addition, apart from maintaining active connections with the core nodes, the communication between other adjacent nodes is weak. Overall, the structure exhibits spatial polarization characteristics and an imperfect hierarchical system, with a strong influence of core nodes confined in the core district.
The enterprise flow in the productive service industry is relatively active (Figure 10). The internal network connectivity structure evolved from Level IV-0/Level III-2/Level II-0/Level I-12 to Level IV-2/Level III-4/Level II-7/Level I-1. The radiation impact of JinFeng and Xingqing spread to the northern and southern regions and also drove the upgrade of internal network connectivity in Xixia, Helan, Dawukou, and Zhongning. However, in the productive manufacturing industry (Figure 11), the enterprise flow was relatively concentrated, and the internal network connectivity structure evolved from Level IV-0/Level III-1/Level II-1/Level I-12 to Level IV-2/Level III-1/Level II-7/Level I-4. The strong connections and stronger connections shifted from being between JinFeng and Dawukou in the early stage to being between JinFeng, Xingqing, Ningdong, and Lingwu. Production manufacturing further concentrated the productive functions towards the eastern manufacturing bases, strengthening the flow of important manufacturing enterprises in the internal network.

3.3. Network Structural Changes

The dominant connection direction and the urban connectivity for each node in the external–internal network were calculated (Figure 12). The dominant connection direction was classified into the outflow high intensity zone (NSIi ∈ [0, 0.5)), outflow low intensity zone (NSIi ∈ [0.5, 1.0)), inflow low intensity zone (NSIi ∈ [1.0, 1.5)), and inflow high intensity zone (NSIi ∈ [1.5, 2.0)). The urban connectivity was classified into the low connection level (Ii ∈ [0, 0.5)), middle–low connection level (Ii ∈ [0.5, 1.0)), middle–high connection level (Ii ∈ [1.0, 1.5)), and high connection level (Ii ∈ [1.5, 2.0)).
In the external network, the Ningxia Urban Agglomeration along the Yellow River is still in the early stage of development, with the absorption of external elements being used to cultivate development momentum. In terms of the overall connectivity and connectivity of the production service industry, cities are in a state of net inflow, with the attractiveness of Jinfeng and Xingqing being far ahead. The urban connectivity of both cities is mainly at the high connection level or middle-high connection level. The network node connectivity structure in the productive manufacturing industry exhibits a diverse organizational pattern. While cities enhance their own production and manufacturing capabilities by absorbing external manufacturing elements, they also achieve enterprise outflow through industrial integration. For example, Jinfeng, Xixia, Yongning, Helan, Qingtongxia, and Shapotou transitioned to inflow low intensity zones through industry connections.
In the internal network, Jinfeng and Xingqing were always been the radiating sources in the regional network and exert influence on various nodes, but their driving capacity is weak. The division of production management and manufacturing functions prompted manufacturing enterprises to establish their management departments in Jinfeng and Xingqing while locating their production departments in Yongning, Lingwu, Ningdong, and Pingluo. This strengthened the control of core cities over other cities in terms of the urban connection. Regarding the nodes in a net inflow state, there are two types. The first type is those that maintain considerable exchanges with the core nodes and achieve an upgrade in connectivity (such as Yongning, Helan, and Ningdong). The second type is those that have been on the periphery of internal network connections for a long time, primarily at the low connection level (such as Huinong, Dawukou, Litong, Qingtongxia, Shapotou, and Zhongning).

4. Analysis of the Influence Mechanisms of Enterprise Flow

4.1. Selecting Model Variables

4.1.1. Socioeconomic Variables

Regarding socioeconomic variables, regional market demand is an important driving force for promoting cross-domain and cross-city connections for businesses. It includes supply-side innovation demand driven by the development laws of the industry itself and demand-side innovation demand driven by consumers’ aspirations for a better life. Government management has a significant impact on the development of businesses and reflects the business environment in the region through its management of society. Urban investment activities reflect the intensity of internal urban construction and demonstrate the attractiveness of internal activities to external businesses. Transformational development represents the extent of industrial transformation and the adjustment of the production structure, which directly affects the construction and strength of relevant business networks. Coordinated development reflects the coordination between urban and rural regions, and the balance or imbalance between regions influences the spatial choices for the business layout. Thus, in this study, we selected urban investment activities (Investment), government management (GOV), market demand (Demand), transition development (Transition), and coordinated development (Coordinate) as the fundamental variables to explore the influence mechanisms of external network connections (ProCon) and internal network connections (CityCon) in the Ningxia Urban Agglomeration along the Yellow River (Table 4).

4.1.2. Borrowing Scale Variables

Apart from the flow of factors driving the restructuring of regional economic patterns, the borrowing scale is also an important reason for changes in regional economic patterns. The scale effect formed by the agglomeration of economic factors towards core cities strengthens their network power, which enables small and medium sized cities to borrow the scale effect of core cities, thereby influencing the construction and expansion of regional network connections. Among them, the borrowing advanced functions (BroFun) reflect the radiation of urban management and production service functions, the borrowing economic activity (BroEco) reflects the economic activity spillover in cities, and the borrowing population (BroPop) reflects the possibility of population flow between cities. The calculation formula is as follows:
B r o S c a l e i , t = j n S c a l e j , t T i j
In the formula BroScalei,t = (BroPopi,t, BroEcoi,t, BroFuni,t), Tij represents the geographical distance between city i and city j. Scalej,t represents the borrowing indicator of city j in year t. Pop represents the total population of city j; Eco represents the night light density of city j; and Fun is calculated as (the number of productive service enterprises in city j/the number of productive manufacturing enterprises in city j)/(the total number of productive service enterprises in the entire region/the total number of productive manufacturing enterprises in the entire region).

4.1.3. Geographic Spatial Agglomeration Variable

While enterprise flow emphasizes the factor flow within a city, industrial agglomeration reflects the geographic spatial agglomeration of production factors in a city. These two factors mutually influence each other. Therefore, this study selected the industrial agglomeration index (Agg) to explore the relationship between spatiality and flow. Given that the commonly used indicator for measuring industrial agglomeration is location entropy, this study used the location entropy to measure the coordinated agglomeration of the productive service industry and productive manufacturing industry. The calculation formulas are as follows:
L Q P = e p i E i / e p E
L Q S = e s i E i / e s E
C C = 1 | L Q S L Q P | / | L Q S + L Q P |
In the formula: i = 1, 2, …, 13, LQP represents the location entropy of the productive manufacturing industry, LQS represents the location entropy of the productive service industry, and CC represents the coordinated agglomeration index of the productive manufacturing industry and productive service industry. epi represents the number of productive manufacturing enterprises in city i. esi represents the number of productive service enterprises in city i. ep represents the total number of productive manufacturing enterprises in the Ningxia Urban Agglomeration along the Yellow River. es represents the total number of productive service enterprises in the Ningxia Urban Agglomeration along the Yellow River. Ei represents the total number of enterprises in city i, and E represents the total number of enterprises in the Ningxia Urban Agglomeration along the Yellow River.

4.2. Analysis of the Estimation Results

To examine the influence mechanism of the advanced function and economic performance on the urban network connection, this study incorporated both factors into the independent variable system. Considering the possibility of a nonlinear effect of the economic performance on different network connections, the squared value of lnEco was introduced for comparative validation. In order to verify the credibility of the results and the robustness of the model, this paper presents the estimation results of the SDM with the geographic distance matrix and economic distance matrix (Table 5). It can be seen that the spatial lag coefficients of the SDMs for CityCon and ProCon are significantly positive. This indicates that the network connectivity of a city under enterprise flow is influenced by the network connectivity of surrounding cities, further confirming the significant presence of spatial spillover effects in the urban network connection of the Ningxia Urban Agglomeration along the Yellow River.
Table 5. Regression results of the SDMs for the urban network connection.
VariablesCityConProCon
GD WeighED WeighGD WeighED WeighGD WeighED WeighGD WeighED Weigh
lnFun0.246 ***0.336 *** 0.302 ***0.405 ***
(0.089)(0.089) (0.075)(0.071)
lnEco2.740 ***3.054 *** −1.762 ***−1.548 ***
(0.607)(0.579) (0.506)(0.457)
(lnEco)2−0.474 ***−0.523 *** 0.321 ***0.288 ***
(0.100)(0.094) (0.083)(0.075)
lnBroFun 1.516 ***1.512 *** 0.788 ***0.847 **
(0.453)(0.495) (0.188)(0.349)
lnBroEco −2.215 ***−2.352 *** −1.163 ***−1.056 ***
(0.766)(0.789) (0.333)(0.278)
lnBroPop 0.2770.279 0.4020.255
(0.252)(0.259) (0.259)(0.298)
lnInvestment−0.112 ***−0.102 ***−0.115 ***−0.094 **−0.091 ***−0.066 **−0.031−0.016
(0.038)(0.038)(0.034)(0.042)(0.032)(0.030)(0.030)(0.058)
lnGOV0.113 ***0.114 ***0.107 ***0.092 **0.0330.035−0.013−0.010
(0.034)(0.033)(0.035)(0.037)(0.028)(0.026)(0.031)(0.054)
lnConsumption0.281 ***0.283 ***0.210 ***0.263 ***0.199 ***0.202 ***0.165 ***0.153 ***
(0.051)(0.051)(0.079)(0.064)(0.043)(0.040)(0.051)(0.044)
lnTransition0.0110.022−0.149 **−0.153 **−0.095 **−0.082 **−0.161 ***−0.149 ***
(0.052)(0.053)(0.072)(0.073)(0.044)(0.042)(0.042)(0.056)
lnCoordination0.217 ***0.243 ***0.086 *0.0600.224 ***0.212 ***0.214 ***0.190 ***
(0.065)(0.067)(0.048)(0.072)(0.054)(0.053)(0.058)(0.045)
ρ/θ0.013 ***0.013 ***0.012 ***0.012 ***0.009 ***0.008 ***0.010 ***0.009 ***
(0.001)(0.001)(0.002)(0.002)(0.001)(0.001)(0.001)(0.002)
Number208208208208208208208208
R20.3780.4620.2780.2800.8110.7940.1170.141
Note: GD weight is geographic distance weight matrix, and ED weight is the economic distance weight matrix. Values in parentheses are standard deviations. ***, **, * indicate significance at the 1%, 5%, and 10% levels, respectively. These are the same for Table 6 and Table 7.
Table 6. Decomposed spatial effects of factors related to the urban network connection.
VariablesCityConProCon
Direct EffectIndirect EffectTotal EffectDirect EffectIndirect EffectTotal Effect
lnBroFun1.214 ***3.086 **4.300 ***0.5024.213 ***4.715 ***
(0.361)(1.398)(1.665)(0.372)(1.473)(1.500)
lnBroEco−1.590 **−6.167 ***−7.757 ***−0.942 ***−3.242 *−4.185 **
(0.638)(2.053)(2.571)(0.195)(1.689)(1.788)
lnBroPop0.1261.3481.474 *0.585−2.598 ***−2.013 ***
(0.306)(0.880)(0.758)(0.359)(0.574)(0.620)
lnInvestment−0.118 ***0.038−0.080−0.0350.1340.099
(0.033)(0.170)(0.165)(0.051)(0.166)(0.188)
lnGOV0.071 **0.313 ***0.384 ***−0.0190.0430.024
(0.033)(0.101)(0.103)(0.050)(0.135)(0.164)
lnConsumption0.237 ***−0.1630.0740.0990.926 ***1.024 ***
(0.085)(0.354)(0.336)(0.063)(0.249)(0.269)
lnTransition−0.159 **0.024−0.135−0.100 **−0.864 ***−0.964 ***
(0.080)(0.359)(0.332)(0.049)(0.314)(0.294)
lnCoordination0.079 *0.0570.1360.214 ***−0.0070.208
(0.061)(0.222)(0.200)(0.048)(0.228)(0.219)
Table 7. The impact mechanism of industrial agglomeration on urban network connection.
VariablesCityConProCon
GD WeighED WeighGD WeighED Weigh
lnAgg0.958 ***0.941 ***0.375 ***0.270 **
(0.137)(0.131)(0.133)(0.126)
Direct effect0.778 ***0.815 ***0.1850.130
(0.200)(0.203)(0.228)(0.223)
Indirect effect2.623 **3.427 ***2.454 *2.398
(1.098)(1.318)(1.453)(1.482)
Total effect3.401 ***4.241 ***2.639 *2.529 *
(1.252)(1.492)(1.517)(1.529)
Other variableControlControlControlControl
ρ/θ0.012 ***0.013 ***0.012 ***0.012 ***
(0.001)(0.001)(0.002)(0.001)
Number208208208208
R20.0070.0020.4850.404
Comparing the estimation results of the models, both lnFun and lnBroFun are significantly positive at the 1% level. This indicates that the enhancement and diffusion of urban management and the service function can optimize the regional production service environment, stimulate internal enterprise flow, and enhance attractiveness to external enterprises. In terms of the internal network connectivity, lnEco is significantly positive at the 1% level, while (lnEco)2 is significantly negative at the 1% level. This suggests that improvement in the economic performance within a certain range can promote the development of the urban network connectivity. However, under the scenario of imbalanced internal network development, a further improvement in the economic performance would magnify the agglomeration shadow effect of core cities on other cities, exhibiting an inverted “U-shaped” relationship. However, a “U-shaped” relationship in the external network connectivity is shown. This is because the Ningxia Urban Agglomeration along the Yellow River belongs to a typical resource-based city region, and midterm industrial restructuring and green development transformation disrupted the traditional industrial development pattern and challenged existing perceptions. This also had temporary negative impacts on urban network connectivity. For example, lnTransition shows a significant negative impact, which serves as a supplementary explanation for this phenomenon. However, the overall regional green development aligns with the layout of new external industries, promoting the derivation and expansion of new enterprise connections. Similarly, in the context of significant disparities in regional urban development and differentiated connectivity, peripheral cities find it difficult to borrow the economic performance of core cities. However, core cities continue to attract the developmental elements of peripheral cities and cast an agglomeration shadow over them. The significant negative effect of borrowing economic activity at the 1% level also indicates that an imbalanced development pattern has a negative impact.
Regarding the influence mechanisms of other factors, market demand and coordinated development demonstrate significant promoting effects. On one hand, as the region is in the primary stage of development, there is great potential for local market growth. Economic development demand plays a crucial role in facilitating regional enterprise flow. On the other hand, coordinated development facilitates the realization of a balanced spatial development pattern in the region. This serves as an important prerequisite for promoting equalized flows within the regional network. Furthermore, in terms of the internal network connectivity, the impact of urban investment activities is significantly negative. This is due to the relatively limited direction of internal network connectivity and the imperfect structure of connections. Under an imbalanced development pattern, the driving effect of urban investment activities is confined to the city itself, thereby restraining the enterprise flow within the region. The significant positive impact of government regulation indicates that efficient government management activities can improve the urban business environment, which is beneficial for attracting investments from other cities.

4.3. Spatial Effect Decomposition

The SDM can decompose the effects of explanatory variables into direct effect, indirect effect, and total effect, reflecting the extent to which explanatory variables impact the region itself, surrounding areas, and the overall region. By further decomposing the direct effect, indirect effect, and total effect of each explanatory variable on the external–internal network connectivity in the SDMs (Table 6), the spatial effect mechanisms of each variable can be observed.
The borrowing advanced functions can directly enhance the network connectivity within the city itself in the internal network, and the indirect effect of borrowing functional scale on CityCon and ProCon are both significantly positive, which indicates that it can stimulate the network connectivity of surrounding cities in both the internal and external networks. However, under the scenario of imbalanced development, the significant negative effects of borrowing economic activity indicate that it exerts a negative inhibitory influence on both the internal connections within the city itself and the external connections of surrounding cities. Additionally, the borrowing population tends to concentrate its population resources in core cities, and the significant negative indirect effect on ProCon indicates that a shortage of labor and talent can impact the external network connectivity of surrounding cities. The driving effect of market demand is reflected by the direct effect within the internal network and the indirect effect within the external network. The negative impact of transformation and development is manifested in the direct effect within the internal network and the indirect effect within the external network. Coordinated development directly promotes the connectivity of the city itself within both the internal and external networks. Regarding the internal network connectivity, the negative effect of urban investment activities is obvious in terms of the direct effect. Efficient government management not only enhances the city’s network connectivity but also generates positive spatial spillover effects.

4.4. Geographical Agglomeration Effect

Based on socioeconomic variables, this study incorporated the industry agglomeration index and demonstrated its spatial effect mechanism on enterprise flow in different networks (Table 7). Under the influence of different spatial weight matrices, all the indices of industrial agglomeration are significantly evident at the 5% level, indicating that it can notably facilitate the mobility of businesses within the internal and external networks. This positive effect is not only reflected by the direct effect within the internal network but also generates spatial driving effects on the enterprise flow in surrounding cities. This also indicates that the enterprise flow tends to aggregate in regions where the productive service industry and productive manufacturing industry develop in synergy, rather than in a single city. Driven by agglomeration development, the population, enterprises, and capital of the region further concentrate in the core cities, forming a leading development pattern of dominant cities. The polarizing effect within the urban agglomeration weakens the gains brought by the diffusion effect. Under the continued strong suction effect and the imperfect urban network system, the rational allocation of regional production factors and the optimization of geographical agglomeration spatial patterns can effectively promote enterprise flow in different networks. This reflects that synergistic development among cities within the urban agglomeration is an important measure in the facilitation of urban network connectivity.

5. Discussion and Conclusions

5.1. Discussion

With the high-quality development in the Yellow River Basin and execution of the dual-carbon strategy, more restrictive requirements are being placed on the production of resource-based industries in the upstream areas of the Yellow River, and higher demands are also being made for industrial ecologicalization and coordinated development. In recent years, with the execution of strategies such as the Western Development, industrial transfer, and poverty alleviation, the improvement of infrastructure has enhanced the external connectivity of the Yellow River Basin. The flows of various factors have further integrated multiple regions into cross-regional spatial structures, and the network externality has driven the restructuring of urban network spatial patterns, influencing the transformation of high-quality regional development. For urban agglomerations in the upstream region of the Yellow River Basin, which face constraints from the geographical environment, significant internal development disparities, inadequate external connectivity, and challenges in industrial transformation, we need to reexamine the interaction between flow and spatiality from a dynamic, regionally complementary, and networked perspective. This calls for a clear understanding of the regional urban network structure and the process of integration into the national market.
Based on the above research, uneven urban network connections are the main characteristic of the Ningxia Urban Agglomeration along the Yellow River, and significant regional development disparities serve as the underlying reality for the imbalanced spatial pattern of connectivity. Research on regions such as the Guangdong–Hong Kong–Macao Greater Bay Area [28] and the Yangtze River Delta region [40] has demonstrated that dense, balanced, and multicentered regional network connectivity serves as a prerequisite for promoting integrated development. In the future, as the development elements continue to be guided towards the Ningxia Urban Agglomeration along the Yellow River, the watershed-based geographical pattern should emphasize regional coordination and integrated development. From the perspective of network hubs, it is important to strengthen the service center positioning of Jinfeng and Xingqing, promote the internal radiance of service-oriented functions, and enhance the external connectivity, thereby supporting the overall development of the urban agglomeration with the support of the Yinchuan Metropolitan Area. From the perspective of the network structure, efforts should be made to improve the hierarchical structure of the network and cultivate and enhance the secondary core’s external radiance capacity in Shapotou, Dawukou, and Litong. By strengthening the spatial spillover effects of development elements through an orderly, balanced, and coordinated urban network system, a pivot can be established for the enhancement of the spatial overflow effects of development elements. From the perspective of network nodes, it is important to emphasize the functional positioning of each node and highlight its distinctive development characteristics. In terms of network interactions, greater emphasis should be placed on complementary differences in factor flows with neighboring areas and the strengthening of bidirectional connections with core cities. From the perspective of network flows, it is important to enhance external connections with the Beijing–Tianjin–Hebei urban agglomeration, the Yangtze River Delta urban agglomeration, and the Guangdong–Hong Kong–Macao Greater Bay Area region. This will involve the leveraging of regional comparative advantages to attract investments from enterprises from different sectors and improve the attractiveness of these areas to medium- and large-scale enterprises in the central and eastern regions of China. Internally, it is important to create a favorable business environment for the service industry and to integrate manufacturing resources. This will further promote the flow of the productive service industry between adjacent cities, emphasizing differentiated development and cooperative development of the productive manufacturing industry. Additionally, it is crucial to strengthen the positioning of Ningdong as a manufacturing hub.
Although this study explored the evolution of the network structure and influence mechanisms of regional urban agglomeration in the upstream region of the Yellow River from the perspective of enterprise flows, significant disparities in development exist among different regions in the Yellow River Basin. It is important to understand the nature of the interactive relationships within different regions as well as their interactions with neighboring urban agglomerations and other provinces. Furthermore, urban network connectivity exhibits heterogeneity in different industries and directions and on various scales. Subsequent research should deepen the analysis of the homogeneity and heterogeneity of urban network connectivity by examining it across different industries, directions, and scales. It will be important to extract and summarize the main and branching structure characteristics of factor flows under different scenarios.

5.2. Conclusions

In this study, we aimed to explore the evolution of urban network connections and the influence mechanisms acting within the Ningxia Urban Agglomeration along the Yellow River from the perspective of enterprise flow. By translating enterprise connections into urban network connections, in this study, we analyzed the spatiotemporal dynamic characteristics of urban network connections in the external and internal networks. We utilized the SDM to examine the influence mechanisms of socioeconomic factors, borrowing scale factors, and geographic agglomeration factors on the urban network connections (Figure 13). The conclusions are as follows:
(1)
In the analysis of the spatial pattern evolution of external network connections through enterprise flows, the spatial organizational structure of the Ningxia Urban Agglomeration along the Yellow River’s outflow investment demonstrated a trend of monopolar outflow from the investment sources and diversified inflows from various destinations. Jinfeng and Xingqing are the core hubs for regional enterprise investments, and the investments mainly flow towards North China, East China, and Northwest China. The overall inflow of enterprises formed a multisource structure, with North China being the dominant region and East China being the secondary region. A spatial pattern of enterprise inflow is formed in terms of the overall connections and productive service industry with Jinfeng and Xingqing at its core. Additionally, a spatial organizational pattern driven by multiple cities is formed in the productive manufacturing industry.
(2)
In the internal network, a connection structure centered around Jinfeng and Xingqing formed. However, the overall spatial network connections are imbalanced, and the hierarchical system of network nodes is incomplete. In terms of different types of enterprise flows, on one hand, there is a relatively active flow of connections in the productive service industry, and the driving capacity of core cities is beginning to emerge. On the other hand, the connections in the productive manufacturing industry are relatively concentrated between Jinfeng, Xingqing, Ningdong, and Lingwu.
(3)
In terms of regional network structural characteristics, the external network primarily manifests as absorbing external elements to foster the developmental momentum. In terms of overall connections and the productive service industry, each city is in a net inflow state, while in the productive manufacturing industry, the network node connection structure presents a diversified organizational pattern and achieves a net outflow. In the internal network, Jinfeng and Xingqing serve as connection radiation sources and influence each city. However, their driving capacities are weak, and the main manifestation is that the core nodes maintain considerable communication with neighboring cities and promote the upgrade of their connection levels. Additionally, the radiation does not extend to peripheral cities, keeping them at a weak connectivity level.
(4)
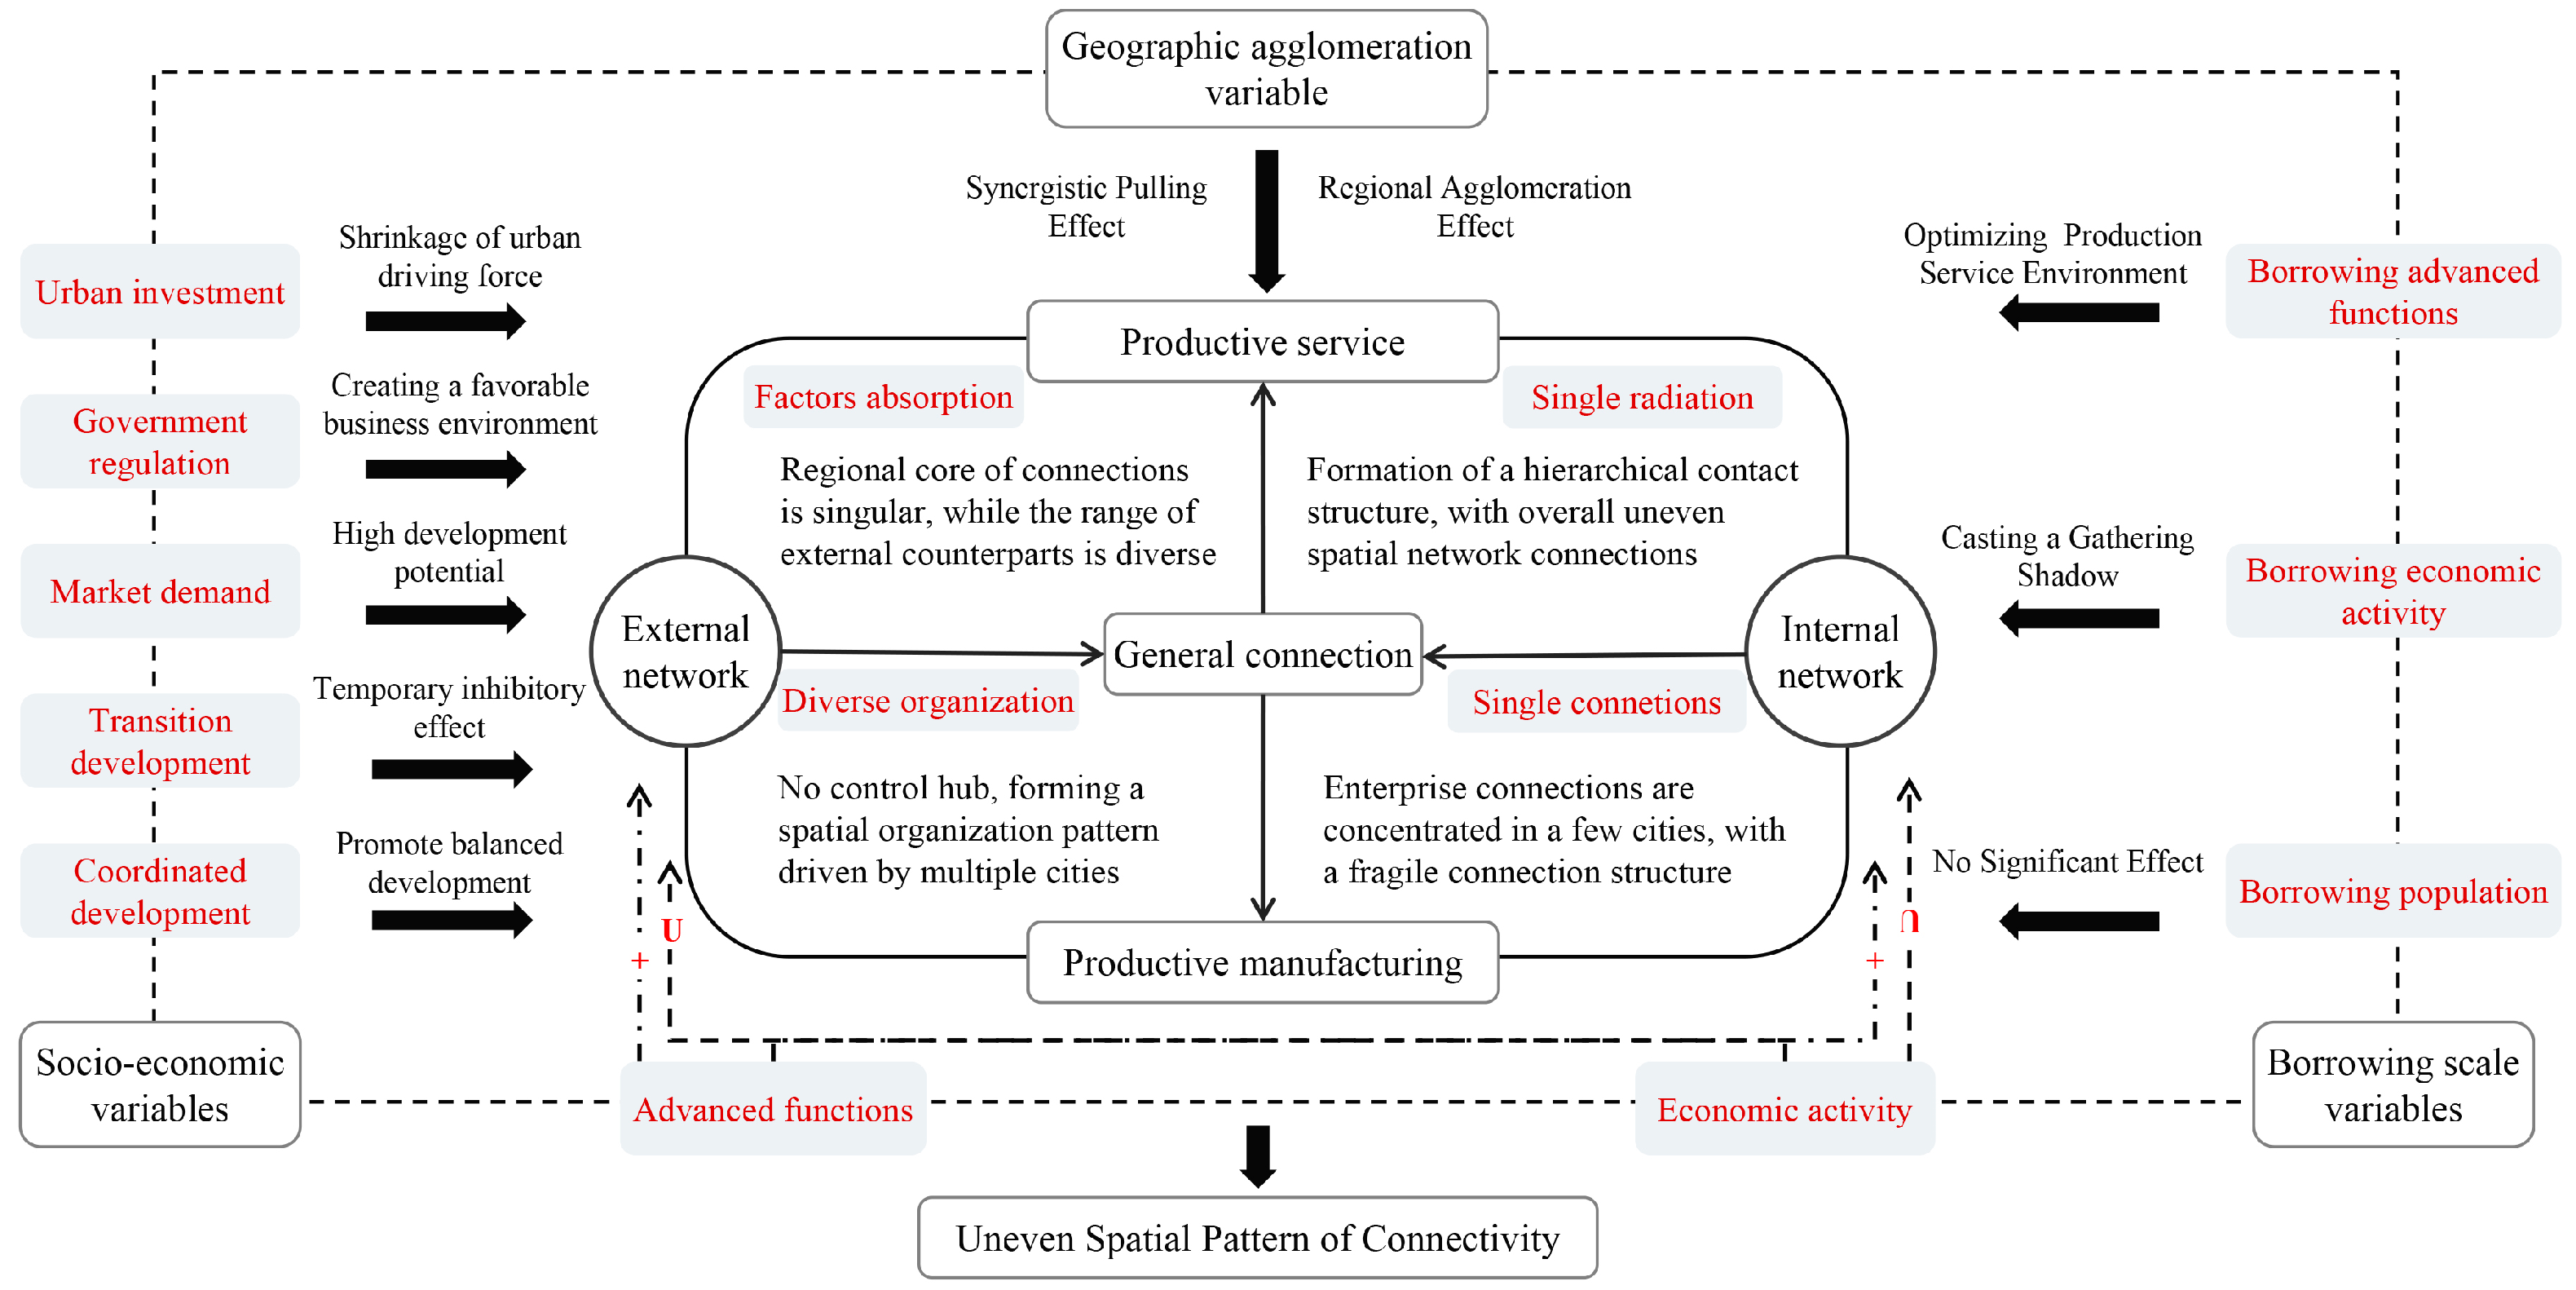
In terms of the role of socioeconomic variables, market demand and coordinated development have significant promotion effects on both the internal network connection and the external network connection. The transformation and development exhibit significant negative impacts, which are attributed to the temporary negative effects caused by the inadequate adjustment and transition of the industrial structure. The roles of urban investment activities and government management are reflected in the internal network connections. The uneven development pattern of cities restricts the driving effect of urban investment activities on the cities themselves. However, efficient government management is beneficial for creating a favorable business environment and generating positive spatial spillover effects.
(5)
In terms of the role of borrowing scale variables, improvements in urban management and service functions as well as external borrowing can optimize the regional production service environment and promote enterprise connections among different networks. In the scenario of imbalanced development within the internal network, improving economic activity will amplify the agglomeration shadow effect of core cities on other cities and have a negative impact on the enterprise connections in different networks. However, in the external network, economic activity exhibits a U-shaped relationship, which is the result of urban green development transformation and corresponds to the emergence of green industry enterprises.
(6)
In terms of the role of the geographic spatial agglomeration variable, industrial agglomeration can significantly enhance the internal network connections of cities in different networks and exert spatial driving effects on surrounding cities. This shows that a rational spatial distribution of production factors can effectively promote enterprise flow in different networks, and the coordinated development of cities is an important foundation for regional urban network connections.

Author Contributions

Conceptualization, Jiagang Zhai and Mingji Li; methodology, Jiagang Zhai; software, Mengjiao Ming; validation, Marbiya Yimit and Jinlu Bi; formal analysis, Jiagang Zhai; resources, Marbiya Yimit; data curation, Jiagang Zhai; writing—original draft preparation, Jiagang Zhai; writing—review and editing, Mengjiao Ming; visualization, Marbiya Yimit; supervision, Mingji Li; project administration, Jinlu Bi; funding acquisition, Mingji Li. All authors have read and agreed to the published version of the manuscript.

Funding

National Natural Science Foundation Project (41561037); National Natural Science Foundation Project (41961028).

Data Availability Statement

The data samples and detailed coding procedures can be accessed by contacting the corresponding author.

Conflicts of Interest

The authors declare no conflict of interest.

References

  1. Yuanyuan, Z.; Ping, D.; Yuqi, L.; Jieyi, T.; Luyao, W. China’s urban innovation network and its influencing factors based on listed high-tech enterprises. Eco. Geogr. 2023, 43, 145–155. (In Chinese) [Google Scholar] [CrossRef]
  2. Xueguang, M.; Zhao, Z.; Ce, J. Research on spatial connection and structure of Chinese urban network based on advanced manufacturing investment. Hum. Geogr. 2023, 3, 108–117+154. (In Chinese) [Google Scholar] [CrossRef]
  3. Yizhen, Z.; Wang, T.; Agus, S.; Kun, Z.; Zhi, T. Evolution and Optimization of Urban Network Spatial Structure: A Case Study of Financial Enterprise Network in Yangtze River Delta, China. ISPRS Int. J. Geo-Inf. 2020, 9, 611. [Google Scholar] [CrossRef]
  4. Alonso, W. Urban zero population growth. Daedalus 1973, 109, 191–206. [Google Scholar]
  5. Friedmann, J. The world city hypothesis. Dev. Chang. 1986, 17, 69–83. [Google Scholar] [CrossRef]
  6. Sassen, S. The Global City: New York, London; Princeton University Press: Princeton, NJ, USA, 1991. [Google Scholar]
  7. Castells, M. The Rise of Network Society; Blackwell: Oxford, UK, 1996. [Google Scholar]
  8. Bingquan, L.; Renxu, G.; Junsong, W.; Xuechen, B. From Agglomeration Externalities to Network Externalities of Crossing Borders: Frontier Progress of Agglomeration Economics. Urban Dev. Stud. 2018, 25, 82–89. (In Chinese) [Google Scholar]
  9. Beaverstock, J.V.; Smith, R.G.; Taylor, P.J. A roster of world cities. Cities 1999, 16, 445–458. [Google Scholar] [CrossRef]
  10. Taylor, P.J. Specification of the world city network. Geogr. Anal. 2001, 33, 181–194. [Google Scholar] [CrossRef]
  11. Derudder, B.; Taylor, P.J. The cliquishness of world cities. Glob. Netw. 2005, 5, 71–91. [Google Scholar] [CrossRef]
  12. Derudder, B.; Taylor, P.J.; Hoyler, M.; Ni, P.; Liu, X.; Zhao, M.; Shen, W.; Witlox, F. Measurement and interpretation of connectivity of Chinese cities in world city network, 2010. Chin. Geogr. Sci. 2013, 23, 261–273. [Google Scholar] [CrossRef]
  13. Taylor, P.J.; Derudder, B.; Faulconbridge, J.; Hoyler, M.; Ni, P. Advanced producer service firms as strategic networks, global cities as strategic places. Econ. Geogr. 2014, 90, 267–291. [Google Scholar] [CrossRef]
  14. Derudder, B.; Taylor, P.J. Central flow theory: Comparative connectivities in the world-city network. Reg. Stud. 2018, 52, 1029–1040. [Google Scholar] [CrossRef]
  15. Hall, P.; Pain, K. The Polycentric Metropolis: Learning from Mega-City Regions in Europe; Routledge: London, UK, 2006. [Google Scholar]
  16. Lüthi, S.; Thierstein, A.; Goebel, V. Intra-firm and extra-firm linkages in the knowledge economy: The case of the emerging mega-city region of Munich. Glob. Netw. 2010, 10, 114–137. [Google Scholar] [CrossRef]
  17. Li, T.; Zhou, R.; Zhang, Y.; Cheng, Y.; Zhu, C. Measuring functional polycentricity of China’s urban regions based on the interlocking network model, 2006–2015. Singap. J. Trop. Geogr. 2018, 39, 382–400. [Google Scholar] [CrossRef]
  18. Bentlage, M.; Thierstein, A. Intra firm networks in the German knowledge economy: Economic performance of German agglomerations from a relational perspective. In Proceedings of the 51st Congress of the European Regional Science Association: “New Challenges for European Regions and Urban Areas in a Globalised World”, Barcelona, Spain, 30 August–3 September 2011. [Google Scholar]
  19. Hoyler, M. External relations of German cities through intra-firm networks—A global perspective. Raumforsch. Und Raumordn. Spat. Res. Plan. 2011, 69, 147–159. [Google Scholar] [CrossRef]
  20. Krätke, S. Global pharmaceutical and biotechnology firms’ linkages in the world city network. Urban Stud. 2014, 51, 1196–1213. [Google Scholar] [CrossRef]
  21. Das, S.P. City connectivity via global intra-firm linkages: An analysis of Indian cities. J. Int. Dev. 2023, 35, 312–330. [Google Scholar] [CrossRef]
  22. Sigler, T.; Neal, Z.P.; Martinus, K. The brokerage roles of city-regions in global corporate networks. Reg. Stud. 2021, 57, 239–250. [Google Scholar] [CrossRef]
  23. Fuller, C.; Phelps, N.A. Revisiting the multinational enterprise in global production networks. J. Econ. Geogr. 2018, 18, 139–161. [Google Scholar] [CrossRef]
  24. Martinus, K.; Sigler, T.J. Global city clusters: Theorizing spatial and non-spatial proximity in inter-urban firm networks. Reg. Stud. 2018, 52, 1041–1052. [Google Scholar] [CrossRef]
  25. Waiengnier, M.; Van Hamme, G.; Hendrikse, R.; Bassens, D. Metropolitan geographies of advanced producer services: Centrality and concentration in Brussels. Tijdschr. Voor Econ. En Soc. Geogr. 2020, 111, 585–600. [Google Scholar] [CrossRef]
  26. Scholvin, S.; Breul, M.; Diez, J.R. Revisiting gateway cities: Connecting hubs in global networks to their hinterlands. Urban Geogr. 2019, 40, 1291–1309. [Google Scholar] [CrossRef]
  27. Indraprahasta, G.S.; Derudder, B. The geographically variegated connections of the Jakarta metropolitan area as produced by manufacturing firms. Growth Chang. 2019, 50, 705–724. [Google Scholar] [CrossRef]
  28. Lüthi, S.; Thierstein, A.; Hoyler, M. The world city network: Evaluating top-down versus bottom-up approaches. Cities 2018, 72, 287–294. [Google Scholar] [CrossRef]
  29. Ozuduru, B.H.; Webster, C.J.; Chiaradia, A.J.F.; Yucesoy, E. Associating street-network centrality with spontaneous and planned subcentres. Urban Stud. 2021, 58, 2059–2078. [Google Scholar] [CrossRef]
  30. Wu, K.; Fang, C.L.; Zhao, M.X. The spatial organization and structure complexity of Chinese intercity networks. Geogr. Res. 2015, 34, 711–728. (In Chinese) [Google Scholar] [CrossRef]
  31. Zhang, X.; Li, Y.; Yuan, Y. Behind the scenes: The evolving urban networks of film production in China. Urban Geogr. 2018, 39, 1510–1527. [Google Scholar] [CrossRef]
  32. Yao, X.; Li, H. Spatio-temporal evolution of urban network in the Guangdong-Hong Kong-Macao Greater Bay Area—Based on listed company organization relations. World Reg. Stud. 2019, 28, 83–94. (In Chinese) [Google Scholar] [CrossRef]
  33. Yanqing, Q.; Ye, Z.; Pei, L.; Qingchang, R. Research on the innovative network of Guangzhou, Dongguan and Shenzhen in the context of the Guangdong-Hong Kong-Macao Greater Bay Area development. City Plan. Rev. 2021, 45, 31–41. (In Chinese) [Google Scholar] [CrossRef]
  34. Lei, Y.; Xuejun, D. City network structure of the Yangtze River Delta region based on logistics enterprise network. Prog. Geogr. 2016, 35, 622–631. (In Chinese) [Google Scholar] [CrossRef]
  35. Yanru, W.; Renxu, G. The Spatial Structure and Evolution of Yangtze River Delta Urban Network: Analysis Based on Enterprise Connection. Urban Dev. Stud. 2019, 26, 21–29. (In Chinese) [Google Scholar]
  36. Xueliang, Z.; Shengnan, W.; Jilan, X. Evolution of the Urban Network Spatial Structure in Yangtze River Delta: Based on Enterprise Connections. J. Nantong Univ. 2021, 37, 33–42. (In Chinese) [Google Scholar]
  37. Liya, M.; Chunliang, X.; Xinghua, F. Urban Network Characteristics in the Three Provinces of the Northeastern China Based on Headquarter-affiliate Enterprises Connection. Sci. Geogr. Sin. 2019, 39, 1129–1138. (In Chinese) [Google Scholar] [CrossRef]
  38. Li, W.; Dewei, Q.; Wanbo, L.; Hui, W.; Peng, D. Analysis of Urban Network Relationship from the Perspective of listed parents and Subsidiary Enterprises—A Case Study Liaoning Province. Resour. Dev. Mark. 2021, 37, 1186–1191+1255. (In Chinese) [Google Scholar] [CrossRef]
  39. Chong, Z.; Pan, S. Understanding the structure and determinants of city network through intra-firm service relationships: The case of Guangdong-Hong Kong-Macao Greater Bay Area. Cities 2020, 103, 102738. [Google Scholar] [CrossRef]
  40. Wu, K.; Yao, C. Exploring the association between shrinking cities and the loss of external investment: An intercity network analysis. Cities 2021, 119, 103351. [Google Scholar] [CrossRef]
  41. Pan, F.; Bi, W.; Liu, X.; Sigler, T. Exploring financial centre networks through inter-urban collaboration in high-end financial transactions in China. Reg. Stud. 2018, 54, 162–172. [Google Scholar] [CrossRef]
  42. Zhang, X. Multiple creators of knowledge-intensive service networks: A case study of the Pearl River Delta city-region. Urban Stud. 2018, 55, 2000–2019. [Google Scholar] [CrossRef]
  43. Pan, F.; He, Z.; Sigler, T.; Martinus, K.; Derudder, B. How Chinese financial centers integrate into global financial center networks: An empirical study based on overseas expansion of Chinese financial service firms. Chin. Geogr. Sci. 2018, 28, 217–230. [Google Scholar] [CrossRef]
  44. Peng, G.; Dan, H.; Yuemin, N.; Minglong, H. Spatio-temporal dynamics and factors of urban investment linkage level in the Yangtze River Delta. Geogr. Res. 2021, 40, 2760–2779. (In Chinese) [Google Scholar] [CrossRef]
  45. Hu, J.G.; Lu, Y.Q.; Wu, X.Y.; Li, E.K. Study on The Urban Networkers Structure and its Changing Characteristics of The Yangtze River Economic Belt: Based on Inter-Firm Linkages. Hum. Geogr. 2021, 36, 146–154. (In Chinese) [Google Scholar] [CrossRef]
  46. Jun, L.; Wenfeng, M. The Rise of Urban Network Eyxternalities: A New Mechanism for the High-quality Integrated Development of Regional Economy. Economist 2020, 2020, 62–70. (In Chinese) [Google Scholar] [CrossRef]
  47. Tao, M.; Huang, Y.; Tao, H. Urban network externalities, agglomeration economies and urban economic growth. Cities 2020, 107, 102882. [Google Scholar] [CrossRef]
  48. Zhejin, L.; Qiang, L. Research on the impact of information flow on high-quality economic development and its spatial effects. Stat. Decis. 2021, 37, 97–100. (In Chinese) [Google Scholar] [CrossRef]
Figure 1. The evolution from central place theory to network externality.
Ijgi 12 00367 g001
Figure 2. Location of the Ningxia Urban Agglomeration along the Yellow River.
Ijgi 12 00367 g002
Figure 3. The evolution of enterprise overall outflow in the external network. Note: Because of the small amount of data from Taiwan, Hong Kong and Macau, these regions are not included, and all the following are the same. In addition, meanings of abbreviations for various regions in China: Northeast China (NEC), North China (NC), East China (EC), Central China (CC), South China (SC), Southwest China (SWC), Northwest China (NWC). And each color represents a city. These are the same for Figure 4 and Figure 5.
Ijgi 12 00367 g003
Figure 4. The evolution of the enterprise outflow of the production service industry in the external network.
Ijgi 12 00367 g004
Figure 5. The evolution of enterprise outflow of the productive manufacturing industry in the external network.
Ijgi 12 00367 g005
Figure 6. The evolution of the overall enterprise inflow in the external network. Note: And each color represents a region. These are the same for Figure 7 and Figure 8.
Ijgi 12 00367 g006
Figure 7. The evolution of the enterprise inflow of the production service industry in the external network.
Ijgi 12 00367 g007
Figure 8. The evolution of the enterprise inflow of the production manufacturing industry in the external network.
Ijgi 12 00367 g008
Figure 9. The spatial pattern of overall enterprise flow in the internal network.
Ijgi 12 00367 g009
Figure 10. The spatial pattern of the overall enterprise flow of the production service industry in the internal network.
Ijgi 12 00367 g010
Figure 11. The spatial pattern of the overall enterprise flow of the production manufacturing industry in the internal network.
Ijgi 12 00367 g011
Figure 12. The dominant connection direction and urban connectivity of the network nodes.
Ijgi 12 00367 g012
Figure 13. The connection characteristics and influence mechanisms in the urban network of the Ningxia Urban Agglomeration along the Yellow River.
Ijgi 12 00367 g013
Table 1. Classification of enterprises.
Original CategoryQuantityCategorizationOriginal CategoryQuantityCategorization
Education3146Living service industry
(127,142)
Transportation, storage, and postal services8190Productive service industry
(84,433)
Residential services, repairs, and other services8590Information transmission, software and information technology services12,008
Accommodation and catering5356Finance3792
Wholesale and retail105,278Real estate7230
Culture, sports, and entertainment3856Rental and business services39,391
Health and social work916Scientific research and technical services13,822
Mining industry1739Productive manufacturing industry
(30,221)
Agriculture20,708Other industries
(47,663)
Manufacturing26,210Construction25,199
Production and supply of electricity, heat, gas, and water2272Water resources, environmental, and public facilities management1492
____Public administration, social security, and social organizations264
Note: The enterprise industry types refer to the National Economic Industry Classification (GB/T 4754–2017).
Table 2. The assignment standard system for enterprises.
ClassificationCriteria for ClassificationValuation
Registered capital
(Unit: 10,000 yuan)
(va)
Registered capital of the enterprise ∈ [0, 10)1
Registered capital of the enterprise ∈ [10, 100)2
Registered capital of the enterprise ∈ [100, 1000)3
Registered capital of the enterprise ∈ [1000, 10,000)4
Registered capital of the enterprise ∈ [10,000, ∞]5
Innovation potential
(vb)
Company belongs to China’s Top 500 Private Enterprises, Fortune China 500, or high-tech enterprises.5
Openness atmosphere
(vc)
The company belongs to foreign-invested or joint ventures with Hong Kong, Macau, and Taiwan.5
Capital utilization
(vd)
The company belongs to listed companies or enterprise groups or state-owned enterprises.5
Table 3. Research methods and definitions of indicators related to the urban network structure.
Research IndicatorsResearch MethodsMeaning of Indicators
Urban connectivity I i = α C S O u t ( i ) + β C S I n ( i ) By using the ratio of the node CS(i) to the maximum value in the same year, we can obtain the relative level of the inflow C S O u t (i) and the relative level of the outflow C S I n (i) within the internal network of city i. α and β are undetermined weights with a default value of 0.5. The urban connectivity in the external network is also calculated using this formula.
Dominant connection direction C i O = j V i j / ( N 1 ) C i I = j V i j / ( N 1 ) N S I i = 1 + ( C i I C i O ) / ( C i I + C i O ) C i O represents the relative out-degree of a city in the network, indicating the city’s radiating capacity. C i I represents the relative in-degree of a city in the network, indicating the city’s agglomeration capacity. N represents the number of cities. NSIi represents the dominant connection direction index of city i.
Table 4. Explanations of related control variables.
VariablesDescription
InvestmentReflects the intensity of internal urban construction (the ratio of regional fixed asset investment/GDP).
GOVReflects the intensity of government management over urban development (the local government fiscal expenditure/GDP).
DemandReflects the domestic demand of the city (the total social retail sales/GDP).
TransitionReflects the adjustment of urban production structure using indicators such as the energy consumption per unit of GDP, water consumption per unit of GDP, and construction land use per unit of GDP, and the transformation development index is calculated using the entropy method.
CoordinateReflects the coordinated development between regions using indicators such as the regional income coordination, regional consumption coordination, urban–rural income coordination, and urban–rural consumption coordination [48], and the coordination development index is calculated using the entropy method.
Disclaimer/Publisher’s Note: The statements, opinions and data contained in all publications are solely those of the individual author(s) and contributor(s) and not of MDPI and/or the editor(s). MDPI and/or the editor(s) disclaim responsibility for any injury to people or property resulting from any ideas, methods, instructions or products referred to in the content.

