

A Survey of Methods and Input Data Types for House Price Prediction

1
Research Centre for Information Systems Engineering (LIRIS), KU Leuven, Naamsestraat 69, 3000 Leuven, Belgium
2
Department of Business Informatics and Operations Management, UGent, Tweekerkenstraat 2, 9000 Ghent, Belgium
*
Author to whom correspondence should be addressed.
ISPRS Int. J. Geo-Inf. 2023, 12(5), 200; https://doi.org/10.3390/ijgi12050200
Submission received: 21 March 2023
/
Revised: 24 April 2023
/
Accepted: 12 May 2023
/
Published: 14 May 2023
Abstract
:Predicting house prices is a challenging task that many researchers have attempted to address. As accurate house prices allow better informing parties in the real estate market, improving housing policies and real estate appraisal, a comprehensive overview of house price prediction strategies is valuable for both research and society. In this work, we present a systematic literature review in order to provide insights with regard to the data types and modeling approaches that have been utilized in the current body of research. As such, we identified 93 articles published between 1992 and 2021 presenting a particular technique for house price prediction. Subsequently, we scrutinized these works and scored them according to model and data novelty. A cluster analysis allowed mapping of the property valuation domain and identification of trends. Although conventional methods and traditional input data remain predominant, house price prediction research is slowly adopting more advanced techniques and innovative data sources. In addition, we identify opportunities to include more advanced input data types such as unstructured data and complex spatial data and to introduce deep learning and tailored methods, which could guide further research.
1. Introduction
House price prediction, or residential property valuation, is a difficult problem, as real estate valuations do not depend on only physical characteristics of the building itself but also its location, the neighborhood, and people’s perception of these factors. Moreover, as for any market, price is driven by willingness to pay, which increases the complexity of determining an objective price for a residential property. Experts such as real estate agents, notaries, and property investors rely on years of experience for the valuation of residential properties. Hence, automating this valuation is a challenging task. Nevertheless, Automated Valuation Models (AVMs) can benefit all parties in the real estate market such as buyers, sellers, notaries, banks, and also policy makers by improving the accuracy of valuations. The large discrepancy in methods and input data types used for house price prediction hinders access to accurate valuation. Researchers appear to have reached a consensus on adopting a hedonic approach to predict house prices [1]. Hedonic modeling entails using variables that describe the physical characteristics of the house. In addition, researchers recognize the importance of incorporating the effect of location due to spatial effects such as spatial dependence and spatial heterogeneity [2,3]. Prices of houses that are close to each other are generally spatially correlated, and a similar spatial relationship can be discovered between house price variables. Nevertheless, prices and other variables vary across space, i.e., spatial heterogeneity. In [4], the first law of geography is quoted: “Everything is related to everything else, but near things are more related than distant things” [5]. However, accounting for spatial effects remains a critical challenge in house price prediction, as the exact implementation is still a subject of disagreement. Some researchers use proxies such as submarkets, distance to the central business district, public transport stations and highways, while other researchers use location-aware models such as kriging, spatial econometrics and spatially varying coefficient models. Yet another research stream incorporates location data directly into the model using longitude and latitude as features while relying on machine learning algorithms to discover spatial patterns. Another challenge that characterizes house price prediction is temporal dependence between house prices [6,7]. Most researchers address this issue from a modeling perspective. Another subject of agreement in house price prediction research is to approach the valuation task with a supervised learning paradigm; however, semisupervised learning has also been considered [8].
To address this discrepancy in residential property valuation, we synthesize the current body of literature. In this systematic literature study, the methods and input data types for house price prediction are investigated with a particular focus on the geospatial component. In the following, we use ‘method’ and ‘model type’ interchangeably. In addition to mapping out the field, a second contribution of this study is the identification of trends in the use of data-driven house price prediction. Based on a cluster analysis of the articles with regard to the method proposed and types of input data used, we found that the combination of conventional model types and traditional input data types is over-represented. Nonetheless, more advanced techniques and innovative data sources have been explored recently, including advanced machine learning and deep learning techniques, e.g., in combination with graph data, image data and textual data. This trend analysis enables us to describe important gaps and research opportunities in the field, which we consider the third and final contribution of this work.
This paper is structured as follows. In Section 2, related research on property valuation is discussed. Section 3 introduces the methodology based on the PSALSAR framework [9] before the results are presented in Section 4. The paper concludes with an in-depth discussion in Section 5 and our conclusions in Section 6.
2. Related Work
Few reviews on the topic of residential property valuation have been published, although the domain has experienced advances in terms of both applied methods and input data types used. In [10], the existing property valuation literature is analyzed, similarly to this work, and three trends are identified. The first trend is the use of spatial methods, driven by the mantra ‘location, location, location’, addressing both spatial dependence and spatial heterogeneity. The former refers to the fact that house prices of properties located close to each other are related and possibly similar, while the latter refers to the issue that the relationship between the dependent variable, the property value, and the independent variables is different from location to location. The authors discuss spatial econometric models and local regression models such as geographically weighted regression as advanced spatial methods to address these issues. This is in line with an earlier review paper [11], which also categorizes these methods as third-generation methods, next to first- and second-generation methods, that mainly involve manual calculation, described as market segmentation, which involves fitting stratified models based on submarkets, methods using neighborhood delineation, accessibility measures and coordinates as variables. A third review [12] adds artificial neural networks (ANNs), fuzzy logic and autoregressive integrated moving average (ARIMA) models to the advanced valuation method list. The increased adoption of advanced learning methods has triggered the most recent review papers, where artificial intelligence (AI) and geographic information system (GIS)-based methods were reviewed [13], while another review particularly focuses on ANNs in property valuation [14].
Next to advances in terms of modeling techniques, other trends detected in [10] are increased research on land values, the decomposition of property values into a land value component and a structural value component, and sustainability policies, such as green building premiums. However, land values and real estate policies are considered out of scope in this literature study. In summary, where previous work focused only on methods used for house price prediction, this paper proposes a two-dimensional analysis, extending the model perspective, which we tackle more comprehensively compared to earlier reviews, with a particular focus on the data dimension. In line with earlier reviews, the inclusion of spatial information is emphasized, given the importance of location for the house price prediction task.
3. Methods
This paper follows the systematic literature review guidelines in the PSALSAR framework [9]. The Protocol step is addressed in Section 3.1, the Search and Appraisal steps are addressed in Section 3.2, and the Synthesis step is addressed in Section 3.3. The final Analysis step is covered in Section 4 and Section 5.
3.1. Research Questions
The first step in the PSALSAR framework, Protocol, consists of defining the research scope and research questions. The scope of this literature study comprises model- and data-driven residential property valuation with a spatial component. This entails that either the model type or the input data type should address the spatial effects that house prices are subject to. ‘Residential property’ is limited to (single-family) homes and apartments. Research papers are considered only if they present a method to estimate the values of individual properties.
The focus of this literature study is dual, namely, to analyze the methods and the input data types used for property valuation. This raises the following research questions (RQs):
- RQ 1.
- Which methods are used for property valuation that can handle the spatial dimension?
- RQ 2.
- Which types of input data are employed for property valuation?
- RQ 3.
- Which trends and further research opportunities can be identified for data-driven property valuation?
3.2. Search Strategy
In a second step, the search strategy and inclusion/exclusion criteria are defined in line with the research scope and questions. Figure 1 gives an overview of the implementation of the Search and Appraisal steps in this study, which are organized in four phases.
- Phase 1: Identification
First, relevant scientific works are identified. To obtain a representative set of literature, the Scopus database and the Web of Science (WoS) Core Collection were searched with the same query. Table 1 lists the Scopus and WoS variants of the search string. The title or abstract should contain three components. The first is ‘house’ or a synonym such as ‘real estate’, ‘dwelling’ or ‘residential property’. The second component is ‘valuation’, ‘price prediction’, ‘price determination’ or ‘appraisal’. Lastly, the title or abstract should contain the keywords ‘spatial’ or ‘geospatial’. This query resulted in 412 papers from Scopus and 600 from WoS. Due to the overlap in the obtained results, 213 duplicate papers were excluded, resulting in a final set of 799 distinct papers.
- Phase 2: Screening
Second, the screening of the literature list consists of an English language filter and a document type filter. The English language filter resulted in a further 46 discarded papers. Additionally, 164 papers that were published as conference proceedings, book chapters or reviews were omitted. Consequently, the screening phase excluded a total of 210 publications, retaining a list of 589 relevant articles. The corresponding source data from the end of this phase until the end of the last phase is published as [15].
- Phase 3: Eligibility
In the third phase, eligibility criteria were formulated to narrow the list of publications based on the titles and abstracts. Two main inclusion criteria were used in this phase:
- 1.
- The article should predict the prices of individual houses or apartments.
- 2.
- The article should describe a prediction method.
In addition, three more specific exclusion criteria are used:
- 1.
- The article analyzes correlations between house prices and other variables.
- 2.
- The article uses cadastral values instead of prices.
- 3.
- The article predicts land values unrelated to the value of homes.
The first step was reading the titles with regard to the criteria. Titles were translated into the absence or presence of certain words to infer the content of the paper. For example, the second inclusion criterion is checked if the title contains ‘model’, ‘approach’, ‘technique’, or ‘analytics’. The first exclusion criterion is checked if the title contains ‘correlation’, ‘estimation’ or ‘analysis’ without any indication of the method used. Articles are excluded if the title includes the keywords ‘cadastral value’ and ‘land value’ based on the second and third exclusion criteria, respectively. The title reading step subsequently retains 142 papers. Then, a similar exercise was conducted based on the abstracts with the same inclusion/exclusion criteria. Dubious cases could be solved with this additional step. In addition, three review papers were identified and removed from the list; however, they were discussed in Section 2. The total number of papers excluded in this phase amounts to 474, resulting in a list of 115 publications.
- Phase 4: Literature Study
In the last phase, the full papers were obtained (via our university’s subscription) and categorized with respect to the model type described in the article on the one hand and the input data type used on the other hand. During this more in-depth analysis of the papers, another set of irrelevant articles was identified. Four articles did not describe the prediction of house prices, eleven articles described the prediction of average house prices per zone or neighborhood, and one duplicate article was identified. Additionally, one further review paper was identified and excluded. Five articles described a comparison of models without proposing a property valuation method. This resulted in a final set of 93 relevant research papers.
3.3. Categorization and Analysis of Papers
In the Synthesis step, we categorized and analyzed the retrieved set of papers along their publication year and outlet, method, and input data types.
3.3.1. Publication Year and Outlet
Figure 2 shows the distribution of the papers based on the year they were published. This graph reflects the recent increase in research interest in the spatial valuation of residential property. Moreover, Table 2 contains the journals that have published the most articles considered in this study: The Journal of Real Estate Finance and Economics published 8 articles that are considered in this literature study. All journals listed in the table relate to the domain of either real estate or geography.
3.3.2. Methods
The list of publications can be categorized into 14 different types of models: multiple regression analysis (MRA), kriging, spatial econometric models (SEM), spatially varying coefficient models (SVC), time series models, fuzzy logic models (FL), nearest-neighbor models (NN), decision/regression trees (DT), support vector machine (SVM), artificial neural networks or multilayer perceptron (ANN), random forest (RF), gradient boosted trees (GBT), other ensembles and deep learning (DL) (see also Table A1 in Appendix A). A large proportion of articles considers different methods, mostly to benchmark the proposed method. Consequently, only the proposed method for each paper is analyzed further and indicated in Table A1.
3.3.3. Input Data Types
In addition, the list of publications is categorized according to types of input data used in Table A2 in Appendix A. As for the categorization according to type of model, most articles use a combination of input data types. The input data types considered are features related to the property itself, namely, structural, socioeconomic and environmental features, which constitute the traditional features in property valuation, in addition to point of interest (POI) data. The second category is standard spatial data, consisting of coordinates and the Euclidean distance between locations. Third, advanced spatial data are considered as topographical data and alternative distances, such as road or public transport network distances. Another input data type considered is data structured as graphs. Lastly, unstructured data, such as textual data and images are considered.
3.3.4. Novelty Assessment
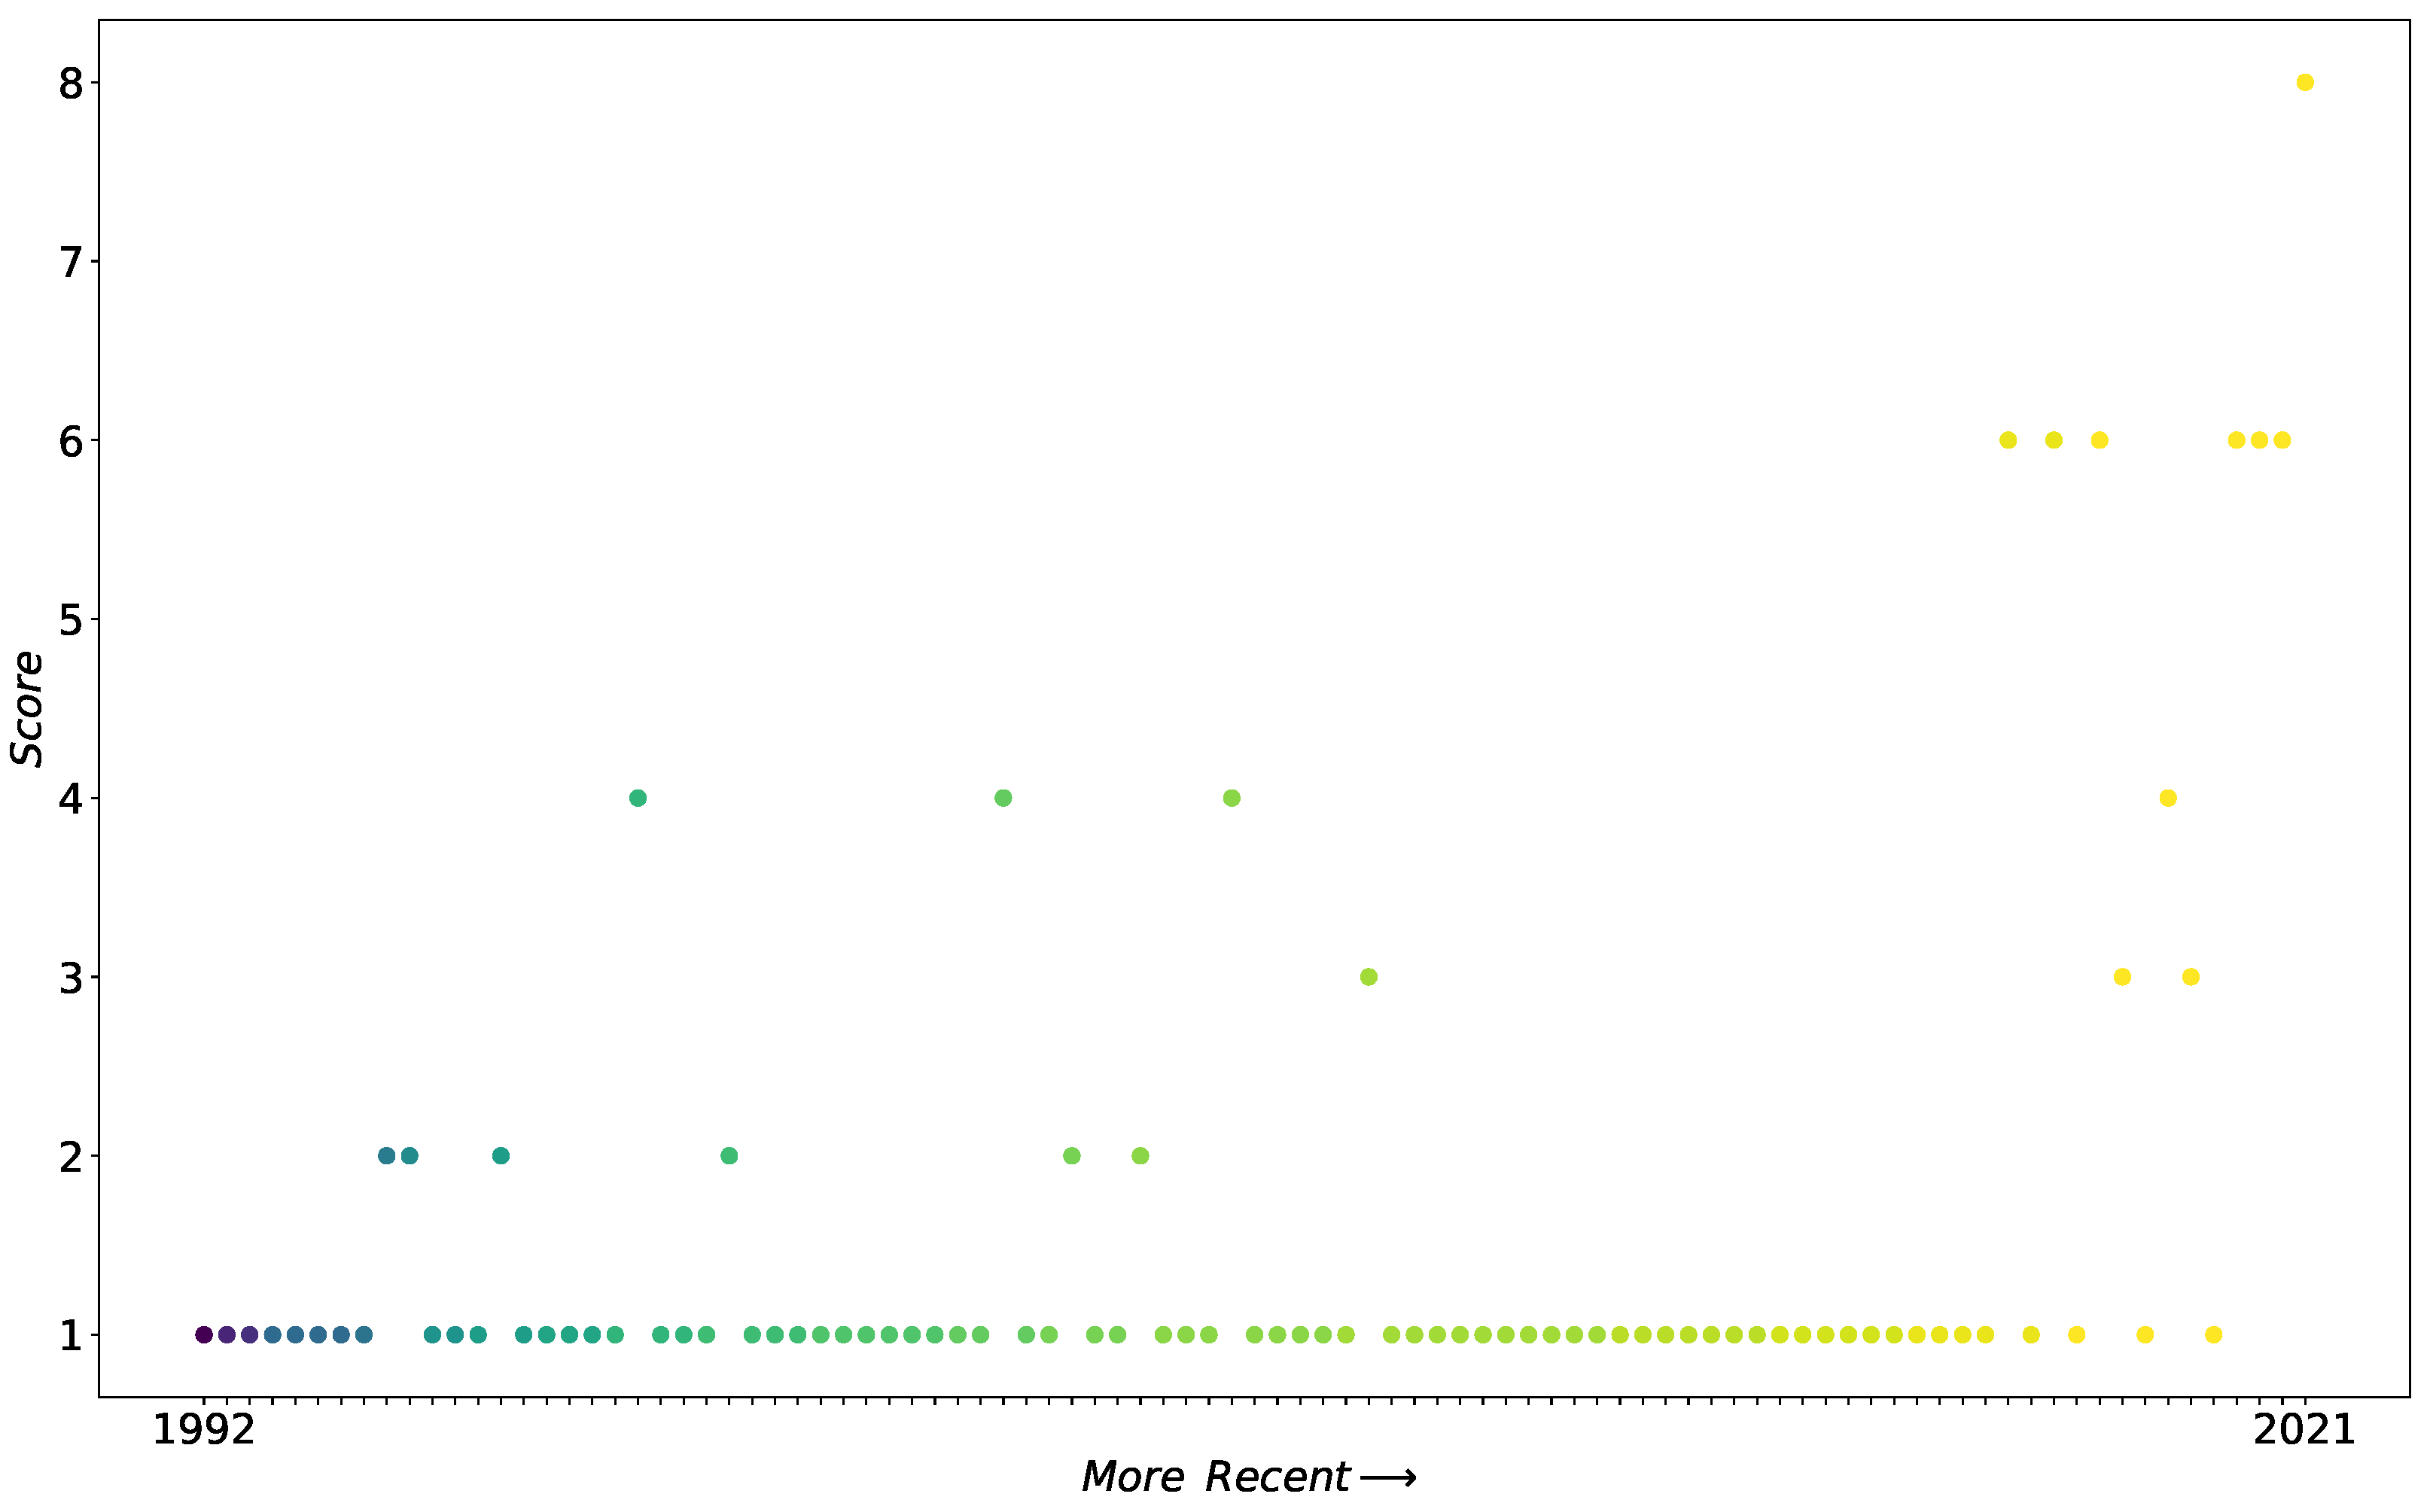
A novelty score was assigned to each publication for both model type and input data type. The model novelty score is structured as follows. First, the main method is identified for each paper. This is either the only method used in the article or the method that was proposed by the authors. Then, the novelty of the main technique is quantified as outlined in Table 3. The model novelty is based on the assumption that newly proposed methods in general perform better in prediction tasks than methods proposed early on. For example, the literature suggests that MLP outperforms MRA, RF outperforms MRA and GWR, and gradient boosted trees perform better than kriging in house price prediction [16,17,18,19]. In addition, DL is considered to perform better than other methods as it is simply the only method that efficiently handles unstructured input data such as images and text [20]. The model novelty score ranges from 1 to 8. The most conventional methods, MRA, kriging, SEM and SVC, are given the lowest model novelty score, because these methods were proposed early in the study period. DL is the most novel model type considered, because it was proposed last in the study period, and it is thus awarded the highest score. Lastly, the publications are assigned the model novelty score of the main technique proposed by the authors.
The data novelty score is assigned to the articles by first identifying each input data type that is included in the data set of the article under observation. Similar to the model novelty score, each input data type is assigned a novelty score as listed in Table 4. The most common input data types are structural features of the house and temporal data. These input data types are considered as standard and are therefore given a low score, similar to socioeconomic, environmental and POI features, grouped under standard features. Spatial data are given higher scores, depending on the complexity of the features, distinguishing standard and advanced spatial data. Graph structured data are more novel and are given the second-highest score. Unstructured data, such as textual and image data, are valued the most, as this type of input data is considered novel. Finally, the data novelty score of each publication is determined by the addition of the scores related to each input data type that is used in the research. The data novelty score of publications ranges between 1 and 43. A publication would receive a data novelty score of 1 if it would solely use one of the standard input data types, for example, structural features or temporal features. The highest data novelty score of 43 could be attained if all input data types are included, and thus, all the individual scores are summed. However, house price prediction research never combines all input data types in practice. Therefore, the data novelty score can be expected to range between 1 and 20.
3.3.5. Data Availability
While 96% of the publications use proprietary data, three articles indicate the public availability of the data set, whereas five indicate that the data set can be requested. In [21], a compressed file is provided with the data set and code base used (Download link: https://static-content.springer.com/esm/art%3A10.1007%2Fs10109-017-0257-y/MediaObjects/10109_2017_257_MOESM1_ESM.rar, accessed on 1 February 2022). This data set includes standard features and standard spatial data, i.e., coordinates. In contrast, two articles provide the source that published the data, CINP (Chambre Interdépartementale des Notaires de Paris) and Centadata, respectively, but they do not provide a reference [22,23]. While both data sets include structural, temporal and standard spatial features, socioeconomic and POI data are also covered in [23]. Two data sets available on request include basic features [24,25]. Two other data sets that can be requested also contain advanced spatial data, that is, network distances [26,27]. Lastly, a data set with textual features in addition to standard features, used in [28], is available on request.
4. Results
Using the novelty assessment approach defined above for structuring the description, this section discusses all relevant papers identified from the search procedure.
4.1. Model-Based Categorization
The categorization of the papers based on methods used is shown in Table 5, which is supplemented with the count and range of publication year per method. In addition, Figure 3 shows the model novelty scores of the publications over time. Based on Table 3, the model novelty scores were determined for each article. The time dimension of the plot is constructed by ordering the articles based on publication year and author name. Both the table and the figure show that the most popular methods are MRA, kriging, SEM and SVC models over the studied period. In general, papers have low model novelty scores, most were even awarded the lowest score of one. Regarding more novel techniques, time series and fuzzy logic models have been proposed by a few researchers. Moreover, more advanced methods that can handle large amounts of data, such as ANNs and SVMs, have gained importance recently. Along with these machine learning techniques, advanced ML methods, including ensemble techniques such as RF and GBT, and deep learning are currently emerging as a topic of research with a view to valuing residential properties.
4.1.1. Multiple Regression Analysis
Hedonic price models for real estate have been used extensively to predict house prices and mostly rely on multiple regression analysis (MRA). As hedonic models assume prices are a linear combination of the values of a good’s components, hedonic real estate prices are modeled as combinations of the values of the house’s characteristics. Typically, property values are modeled as a function of structural, neighborhood and locational characteristics [2,80]. Apart from linear regression, semi-log regression and double-log regression are also considered under MRA using methods such as ordinary least squares (OLS), generalized least squares (GLS), stepwise regression, least absolute shrinkage and selection operator (LASSO) and least absolute deviation (LAD) [29,30,32,33,34,35,39,41,43,44].
The generalized additive model (GAM) is also used to learn hedonic price models for real estate [21,38,102]. In [38], GAM is employed with a semi-logarithmic link function including a smoothing function of the spatial coordinates and a function over the time of sale. Newly proposed semiparametric models are benchmarked against a semiparametric GAM in [21,102]. Similarly, research proposing new methods for property valuation often compare performance against a hedonic multiple regression method [17].
A semiparametric hedonic model with a geospatial spline is used in [42] to obtain property prices. The geospatial spline is a nonparametric function over the longitude and latitude of the properties that constructs a topographical surface where price varies by location.
A multilevel hedonic regression is proposed in [31] to incorporate multiple spatial levels. Additionally, in [40], the authors propose a multilevel approach so that in addition to fixed effects, random effects can be included to allow for a random intercept to vary over neighborhoods. In contrast, in [31], the variance of house prices is estimated at property level, street level, area level and community level, while level-specific variables are added to the model as fixed effects.
A combination of the semiparametric and multilevel approach is implemented in [37]. This multilevel structured additive regression model is estimated with the Markov Chain Monte Carlo (MCMC) Bayesian approach. This approach is revisited in [36], where it is implemented in a two-step procedure. The approach is first used to model a spatial index based on a large data set that has few variables. Then, the predicted spatial index is used in the second model as a neighborhood-level covariate to predict actual house prices based on a small data set with many explanatory variables.
In general, MRA techniques have been used by many researchers, and this model type appears to be one of the standard methods for residential property valuation (see Table 5). The range of publication years covers the study period and 16 of 93 publications employed this method.
4.1.2. Kriging
Kriging is another popular method for residential property valuation, as illustrated in Table 5, with a total of 10 publications spanning the entire study period. Kriging is a geostatistical method that can be used to predict house prices at unsampled locations based on those at sampled locations. The approach assumes that the house prices at different locations constitute a random process with a constant mean and a covariance between two locations that depends on only the distance [46]. A kriging predictor is estimated by empirically computing the variogram, which is the function that defines the covariance, then fitting a parametric model to this variogram and computing the kriging weights by minimizing the mean squared prediction error for the best linear unbiased predictor. This predictor uses the kriging weights in a linear combination of the sampled locations to predict house prices at unsampled locations [46,51].
Cokriging allows the mean of the price process to be polynomial, which means that the house price does not depend on only location but also other independent variables [47]. This requires the estimation of the cross-variogram, which measures the spatial cross-dependence between variables. Regression cokriging is used to model not only a more complex mean but also more than one equation, which are related tasks [49,53]. This multi-equational model allows the residuals, or disturbances, of the different equations to be autocorrelated and cross-correlated. Another way to handle the incorrect assumption of a constant mean is regression kriging. This approach first fits a regression model based on the properties’ characteristics and then applies the kriging method to the residuals [45,49,50,52,54]. The final predictions are obtained by summing the regression prediction and the spatial variation captured by the kriging prediction. As the residuals, or disturbances, are autocorrelated, the GLS method is used instead of OLS [53]. Finally, another variation of kriging is proposed, called area-to-point kriging with external drift (A2PKED), which enables area-average house prices to be incorporated in addition to individual house prices [48].
4.1.3. Spatial Econometrics
Spatial econometrics techniques extend the standard hedonic model with spatial terms to account for spatial effects. The spatial autoregressive (SAR) model assumes that house prices are affected by a spatially weighted average of house prices implemented by a spatial lag term of the weighted price [55,58]. The spatial error model handles spatial autocorrelation by spatially weighting the error term [58,76,77]. Therefore, both terms require a spatial weight matrix. The general spatial model combines both the spatial autoregressive and the spatial error term [58,61,69,70,71]. The spatial matrix can be constructed in different ways: the elements in the matrix can be set to 1 if the distance between the two properties is smaller than either a fixed, inverse or squared inverse distance [2]. This distance is often calculated as the Euclidean distance [58]. A simultaneous autoregressive model is proposed that estimates the log of the house price with a spatial error model in [60]. In addition, anisotropic spatial dependence is assumed, requiring more advanced methods than the distance between two properties to measure spatial dependence. Instead, the local anisotropic method is used to transform the coordinates with the help of gradient estimation. This method results in a more accurate spatial weight matrix. By extension, the spatiotemporal autoregressive model accounts for spatial and temporal effects in house prices [22,62]. This method requires spatial weight matrices, temporal weight matrices and interaction matrices. The spatial weight matrix is based on neighboring houses that were previously sold. The temporal weight matrix is constructed by equally weighting a fixed number of previously sold houses. The general spatial model is also extended with a temporal component in [66]. They propose a spatial panel model that includes the spatial lag and spatial error term along with a temporal autocorrelation term.
Spatial quantile regression is implemented in [64] by estimating a general spatial model for each quantile of the house price distribution to account for spatial heteroskedasticity, spatial autocorrelation and non-normality. Furthermore, in [24,59], the authors only include a spatial lag in the quantile regression approach.
The spatial Durbin model (SDM) includes spatially lagged independent variables in addition to the spatial lag term of the dependent variable [23,65]. In [71], the four spatial econometrics models are compared using different numbers of nearest neighbors, and they find that the general spatial model performs best. The models can be estimated by the maximum likelihood method, the generalized method of moments and the Bayesian MCMC method [71].
Spatial autocorrelation is handled by the spatial expansion method proposed in [57,107]. The authors also include interactions between attributes and geographical components to model spatial trends. In contrast, spatial autocorrelation can also be mitigated by modeling it as a constant term in a stochastic model [56]. This approach allows neighborhood effects to be separated from the random error.
Traditional spatial econometrics models can be transformed into semiparametric models to account for spatial autocorrelation, spatial heterogeneity and nonlinear relationships between house prices and the explanatory variables [21]. A nonparametric spatial drift, which is a function of longitude and latitude, with penalized splines is included in addition to a GAM term that introduces nonparametric functions for some housing attributes.
The spatial autoregressive conditional heteroskedasticity model is based on the general spatial model but specifies the variance of the error term as a linear spatial relationship [73,75]. This model accounts for the spatial heteroskedasticity that remains present in the residuals after incorporating spatial lags.
A hierarchical–spatial approach is proposed in [63] by combining spatial econometrics with a two-level approach for apartment price prediction: the first level relates to the individual apartment characteristics, and the second level includes local neighborhood characteristics. Similarly, a multilevel linear regression model is implemented in [78]; however, a conditional autoregressive term is added instead of the general spatial model that forms the basis of the multilevel model used in [63].
Table 5 indicates the importance of spatial econometrics for house price prediction. SEM is the most prevalent method, and even though it has been employed from the first year of the study period until the most recent year, many modifications have been proposed.
4.1.4. Spatially Varying Coefficient Models
Geographically weighted regression (GWR) is proposed for the Belfast housing market [79]. GWR allows parameter estimates to vary over space by estimating the coefficients for each observation. Essentially, GWR estimates many weighted MRAs for each property, as the regression coefficients can be different for each property based on location. The coefficients are calculated using a distance matrix specific to each observation, requiring a distance function based on nearest-neighbor distances and a bandwidth. Different weighting approaches exist: the bi-square function [79] and a Gaussian kernel function with Euclidean distance [26]. In [80], they confirm the performance of the GWR method in a comparison to SAR, conditional autoregressive and spatial filtering models. An extension of the standard GWR with parameter-specific distance metrics is proposed to account for varying spatial relationships between the dependent and each independent variable [85]. Therefore, each independent variable is included in the model with a specific distance matrix and corresponding bandwidth. Addressing the importance of the distance matrix in a different way, kernel functions and bandwidths are compared in [4] to conclude that fixed and adaptive Gaussian kernel functions perform best. An adaptive kernel function enables the bandwidth to adapt according to data density, increasing the bandwidth for sparse data and decreasing the bandwidth for dense data. In addition to Gaussian kernel functions, bi-square functions are considered for the comparison. The same four functions are considered in [92], and similarly, the adaptive Gaussian kernel-based GWR is chosen to predict house prices with bus accessibility features.
A temporal component can be included in the traditional GWR by employing the geographically temporally weighted regression model [83]. Coefficients therfore vary not only over space but also over time, causing the distance matrix to differ from that in the original approach. In addition to spatial distances between observations, temporal and spatiotemporal distances are included in the weighting function. Instead of Euclidean distances, travel distances based on the road network constitute the basis of the distance functions.
Combining GWR with the co-training paradigm, a semisupervised regression approach, leads to co-training GWR, as proposed in [8]. This entails the iterative training of two GWR models, one with a Gaussian kernel function and one with a bi-square kernel function.
In [86], a mixed-scale hedonic model is proposed that combines local (GWR) and global (MRA) regression. An adaptive Gaussian kernel function based on a network distance matrix is used to implement the mixed model. Similarly, in [88], a mixed geographically weighted regression model is proposed to account for the simultaneous occurrence of spatial stationarity and spatial nonstationarity.
Conditional varying-coefficient models of house prices are estimated in [84] with an isotropic Gaussian process (GP) prior. They find that multitask learning is appropriate for the inference procedure of their isoVCM algorithm. In contrast, a maximum-likelihood estimation approach is proposed in [93] for GP-based SVC models, and they find that it outperforms other SVC models on a large dataset of house prices. In [68], low-level covariates with GP coefficients are compared to high-level covariates with coefficients modeled by a SAR model. This is a hierarchical varying-coefficient model where the low level concerns individual houses and the high level concerns zip codes.
Eigenvector spatial filtering (ESF) is proposed in [82] using genetic algorithms to select significant interactions between the eigenvectors (EVs) and independent variables. The EVs are selected from a nearest-neighbor matrix based on criteria regarding Moran’s I coefficient and spatial autocorrelation. They find that ESF captures localized spatial variation better than GWR, MWR and SEM and is less liable to multicollinearity problems. While the ESF model achieves the highest prediction accuracy on in-sample data, it appears to overfit the data, as the out-of-sample prediction is significantly worse than that of the other approaches. Other limitations of ESF are the comparatively high computation cost, the need for approximations for large datasets because of intractability and the requirement of advanced mathematical and coding knowledge. A simplified approach is implemented in [87], where the interactions between EVs and explanatory variables are not modeled, but the selection of the EVs follows the same method as described above. The ESF approach is applied widely obtaining corresponding results to [82], although the EV selection procedures differ [67,72,90]. Bayesian selection procedures are used in [67,72], that is, a Bayesian adaptive sampling algorithm and adaptive MCMC algorithm. By contrast, in [90], EVs are selected by removing EVs with small eigenvalues or eigenvalues of the wrong nature and using a stepwise selection method. Another difference with the approach in [82] is that the significant interactions are identified in a parsimonious manner using the Akaike information criterion (AIC) [90].
The ESF approach can also be extended by incorporating it into a multilevel model [89]. The multilevel model allows prices to differ among neighborhoods to capture intraneighborhood effects, while the inclusion of ESF captures interneighborhood effects. In other words, spatial autocorrelation within each neighborhood and between neighborhoods is accounted for.
A Bayesian spatially varying coefficient process model is proposed in [81] to predict house prices and create submarkets. This method outperforms linear regression and GWR by implementing a hierarchical conditional model with well-chosen priors and Bayes theorem for inference. The Bayesian approach is found to have several advantages, such as the ability of complete inference on all model parameters, prediction intervals for new observations and a specific way to handle sparse data. On the contrary, Bayesian SVC process models require considerable computational resources.
In [91], spatial econometrics, kriging, and GWR are compared to vicinity-based residual tuning (VRT). The VRT method combines regression predictions with a residual that is calculated based on a limited number of neighboring properties that were sold before the property in question. However, they find that GWR is the best model.
Spatially varying coefficient models complete the list of model types that have been used frequently since the beginning of the study period. Table 5 shows that although this method is the second most prevalent, it has only become popular more recently than the methods previously described. Nevertheless, SVC models together with MRA; kriging and SEM account for a large portion of publications with a model novelty score of 1 near the x-axis in Figure 3.
4.1.5. Time Series Models
A hierarchical trend model that combines the general price trend, cluster-level price trends and house characteristics is proposed in [94] to predict property values. The cluster-level trends consist of different trends for house types, districts and neighborhoods. In this way, both spatial and temporal dependence are addressed. In [96], different time series models are estimated for the different metropolitan statistical areas in southern California. Vector autoregressive and vector error-correction models, Bayesian variants of these models, and models including spatial and causality priors are the basis of the study. The authors find that the best performing time series model specification is area-dependent. The ARMAX model is used to forecast house prices in [95], combining OLS regression with autoregressive moving average (ARMA) terms. Moreover, a combined method for forecasting property values is developed in [97]. They combine GWR with a simple exponential smoothed time series in a three-step procedure. First, the GWR models are estimated for every year; then, a different time series model is estimated for each coefficient to predict the value of this parameter in a future period. In the last step, these new coefficients are used in a GWR model to predict house prices in a future period. Time-series models have a low prevalence in property valuation studies; Table 5 shows that four articles employed time series models between 2004 and 2015.
4.1.6. Fuzzy Logic Models
A methodology to value properties via fuzzy logic in combination with spatial analysis and GIS tools is presented in [98]. They use real estate variables to make fuzzy sets, build rules and define a knowledge-base operator between the fuzzy rules for inference. In [99], a fuzzy Bayesian approach is proposed for property valuation consisting of a two-step procedure. In the first step, a Bayesian regression analysis is conducted. In the second step, the variables that are liable to deterministic variability, in contrast to parameters that vary randomly, are fuzzified. This fuzzification results in fuzzy vectors of the regression parameters that are based on fuzzy membership functions. As the regression coefficients are fuzzy Bayesian confidence intervals, the predictions are also obtained as confidence intervals. Table 5 indicates that fuzzy logic models were used once in 2006 and once in 2016. In Figure 3, the observations with a model novelty score of 2 indicate time series and fuzzy logic models that were used between 2004 and 2016.
4.1.7. Nearest Neighbors
In [100], the spatial autoregressive model is adjusted so that the property price depends on an average of the prices of its geographic neighbors and the attribute differences between the property and those of its neighbors. Another nearest-neighbor adjustment of SAR implements a distance matrix in the characteristic space instead of proximity in geographical space [101]. This weighting matrix is estimated via k-means clustering-based distances between observations. The model providing the best results is based on proximity in both the geographical and characteristic spaces. Nearest-neighbor models were used in 2017 and 2021, more recently than the methods described above (see Table 5). The two articles are represented in Figure 3 as the observations with a model novelty score of 3.
4.1.8. Decision Trees
The building blocks of more advanced tree-based methods are decision trees. In [25], classification and regression trees (CART) and chi-square automatic interaction detector (CHAID) trees are built to determine the effect of the independent variables on house prices in Kraków. The popular CART method includes both regression and classification, while the CHAID method implements classification via a chi-square test to determine the best split. The trees confirm the MRA results and split on the districts of the city, indicating that different districts have different pricing classes. Decision trees are also awarded a score of 3 for model novelty, similar to nearest-neighbor models. Therefore, the article that employs DT is the third observation with a model novelty score of 3 in Figure 3.
4.1.9. Support Vector Machines
A semiparametric spatial effect least squares support vector machine (SSELS-SVM) is proposed for valuing properties in [102]. This model is an extension of the least squares support vector machine with a spatial effect term and a nonparametric term. The SVM is based on a kernel to implement nonlinear transformations. The authors find that the SSELS-SVM model predicts house prices more accurately than do semiparametric GAMs and parametric models and has good generalization capability [102]. An SVM was used once in 2014 (see Table 5) and is given a model novelty score of 4, as shown in Figure 3.
4.1.10. Artificial Neural Networks
The multilayer perceptron (MLP) is the simplest neural network with respect to architecture, but it is very efficient in learning dependencies between input and output data [16]. For details on ANNs and MLP, we refer to the reference work in [20]. In [16], they find that the MLP outperforms MRA with respect to valuation in the Budapest real estate market. An MLP for property valuation is proposed in [103], but the authors tailor it to geographic data and develop a system that integrates the valuation into a GIS tool. In [104], a spatial neural network is implemented with MLP to base predictions on neighborhood features extracted from satellite images and detected areas of interest. The MLP neural network is also used to compare performance and as a meta-model in a stacking ensemble, as discussed below [105,106]. Table 5 shows that ANNs have been used since 2011; however, they have only been used only in three articles in this literature study. As this method is also awarded a model novelty score of 4, the observations in Figure 3 have either employed SVM or ANN.
4.1.11. Random Forests
This tree-based method combines several trees into an ensemble and adds randomization to achieve more robust results [17,18,105]. Random forest increases variance over the different trees by building each tree based on a random sample of variables and training it with a bootstrapped sample, that is, a random subset of the data [17]. By averaging the predictions of different trees, RF returns a final robust prediction of a house price. In [105], the authors compare random forest and other ML approaches to hedonic multiple linear regression and implement an explainability method based on Shapley values for the RF model. Researchers also found that RF outperforms MRA and GWR [17,18]. Random forests were used in the last two years of the study period, as shown in Table 5.
4.1.12. Gradient Boosted Trees
Gradient boosting, XGBoost, and LightGBM are three GBT methods used in [19], where the authors find that gradient boosting is the best method for geospatial network embeddings of housing and POI data. Tree boosting refers to the addition of trees, which are each trained on the residuals of the previous tree in the sequence. In this way, the loss of the final estimator is minimized. Gradient boosting is the implementation of this method, while XGBoost and LightGBM modify the algorithm to improve performance. GBTs were employed once in the publication list in the most recent year (see Table 5).
4.1.13. Other Ensembles
Stacking ensembles are used in [27,106]. Stacking regressors combine the predictions of base models to train the final estimator. This ensemble learning technique confirms the trade-off between accuracy and execution time, as it improves performance at the expense of real-time performance [27]. Both articles select tree-based methods, such as RF, GBDT and LightGBM, as base predictors, but in [27], linear regression is used as a meta-model, while in [106], a neural network is trained. The performance of tacking ensembles is often compared with that of the base estimators.
Similar to the two previously discussed tree-based ensembles, few researchers have used other ensembles for property valuation; however, these methods were proposed in the two most recent years of the study period (see Table 5). The three ensemble model types are all awarded a model novelty score of 6. The six observations in Figure 3 with this score are located on the right side of the plot, which indicates recency.
4.1.14. Deep Learning
The most advanced modeling technique considered in property valuation so far is deep learning. In [19,104], the authors make embeddings with deep neural networks: the former embeds graphs with a graph neural network, and the latter embeds satellite images with convolutional neural networks. However, as these articles employ neural networks for feature embeddings, deep learning is not considered as the main technique. The two papers are categorized under GBT [19] and ANN [104]. Only a single publication in the list predicts house prices with a deep learning technique. In [28], long short-term memory (LSTM) networks are combined with with the self-attention mechanism to handle textual property descriptions. The observation in the upper right corner in Figure 3 represents the only article that employs deep learning. It is characterized by the highest model novelty and recency in this literature study.
4.2. Data-Based Categorization
The categorization of the papers based on input data types used is shown in Table 6, similar to the model-based categorization table, with the count and range of publication years. Figure 4 shows the data novelty scores of the publications over time. These novelty scores were calculated on the basis of Table 4. The time axis of the plot is constructed by ordering the articles based on publication year and author name, as for the model novelty plot. The table shows that structural, temporal, POI and basic spatial information is used by the vast majority of papers. Socioeconomic and environmental information has been used by few researchers but has been considered since the early years of the study period. Advanced spatial data have also been included by some researchers both in the first half and more so in the second half of the period. Graphs, images and text are less prevalent categories and occur in at most two articles, mostly in the last year of the study period. As these different input data types are combined in many different ways across the entire time period considered, the data novelty plot appears scattered.
4.2.1. Structural Features
Most property valuation models include features related to the property. These are the ‘structural’ features that typically constitute an important building block of the covariates included in a hedonic house price model. Table 6 shows that 91 of the 93 papers considered defining a valuation method that employs features related to the houses. Therefore, structural information appears to function as the basis for property valuation data sets. Nevertheless, the inclusion can be limited to one indicator of the living area, or it can be very extensive, with a long list of structural values. Moreover, the area, or size, of a house consistently ranks among the two most important features. In [27], the authors show that four ML models assign a relative importance between 8% and 20% to the feature house area, which is the largest feature importance. The number of bedrooms and total number of floors in the building are also added, after area, to the top five in [106]. Lastly, the RF model in [105] ranks area as the second most important feature.
4.2.2. Temporal Data
Data related to age, construction year and transaction date are used as features related to individual properties in valuation models. Most researchers therefore include temporal data as a structural feature, usually as a numerical value or a dummy [45]. In [53], the authors estimate different models per year, which is motivated by an incomplete data set. Time-series models are the most obvious methods that require temporal data [94,96]. Another simpler method based on historical data is the repeat sales method [91]. This method is usually implemented by multiplying historical sales data with a market growth factor. However, in [91], the repeat sales method is combined with other hedonic approaches. Temporal data are the second most prevalent input data type over the whole study period, which indicates that this input data type has a similar importance to real estate valuation data sets as structural data. In addition, feature importance techniques rank building age and construction year among the five most important features [105,106].
4.2.3. Socioeconomic Features
Socioeconomic features are often included in hedonic pricing methods as part of the neighborhood features. These features can include demographic data about the population level in the neighborhood or age-related ratios, in addition to economic data. In [29], census variables such as population aged 16 and over, single-person households, owner occupation, the ratio of managerial or professional workers and unemployment rate are included for groups of properties. In [2], median household income is included as a covariate. Furthermore, occupant-level socioeconomic features are included in the hedonic regression model in [65]. Data such as annual household income, years of education and working experience were collected per house via survey. Although socioeconomic features are included in less than half of the publications, these features have been included from the start until the end of the study period (see Table 6). Thus, this input data type can be considered a standard property valuation feature. In [105], the authors find that income in building is the third most important feature for the RF model.
4.2.4. Environmental Features
Environmental features can be considered part of the neighborhood features. In [31], a street quality index and an index of nonresidential land use in the street is calculated based on the data. Additionally, land use or cover variables for the neighborhood are included in [55]. Census variables for environmental quality in general and more specific variables related to air and noise pollution are often included as environmental features in models [21,41,58,64,98]. In contrast to measured air pollution levels and similar features, environmental quality is often a subjective measure: for example, the perception of the presence of greenery [41] and perceived environmental conditions [21]. In [44,55], the authors transform GIS data and a digital elevation model into land use/cover variables including, in particular, visibility features. Furthermore, information about earthquakes can be included as an explanatory variable [59], and in [69], the effect of water quality on house prices is estimated. In total, 13 of the 93 property valuation articles include environmental information, as shown in Table 6.
4.2.5. POI Data
POIs are typically used as indicators for the neighborhood of a house. Therefore, the most common POIs are facilities such as schools, central business districts (CBDs), stations, highways, hospitals and natural amenities [31,57,65]. Typically, POI data are included in property valuation models as a distance feature, representing the distance from each property to the POI location [31]. However, POIs can also be included as dummy variables to denote the presence of a type of POI, such as a school, within a certain radius of the house [21,74]. In addition, the number of POI types can be included, such as the number of restaurants or schools nearby [23,88]. In [26], POI hotspots of green spaces and commercial and business facilities were constructed based on social media check-in data. POI data are used by more than half of the studied publications (see Table 6).
4.2.6. Basic Spatial Data
This input data type considers location data as coordinates and distance features calculated by standard measures such as Euclidean distance.
Coordinates. As the keywords ‘spatial’ and ‘geospatial’ were included in the search query, most articles include some form of location data. Therefore, only geographic coordinates are considered under this input data type. Still, 54 publications use coordinates as variables in the model or employ this input data in another way. For example, spatial econometric models base the spatial weights matrix on distances calculated with coordinates. Moreover, the spatially varying coefficient models require coordinate data to estimate the coefficients. The RF model in [106] ranked latitude as one of the most important features to predict house prices.
Distance features. Actual distance or accessibility measures as model features are considered under this input data type. Dummy variables that, for example, indicate whether there is a school within 5 km, are not considered as distance features but as POI data. Euclidean distance is often used for this type of feature [83]. The Haversine formula of great-circle distance is used to approximate a straight-line distance on the surface of a sphere, namely, the Earth, in [24]. In the literature, a variable that measures distance to the CBD is the most common distance feature and has been used to include locational features in hedonic models from early on in the hedonic property valuation history [31,46].
Basic spatial data are used by most articles, and their presence in property valuation models covers the complete study period (see Table 6). However, the use of exact location appears to have changed over the period. In the early years, the use of coordinates was implied by the weight matrix that was determined for spatial econometric models and kriging methods [2,45]. In contrast, a recent, more direct approach of including this spatial information is characterized by the introduction of longitude and latitude variables in the predictive models [104,105,106].
4.2.7. Advanced Spatial Data
This category considers advanced distance measures based on networks and topographical data.
Topographical data. Digital elevation models are often employed to construct visibility features [44,55]. These topographical data enable information about which areas with certain land uses are visible from each property to be included. In [39,51,58], on the other hand, the authors focus on noise pollution that might affect properties. They incorporate this information into their models by extracting noise levels from noise maps.
Advanced distance features. Distance based on road networks is a more advanced and realistic way to include distance in a valuation model and often requires a GIS tool to combine street networks and locations of properties and POIs [66]. Accessibility features and travel time, including foot, bike, or car travel, are also regarded as distance features. In [31], accessibility covariates were constructed using principal component analysis (PCA) of a set of travel times and walking times to POIs based on a road network. Similarly, in [57], two PCAs are performed: one for socioeconomic features and one for regional and local variables of accessibility measures based on travel times. In [32], local and global features were constructed to include accessibility measures; however, the features were calculated manually. Different traffic accessibility indices are included in [27]: walking accessibility in the road network, bus accessibility calculated based on bus stations and road network data, and metro accessibility based on the subway line map and station data. Moreover, they find that the traffic factors are among the most important features in their ML models. Lastly, centrality and connectivity variables are calculated based on the street network in [86].
Contrary to basic spatial information, advanced spatial data are included in only 16 papers: seven published before 2010 and nine published after 2010. Except for one publication, the presence of this input data type drives the data novelty score above 10 (see Figure 4). In addition, of the 19 articles that scored above 10 on data novelty, 15 articles incorporate advanced spatial information. The four articles that have a data novelty score above 10 and do not include advanced spatial information are characterized by the input data types described in the next sections and were all published in 2021. Figure 4 presents these four articles in the upper-right corner of the plot. Notwithstanding, the vast majority of the articles above the threshold of 10 in Figure 4 include advanced spatial information. However, these articles are characterized by a combination of all or almost all input data types described above. Nevertheless, Figure 4 shows that advanced spatial data indicate high data novelty.
4.2.8. Graph Data
In one article, the authors construct a graph themselves. In [19], a network is created connecting houses with POIs, regions, schools and train stations and their features in a graph structure based on location. This graph is then embedded with a graph neural network and used as a set of features in the prediction model. Graphs have been incorporated sparsely and only recently, since 2021, in real estate valuation models (see Table 6). The article that introduces graph data is characterized by high data novelty scores in Figure 4. The article is situated near the end of the x-axis, as it was published in 2021.
4.2.9. Image Data
As visual features are usually an important factor for home buyers, they should be included in property valuation methods. In [104], satellite imagery is used to extract these visual features embedded in vectors with a CNN. These vectors are then combined as neighborhood features with structural, socioeconomic, temporal, location and POI features into the final prediction model. Therefore, this publication achieves a high data novelty score and is situated in the upper-right corner of Figure 4, as it was published in 2021.
4.2.10. Textual Data
In [28,106], the authors base the property valuation models on textual descriptions of houses in combination with standard features. While the former incorporates descriptions as a document–word frequency matrix into the valuation model, the latter addresses the textual data in the model dimension with an LSTM model. Place names, transportation, facilities, and apartment qualities from the descriptions are given high importance by the model. This input data type is also characterized by very high data novelty scores and two of the most recent publications. Therefore, it represents the upper-right corner of Figure 4.
5. Discussion
In this section, we discuss the results in detail by looking at the model and data dimensions in combination and subsequently formulate an answer to the research questions.
5.1. Model and Data Novelty Clusters
Considering RQ 1 and RQ 2, Figure 5 depicts the model and data dimensions in combination by showing the two novelty scores in one plot with the same color coding as before. The 93 articles are represented by the respective model novelty score, data novelty score and publication year. Given that many research papers overlap in terms of model novelty and data novelty, jittering was applied to keep the scatterplot legible. In addition, we annotated the plot with five inferred clusters. To name the clusters, we define three categories of model types and two categories of input data types. Conventional hedonic methods comprise model types with model novelty scores between 1 and 2, basic ML methods denote model novelty scores between 3 and 4, and advanced ML methods have a model novelty score of 5 or higher. Traditional input data types denote a data novelty score between 1 and 9, and advanced (spatial) data comprise publications with a data novelty score of 10 and higher.
Cluster 1, characterized by low data and model novelty, represents conventional hedonic methods with traditional input data types. The data novelty range between one and nine illustrates that the input data types used are structural, temporal, socioeconomic, environmental, POI and/or basic spatial data. All classified articles propose a combination of input data types, except for [96], which relies on only time series of house prices, i.e., temporal data. A model novelty of one or two indicates that the model types are limited to MRA, kriging, SEM, SVC, time series and FL. With 65 observations (≈70%), this cluster is the largest of the five clusters, indicating a strong dominance of conventional modeling methods combined with traditional input data types. Overall, with publication dates ranging from 1992 until 2021, we can safely conclude that these model types are still the predominant method for house price prediction, despite the boom in research in ML and AI in the past 5–10 years. Nonetheless, a closer look at this cluster reveals a few microlevel patterns. First, listed methods with a model novelty score of two, i.e., time series and FL, have been used only until 2016. The more recent works in the cluster tend to implement SEM and SVC and, to a lesser extent, MRA and kriging. Second, in terms of data novelty, using a wider range of input data types is a common denominator of the more recently published works. With the exception of [21], all papers published in 2017 or later have a score of at least six. Therefore, research on the conventional hedonic method has focused on broadening the included input data types from structural to temporal and basic spatial data while still mainly relying on established methods such as MRA, SEM, SVC and kriging.
Cluster 2 contains 14 observations with a model novelty score of 1 and a data novelty score of 11 or higher. What distinguishes this cluster from cluster 1 is the addition of advanced spatial information. Therefore, this cluster can be described as conventional hedonic methods with advanced spatial data. The model score of 1 reflects the use of conventional model types, mainly MRA and SEM before 2015 and complemented with kriging and SVC thereafter.
The third cluster comprises six articles introducing more advanced model types, in particular basic ML methods, yet still relying on traditional input data types. What is apparent is that model novelty decreases over time in this cluster. The three articles published between 2011 and 2016 employ ANNs and SVMs, as indicated by a score of four. In contrast, the three articles published in 2017 and 2021 employ NN and DT, which contribute to lower model novelty. Regarding input data types used, only one article [25] does not use basic spatial information, which causes its data novelty score to fall back to three, although it is among the most recently published articles.
Cluster 4 is the smallest cluster, containing only three articles. While it is characterized by low data novelty scores, the articles show high model novelty and recency. Cluster 4 can be described as advanced ML methods with traditional input data types. All articles in this cluster use the RF method and were published in 2020 or 2021. The two most recent articles combine structural, temporal, socioeconomic, POI and basic spatial information, whereas the article from 2020 includes only structural, POI and basic spatial data.
Cluster 5 is the most novel cluster and contains five articles that show high data novelty and model novelty published in the two most recent years of the study period. It comprises advanced ML/DL methods with advanced input data types. However, this cluster is characterized by some variation regarding both the use of input data and model types. In contrast to the high data novelty scores of the other articles, the article [27] has a score of only twelve because the most novel input data type used is advanced spatial information, while the other articles employ images, graphs or textual data. The model novelty covers a wider range than that of other clusters. The article that uses deep learning is the rightmost observation in Figure 5, with the highest model novelty score. Three articles in the cluster, which use GBT and other ensemble methods, have a score of six. However, the article [104] is an outlier in this cluster with regard to model novelty score, as its score of 4 is below the threshold of this cluster. Although the prediction model is an MLP, CNNs are used to transform image data into features for the final prediction method; thus, this paper has similar data and model novelty as the other observations in cluster 5.
5.2. Trends and Opportunities
As for RQ 3, in general, the residential property valuation domain focuses on model and input data types that have proven their value. A large majority of the earlier and recent articles show low data and model novelty. Nonetheless, a few articles distinguish themselves from this majority by exhibiting high data novelty, model novelty, or both. The articles that experiment with novel ML methods are very recent, indicating a trend toward more advanced ML prediction models in the property valuation domain that has been characterized by standard methods for a long time. A similar trend toward greater novelty can be observed in the data dimension in the form of graphs and unstructured data. Although the data dimension appears to have been the subject of much more experimentation throughout the years, the standard features remain structural, temporal and basic spatial information.
Several factors may explain the restriction of the residential property valuation domain to conventional hedonic methods and traditional input data types. The first is data availability. With the emergence of big data and deep learning methods, researchers have begun to collect large data sets. However, publicly available housing data sets of high quality containing not only the transaction price but also hedonic data and spatial data are quite rare. Data sets containing traditional input data of houses in the US and Australia are available online [108,109,110,111]. The spatial extent of these datasets is limited to a city or county: King County, USA [108], Melbourne, Australia [109], Ames, Iowa, USA [110], and Boston, USA [111]. However, location and more advanced (spatial) data are often sourced separately from the main housing data set. This entails difficulties such as merging the data sets, handling missing data and most likely sparse data. In addition, graphs, images and text impose more data-related challenges, as the collection and preprocessing of these data are resource- and time-intensive tasks. A second reason might be the discrepancy between academia and industry. In industry, more novel methods and input data types might have been explored without a reflection in academic research [108,112,113,114,115,116].
The gradual trends toward combining traditional input data types with more advanced input data types and using more advanced predictive methods present new opportunities for the property valuation field. First, there is opportunity in the use of unstructured data, such as images and textual data [117]. Another opportunity related to advanced data is the construction of advanced spatial data such as more complex distances between properties and POIs. Furthermore, the introduction of more advanced data will require tailored methods and deep learning. Deep learning methods become more important when unstructured data are used because these methods can handle this type of data more efficiently [117]. However, the combination of these advanced input data types with traditional input data types introduces a distinctive variety of features, which might require tailoring advanced ML methods to extract information more effectively from various features [118,119]. Hence, future work could explore the combination of advanced input data types, including unstructured and complex spatial data, and DL or tailored ML methods that can handle the heterogeneity of the input data.
6. Conclusions
As residential property valuation is an important task for several real estate stakeholders, a comprehensive overview of the literature approaching this problem is not only valuable for research but also society. Accurate valuations improve the information flow in the real estate market, the formation of housing policies and real estate appraisal in general. Therefore, existing research that proposes predictive methods for house price prediction with geospatial data was systematically reviewed. Following the PSALSAR framework, the methodology of this literature study consisted of the Protocol step, where the research scope and questions are discussed, the Search and Appraisal steps, which are covered by the search strategy, the Synthesis step and the Analysis step. The latter steps were implemented by categorizing the papers with regard to the method proposed and the input data types used and analyzing the literature along these two dimensions. The papers were categorized into MRA, kriging, SEM, SVC, time series, FL, NN, DT, SVM, ANN, RF, GBT, (Other) ensembles or the DL method, on the one hand, and structural, temporal, socioeconomic, environmental, POI, basic spatial, advanced spatial, graphs, images and text data on the other hand. In addition, a model novelty score and data novelty score were assigned to each article. The model novelty was determined by awarding a score to each model type and then awarding the corresponding score to each paper based on the method that was proposed in that paper. For data novelty, the input data types were also scored first, but the final data novelty score for each paper was the sum of the scores corresponding to each input data type used. These model and data novelty scores were plotted with respect to time and analyzed on the basis of clusters of papers. Five clusters grouped conventional methods with traditional input data types, conventional methods with advanced spatial data, basic ML methods with traditional input data types, advanced ML methods with traditional input data types and advanced ML methods with advanced input data types. The first cluster contains almost 70% of the literature that was reviewed, which indicates that the property valuation domain is characterized by low data and model novelty. While most researchers stick to traditional methods and input data types, a few have explored advanced spatial data, unstructured data and ML or DL methods in more recent years [6,17,19,28,104]. These observations make it possible to identify opportunities that are in line with the slowly starting trends toward advanced input data types and advanced model types. Research opportunities remain in the use of DL methods to leverage unstructured data such as images and text as well as designing more advanced spatial features. In addition, the combination of distinctive features might benefit from tailored algorithms based on existing ML or DL methods.
Author Contributions
Conceptualization, Margot Geerts, Seppe vanden Broucke and Jochen De Weerdt; methodology, Margot Geerts, Seppe vanden Broucke and Jochen De Weerdt; writing—original draft preparation, Margot Geerts; writing—review and editing, Seppe vanden Broucke and Jochen De Weerdt; visualization, Margot Geerts; supervision, Seppe vanden Broucke and Jochen De Weerdt. All authors have read and agreed to the published version of the manuscript.
Funding
This research received no external funding.
Data Availability Statement
The data presented in this study are openly available in KU Leuven RDR at https://doi.org/10.48804/H1QCLH accessed on 16 February 2022 [15].
Conflicts of Interest
The authors declare no conflict of interest.
Appendix A

Table A1.
Model-based categorization.
| Study | MRA | Kriging | SEM | SVC | Time Series | FL | NN | DT | RF | GBT | SVM | ANN | (Other) Ensembles | DL |
| [2] | X | |||||||||||||
| [45] | X | |||||||||||||
| [29] | X | |||||||||||||
| [30] | X | |||||||||||||
| [31] | X | |||||||||||||
| [55] | X | |||||||||||||
| [56] | X | |||||||||||||
| [57] | X | |||||||||||||
| [94] | X | |||||||||||||
| [98] | X | |||||||||||||
| [46] | X | |||||||||||||
| [47] | X | |||||||||||||
| [58] | X | |||||||||||||
| [95] | X | |||||||||||||
| [59] | X | |||||||||||||
| [32] | X | |||||||||||||
| [33] | X | |||||||||||||
| [48] | X | |||||||||||||
| [34] | X | |||||||||||||
| [103] | X | |||||||||||||
| [22] | X | |||||||||||||
| [60] | X | |||||||||||||
| [61] | X | |||||||||||||
| [96] | X | |||||||||||||
| [35] | X | |||||||||||||
| [24] | X | |||||||||||||
| [79] | X | |||||||||||||
| [36] | X | |||||||||||||
| [37] | X | |||||||||||||
| [49] | X | |||||||||||||
| [50] | X | |||||||||||||
| [62] | X | |||||||||||||
| [38] | X | |||||||||||||
| [63] | X | |||||||||||||
| [80] | X | |||||||||||||
| [102] | X | |||||||||||||
| [81] | X | |||||||||||||
| [64] | X | |||||||||||||
| [97] | X | |||||||||||||
| [39] | X | |||||||||||||
| [51] | X | |||||||||||||
| [99] | X | |||||||||||||
| [82] | X | |||||||||||||
| [23] | X | |||||||||||||
| [65] | X | |||||||||||||
| [16] | X | |||||||||||||
| [83] | X | |||||||||||||
| [66] | X | |||||||||||||
| [26] | X | |||||||||||||
| [8] | X | |||||||||||||
| [84] | X | |||||||||||||
| [100] | X | |||||||||||||
| [67] | X | |||||||||||||
| [40] | X | |||||||||||||
| [68] | X | |||||||||||||
| [69] | X | |||||||||||||
| [85] | X | |||||||||||||
| [41] | X | |||||||||||||
| [70] | X | |||||||||||||
| [86] | X | |||||||||||||
| [71] | X | |||||||||||||
| [87] | X | |||||||||||||
| [52] | X | |||||||||||||
| [72] | X | |||||||||||||
| [42] | X | |||||||||||||
| [88] | X | |||||||||||||
| [21] | X | |||||||||||||
| [73] | X | |||||||||||||
| [74] | X | |||||||||||||
| [53] | X | |||||||||||||
| [54] | X | |||||||||||||
| [75] | X | |||||||||||||
| [89] | X | |||||||||||||
| [76] | X | |||||||||||||
| [4] | X | |||||||||||||
| [43] | X | |||||||||||||
| [90] | X | |||||||||||||
| [44] | X | |||||||||||||
| [91] | X | |||||||||||||
| [27] | X | |||||||||||||
| [92] | X | |||||||||||||
| [17] | X | |||||||||||||
| [93] | X | |||||||||||||
| [19] | X | |||||||||||||
| [25] | X | |||||||||||||
| [77] | X | |||||||||||||
| [104] | X | |||||||||||||
| [101] | X | |||||||||||||
| [78] | X | |||||||||||||
| [105] | X | |||||||||||||
| [106] | X | |||||||||||||
| [18] | X | |||||||||||||
| [28] | X | |||||||||||||
| Total | 16 | 10 | 29 | 18 | 4 | 4 | 2 | 1 | 3 | 1 | 1 | 3 | 2 | 1 |
Table A2.
Data-based categorization.
| Study | Structural | Temporal | Socioeconomic | Environmental | POI | Basic Spatial | Advanced Spatial | Graph | Image | Text |
| [2] | X | X | X | |||||||
| [45] | X | X | X | |||||||
| [29] | X | X | X | X | X | |||||
| [30] | X | X | X | X | ||||||
| [31] | X | X | X | X | X | X | ||||
| [55] | X | X | X | X | X | |||||
| [56] | X | X | X | |||||||
| [57] | X | X | X | X | X | X | ||||
| [94] | X | X | X | |||||||
| [98] | X | X | X | X | X | |||||
| [46] | X | X | X | X | ||||||
| [47] | X | X | ||||||||
| [58] | X | X | X | X | X | |||||
| [95] | X | X | X | X | X | |||||
| [59] | X | X | X | X | X | X | X | |||
| [32] | X | X | X | X | X | |||||
| [33] | X | X | X | X | ||||||
| [48] | X | X | X | |||||||
| [34] | X | X | X | X | ||||||
| [103] | X | X | X | |||||||
| [22] | X | X | X | |||||||
| [60] | X | X | X | |||||||
| [61] | X | X | X | X | X | |||||
| [96] | X | |||||||||
| [35] | X | X | X | |||||||
| [24] | X | X | X | X | ||||||
| [79] | X | X | X | X | ||||||
| [36] | X | X | X | |||||||
| [37] | X | X | X | |||||||
| [49] | X | X | X | X | ||||||
| [50] | X | X | ||||||||
| [62] | X | X | X | |||||||
| [38] | X | X | X | X | ||||||
| [63] | X | X | X | |||||||
| [80] | X | X | X | X | X | |||||
| [102] | X | X | X | X | ||||||
| [81] | X | X | X | X | X | |||||
| [64] | X | X | X | X | X | |||||
| [97] | X | X | X | X | X | |||||
| [39] | X | X | X | X | X | X | ||||
| [51] | X | X | X | |||||||
| [99] | X | X | ||||||||
| [82] | X | X | X | |||||||
| [23] | X | X | X | X | X | |||||
| [65] | X | X | X | X | X | X | ||||
| [16] | X | X | X | |||||||
| [83] | X | X | X | X | ||||||
| [66] | X | X | X | X | X | X | ||||
| [26] | X | X | X | X | ||||||
| [8] | X | X | X | |||||||
| [84] | X | X | X | |||||||
| [100] | X | X | X | X | X | |||||
| [67] | X | X | X | |||||||
| [40] | X | X | X | |||||||
| [68] | X | X | X | X | ||||||
| [69] | X | X | X | X | X | |||||
| [85] | X | X | X | X | ||||||
| [41] | X | X | X | X | X | |||||
| [70] | X | X | X | X | ||||||
| [86] | X | X | X | X | X | |||||
| [71] | X | X | X | X | ||||||
| [87] | X | X | X | X | X | |||||
| [52] | X | X | X | X | ||||||
| [72] | X | X | X | |||||||
| [42] | X | X | X | |||||||
| [88] | X | X | X | X | ||||||
| [21] | X | X | X | X | X | X | ||||
| [73] | X | X | X | X | X | |||||
| [74] | X | X | X | X | ||||||
| [53] | X | X | X | X | ||||||
| [54] | X | X | X | X | ||||||
| [75] | X | X | X | X | ||||||
| [89] | X | X | X | X | X | |||||
| [76] | X | X | X | X | ||||||
| [4] | X | X | X | |||||||
| [43] | X | X | X | |||||||
| [90] | X | X | X | |||||||
| [44] | X | X | X | X | X | X | X | |||
| [91] | X | X | X | |||||||
| [27] | X | X | X | X | ||||||
| [92] | X | X | X | X | X | |||||
| [17] | X | X | X | |||||||
| [93] | X | X | X | |||||||
| [19] | X | X | X | X | X | X | ||||
| [25] | X | X | X | |||||||
| [77] | X | X | X | X | X | |||||
| [104] | X | X | X | X | X | X | ||||
| [101] | X | X | X | |||||||
| [78] | X | X | X | X | ||||||
| [105] | X | X | X | X | X | |||||
| [106] | X | X | X | |||||||
| [18] | X | X | X | X | X | |||||
| [28] | X | X | X | X | ||||||
| Total | 91 | 78 | 40 | 13 | 56 | 81 | 16 | 1 | 1 | 2 |
References
- Rosen, S. Hedonic Prices and Implicit Markets: Product Differentiation in Pure Competition. J. Political Econ. 1974, 82, 34–55. [Google Scholar] [CrossRef]
- Can, A. Specification and estimation of hedonic housing price models. Reg. Sci. Urban Econ. 1992, 22, 453–474. [Google Scholar] [CrossRef]
- Kang, Y.; Zhang, F.; Peng, W.; Gao, S.; Rao, J.; Duarte, F.; Ratti, C. Understanding house price appreciation using multi-source big geo-data and machine learning. Land Use Policy 2021, 111, 104919. [Google Scholar] [CrossRef]
- Yacim, J.A.; Boshoff, D.G.B. A Comparison of Bandwidth and Kernel Function Selection in Geographically Weighted Regression for House Valuation. Int. J. Technol. 2019, 10, 58. [Google Scholar] [CrossRef]
- Tobler, W.R. A Computer Movie Simulating Urban Growth in the Detroit Region. Econ. Geogr. 1970, 46, 234–240. [Google Scholar] [CrossRef]
- Gao, Q.; Shi, V.; Pettit, C.; Han, H. Property valuation using machine learning algorithms on statistical areas in Greater Sydney, Australia. Land Use Policy 2022, 123, 106409. [Google Scholar] [CrossRef]
- Sisman, S.; Aydinoglu, A. Improving performance of mass real estate valuation through application of the dataset optimization and Spatially Constrained Multivariate Clustering Analysis. Land Use Policy 2022, 119, 106167. [Google Scholar] [CrossRef]
- Yang, Y.; Liu, J.; Xu, S.; Zhao, Y. An Extended Semi-Supervised Regression Approach with Co-Training and Geographical Weighted Regression: A Case Study of Housing Prices in Beijing. ISPRS Int. J. Geo-Inf. 2016, 5, 4. [Google Scholar] [CrossRef]
- Mengist, W.; Soromessa, T.; Legese, G. Method for conducting systematic literature review and meta-analysis for environmental science research. MethodsX 2020, 7, 100777. [Google Scholar] [CrossRef]
- Krause, A.L.; Bitter, C. Spatial econometrics, land values and sustainability: Trends in real estate valuation research. Cities 2012, 29, S19–S25. [Google Scholar] [CrossRef]
- Mccluskey, W.J.; Borst, R.A. Specifying the effect of location in multivariate valuation models for residential properties: A critical evaluation from the mass appraisal perspective. Prop. Manag. 2007, 25, 312–343. [Google Scholar] [CrossRef]
- Pagourtzi, E.; Assimakopoulos, V.; Hatzichristos, T.; French, N. Real estate appraisal: A review of valuation methods. J. Prop. Investig. Financ. 2003, 21, 383–401. [Google Scholar] [CrossRef]
- Wang, D.; Li, V.J. Mass appraisal models of real estate in the 21st century: A systematic literature review. Sustainability 2019, 11, 7006. [Google Scholar] [CrossRef]
- Zhou, G.; Ji, Y.; Chen, X.; Zhang, F. Artificial Neural Networks and the Mass Appraisal of Real Estate. Int. J. Online Eng. (IJOE) 2018, 14, 180. [Google Scholar] [CrossRef]
- Geerts, M.; De Weerdt, J.; vanden Broucke, S. A Survey of Methods and Input Data Types for House Price Prediction: Literature List. KU Leuven RDR 2022, V2. [Google Scholar] [CrossRef]
- Kutasi, D.; Badics, M.C. Valuation methods for the housing market: Evidence from Budapest. Acta Oecon 2016, 66, 527–546. [Google Scholar] [CrossRef]
- Yilmazer, E.S.; Kocaman, S. A mass appraisal assessment study using machine learning based on multiple regression and random forest. Land Use Policy 2020, 99, 104889. [Google Scholar] [CrossRef]
- Zhang, Y.; Zhang, D.; Miller, E.J. Spatial Autoregressive Analysis and Modeling of Housing Prices in City of Toronto. J. Urban Plan. Dev. 2021, 147, 05021003. [Google Scholar] [CrossRef]
- Das, S.S.S.; Ali, M.E.; Li, Y.F.; Kang, Y.B.; Sellis, T. Boosting house price predictions using geo-spatial network embedding. Data Min. Knowl. Discov. 2021, 35, 2221–2250. [Google Scholar] [CrossRef]
- Bengio, Y.; Goodfellow, I.; Courville, A. Deep Learning; MIT Press: Cambridge, MA, USA, 2017; Volume 1. [Google Scholar]
- Montero, J.M.; Mínguez, R.; Fernández-Avilés, G. Housing price prediction: Parametric versus semi-parametric spatial hedonic models. J. Geogr. Syst. 2018, 20, 27–55. [Google Scholar] [CrossRef]
- Nappi-Choulet, I.; Maury, T.P. A Spatial and Temporal Autoregressive Local Estimation for the Paris Housing Market. J. Reg. Sci. 2011, 51, 732–750. [Google Scholar] [CrossRef]
- Hui, E.C.M.; Zhong, J.; Yu, K. Heterogeneity in Spatial Correlation and Influential Factors on Property Prices of Submarkets Categorized by Urban Dwelling Spaces. J. Urban Plan. Dev. 2016, 142, 04014047. [Google Scholar] [CrossRef]
- Liao, W.C.; Wang, X. Hedonic house prices and spatial quantile regression. J. Hous. Econ. 2012, 21, 16–27. [Google Scholar] [CrossRef]
- Jasińska, E.; Preweda, E. Statistical Modelling of the Market Value of Dwellings, on the Example of the City of Kraków. Sustainability 2021, 13, 9339. [Google Scholar] [CrossRef]
- Wu, C.; Ye, X.; Ren, F.; Wan, Y.; Ning, P.; Du, Q. Spatial and Social Media Data Analytics of Housing Prices in Shenzhen, China. PLoS ONE 2016, 11, e0164553. [Google Scholar] [CrossRef]
- Xue, C.; Ju, Y.; Li, S.; Zhou, Q.; Liu, Q. Research on accurate house price analysis by using gis technology and transport accessibility: A case study of xi’an, china. Symmetry 2020, 12, 1329. [Google Scholar] [CrossRef]
- Zhou, X.; Tong, W. Learning with self-attention for rental market spatial dynamics in the Atlanta metropolitan area. Earth Sci. Inform. 2021, 14, 837–845. [Google Scholar] [CrossRef]
- Adair, A.S.; Berry, J.N.; McGreal, W.S. Hedonic modelling, housing submarkets and residential valuation. J. Prop. Res. 1996, 13, 67–83. [Google Scholar] [CrossRef]
- Gultekin, B.; Yamamura, E. Predicting Housing Prices in Central Ankara, Turkey Based on Spatial Dependence Analysis. Stud. Reg. Sci. 2002, 33, 217–227. [Google Scholar] [CrossRef]
- Orford, S. Valuing Locational Externalities: A GIS and Multilevel Modelling Approach. Environ. Plan. B Plan Des. 2002, 29, 105–127. [Google Scholar] [CrossRef]
- Martínez, L.M.; Viegas, J.M. Effects of Transportation Accessibility on Residential Property Values. Transp. Res. Rec. J. Transp. Res. Board. 2009, 2115, 127–137. [Google Scholar] [CrossRef]
- Osland, L.; Thorsen, I. Predicting housing prices at alternative locations and under alternative scenarios of the spatial job distribution. Lett. Spat. Resour. Sci. 2009, 2, 133–147. [Google Scholar] [CrossRef]
- Filippova, O.; Rehm, M. The impact of proximity to cell phone towers on residential property values. Int. J. Hous. Mark. Anal. 2011, 4, 244–267. [Google Scholar] [CrossRef]
- Koramaz, T.K.; Dokmeci, V. Spatial Determinants of Housing Price Values in Istanbul. Eur. Plan. Stud. 2012, 20, 1221–1237. [Google Scholar] [CrossRef]
- Brunauer, W.A.; Lang, S.; Feilmayr, W. Hybrid multilevel STAR models for hedonic house prices. Jahrb Reg. 2013, 33, 151–172. [Google Scholar] [CrossRef]
- Brunauer, W.; Lang, S.; Umlauf, N. Modelling house prices using multilevel structured additive regression. Stat. Model. 2013, 13, 95–123. [Google Scholar] [CrossRef]
- Panduro, T.E.; Veie, K.L. Classification and valuation of urban green spaces—A hedonic house price valuation. Landsc. Urban Plan. 2013, 120, 119–128. [Google Scholar] [CrossRef]
- Franck, M.; Eyckmans, J.; De Jaeger, S.; Rousseau, S. Comparing the impact of road noise on property prices in two separated markets. J. Environ. Econ. Policy 2015, 4, 15–44. [Google Scholar] [CrossRef]
- Keskin, B.; Dunning, R.; Watkins, C. Modelling the impact of earthquake activity on real estate values: A multi-level approach. J. Eur. Real Estate Res. 2017, 10, 73–90. [Google Scholar] [CrossRef]
- Marmolejo-Duarte, C. Does urban centrality influence residential prices? An analysis for the Barcelona Metropolitan Area. Rev. Constr. 2017, 16, 57–65. [Google Scholar] [CrossRef]
- Hill, R.J.; Scholz, M. Can Geospatial Data Improve House Price Indexes? A Hedonic Imputation Approach with Splines. Rev. Income Wealth 2018, 64, 737–756. [Google Scholar] [CrossRef]
- Doumpos, M.; Papastamos, D.; Andritsos, D.; Zopounidis, C. Developing automated valuation models for estimating property values: A comparison of global and locally weighted approaches. Ann. Oper. Res. 2021, 306, 415–433. [Google Scholar] [CrossRef]
- Osland, L.; Östh, J.; Nordvik, V. House price valuation of environmental amenities: An application of GIS-derived data. Reg. Sci. Policy Pract. 2020, 14, 939–959. [Google Scholar] [CrossRef]
- Chica Olmo, J. Spatial Estimation of Housing Prices and Locational Rents. Urban Stud. 1995, 32, 1331–1344. [Google Scholar] [CrossRef]
- Bourassa, S.C.; Cantoni, E.; Hoesli, M. Spatial dependence, housing submarkets, and house price prediction. J. Real Estate Financ. Econ. 2007, 35, 143–160. [Google Scholar] [CrossRef]
- Chica-Olmo, J. Prediction of housing location price by a multivariate spatial method: Cokriging. J. Real Estate Res. 2007, 29, 91–114. [Google Scholar] [CrossRef]
- Yoo, E.H.; Kyriakidis, P. Area-to-point Kriging in spatial hedonic pricing models. J. Geogr. Syst. 2009, 11, 381–406. [Google Scholar] [CrossRef]
- Chica-Olmo, J.; Cano-Guervos, R.; Chica-Olmo, M. A Coregionalized Model to Predict Housing Prices. Urban Geogr. 2013, 34, 395–412. [Google Scholar] [CrossRef]
- Larraz, B.; Población, J. An online real estate valuation model for control risk taking: A spatial approach. Investig. Anal. J. 2013, 42, 83–96. [Google Scholar] [CrossRef]
- Szczepańska, A.; Senetra, A.; Wasilewicz-Pszczółkowska, M. The effect of road traffic noise on the prices of residential property—A case study of the polish city of Olsztyn. Transp. Res. Part D Transp. Environ. 2015, 36, 167–177. [Google Scholar] [CrossRef]
- de Koning, K.; Filatova, T.; Bin, O. Improved Methods for Predicting Property Prices in Hazard Prone Dynamic Markets. Environ. Resour. Econ. 2018, 69, 247–263. [Google Scholar] [CrossRef]
- Chica-Olmo, J.; Cano-Guervos, R.; Chica-Rivas, M. Estimation of Housing Price Variations Using Spatio-Temporal Data. Sustainability 2019, 11, 1551. [Google Scholar] [CrossRef]
- Chica-Olmo, J.; Cano-Guervos, R.; Tamaris-Turizo, I. Determination of buffer zone for negative externalities: Effect on housing prices. Geogr. J. 2019, 185, 222–236. [Google Scholar] [CrossRef]
- Paterson, R.W.; Boyle, K.J. Out of Sight, Out of Mind? Using GIS to Incorporate Visibility in Hedonic Property Value Models. Land Econ. 2002, 78, 417–425. [Google Scholar] [CrossRef]
- Tse, R.Y.C. Estimating Neighbourhood Effects in House Prices: Towards a New Hedonic Model Approach. Urban Stud. 2002, 39, 1165–1180. [Google Scholar] [CrossRef]
- Thériault, M.; Des Rosiers, F.; Villeneuve, P.; Kestens, Y. Modelling interactions of location with specific value of housing attributes. Prop. Manag. 2003, 21, 25–62. [Google Scholar] [CrossRef]
- Cohen, J.P.; Coughlin, C.C. Spatial hedonic models of airport noise, proximity, and housing prices. J. Reg. Sci. 2008, 48, 859–878. [Google Scholar] [CrossRef]
- Zietz, J.; Zietz, E.N.; Sirmans, G.S. Determinants of House Prices: A Quantile Regression Approach. J. Real Estate Financ. Econ. 2008, 37, 317–333. [Google Scholar] [CrossRef]
- Zhu, B.; Füss, R.; Rottke, N.B. The Predictive Power of Anisotropic Spatial Correlation Modeling in Housing Prices. J. Real Estate Financ. Econ. 2011, 42, 542–565. [Google Scholar] [CrossRef]
- Cho, S.H.; Yu, T.H.E.; Kim, S.G.; Roberts, R.K.; Lee, D. Applying Directed Acyclic Graphs to Assist Specification of a Hedonic Model. Hous. Stud. 2012, 27, 984–1007. [Google Scholar] [CrossRef]
- Liu, X. Spatial and Temporal Dependence in House Price Prediction. J. Real Estate Financ. Econ. 2013, 47, 341–369. [Google Scholar] [CrossRef]
- Moreira de Aguiar, M.; Simões, R.; Braz Golgher, A. Housing market analysis using a hierarchical–spatial approach: The case of Belo Horizonte, Minas Gerais, Brazil. Reg. Stud. Reg. Sci. 2014, 1, 116–137. [Google Scholar] [CrossRef]
- Chasco, C.; Sánchez, B. Valuation of environmental pollution in the city of Madrid: An application with hedonic models and spatial quantile regression. Rev. Déconomie Reg. Urbaine 2015, 1, 343–370. [Google Scholar] [CrossRef]
- Izón, G.M.; Hand, M.S.; Mccollum, D.W.; Thacher, J.A.; Berrens, R.P. Proximity to Natural Amenities: A Seemingly Unrelated Hedonic Regression Model with Spatial Durbin and Spatial Error Processes. Growth Chang. 2016, 47, 461–480. [Google Scholar] [CrossRef]
- Welch, T.F.; Gehrke, S.R.; Wang, F. Long-term impact of network access to bike facilities and public transit stations on housing sales prices in Portland, Oregon. J. Transp. Geogr. 2016, 54, 264–272. [Google Scholar] [CrossRef]
- Gargallo, P.; Miguel, J.; Salvador, M. MCMC Bayesian spatial filtering for hedonic models in real estate markets. Spat. Stat. 2017, 22, 47–67. [Google Scholar] [CrossRef]
- Kim, H.; Lee, J. Hierarchical Spatially Varying Coefficient Process Model. Technometrics 2017, 59, 521–527. [Google Scholar] [CrossRef]
- Liu, T.; Opaluch, J.J.; Uchida, E. The impact of water quality in Narragansett Bay on housing prices. Water Resour. Res. 2017, 53, 6454–6471. [Google Scholar] [CrossRef]
- Ohler, A.; Blanco, G. Valuing Public Goods, the Time to Capitalization, and Network Externalities: A Spatial Hedonic Regression Analysis. Land Econ. 2017, 93, 127–144. [Google Scholar] [CrossRef]
- Stamou, M.; Mimis, A.; Rovolis, A. House price determinants in Athens: A spatial econometric approach. J. Prop. Res. 2017, 34, 269–284. [Google Scholar] [CrossRef]
- Gargallo, P.; Miguel, J.A.; Salvador, M.J. Bayesian Spatial Filtering for Hedonic Models: An Application for the Real Estate Market. Geogr. Anal. 2018, 50, 247–279. [Google Scholar] [CrossRef]
- Simlai, P. Spatial Dependence, Idiosyncratic Risk, and the Valuation of Disaggregated Housing Data. J. Real Estate Financ. Econ. 2018, 57, 192–230. [Google Scholar] [CrossRef]
- Yang, L.; Wang, B.; Zhou, J.; Wang, X. Walking accessibility and property prices. Transp. Res. Part D Transp. Environ. 2018, 62, 551–562. [Google Scholar] [CrossRef]
- Gröbel, S. Analysis of spatial variance clustering in the hedonic modeling of housing prices. J. Prop. Res. 2019, 36, 1–26. [Google Scholar] [CrossRef]
- Wang, W.C.; Chang, Y.J.; Wang, H.C. An Application of the Spatial Autocorrelation Method on the Change of Real Estate Prices in Taitung City. ISPRS Int. J. Geo-Inf. 2019, 8, 249. [Google Scholar] [CrossRef]
- Lieske, S.N.; van den Nouwelant, R.; Han, J.H.; Pettit, C. A novel hedonic price modelling approach for estimating the impact of transportation infrastructure on property prices. Urban Stud. 2021, 58, 182–202. [Google Scholar] [CrossRef]
- Pérez-Molina, E. Exploring a multilevel approach with spatial effects to model housing price in San José, Costa Rica. Environ. Plan B Urban Anal. City Sci. 2021, 3, 987–1004. [Google Scholar] [CrossRef]
- McCord, M.; Davis, P.; Haran, M.; McGreal, S.; McIlhatton, D. Spatial variation as a determinant of house price. J. Financ. Manag. Prop. Constr. 2012, 17, 49–72. [Google Scholar] [CrossRef]
- McCord, M.; Davis, P.; Haran, M.; McIlhatton, D.; McCord, J. Understanding rental prices in the UK: A comparative application of spatial modelling approaches. Int. J. Hous. Mark. Anal. 2014, 7, 98–128. [Google Scholar] [CrossRef]
- Wheeler, D.C.; Páez, A.; Spinney, J.; Waller, L.A. A Bayesian approach to hedonic price analysis. Pap. Reg. Sci. 2014, 93, 663–683. [Google Scholar] [CrossRef]
- Helbich, M.; Griffith, D.A. Spatially varying coefficient models in real estate: Eigenvector spatial filtering and alternative approaches. Comput. Environ. Urban Syst. 2016, 57, 1–11. [Google Scholar] [CrossRef]
- Liu, J.; Yang, Y.; Xu, S.; Zhao, Y.; Wang, Y.; Zhang, F. A Geographically Temporal Weighted Regression Approach with Travel Distance for House Price Estimation. Entropy 2016, 18, 303. [Google Scholar] [CrossRef]
- Bussas, M.; Sawade, C.; Kühn, N.; Scheffer, T.; Landwehr, N. Varying-coefficient models for geospatial transfer learning. Mach. Learn. 2017, 106, 1419–1440. [Google Scholar] [CrossRef]
- Lu, B.; Brunsdon, C.; Charlton, M.; Harris, P. Geographically weighted regression with parameter-specific distance metrics. Int. J. Geogr. Inf. Sci. 2017, 31, 982–998. [Google Scholar] [CrossRef]
- Shen, Y.; Karimi, K. The economic value of streets: Mix-scale spatio-functional interaction and housing price patterns. Appl. Geogr. 2017, 79, 187–202. [Google Scholar] [CrossRef]
- Xiao, Y.; Chen, X.; Li, Q.; Yu, X.; Chen, J.; Guo, J. Exploring Determinants of Housing Prices in Beijing: An Enhanced Hedonic Regression with Open Access POI Data. ISPRS Int. J. Geo-Inf. 2017, 6, 358. [Google Scholar] [CrossRef]
- Lan, F.; Wu, Q.; Zhou, T.; Da, H. Spatial Effects of Public Service Facilities Accessibility on Housing Prices: A Case Study of Xi’an, China. Sustainability 2018, 10, 4503. [Google Scholar] [CrossRef]
- Hu, L.; Chun, Y.; Griffith, D.A. A Multilevel Eigenvector Spatial Filtering Model of House Prices: A Case Study of House Sales in Fairfax County, Virginia. ISPRS Int. J. Geo-Inf. 2019, 8, 508. [Google Scholar] [CrossRef]
- McCord, M.J.; McCord, J.; Davis, P.T.; Haran, M.; Bidanset, P. House price estimation using an eigenvector spatial filtering approach. Int. J. Hous. Mark. Anal. 2019, 13, 845–867. [Google Scholar] [CrossRef]
- Oust, A.; Hansen, S.N.; Pettrem, T.R. Combining Property Price Predictions from Repeat Sales and Spatially Enhanced Hedonic Regressions. J. Real Estate Financ. Econ. 2020, 61, 183–207. [Google Scholar] [CrossRef]
- Yang, L.; Chau, K.; Szeto, W.; Cui, X.; Wang, X. Accessibility to transit, by transit, and property prices: Spatially varying relationships. Transp. Res. Part D Transp. Environ. 2020, 85, 102387. [Google Scholar] [CrossRef]
- Dambon, J.A.; Sigrist, F.; Furrer, R. Maximum likelihood estimation of spatially varying coefficient models for large data with an application to real estate price prediction. Spat. Stat. 2021, 41, 100470. [Google Scholar] [CrossRef]
- Francke, M.K.; Vos, G.A. The Hierarchical Trend Model for Property Valuation and Local Price Indices. J. Real Estate Financ. Econ. 2004, 28, 179–208. [Google Scholar] [CrossRef]
- Kaboudan, M.; Sarkar, A. Forecasting prices of single family homes using GIS-defined neighborhoods. J. Geogr. Syst. 2008, 10, 23–45. [Google Scholar] [CrossRef]
- Gupta, R.; Miller, S.M. The Time-Series Properties of House Prices: A Case Study of the Southern California Market. J. Real Estate Financ. Econ. 2012, 44, 339–361. [Google Scholar] [CrossRef]
- Fotheringham, A.S.; Crespo, R.; Yao, J. Exploring, modelling and predicting spatiotemporal variations in house prices. Ann. Reg. Sci. 2015, 54, 417–436. [Google Scholar] [CrossRef]
- Pagourtzi, E.; Nikolopoulos, K.; Assimakopoulos, V. Architecture for a real estate analysis information system using GIS techniques integrated with fuzzy theory. J. Prop. Investig. Financ. 2006, 24, 68–78. [Google Scholar] [CrossRef]
- Alkhatib, H.; Weitkamp, A.; Zaddach, S.; Neumann, I. Realistic uncertainty estimation of the market value based on a Fuzzy-Bayesian sales comparison approach. ZFV-Geodasie Geoinf. Landmanag. 2015, 141, 169–178. [Google Scholar] [CrossRef]
- Cheung, S.K.C. A Localized Model for Residential Property Valuation: Nearest Neighbor with Attribute Differences. Int. Real Estate Rev. 2017, 20, 221–250. [Google Scholar] [CrossRef]
- Ozhegov, E.M.; Ozhegova, A. Distance in geographic and characteristics space for real estate pricing. Int. J. Hous. Mark. Anal. 2021, 15, 938–952. [Google Scholar] [CrossRef]
- Shim, J.; Bin, O.; Hwang, C. Semiparametric spatial effects kernel minimum squared error model for predicting housing sales prices. Neurocomputing 2014, 124, 81–88. [Google Scholar] [CrossRef]
- Liu, X.s.; Deng, Z.; Wang, T.l. Real estate appraisal system based on GIS and BP neural network. Trans. Nonferrous Met. Soc. China 2011, 21, s626–s630. [Google Scholar] [CrossRef]
- Lin, R.F.Y.; Ou, C.; Tseng, K.K.; Bowen, D.; Yung, K.; Ip, W. The Spatial neural network model with disruptive technology for property appraisal in real estate industry. Technol. Forecast. Soc. Chang. 2021, 173, 121067. [Google Scholar] [CrossRef]
- Rico-Juan, J.R.; Taltavull de La Paz, P. Machine learning with explainability or spatial hedonics tools? An analysis of the asking prices in the housing market in Alicante, Spain. Expert. Syst. Appl. 2021, 171, 114590. [Google Scholar] [CrossRef]
- Xu, L.; Li, Z. A New Appraisal Model of Second-Hand Housing Prices in China’s First-Tier Cities Based on Machine Learning Algorithms. Comput. Econ. 2021, 57, 617–637. [Google Scholar] [CrossRef]
- Casetti, E. Generating Models by the Expansion Method: Applications to Geographical Research. Geogr. Anal. 1972, 4, 81–91. [Google Scholar] [CrossRef]
- Kaggle. House Sales in King County, USA. Available online: https://www.kaggle.com/datasets/harlfoxem/housesalesprediction (accessed on 21 April 2023).
- Kaggle. Melbourne Housing Market. Available online: https://www.kaggle.com/anthonypino/melbourne-housing-market (accessed on 25 January 2022).
- De Cock, D. Ames, Iowa: Alternative to the boston housing data as an end of semester regression project. J. Stat. Education. 2011, 19. [Google Scholar] [CrossRef]
- Harrison, D.; Rubinfeld, D.L. Hedonic housing prices and the demand for clean air. J. Environ. Econ. Manag. 1978, 5, 81–102. [Google Scholar] [CrossRef]
- Ade-Ojo, J. Predicting House Prices with Machine Learning. Available online: https://towardsdatascience.com/predicting-house-prices-with-machine-learning-62d5bcd0d68f (accessed on 1 February 2022).
- Bershadskiy, I. Using Machine Learning Algorithm for Predicting House Valuations. Available online: https://yalantis.com/blog/predictive-algorithm-for-house-price/ (accessed on 1 February 2022).
- Chow, C. Machine Learning for Property Valuation. Available online: https://chrischow.github.io/dataandstuff/2019-09-15-machine-learning-for-property-valuation/ (accessed on 1 February 2022).
- Cuturi, M.P.; Etchebarne, G. Real Estate Pricing with Machine Learning & Non-Traditional Data Sources. Available online: https://tryolabs.com/blog/2021/06/25/real-estate-pricing-with-machine-learning–non-traditional-data-sources (accessed on 1 February 2022).
- Zillow. What Is a Zestimate? Zillow’s Zestimate Accuracy. Available online: https://www.zillow.com/z/zestimate/ (accessed on 1 February 2022).
- Ahmed, E.; Moustafa, M. House price estimation from visual and textual features. In Proceedings of the 8th International Joint Conference on Computational Intelligence, Porto, Portugal, 9–11 November 2016; pp. 62–68. [Google Scholar]
- Piao, Y.; Chen, A.; Shang, Z. Housing Price Prediction Based on CNN. In Proceedings of the 2019 9th International Conference on Information Science and Technology (ICIST), Hulunbuir, China, 2–5 August 2019; pp. 491–495. [Google Scholar] [CrossRef]
- Xiong, S.; Sun, Q.; Zhou, A. Improve the House Price Prediction Accuracy with a Stacked Generalization Ensemble Model. In Internet of Vehicles. Technologies and Services Toward Smart Cities. IOV 2019. Lecture Notes in Computer Science; Springer: Cham, Switzerland, 2020; pp. 382–389. [Google Scholar] [CrossRef]
Figure 1.
Flow diagram depicting the Search and Appraisal steps consisting of four phases to identify all relevant scientific works.
Figure 1.
Flow diagram depicting the Search and Appraisal steps consisting of four phases to identify all relevant scientific works.

Figure 2.
Number of articles published per year.

Figure 3.
Model novelty plot based on scores relative to study ID (sequence based on year). The color of the data point relates to the publication year.
Figure 3.
Model novelty plot based on scores relative to study ID (sequence based on year). The color of the data point relates to the publication year.

Figure 4.
Data novelty plot based on scores relative to study ID (sequence based on year). The color of the data point indicates the year of publication.
Figure 4.
Data novelty plot based on scores relative to study ID (sequence based on year). The color of the data point indicates the year of publication.

Figure 5.
Combined novelty plot of data novelty score relative to model novelty score. Each data point represents one article and is colored with respect to the publication year. Clusters of articles are indicated with ellipses and identified with numbers 1–5.
Figure 5.
Combined novelty plot of data novelty score relative to model novelty score. Each data point represents one article and is colored with respect to the publication year. Clusters of articles are indicated with ellipses and identified with numbers 1–5.

Table 1.
Search query.
| Data-Base | Search String | No. of Articles | Date of Acquisition |
|---|---|---|---|
| Scopus | TITLE-ABS (((real AND estate) OR house OR housing OR dwelling OR (residential AND property)) AND (valuation OR (price W/1 predict*) OR appraisal OR (price W/1 determin*)) AND (geospatial OR spatial)) | 412 | 11 October 2021 |
| WoS | TI = (((real AND estate) OR house OR housing OR dwelling OR (residential AND property)) AND (valuation OR (price AND predict*) OR appraisal OR (price AND determin*)) AND (geospatial OR spatial)) OR AB = (((real AND estate) OR house OR housing OR dwelling OR (residential AND property)) AND (valuation OR (price AND predict*) OR appraisal OR (price AND determin*)) AND (geospatial OR spatial)) | 600 | 11 October 2021 |
Table 2.
Most popular publication outlets.
| Source Title | Number of Articles |
|---|---|
| Journal of Real Estate Finance and Economics | 8 |
| International Journal of Housing Markets and Analysis | 4 |
| ISPRS International Journal of Geo-Information | 4 |
| Transportation Research Part D: Transport and Environment | 3 |
| Journal of Geographical Systems | 3 |
| Journal of Property Research | 3 |
Table 3.
Model novelty score.
| Model Type | Score |
|---|---|
| Multiple regression analysis | 1 |
| Kriging | 1 |
| Spatial econometric models | 1 |
| Spatially varying coefficient models | 1 |
| Time series models | 2 |
| Fuzzy logic | 2 |
| Nearest neighbors | 3 |
| Decision trees | 3 |
| Support vector machine | 4 |
| Artificial neural network | 4 |
| Random forest | 6 |
| Gradient boosted trees | 6 |
| Ensembles (other) | 6 |
| Deep learning | 8 |
Table 4.
Data novelty score.
| Input Data Type | Score |
|---|---|
| Standard features | |
| Structural | 1 |
| Temporal | 1 |
| Socioeconomic | 1 |
| Environmental | 1 |
| POI | 1 |
| Standard spatial data | 4 |
| Advanced spatial data | 6 |
| Graphs | 8 |
| Unstructured data | |
| Images | 10 |
| Text | 10 |
Table 5.
Model-based categorization of studies with count and the range of publication year per technique.
Table 5.
Model-based categorization of studies with count and the range of publication year per technique.
| Model | Studies | Count | Range |
| MRA | [29,30,31,32,33,34,35,36,37,38,39,40,41,42,43,44] | 16 | 1996–2020 |
| Kriging | [45,46,47,48,49,50,51,52,53,54] | 10 | 1995–2019 |
| SEM | [2,21,22,23,24,55,56,57,58,59,60,61,62,63,64,65,66,67,68,69,70,71,72,73,74,75,76,77,78] | 29 | 1992–2021 |
| SVC | [4,8,26,79,80,81,82,83,84,85,86,87,88,89,90,91,92,93] | 18 | 2012–2021 |
| Time Series | [94,95,96,97] | 4 | 2004–2015 |
| Fuzzy Logic | [98,99] | 2 | 2006–2016 |
| NN | [100,101] | 2 | 2017–2021 |
| DT | [25] | 1 | 2021–2021 |
| SVM | [102] | 1 | 2014–2014 |
| ANN | [16,103,104] | 3 | 2011–2021 |
| RF | [17,18,105] | 3 | 2020–2021 |
| GBT | [19] | 1 | 2021–2021 |
| Other Ensembles | [27,106] | 2 | 2020–2021 |
| DL | [28] | 1 | 2021–2021 |
Table 6.
Data type-based categorization of studies with count and the range of publication year per technique.
Table 6.
Data type-based categorization of studies with count and the range of publication year per technique.
Disclaimer/Publisher’s Note: The statements, opinions and data contained in all publications are solely those of the individual author(s) and contributor(s) and not of MDPI and/or the editor(s). MDPI and/or the editor(s) disclaim responsibility for any injury to people or property resulting from any ideas, methods, instructions or products referred to in the content. |
© 2023 by the authors. Licensee MDPI, Basel, Switzerland. This article is an open access article distributed under the terms and conditions of the Creative Commons Attribution (CC BY) license (https://creativecommons.org/licenses/by/4.0/).
Share and Cite
MDPI and ACS Style
Geerts, M.; vanden Broucke, S.; De Weerdt, J. A Survey of Methods and Input Data Types for House Price Prediction. ISPRS Int. J. Geo-Inf. 2023, 12, 200. https://doi.org/10.3390/ijgi12050200
AMA Style
Geerts M, vanden Broucke S, De Weerdt J. A Survey of Methods and Input Data Types for House Price Prediction. ISPRS International Journal of Geo-Information. 2023; 12(5):200. https://doi.org/10.3390/ijgi12050200
Chicago/Turabian StyleGeerts, Margot, Seppe vanden Broucke, and Jochen De Weerdt. 2023. "A Survey of Methods and Input Data Types for House Price Prediction" ISPRS International Journal of Geo-Information 12, no. 5: 200. https://doi.org/10.3390/ijgi12050200
Note that from the first issue of 2016, this journal uses article numbers instead of page numbers. See further details here.