Article

Testing Small-Scale Vitality Measurement Based on 5D Model Assessment with Multi-Source Data: A Resettlement Community Case in Suzhou

1
School of Geography & Planning, University of Liverpool, Liverpool L693BX, UK
2
School of Design, Xi’an Jiaotong-Liverpool University, Suzhou 215123, China
3
The Bartlett School of Planning, University College London, London WC1E 6BT, UK
*
Author to whom correspondence should be addressed.
ISPRS Int. J. Geo-Inf. 2022, 11(12), 626; https://doi.org/10.3390/ijgi11120626
Submission received: 29 August 2022 / Revised: 2 December 2022 / Accepted: 5 December 2022 / Published: 15 December 2022

Abstract

:
In China’s fourteenth five-year plan, urban regeneration has become one of the most crucial strategies for activating the existing cities. Since creating vibrant urban spaces is a critical component of urban regeneration, understanding the patterns of community vitality helps formulate reactive regeneration policies and design interventions. However, the lack of local-scale measurement criteria and data collection methods has posed significant constraints to assessing and rejuvenating community vitality. Taking Suzhou Nanhuan New Village as a study area, our research involved a comparative study approach to investigate the fundamental driving mechanism of urban vitality with the support of a theoretical model (5D theory), multi-source data input, real-time photography technologies, and statistical analysis tools (Analytic Hierarchy Process). The result shows at the community level, the original ‘3d’ dimensions (‘Density’, ‘Diversity’, ‘Design’) remain key elements for forming vibrant spatial quality and functionality, and density factors matter significantly. This study intends to provide a new paradigm for small-scale community vitality assessment, verification, and regeneration by combining urban morphology with people-oriented and environmental-oriented perspectives. This research could support quantitative research on creating vibrant high-density communities in the urban regeneration process and bring insights to academics and design practitioners.

1. Introduction

1.1. Community Vitality Enhancement: Regeneration Movement Orientation in China

In recent years, critical reflection on the rapid urbanisation of previous decades in China has been gradually increasing. Responding to the low spatial quality and vitality under unprecedented urbanisation, the 14th five-year national plan (2021–2025) first mentioned urban regeneration movement for reactivating the existing urban environment as an essential goal to optimise urban fabric and promote high-quality spaces with the guidance of people-oriented and harmonised living principles [1]. This new concept is highly associated with restoring the profitability and vitality of existing communities [2,3]. The urban renewal intentions it contains include a range of plans for demolition and redevelopment, partial renovation and full-scale transformation, and these latest guidelines align China with the direction of sustainable development [4]. Academics and practitioners are emphasising how to measure and create vibrant urban spaces effectively [5]. The renovation of old and dilapidated housing estates, which are the basic units of social space, is an important step towards high-quality urbanisation [6].
Urban vitality, as has been highlighted in various theories and literature, plays a key role in meeting people’s demands for high-quality living and promoting urbanisation connotative development [7]. Jacobs (1961) defines a vibrant urban environment as an assembly of urban design elements, including appropriate development density, land use and functional mix, aged buildings, small blocks, accessible streets, and a lack of border vacuums. Lynch (1971) describes a “supportive urban environment” as a settlement supported by vital functions and capacities of human beings. Supported by the provision of vibrant urban spaces, the well-being of people and the development of long-term, sustainable urban regeneration will facilitate a wide range of human activities, encourage social contact and interaction, and foster a feeling of safety and community among residents [8,9]. Therefore, precisely identifying the status quo of community vitality is much needed in formulating reactive and sustainable urban policies and designing interventions in the new context of connotative growth.
Information and communication technology development brings about tremendous available open-source geographic data, which has pushed the study of quantifying urban vitality into an unprecedented era [10]. With the penetration of quantitative assessment methods into urban design disciplines, spatial data mining and GIS (Geographical Information System) analysis techniques are being successfully applied to explore various planning elements related to vibrant urban places. Taking advantage of big data, Fan et al. (2021) used hourly Baidu heat map (BHM) data as a reference to depict urban vitality along the Yangtze River in Nanjing [11]. Wang et al. (2022) employed big data gathered from street view imaging (SVI), points of interest (POI), and social media comments to explore and discuss street space quality, providing a novel alternative for evaluating public realms based on the interplay between street vitality, service facilities, and the physical environment [9]. Guo, Chen, and Yang (2021) evaluated the street’s vitality by adopting optimised K-means clustering to identify street dynamic vitality categories and assessing the classification result based on vitality intensity and stability [12].
Urban vitality represents the quality of a place in terms of the interaction level between human activities and spatial entities [13]. Hui et al. (2021) define spatial vitality as inclusiveness, aggregation density, and urban park spatial usage intensity [14]. Li et al. (2021) described spatial vitality as the degree of satisfaction related to humans’ basic movements while living, producing, and exploring their surroundings [15]. Vibrant cities are an assembly of good forms, developed functions, and sufficient activities [16]. Therefore, various qualitative methods have been proposed to evaluate different planning elements, including urban morphology, population density, facility density, plot size, the degree of mix use, and landscape quality [17,18,19]. Determinants such as attractiveness, diversity, and accessibility have also been investigated, measured, and proved positively correlated with urban vibrancy [13]. These previous studies have guided urban planning practice on a city or regional scale. Nevertheless, there is limited evidence to determine whether these pre-existing measurement metrics for spatial vitality are transferrable to neighbourhood regeneration, partly due to the dilemma of land use, complex regeneration policy, and property issues. Multi-disciplinary knowledge is required to assist in making adaptive urban development strategies and design interventions.

1.2. New Urban Quantitative Analysis via Multi-Source Data and Wearable Equipment: Measuring Community Vitality

A quantitative analytic framework is an excellent tool for assessing spatial or spatiotemporal urban vitality to conduct the multi-criteria urban analysis of the status quo. Inspired by theoretical research, academics have methodically and comprehensively examined various spatially explicit distribution features and the implicit driving mechanisms of the built environment. In previous studies, scholars have classified the characteristics of urban space into economic, cultural, and social dimensions and generated multi-factor frameworks to synthesise urban dynamics as a weighed overlay result of economic, social, and environmental indicators [20]. This paper summarises these frameworks into the following two categories.
The first category of indicators focuses on allocating and developing infrastructure, business, and service resources. Kunze and Hecht (2015) extracted small catering businesses’ geographic distributions and impact to estimate area-based urban vitality [21]. A JPL (Junctions, POI, Location-based Services) appraisal matrix has been proposed to assess urban spaces from the aspects of traffic, function, and activity density [17].
The second category is more associated with urban morphological features. In recent years, numerous studies have shown that human activity intensity, the physical built environment, and human-environment interaction profoundly impact urban vitality [22,23]. Cervero and Kockelman (1997) suggested the potential impacts of urban design on urban vitality, including intersection density and mixed-use land [24]. Ye et al. (2018) used regression models to explore how density and typology have influenced the spatial vitality of Shenzhen [25]. Li et al. (2022) further classified spatial vitality into social, economic, and cultural dimensions, and interpreted them with street-related data to determine how the external environment has shaped the spatial vitality of Chengdu [8]. The “5D” theory (Density, Diversity, Design, Destination accessibility, Distance to Transit) has more extensive coverage as well as a more refined measurement that incorporates all the relevant concepts of urban vitality [26,27]. Apart from typical morphological features, it focuses on walking behavior that can represent community residents’ convenience, quality, and health status in localised scenarios [28,29]. Vale & Pereira (2016) stressed the efficacy of BE (built environment) factors under the ‘5D’ dimensions with medium-sized Portuguese cities taken as study areas [30]. Ogra & Ndebele (2013) regarded ‘5D’ components as the primary components that constitute citywide transit-oriented development (TOD) [31].
Although the preceding studies provide practical tools for quantifying the degree and elements of spatial vitality from holistic dimensions, there are still problems with providing robust evidence for community regeneration. Firstly, there is a lack of universal measurement to synthesise spatial activity at different scales or across different geographic boundaries, which has added more difficulty in precisely illustrating the differences in the spatial distribution of human-environment interactions on the micro-scale. Secondly, recent studies have only laid a technical foundation for measuring urban vitality with the ‘5D’ model in large-scale urban areas. The ways to tackle scaling-down issues, such as the repeated pattern of BE within a single phase of property development, the lack of detailed resolution (<30 m) satellite images, higher impurities, and poorer positioning accuracy in the construction of local human activities, have also become significant research constraints. Thirdly, a limited number of studies have focused on micro-scale measurement of spatial elements that shape high-quality communities or provide implemental strategies to guide community regeneration. Due to these difficulties, field observations, interviews, or other participatory methods are mainly adopted for primary data acquisition in prevalent Chinese community regeneration studies [14]. These difficulties have constrained the current community regeneration within its narrow scope of building façade renewal, infrastructure enhancement, or other similar “beautification” tactics, without the interference of data insight. However, these “placebo” strategies have insufficient contributions to resolving deep-rooted structural problems or improving the genuine living standards of local citizens. To fill the gap between urban regeneration practices and urban vitality assessment, it is essential and promising to conduct systematic and reactive local vitality evaluation at the community level.
In recent years, diverse methods for tracking human activity in big data have received widespread attention. With the development of sensor technologies, a substantial real-time record of the relationships between human activities and the built environment has emerged in recent research [32]. In other words, the time, the sequence of daily activities, and the geographic location with specific features of land use and population density can be used to infer spatial or spatiotemporal urban vitality. Some studies have utilised conventional environmental sensors to record people’s activities and various ground space characteristics. However, the expense and expertise required for deployment and maintenance of the monitoring system make it more challenging to achieve the density level required for refined community monitoring.
As opposed to traditional sensor techniques, street images have demonstrated superior efficiency and geographic reach for gathering micro-scale street features and pedestrian volume associated with the ‘5D’ urban analysis assessment framework and community vitality reflection [33]. Our work uses a mobility-based technique using wearable camera picture collection equipment to gain refined community vitality based on image identification and analysis software, while addressing flaws such as poor reliability owing to the area coverage and update frequency. Timely-taken pictures can provide high-quality data sources of precise scale, high validity, and fast and stable location updates for spatial vitality identification and verification due to the small size, lightweight, and portability of wearable cameras [8]. This provides the basis for perceiving more complex and three-dimensional community environment information and comprehensively evaluating the community vitality from the space-time perspective. However, the long collection period, high cost, and rigid schedules for field observation in the construction of the human activity process have made this approach hard to promote citywide, which could be seen as a significant research challenge.
In summary, the urgent agenda for evidence-based urban vitality improvement and Chinese community regeneration, data collection and mining technologies development, as well as the prevalence of quantitative analytical methods, provide a new paradigm for current urban scientific research. However, the existing analytical framework has not only failed to provide universal measurements to synthesise spatial vitality, but has also neglected to explore the application of research models at the community or local scale. This research combines multi-source heterogeneous data to provide a fundamental evaluation framework of urban vitality performance and its internal driving force based on the “5D” theory (i.e., design, diversity, density, distance to transit, and destination accessibility). It seeks to provide a comprehensive and systematic approach for measuring the connotation of local-scale spatial vitality. According to our best knowledge of previous research, this framework presents the following three innovations:
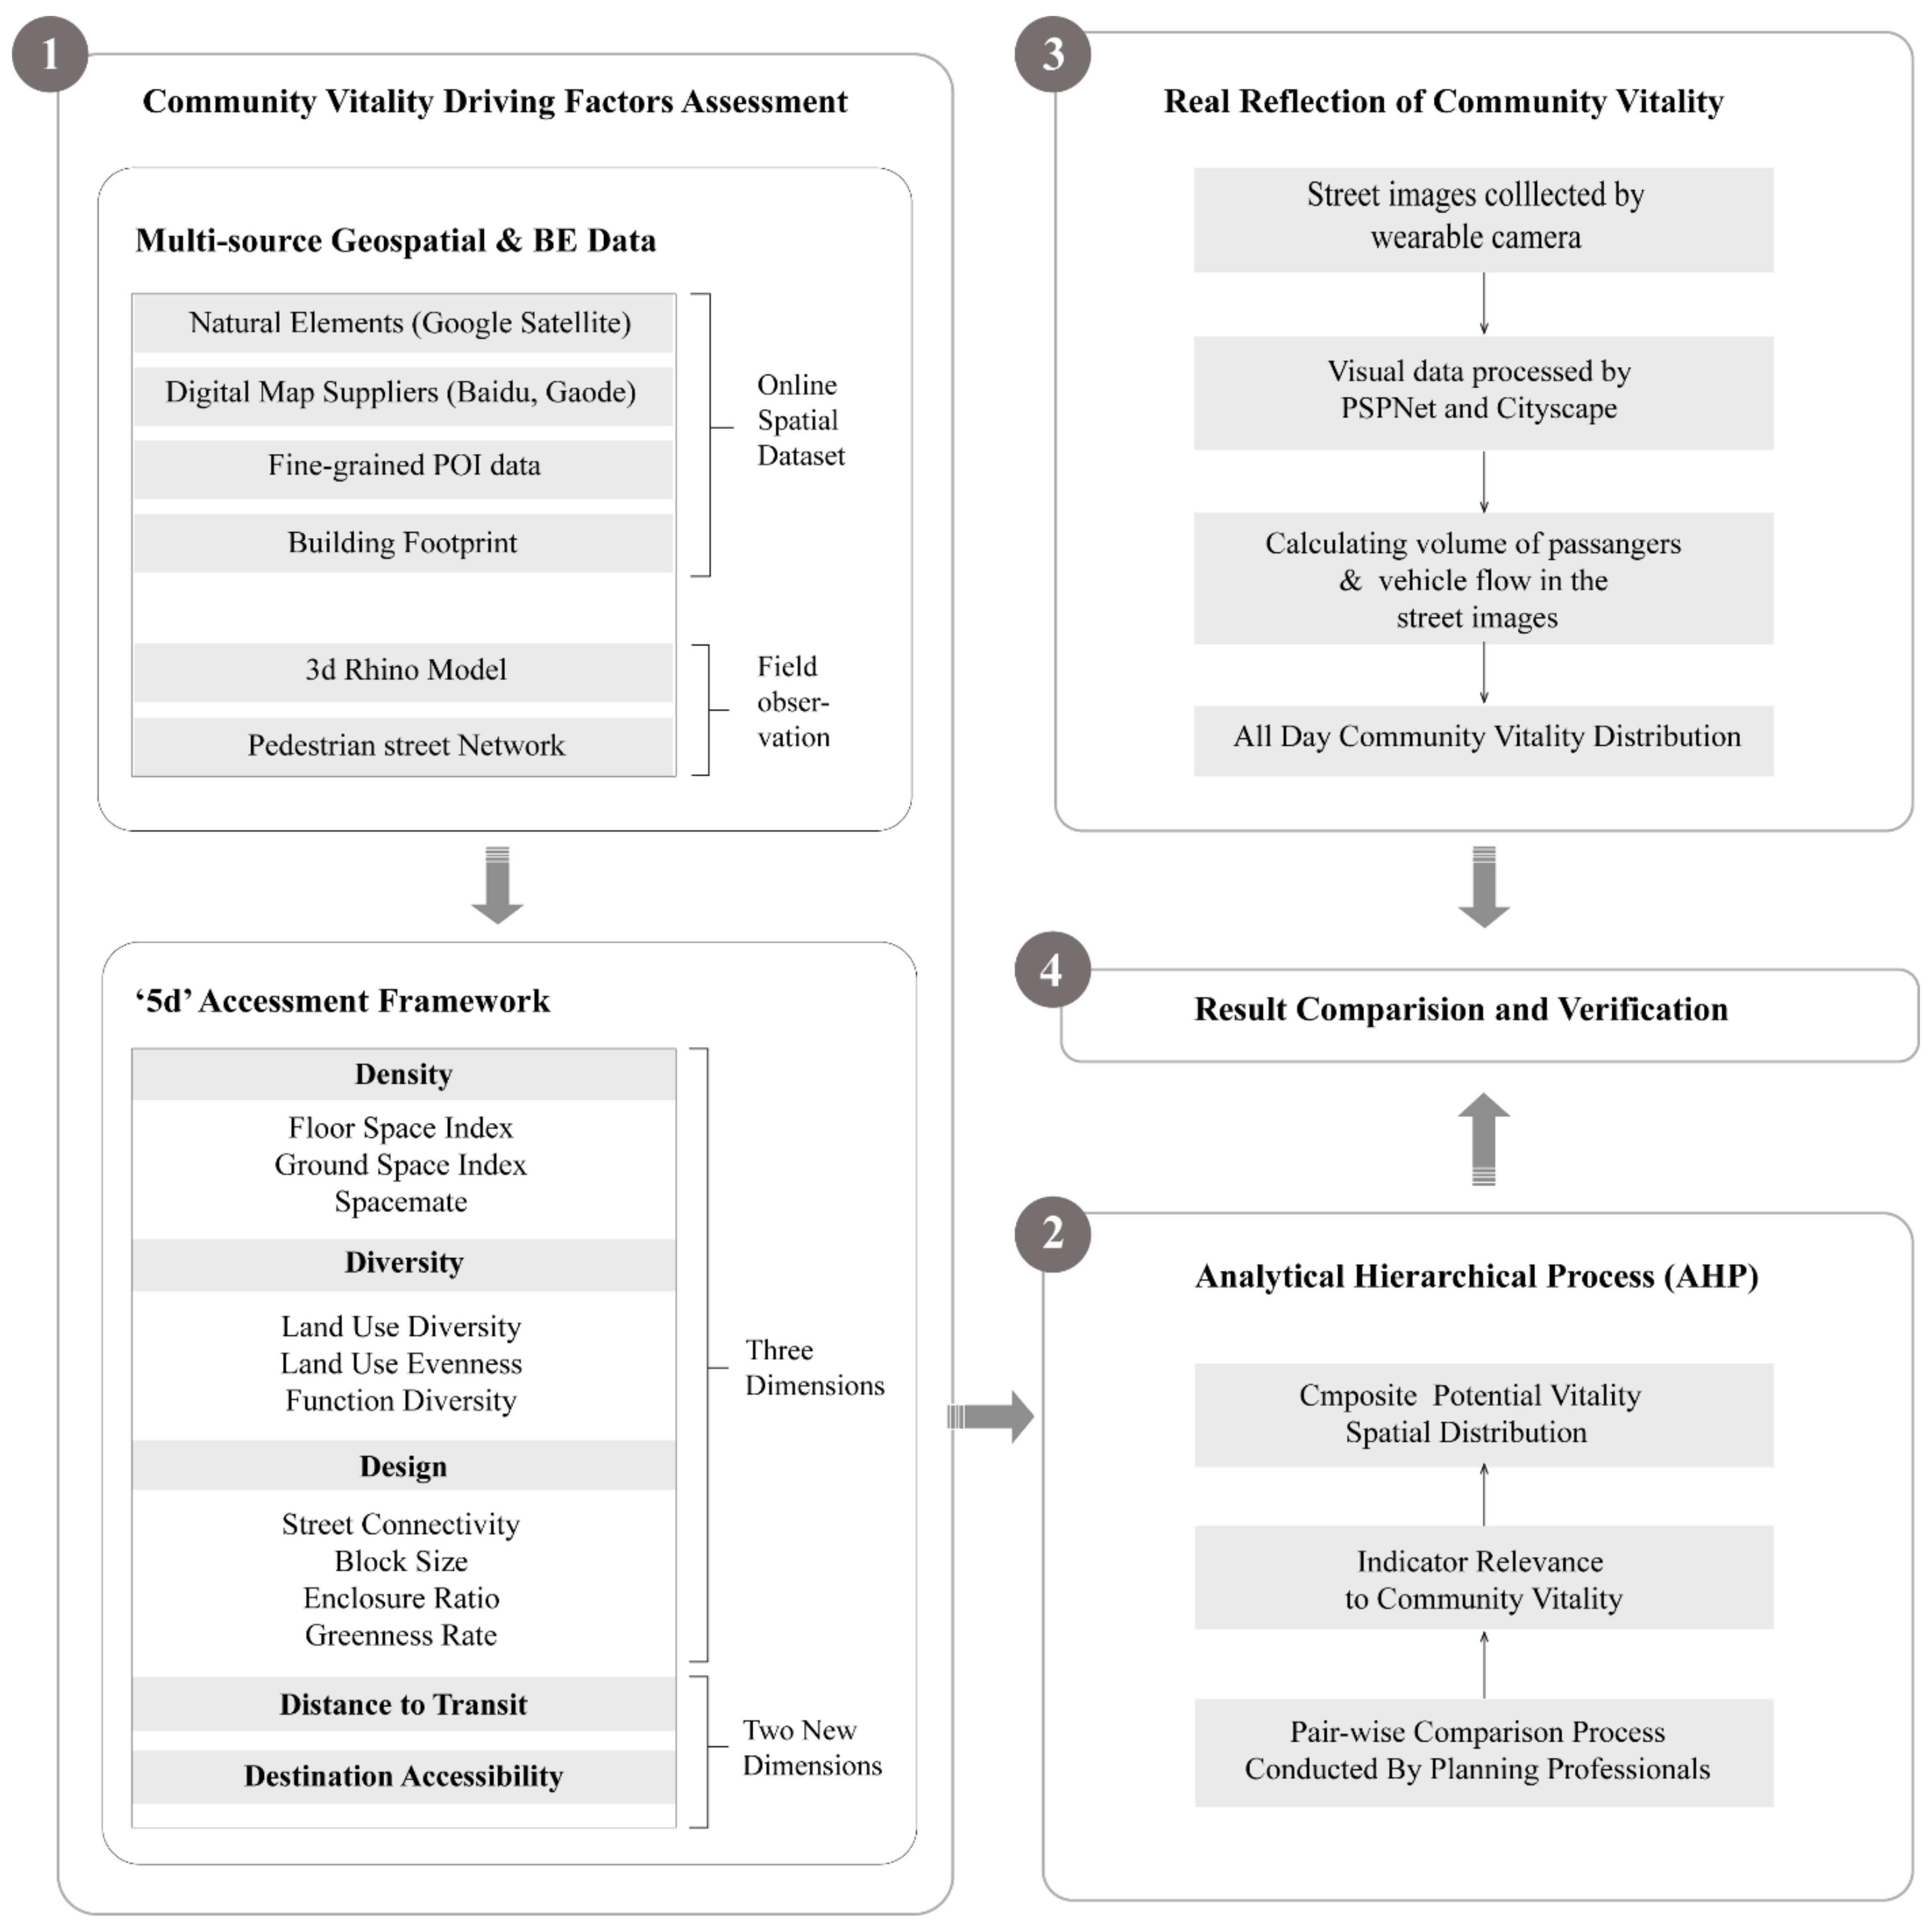
  • It is a novel paradigm for urban vitality study based on the deconstruction of connotation and explicit explanation of driving mechanisms. The study seeks to broaden the contemporary ‘5D’ theory assessment framework to guide small-scale community vitality assessment. The measurement criteria selected for each dimension are elaboratively tailored to local-scale planning components and purposefully moderated to better manifest the spatial vitality to solve the “scaling-down” issues.
  • Tracking human activities and inferring vitality differences with timely site photography is more accurate and efficient than traditional collection methods.
  • The proposed framework fully uses multi-source data and offers a multi-dimensional methodology for examining urban vitality driving indicators. This research investigates the underlying driving mechanism of urban vitality by combining the morphological and perceptual perspectives for shaping urban vitality efficiency.
Our framework enriches the theoretical framework, quantitative methodologies, and assessment variables of urban vitality. It reveals the method for developing urban vitality from the viewpoint of community regeneration. It offers multiple insights into enhancing urban vibrancy and supporting the coordinated and sustainable development of a declining Chinese high-density neighbourhood. As the global urbanisation forces continue to accelerate, the gravitational centre of human dynamics continues to shift to East Asia, particularly China [34]. Therefore, studies of urbanisation and its countermeasures require additional Chinese experience. This research examines a resettlement community in Suzhou, China, to verify the framework’s practical applicability. Based on our research on the driving mechanism of spatial vitality, we summarise the techniques for boosting urban vitality in terms of collaborative policymaking and urban design.
The remainder of this article is structured as follows. The following part describes the evaluation framework’s conceptual framework, data requirements and methodology, the case study area, and experimental configurations. In the subsequent sections, conclusions are discussed, followed by an elaboration of case study results.

2. Conceptual Framework

Community vitality is crucial to constructing vibrant urban environments and an important element of sustainable urban regeneration that improves the quality of life (QoL). However, rapid urbanisation in China has caused significant urban problems, such as the proliferation of inactive urban and community spaces. Incorporating community vitality into urban regeneration agendas demands reactive urban regeneration strategies and appropriate design interventions to address new problems. Therefore, it is essential to develop a precise and comprehensive community vitality assessment framework to maximise regeneration potentials, assist in policy formulation, and urban design, and improve QoL to the most significant extent. The two primary components of vitality evaluation in the present study area are qualitative studies based on questionnaires and interviews, and quantitative studies based on urban data and network analysis. Although researchers have begun applying multi-dimensional digital data to the urban analytics area, the constraints of conventional approaches continue to pose substantial challenges to accurately measuring community and local vitality. With the iteration of new technologies, urban vitality assessment studies have entered a prosperous period marked by an abundance of open-source geospatial data. According to the above thoughts, this research proposes a general analysis and evaluation methodology for measuring community vitality based on the ‘5D’ model assessment with multi-source data.
As shown in Figure 1, our study examines two distinct categories of data. The first type consists of built environment (BE) data, including point of interest (POI) data, land use, building, and street network, which are the data source for evaluating the ‘5D’ planning elements. The second category is composed of image data, which manifests the real-time distribution pattern of local vitality. Three core steps constitute our research: the urban vitality measurement, evaluation, and verification. The data collection method is introduced in Section 3.1.
Part 1 shows the urban vitality driving factors designed for this framework. We formulate twelve evaluation indicators to measure urban spatial vitality separately from the ‘5d’ dimensions (Density, Diversity, Design, Destination accessibility, and Distance to transit). The framework chooses evidence-based quantitative assessment to reflect the connotations of each dimension. High-density neighbourhoods tend to accommodate more activities within the same commuting radius. They are more concerned with the morphological features of individual blocks, which the floor space index (FSI) measures, Ground Space Index (GSI), and Spacemate [35,36]. Land use and functional (POI) diversity represents the distribution of location-based activity and land use practices, and is an essential catalyst for community vibrancy [13,21,37,38]. As the design dimension reflects pedestrians’ walking experiences and the aesthetic aspects of urban space, street connectivity, block size, greenness index, and enclosure ratio are the four selected variables for the measurement of mobility, attractiveness, and dynamics of urban spaces [39,40,41,42]. Closer distance to transit increases residents’ willingness to travel [43], and high destination accessibility boost walking activity, urban mobility, and sustainability [30]. The calculation method of all the above indicators is detailed in Section 3.2.1.
As seen in Part 2, we employ the Analytical Hierarchical Process (AHP) to accomplish two goals. First, we use a hierarchical matrix to compare the ‘5d’ influencing factors in terms of their contribution to community vitality. Second, we compute the composite impacts of ‘5d’ variables on the distribution of community vitality (by block) by assigning weights to each depending on their relevance to community regeneration. The community scale requirements have been incorporated into the weight allocation process to improve the efficiency and consistency of the weighing process. The quantitative calculation technique of AHP is described in depth in Section 3.2.1.
Part 3 describes the actual measurement and verification technique for vitality. Our methodology proposes a new perspective based on improved real-time data-gathering technologies. Especially when environmental sensing, image crowd-gathering, and quantitative recognition techniques are prevalent, the flexibility and precision of relevant devices become increasingly crucial for effective data collection and analysis. We use the PSPNet algorithm and Cityscape to process visual data collected from wearable cameras, and use the volume of passengers and vehicle flow in the street images to reflect community vitality.
In Part 4, by comparing it with the results calculated from the ‘5D’ theory assessment, our research’s contribution to the quantitative community vitality assessment methodology and real-life application is verified. The detailed procedure is discussed in Section 3.2.2.

3. Data and Methods

3.1. Data Source

According to our framework, multi-source data is the technical foundation of this paper. Image data covering accessible areas collected from a 15-day site tour, and BE data acquired from multi-source geospatial databases, are fused by individual urban blocks. They are used to identify the distribution of urban vitality and the driving factor for modelling and assessment. The composition, usage, source, and contents of these data are displayed in Table 1.

3.2. Methodology

3.2.1. Quantification Calculation of ‘5D’ Community Vitality Impact Factors

Precise GIS Spatial Vitality Analysis Based on ‘5D’ Theory Assessment Model

According to the conception of the ‘5D’ theory, several key indicators are selected from the previous application of the ‘5D’ theory, and moderated to suit the community scale. They are used to evaluate the two-dimensional ground value of urban ground BE features and human–land interaction. The meaning and calculation of the indicators are illustrated in Table 2.
In the first three formulas, F is the floor height, and L denotes a designated block’s average number of floor layers. Ax and Bx represent the areas of the individual block and the gross regions of all building footprints. The FSI shows the average density of 3d built-up spaces or population density. GSI reflects the average density of 2d ground floor spaces, described as ‘built potential’ [25]. According to Steadman (2014) and Ye, Li and Liu (2018), higher vitality derives from higher FSI/GSI, and GSI tends to exert a greater impact on urban vitality [44,45].
The mixing index of the Shannon entropy function represented in Equation (4) is widely used to measure spatial diversity and functional richness based on the variety of site types and the proportion of each type. LD refers to land use diversity. Pk is the proportion of the site area of the type in k to the block area, while n is the number of land use types in the block. A higher land use density for each block represents a better mix of facilities. In Equation (5), LE refers to the land use evenness, L D k refers to the land use diversity of the block, while L D m a x is the maximum value of the land use diversity among all the blocks. The closer the value is to 1, the more evenly distributed the block in the site. In Equation (6), FD denotes functional density, N k indicates the total number of POIs in the block, and A k denotes the area of the block. FD reflects the potential of a region to provide different types of urban services, with the higher value representing the higher potential of block functions. Jiang (2021), Dong and Zhang (2016) have proven that LD, LE, and FD positively impact urban vitality. Nevertheless, the three indices contribute to urban vitality to varying degrees [13,38].
We use the ‘link connectivity index’ to access street connectivity with the Space Syntax plug-in in ArcGIS. In Equation (7), higher link connectivity (LC) represents higher community vitality. The sampling databases for the greenness index (GI) and enclosure rate (ER) are built upon the graphic information taken regularly at 54 data points of 20-time site visits for two consecutive weeks. The photos were divided into different combinations of built-up areas, greenness areas, road areas, cars, and pedestrians by proportion. GI refers to the proportion of green features in a photo, which is positively correlated with urban vitality. Oliveira and Medeiros (2016) proposed using the ratio of building height to street width, namely enclosure ratio, to delineate how built-up elements can influence pedestrian walking experience and suggest a comprehensive method to measure the effect of average building setbacks, space between facades and street width simultaneously [42]. Therefore, we use the road proportion divided by the building proportion to calculate ER, which is negatively associated with urban vitality.
Destination accessibility (DA) and distance to transit are combined (DT) as one Decision Objective in Scheme Level: Position. We used the Local Integration Index in Spatial Design Network Analysis (SDNAs) to study the DA of the Nanhuan New Village. To avoid the boundary effect caused by the selecting area, the study selected rivers and highways as a boundary, which have apparent blocking effects on pedestrian movement. A higher DA results in higher local selectivity of the space unit within a certain travel radius, and the higher the space vitality can be obtained. We measure the shortest walking distance from the exit of each residential area to each bus stop to obtain the DT for each block. Areas with less DT are considered to have higher vitality.

Weighed Evaluation and Composition of Community Vitality Based on Analytic Hierarchy Process (AHP)

The Analytical Hierarchy Process (AHP) is a decision-making tool that helps to solve complex problems through problem decomposition, criteria selection, pairwise/relative comparison, and synthesis of the relative importance of rankings [46,47]. The analytical hierarchy process has been widely used in assessing and interpreting urban regeneration elements [48,49]. We use it to evaluate the ‘5d’ influencing factors in terms of their contribution to community vitality and calculate the total vitality index of individual blocks. Experts assess the elements of “5D” decision objectives and weight attribution results are ranked in scheme level and in the first intermediate layer, as shown in the Appendix A.
Table 3 shows the 12 selected indicators that make up the “5d” decision objectives. To make each factor comparable, the 12 types of data and their impacts (+/−) are remapped to the interval of values between 0 and 1, and weighed based on the results from AHP (the evaluation process refer to the Appendix A). “Density, Diversity, and Design” have been considered more responsible for community vitality and thus obtained higher weights, i.e., 0.4236, 0.2270, and 0.2270, respectively. Compared with the three significant factors, position-related variables (‘Distance to transit’ and ‘Destination Accessibility’) have lower weights (0.1223) due to the constrained scale of a community. The weights of the indicators vary from 0.0236 to 0.2286. The following formula gives the Potential Vitality Index (PVI) for the AHP approach. D is the number of possible factors from the “5d” dimensions, and X is the weight of each factor.
Potential Vitality Index (PVI) = i = 1 9 D i × X i .
Table 3. AHP assigned weight for urban vitality calculation.
Decision Objectives in Scheme LevelWeight in Scheme LevelIndicators in the First Intermediate Layer for Decision ObjectivesWeight in the Intermediate LayerPositive or Negative Correlation
Density0.4236Ground space index (GSI)0.2286+
Floor space index (FSI)0.1258+
Spacemate0.0692+
Diversity0.2270Land use diversity (LD)0.0568+
Land use evenness (LE)0.1135+
Function diversity (DF)0.0568+
Design0.2270Link connectivity (LC)0.0929+
Block size (BS)0.0236
Greenness index (GI)0.0731+
Enclosure rate (ER)0.0375
Position0.1223Destination accessibility (DA)0.0815+
Distance to transit (DT)0.0408

3.2.2. Reflection and Verification of Community Vitality Based on the Wearable Camera

Our mobility-based approach to estimating local vitality is based on visual data collection through the wearable camera and data procession via PSPNet (Pyramid Scene Parsing Network) [50]. The spatially explicit characteristics of urban vitality are extracted and compared with the ‘5D’ assessment results by the following three components:
(1)
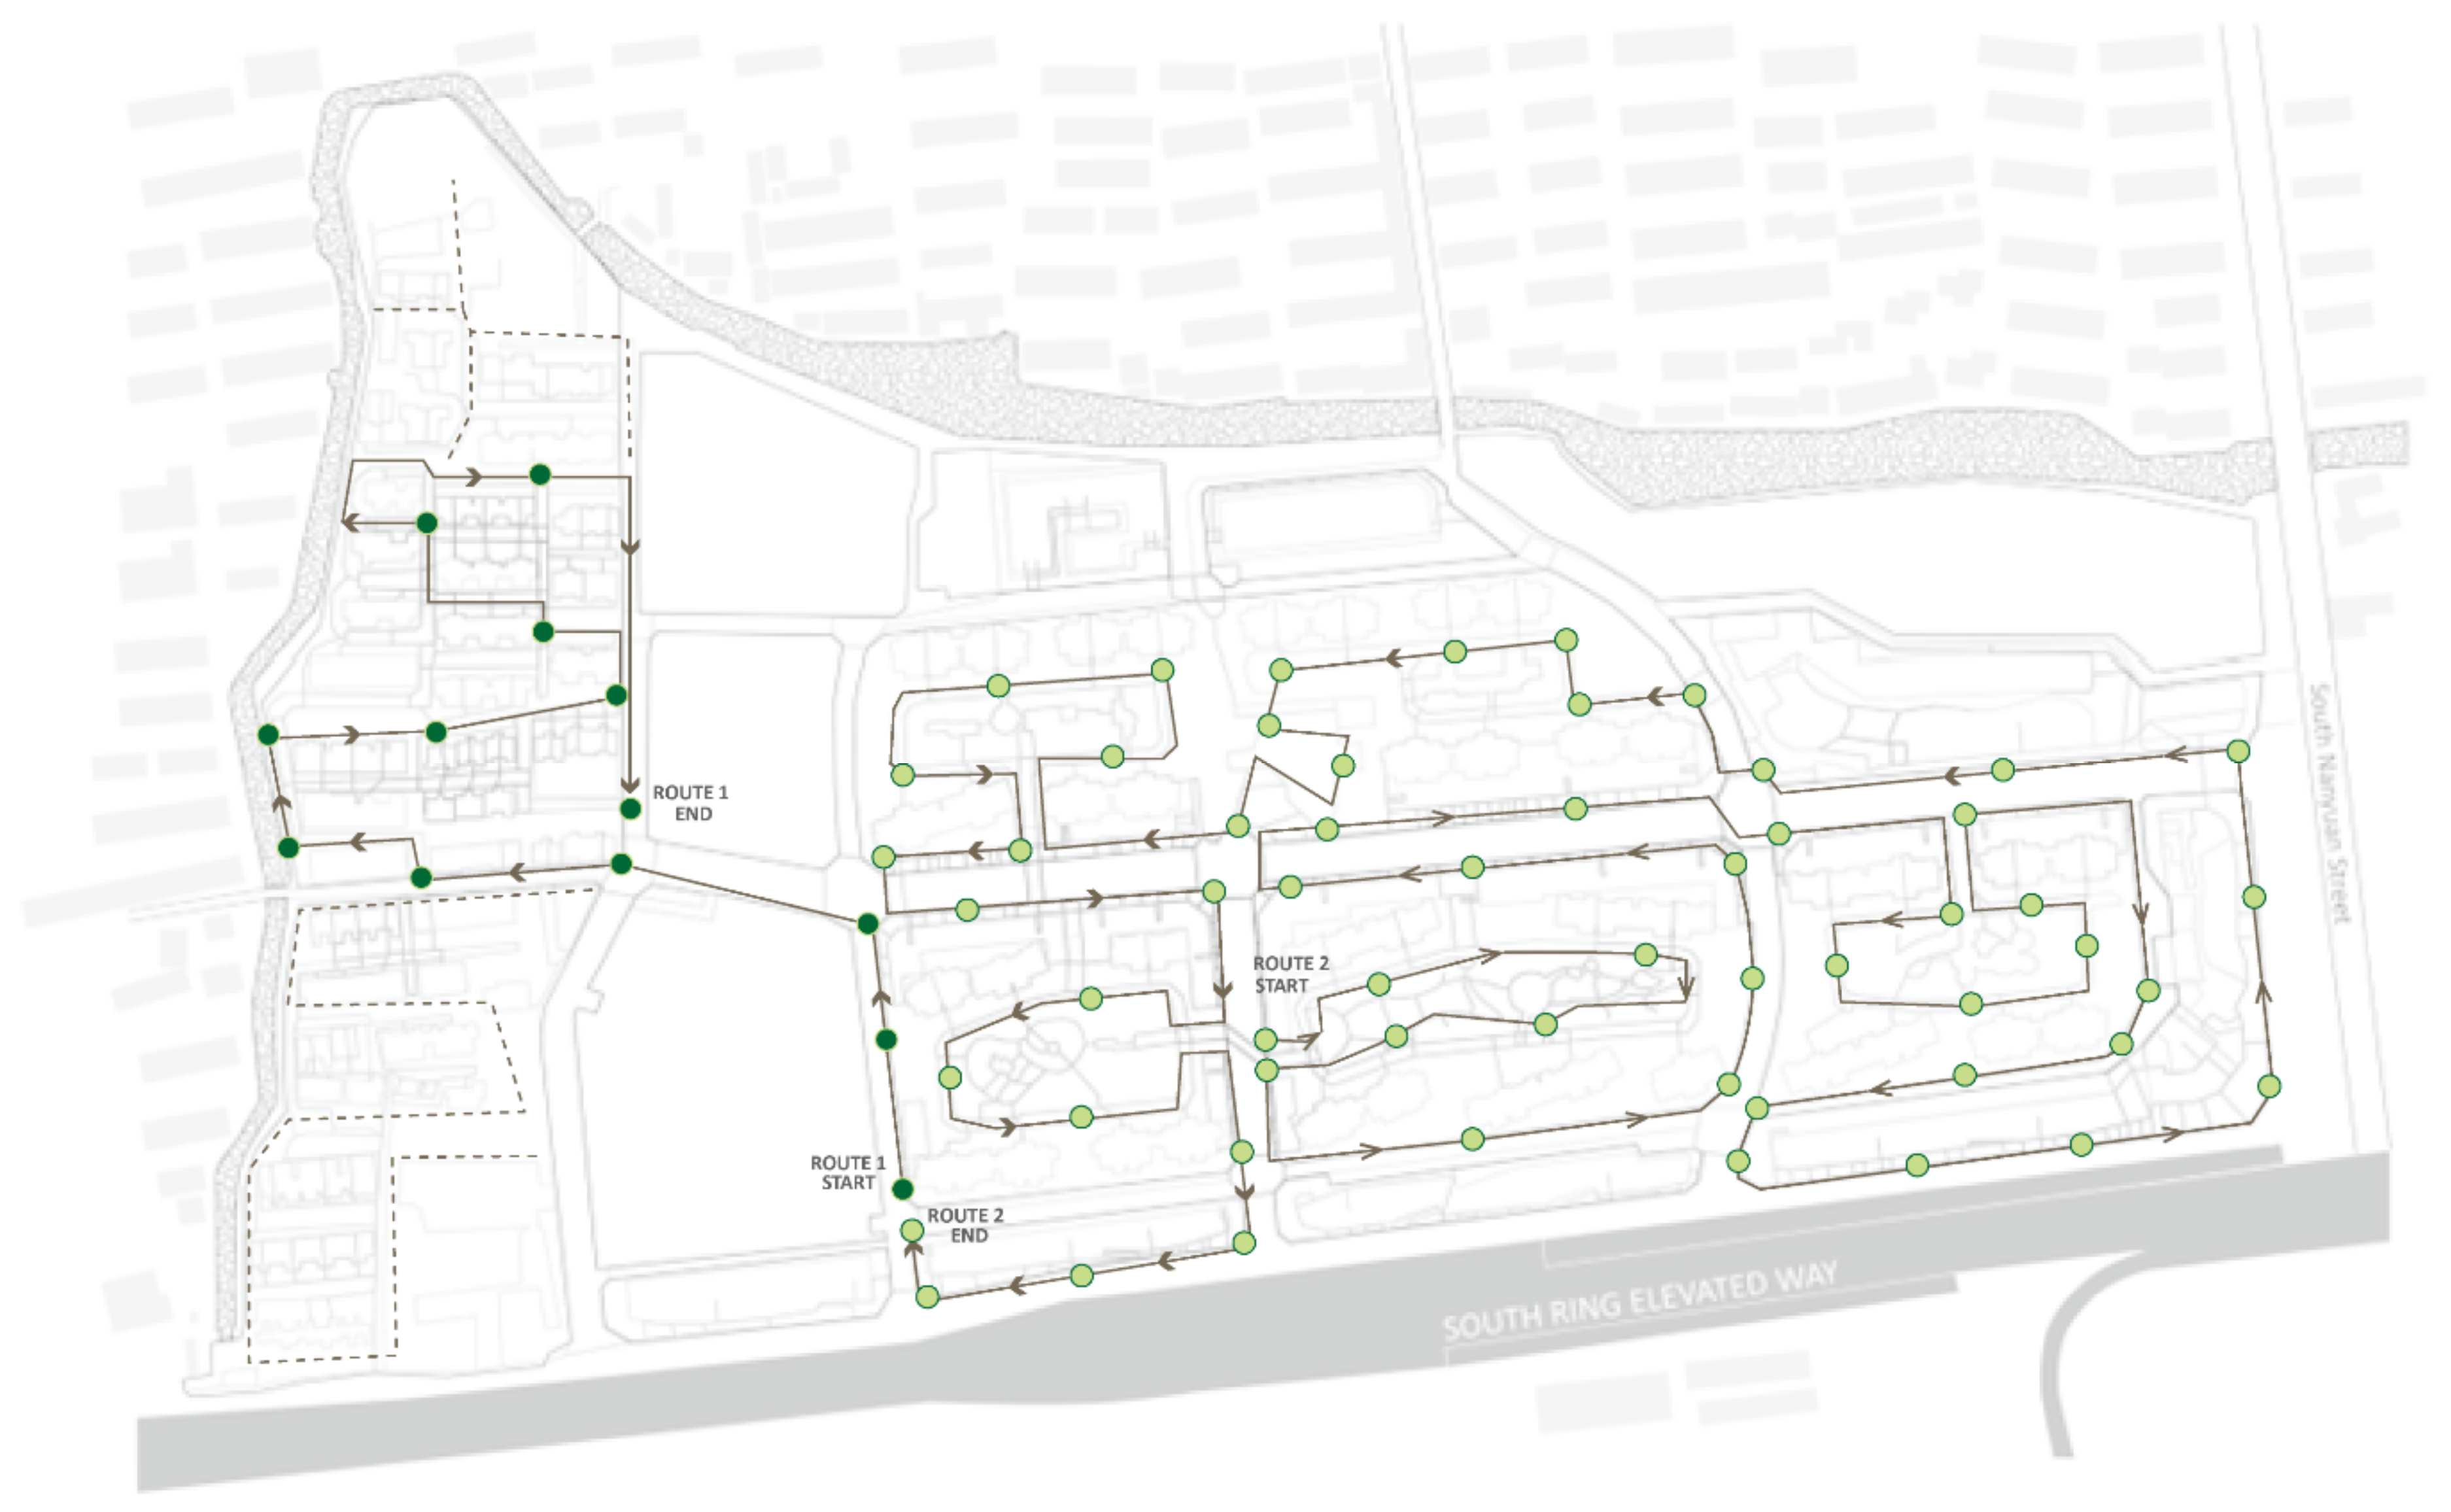
Two volunteers, equipped with wearable cameras, were invited to carry out 20-time experiments for two consecutive weeks (once during the daytime, once in the evening). The sampling database is built on street images taken regularly at 54 designated points within the site boundary.
(2)
The continuous timing photos are put into the PSPNet to calculate the ratio of vehicles and pedestrians in each image. The time-space differences of this ratio reflect the distribution of local spatial vitality.
(3)
These outcomes can be compared with the vitality distribution acquired from the ‘5d’ assessment framework to validate the effectiveness of our proposed methodology, especially a static approach using geospatial data and mobility-based methods employing street view photos.
In this study, the real-time distribution of local spatial vitality is reflected by the time-space differences of the streetscape features that the pedestrians can directly perceive, specifically by extracting the proportion of people and vehicles using PSPNet [50]. The pyramid pooling module and the pyramid scene parsing network are efficient machine-learning approaches for scene parsing and semantic segmentation. This method has obtained pixel-level prediction performance on several datasets, such as Cityscapes [50]. As shown in Figure 2, five types of ground items (built-up area, green space, road area, car and pedestrian) were extracted from each street view picture for each ground item using a pre-trained Cityscapes model. Then, we use the composite ratio of pixels of pedestrians and automobiles to the total number of pixels in the picture to represent the vitality of a community, since pedestrian and vehicular traffic tend to be associated with a geographical concentration of human activities. Lastly, we measure the average composite ratios of all sampling points in 20-time walking experiments to obtain the time-space distribution of community vitality in all possible environmental conditions.

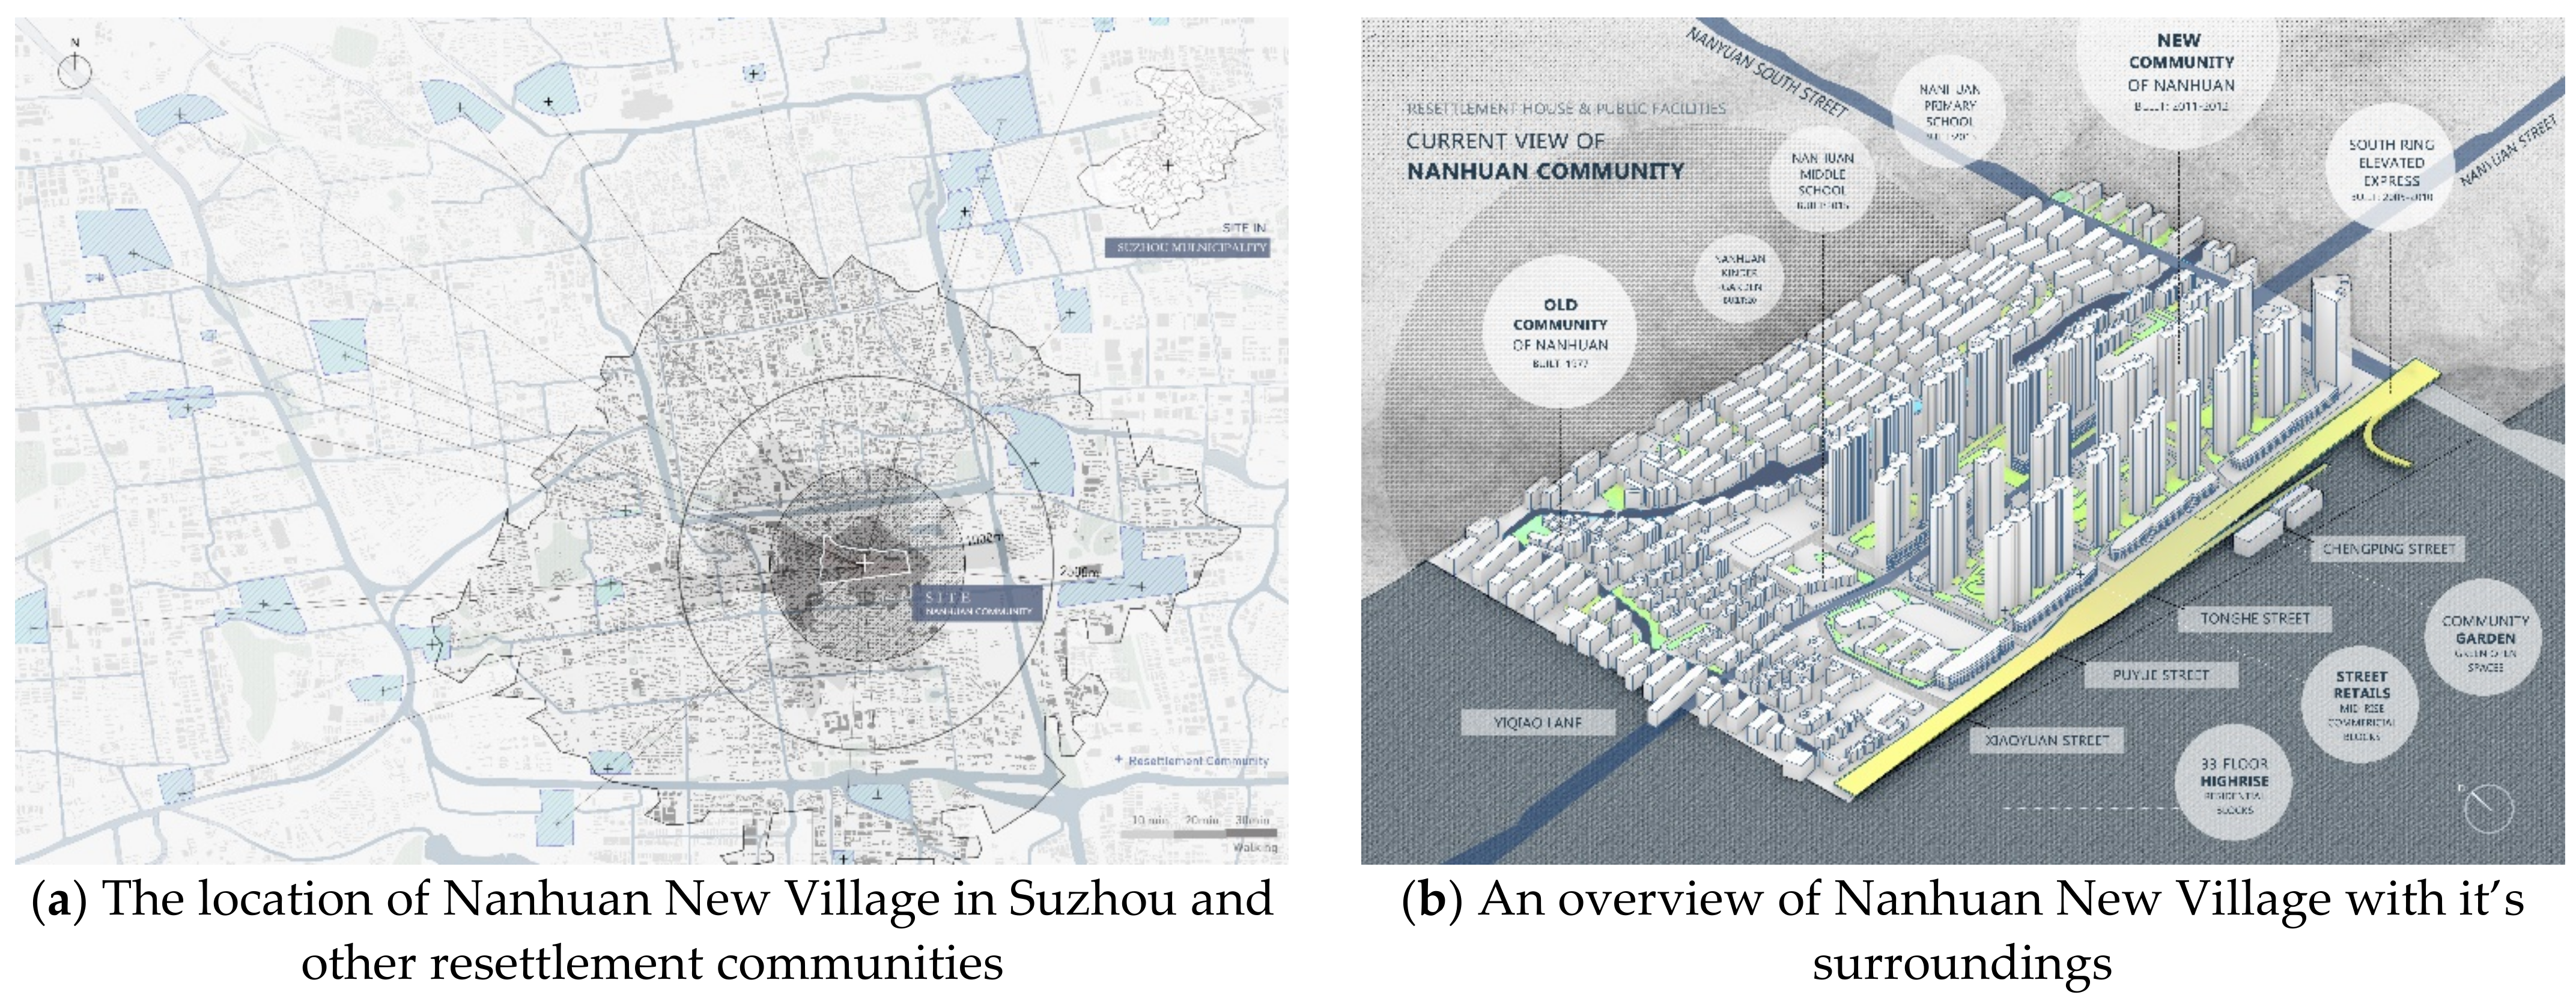
4. Case Study and Experimental Design

4.1. Case Study Area and Experimental Data

In response to the double pressure of land resource scarcity and economic development, Chinese urban regeneration has embraced the high-rise, high-density residential development pattern [51]. A ‘3H’ community refers to a densely populated community with a high Floor Area Ratio (FAR, indicating the intensity of plot use), high building height, and high occupancy rate. In current years, ‘3H’ development has led to excessive residential land use, which is a source of traffic congestion, environmental quality deterioration, a lack of green open space, and severe air pollution [52].
We selected Nanhuan New Village as our study area, which is a typical ‘3H’ community (Table 4). This area is located in the southern part of Gusu District, Suzhou City, Jiangsu Province, China. Suzhou functions as the hinterland of the Taihu Lake Economic Development Zone and has a strategic position in the Yangtze River Delta City Cluster. Moreover, Gusu District is a historic core and a highly urbanised area, where the embodiment of urban vitality and the formation mechanism of urban regeneration can be fully reflected.
The geographical location, natural and administrative boundaries, and the built-up elements of the study area are shown in Figure 3. The west and north of the community are surrounded by water. The eastern boundary is adjacent to Nanyuan South Road, and Nanhuan Highway demarcates the Southern boundary. The site is composed of the 1970s-built old neighbourhood in the west, a kindergarten, a primary school, a middle school in the middle, and newly built (post-2010) high-rise, high-density residential blocks that dominate the rest of the area. The southeastern outer ring of residential blocks is surrounded by retail streets and has a large shopping mall. According to the urban vitality evaluation framework demonstrated in Section 2, street image data and multi-source geospatial big data were obtained as research data. Their specific descriptions are detailed in Table 5.
The picture in Figure 3a shows the location of Suzhou city, and Figure 3b shows the distribution of resettlement communities in Suzhou city. The 3D model shows the building footprints, road networks, and neighbourhood blocks in our study area at a finer scale.

4.2. Experimental Settings

To facilitate the efficiency of visual data collection and programming process, and to verify the distribution of community vitality more effectively, we used street images collected from accessible areas as an alternative proxy of overall spatial vitality. We divided the study area into 17 urban blocks as basic spatial analysis units and design two routes along with 54 navigation points (Figure 4). The two routes encompass all the plots and paths accessible to pedestrians as a valid and comprehensive picture of space activities. The 54 points were set in a continuous sequence with explicit starting and ending positions to help us better match all the street images with their geographic coordinates. Dashed lines indicate the areas with comparable spatial vitality distribution to the designated route 1.
Then, we asked two volunteers to walk along the routes with a wearable camera to capture street images for 15 consecutive days. They were asked to maintain a pedestrian average walking speed (4–5 km/h) and the time threshold of a single stay ∆t = 2 h. Since the route spreads throughout Nanhuan New Village, the data collected during the stay can be used to explain the vitality distribution of the entire community. In this study, we chose the Xiaotu S2 Sports Camera for its outstanding portability and stability that fully fulfil our experiment’s required flexibility and preciseness. We set the scenario for the Xiaotu S2 Sports Camera to take a photo every 10 s, indicating that it has a relatively high temporal resolution and quick reflection for tracking the participants’ surrounding environmental features, such as green features, cars, and people. The records of their travels were divided into routes and points.
Our experiment was conducted from 1 August to 15 August 2021. Specifically, each participant was instructed to wear a camera to capture the front view during the daytime over two consecutive weeks, from 8:00–10:00 and 18:00–20:00. Before the walking session, the volunteers would ensure that the front lens was sturdy, facing forward, unobstructed, and fully charged. During the experiment, participants were responsible for ensuring that their wearable cameras were functioning properly unless they were engaged in an activity or event unsuitable for exposure. Meanwhile, the volunteers’ privacy concerns were taken into consideration. They were allowed to remove the camera at any moment for privacy concerns and could delete the images containing private information. After each day of walking observation, volunteers were asked to remove the wearable cameras and export the images to our mobile hard drives.

5. Results

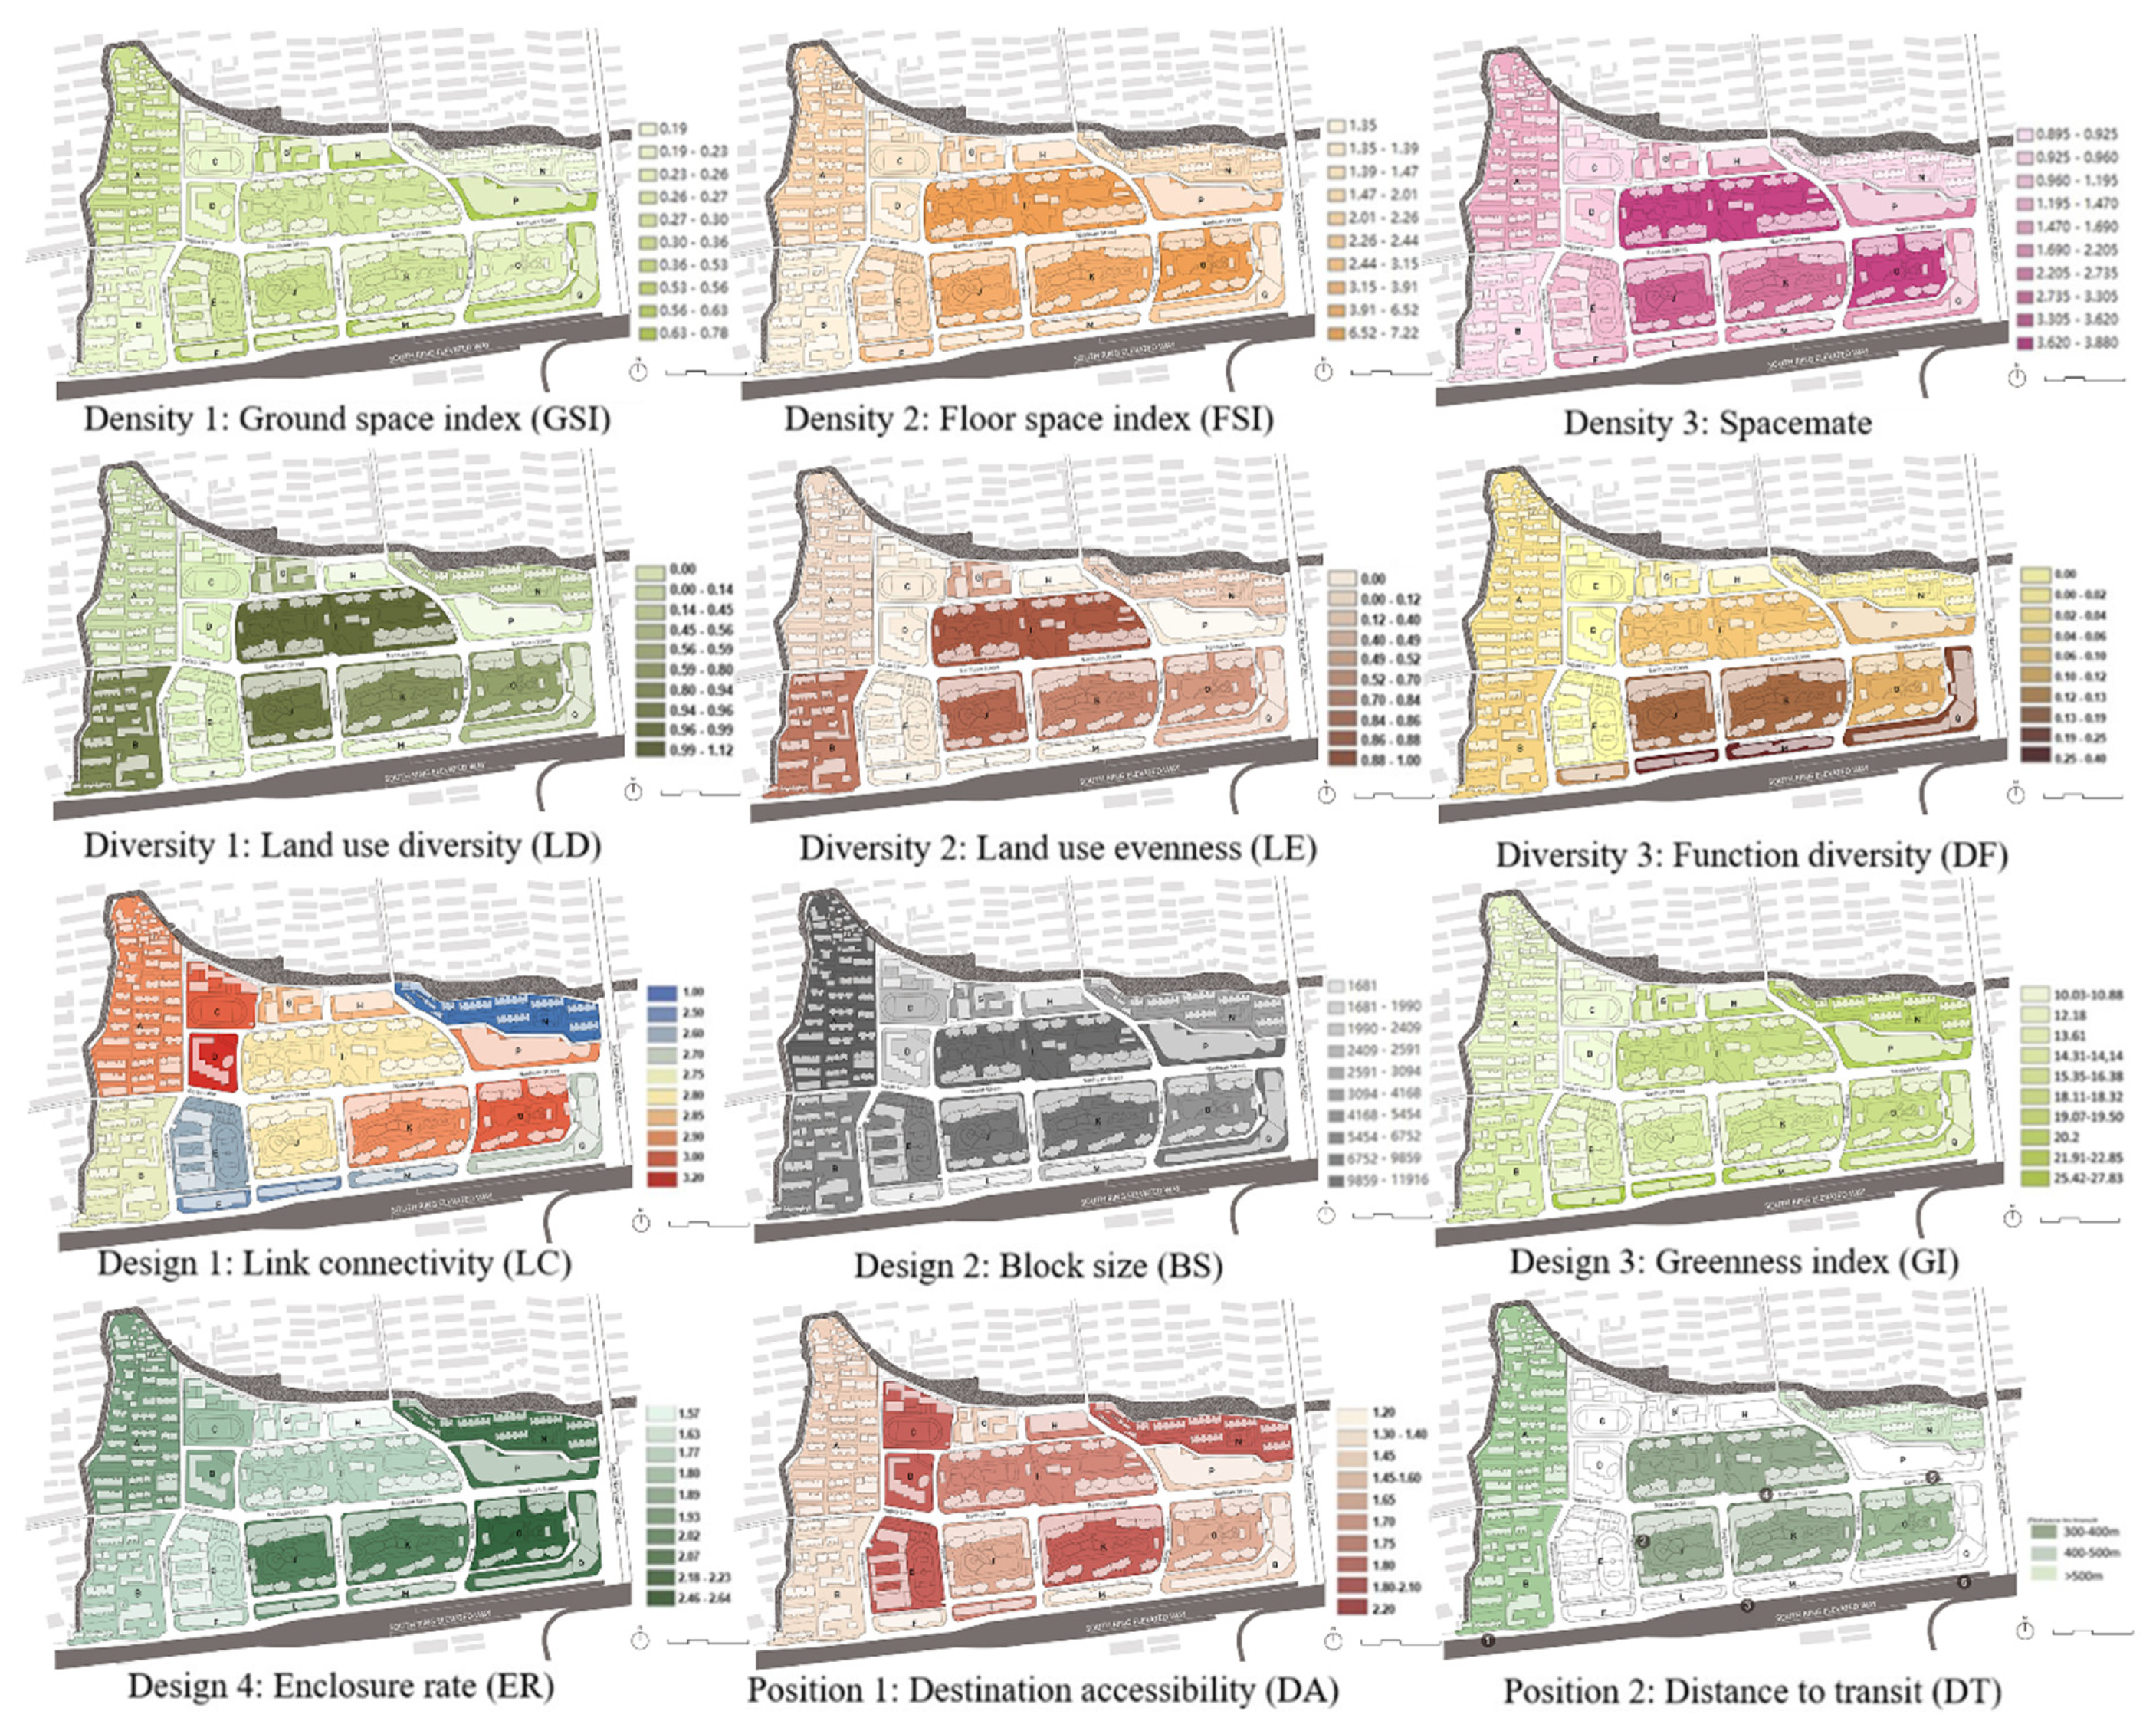
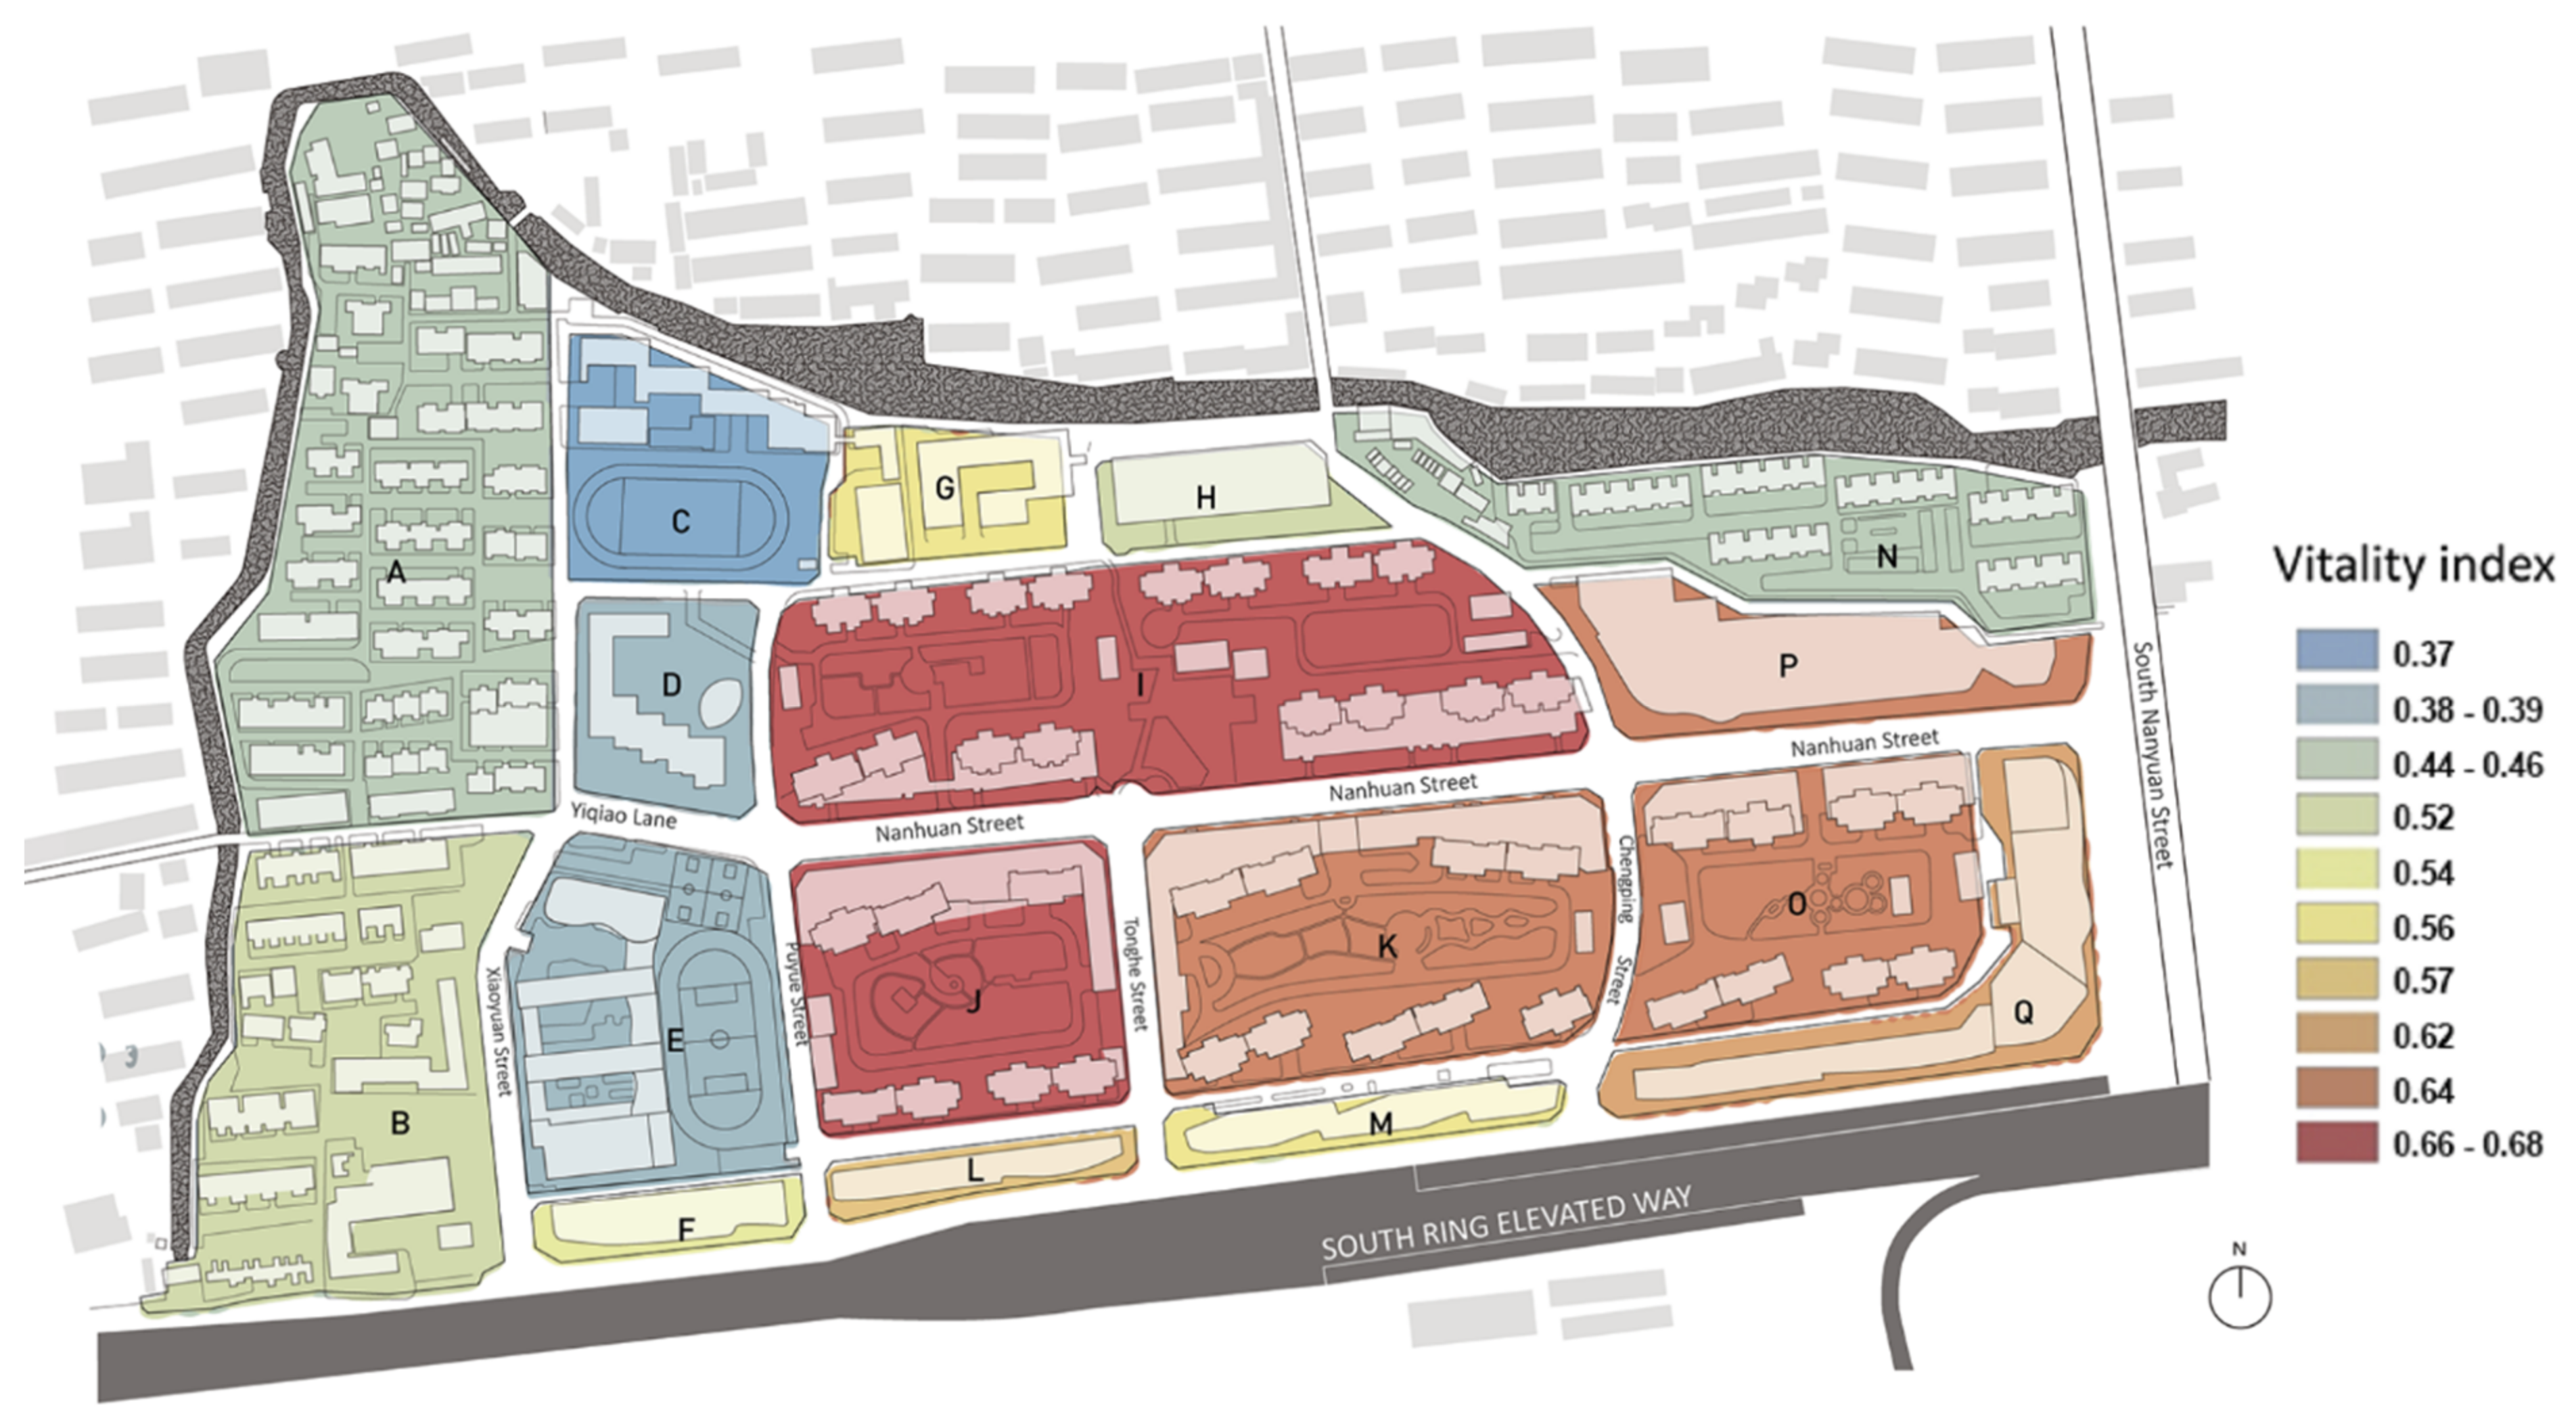
5.1. Quantitative Results of Vitality

The quantitative results of the 12 indicators affecting vitality in the 5D model are shown in Figure 5. For comparison purposes, the evaluation results were classified into ten levels using the natural breakpoint classification method.
  • The graphs (density1-density3) show that both GSI and FSI are generally more significant in the residential areas than in the public and commercial land areas, with the FSI and Spacemate values in the central high-rise significantly higher than in the older mid-rise residential areas.
  • In terms of diversity (diversity1-diversity3), the spatial distribution of LD and LE is similar, with high indicators for high-rise residential areas with commercial areas in the centre and low indicators for older mid-rise single residential areas. The southern neighbourhood near the South Circular Road has a higher DF value due to the variety and density of POI points. This reflects the complete diversity in the central and southern parts of the neighbourhood.
  • Regarding design (design1-design3), the LC has a more prominent spatial differentiation related to the entrances and exits of each plot. The residential areas to the northwest and the residential areas to the southeast are areas of high LC concentration, while the other regions are lower. The distribution of BS values is similar to that of density, again with the residential areas having greater values than the public and commercial land areas. The GI gradually increases from west to east, indicating that the high-rise residential and commercial areas to the east are better landscaped. The ER is highest in the east and smallest in the central neighbourhoods with squares. This reflects the lower degree of enclosure of the public areas.
  • Regarding position (position1 & 2), the school areas have the highest DA values, followed by the commercial areas, reflecting their higher accessibility. The distribution of DT shows that the residential areas are all at shorter distances from public transport stations, reflecting the accessibility of the neighbourhood.
Figure 5. Visual estimation results of the 12 indicators affecting vitality in the 5D model.
Ijgi 11 00626 g005
We employed the AHP to compare the ‘5d’ influencing factors in terms of their weight on community vitality and compute the composite impacts of ‘5d’ variables on the potential distribution of community vitality. The first column (A-Q) represents the 17 blocks in Nanhuan New Village based on the street cut-out. The second to 13th columns (GSI-DT) represents the quantified results of the 12 indicators in the 5D model for each block, calculated from Table 2. The last column (PVI) indicates the potential vitality of each block based on the 12 indicators quantified using the AHP method. As described in Table 3, the weights of density, diversity, design, and position are 0.4236, 0.2270, 0.2270, and 0.1223, respectively, so the final vitality was obtained by multiplying each quantitative indicator by its corresponding weight and adding them together (PVI = i = 1 9 D i × X i ). The data in Figure 5 are derived from Table 6 and visualised on the map using GIS.
According to the results of the PVI in Table 6, the distribution of the Vitality Index across the blocks in Nanhuan New Village is shown in Figure 6. The community vibrancy in Nanhuan New Village is highest in the central high-rise mixed commercial and residential area, decreasing in order of radioactivity towards the periphery. The high-rise strip blocks (I, J, K, O) with double-story street retail carry the highest community vitality values. These blocks are centrally located on Nanhuan Street, with highly connected streets and easy access to local amenities. Not only do the super-high residential buildings accommodate a large population, but the user-friendly retail also brings a diversity of site mix and functions. This is closely followed by the neighbourhood-type commercial use areas (P, Q) to the east, which has higher GSIs, denser POI densities, and smaller block sizes, despite their seemingly distant location from the residential areas to the west. However, not all neighbourhood-type commercial building plots have the same vitality level. F, L, and M along the South Ring Elevated Wa, on the other hand, have low densities, lack diversity, and low levels of vitality due to the massive closure of a large number of shops (Figure 7). The areas with lower vitality levels are concentrated in the westside school districts (C, D, E) and the old Nanhuan community (A, B, N). The former has less social or economic activity and a higher level of enclosure due to land use. For the latter, the old Nanhuan community occupies a larger land area and is designed as a single-function, medium to high-rise residential area. It is also somewhat removed from the main centres of economic and social activity in the centre and east and is, therefore, a low-vitality area.

5.2. Urban Vitality Based on Sensory and Visual Data Traced by Portable Camera

Armed with portable sensors and wearable cameras, the research team conducted 20 field conditions collection sessions in Nanhuan New Village in both the morning and the afternoon. One of the direct contributions to urban vitality was the observation of pedestrian range and flow. The research team aggregated the information collected and used GIS to map the distribution of pedestrian flows at different times of the day, as shown in Figure 8. The proximity principle was applied to compare the vitality values of the area covered by the route with those of the surrounding communities to determine and visualise overall distribution, including some inaccessible areas.
Figure 8 shows that the range and volume of pedestrian flows observed during the day are higher than in the afternoon, suggesting that crowd activity is more active in the morning than in the afternoon in Nanhuan New Village. Areas of significant difference are mainly located along the roads of the school and in the commercial areas along the streets in the high-rise residential areas to the southeast of the community. This relates to residents’ morning habits of picking up children and grocery shopping. Throughout the day, the junction with the square in the centre of the community and the shopping area to the east has the highest flow of people. This reflects the high level of vitality of the central high-rise residential area and the eastern commercial area as the most active areas of social and economic activity. Central Square is a local activity hub with a high crowding level. This functional open space allows people to organise activities such as shopping, dancing, fitness and chatting. In addition to the squares, pedestrians are also present in each neighbourhood’s green spaces and entrances. People prefer the former for recreational activities, such as resting, and have to enter and leave the community through the latter. In summary, the degree to which people congregate is significantly influenced by the type of activities the place can serve locally. More specifically, an area’s land use and diversity represent this capacity, and we argue that diversity contributes significantly to the measurement of urban vitality when using the 5D model.

6. Discussion

6.1. How Can the ‘5d’ Model Guide Small-And-Medium Scale Community Vitality Assessment?

Combing the vitality distribution results from the ‘5d’ model assessment (Figure) and previous literature in Section 1, we can summarise the following conclusions. By comparing all the driving factors, ‘Density’ has the most noticeable positive impact (especially the GSI and FSI indicators, which are 0.2286 and 0.1258, respectively). In contrast, block size has no significant driving impact on urban vitality in Nanhuan New Village (as shown in Table 7, BS has been given to only 0.0236 of weight and therefore shows a minimal impact). The most vibrant blocks are those of larger block sizes, and the smallest-sized school districts obtain a relatively low PVI. Some blocks (A & I; Q & E) have similar size but have disparate vitality values. Additionally, although the weight given to ‘Diversity’ and ‘Design’ is similar, the former demonstrates a greater association with urban vitality than the latter. These results, in general, coincided with the ‘3d’ assessment model, as higher levels of population density and built potentials, functional diversity and mix-use, and high-quality urban design are prerequisites for stimulating superior vitality performance [22,44,53,54].
The difference between this article and that of Li et al. (2022) is that their research did not consider the weight for each ‘5d’ indicator, and they listed both position factors (‘Destination accessibility’ and ‘Distance to transit’) as the two most important factors driving urban vitality [8]. However, at the community level, the original ‘3d’ dimensions (‘Density’, ‘Diversity’, ‘Design’) remain key elements for forming vibrant spatial quality and functionality, while the position factors have relatively lower effects. This indicates that despite the great importance of mobility factors in transport planning (e.g., TOD), community regeneration should focus more on improving the internal environment and the morphological features of living space. This echoes the research conclusions on urban design factors of spatial vitality [22]. The most significant difference between this article and previous research outcomes is the enclosure rate. According to Oliveira and Medeiros (2016), a low enclosure rate can bring about a better walking experience, whilst in the study area, mixed-use and high-density urban areas are located next to the streets enclosed by high-rise blocks, which might have offset the negative impact of enclosure rate on community vitality [42].
Previously, the ‘5D’ model has only been used to measure vitality performance across large-scale urban areas. At the same time, this paper fills the gap between community regeneration practices and urban vitality assessment by proposing a refined ‘5d’ model. Based on a deep reflection of previous studies, the measurement criteria, analysis, and weighting process are selected and moderated to conduct systematic and reactive local vitality evaluation at the neighbourhood level.

6.2. How Can Real-Time Street Image Support Accurate and Efficient Data Collection?

Supported by new technologies and data, this study is a valuable attempt to combine human-scale elements with urban-scale analysis and effectively extend the analysis techniques for community vitality. Compared to traditional vitality assessments that rely on GIS overlay analysis, this study provides a more comprehensive and systematic approach based on a human perspective. Due to a lack of appropriate tools and data, previous vibrancy studies and practices have often been conducted from a top-down perspective with a flat analysis, making it challenging to incorporate relevant elements of the human scale. Nanhuan New Village, as a case study in this research, has the characteristics of a small-scale and complex habitat. This study is based on the human and environment-oriented perspective to address this characteristic. The wearable camera was used to measure the real-time spatial quality of the street, pedestrian, and vehicular information, compensating for the shortcomings of traditional quantitative analysis in terms of small scale and accuracy. Content capture of street photos taken by wearable cameras enabled greenery visibility and pedestrian numbers to be obtained more accurately. Meanwhile, the combination of street-based data analysis and spatial design network analysis (sDNA) software allowed for accurately measuring street network accessibility.
In summary, wearable devices can be used in conjunction with the collection and use of urban streetscapes to address the shortcomings of quantitative urban research that ignores the personality and characteristics of the city itself. This multi-source analysis of urban data can be used to study issues at the city scale and community level with a focus on the human dimension. This is particularly suitable for research applications at the micro and medium scales. With the use of photographic location information as the starting point, and software visualisation technology as the support, the research process is spatially recorded. The image elements are managed orderly, offering the possibility of in-depth and accurate analysis using the 5D concept to measure the quality of the built environment.
Using wearable cameras to collect street images helps tackle issues such as homogeneous BE patterns within a single phase of property development, the lack of high-resolution satellite images, higher impurities, and poorer positioning accuracy in the construction of local human activities. Therefore, our research proposes an effective way to overcome significant research constraints in urban data analysis, which is more accurate and efficient than traditional data collection and processing methods.

6.3. How Can We Verify the Assessment Results from Both Morphological and People-Oriented and Environment-Oriented Perspectives?

The ‘5d’ assessment results and the actual distribution of urban vitality have apparent spatial heterogeneity. By comparing Figure 6 and Figure 8, we can obtain two explicit conclusions. First, the diversity level calculated from both methods is highly overlapped in the retail streets (Tonghe Street, central Nanhuan Street) and the eastern periphery of the Huilin Centre shopping mall. Central Health Square and Tonghe Street intersection shows the most significant crowd gathering and the highest PVI. The street shops provide diverse places for lingering, consumption, and community gathering, and the large shopping mall also stimulates high urban vitality.
Unlike Tonghe Street, the intersection of two neighbourhood streets (Yiqiao Lane and Xiaoyuan Street) shows disparate vitality levels in the two methods. The reason could be that the place is located at the only entrance of Nanhuan New Village. Another difference is the informal entrance of the community, located between blocks F and L (Figure 6), on the western segment of the South Ring Express Way of the study area. These entrances directly bring about large flows of pedestrians and cars. Their volume concerns employment and industrial links between the community and the city. Thus, such inconsistency is not caused by evaluation units or problematic processing data approaches and does not impair the reliability of the proposed assessment model.
Overall, the modelling and assessment process results precisely reflect real-life community vitality. Therefore, this comparative study combines the shaping effect of morphological features and people and environment-oriented perspectives to offer a new methodology for community-level vitality assessment. It successfully proves the validity of the ‘5d’ model and multi-source big data’s validity in effectively examining urban vitality and its driving indicators.

7. Conclusions

The development of information collection technologies has changed the way scholars’ study urban science. Wearable devices, such as cameras and sensors, for example, provide practical tools for the human-centred perspective of urban identity mapping and new exploration in the context of digital urban renewal. Meanwhile, spatial network analysis tools such as GIS and sDNA are gradually developing and maturing, and scholars in urban research are gradually applying multi-source urban data.
As envisaged by Ewing and Cervero (2001), the quantification of urban vitality can be reflected in terms of density, diversity, design, destination accessibility, and transportation distance [26]. This study effectively integrates classical 5D theory with urban data and weighting algorithms in depth to propose a spatial vitality measure for high-density resettlement communities with a general practical application. Through data from field works and calculations, this study shows how the level of vitality changes in the small scale high-density residential community selected as a case study. In detail Tonghe Street, central Nanhuan Street, and the eastern periphery of Huilin Centre have very high levels of vitality, which is also verified by the crowd gathering and activities measured in Nanhuan New Village. This higher vitality is due to the morphological features of living space.
Based on these findings, our study proposes some suggestions for measures to improve the vitality of such small-scale, high-density communities. The methodology and findings can be extended to other regions or cities with similar characteristics and can be used to develop urban vitality shaping strategies.

8. Limitations and Future Research

Our study has some limitations that will be addressed in future research. First, for the experimental design, it is still debatable how to replace the camera and walking observation with new techniques able to mitigate the influences caused by path route, angle of the lens, timing, and other factors to increase feasibility and validity.
Second, even if the real-time investigation was intensive and multiplied over 15 days and the number of images were enough for the kind of analysis processed, the timeframe of two weeks may be extended in future projects to collect more image data. It has to be added that when measuring the data related to the Nanhuan New Village, the data did not fully cover the whole study area due to traffic control, land use regulations or other area-based constraints.
Third, streetscape photographs cannot obtain spatial information within the private spaces of the community. In addition, the AHP weights used in the current study were based on the experience of a team of experts. The analysis of the sampling indicators was based on the objective environment and lack the subjective perceptions of the residents. Therefore, there may be discrepancies between the relevant results and the public experience.
Future research can further integrate various data and algorithms to carry out more accurate measurements for spatial vitality to improve accuracy and applicability. This could include”
(1)
Considering the influence of social and economic factors such as building age, history and culture, and housing price on spatial vitality, and exploring the heterogeneity and locality of different spaces to bring non-built environment influence spatial vitality.
(2)
Conducting a more in-depth study of the categories of people and activities to which the space is applicable. People of different places and ages often have different levels of preference for gathering and dispersal. At the same time, the behavior of residents’ special activities to modify the site’s original function, such as temporary plazas and informal entrances and exits, can also have a notable impact on community vitality.
(3)
Incorporating consideration of public feedback. Future relevant quantitative analysis should try to collect residents’ perceptions and evaluations of these indicators and adjust the weighting of each element for correction.

Author Contributions

Conceptualisation: Jinliu Chen, Wenkang Tian, Kexin Xu, Paola Pellegrini; Methodology, Wenkang Tian, Jinliu Chen; Validation, Jinliu Chen. Formal analysis: Wenkang Tian; Investiga-tion, Wenkang Tian and Kexin Xu. Resources: Jinliu Chen, Wenkang Tian, and Kexin Xu. Data Curation: Jinliu Chen and Wenkang Tian. Writing-original draft preparation: Jinliu Chen, Wenkang Tian and Kexin Xu. Writing-review and editing: Jinliu Chen, Wenkang Tian and Kexin Xu; Visualization, Wenkang Tian, Kexin Xu, Jinliu Chen. Supervision: Paola Pellegrini. Project Administration: Jinliu Chen. Funding acquisition: Paola Pellegrini. All authors have read and agreed to the published version of the manuscript.

Funding

This research was funded by XJTLU Research Development Fund. Grant number is RDF-17-02-25. XJTLU Surf 2021010.

Data Availability Statement

Not applicable.

Acknowledgments

Thanks to Qingwei Zeng, Haoqi Wang, Xiaoxiao Feng, Yihan Shi, and Chujun Ma for help with field research and information gathering.

Conflicts of Interest

The authors declare no conflict of interest.

Appendix A. AHP Analysis Experts Results and Weight Attribution Process

Table A1, Table A2, Table A3, Table A4 and Table A5 present the results of the AHP scores of the five experts we asked in the relevant fields, including the “middle level elements. The experts were asked to make a pairwise comparison of the elements, based on their own judgement on a scale of 17 from absolute importance (registered as 9) to absolute disadvantage (1/9). The results were recorded in numerical form in the Yaahp software, and when all the results were entered into the software, the software calculated the results based on the scoring. Table A8, Table A9, Table A10 and Table A11 show the consistency test produced during the AHP analysis.
Table A1. Expert 1.
Table A1. Expert 1.
DensityDiversityDesignPosition
Density 332
Diversity 21
Design 2
Position
DensityFSIGSISpacemate DiversityLand Use DiversityLand Use EvennessFunction Density
FSI 1/32 Land Use Diversity 1/21
GSI 3 Land Use Evenness 2
Spacemate Function Density
DesignLink connectivity indexAverage Block SizeGreen IndexEnclosure Rate PositionDestination accessibility Distance to Transit
Link Connectivity Index 333 Destination Accessibility 2
Average Block Size 1/31/3 Distance to Transit
Green Index 1/2
Enclosure Rate
Table A2. Expert 2.
Table A2. Expert 2.
DensityDiversityDesignPosition
Density 223
Diversity 12
Design 2
Position
DensityFSIGSISpacemate DiversityLand Use DiversityLand Use EvennessFunction Density
FSI 1/22 Land Use Diversity 1/32
GSI 3 Land Use Evenness 3
Spacemate Function Density
DesignLink connectivity indexAverage Block SizeGreen IndexEnclosure Rate PositionDestination accessibility Distance to Transit
Link Connectivity Index 323 Destination Accessibility 3
Average Block Size 1/21/3 Distance to Transit
Green Index 2
Enclosure Rate
Table A3. Expert 3.
Table A3. Expert 3.
DensityDiversityDesignPosition
Density 443
Diversity 23
Design 2
Position
DensityFSIGSISpacemate DiversityLand Use DiversityLand Use EvennessFunction Density
FSI 1/23 Land Use Diversity 1/22
GSI 3 Land Use Evenness 2
Spacemate Function Density
DesignLink connectivity indexAverage Block SizeGreen IndexEnclosure Rate PositionDestination accessibility Distance to Transit
Link Connectivity Index 423 Destination Accessibility 2
Average Block Size 1/21/3 Distance to Transit
Green Index 3
Enclosure Rate
Table A4. Expert 4.
Table A4. Expert 4.
DensityDiversityDesignPosition
Density 232
Diversity 24
Design 2
Position
DensityFSIGSISpacemate DiversityLand Use DiversityLand Use EvennessFunction Density
FSI 1/33 Land Use Diversity 1/23
GSI 4 Land Use Evenness 3
Spacemate Function Density
DesignLink connectivity indexAverage Block SizeGreen IndexEnclosu-re Rate PositionDestination accessibility Distance to Transit
Link Connectivity Index 222 Destination Accessibility 3
Average Block Size 1/21/3 Distance to Transit
Green Index 2
Enclosure Rate
Table A5. Expert 5.
Table A5. Expert 5.
DensityDiversityDesignPosition
Density 322
Diversity 12
Design 2
Position
DensityFSIGSISpacemate DiversityLand Use DiversityLand Use EvennessFunction Density
FSI 1/23 Land Use Diversity 1/32
GSI 4 Land Use Evenness 3
Spacemate Function Density
DesignLink connectivity indexAverage Block SizeGreen IndexEnclosure Rate PositionDestination accessibility Distance to Transit
Link Connectivity Index 322 Destination Accessibility 2
Average Block Size 1/31/2 Distance to Transit
Green Index 3
Enclosure Rate
Table A6. Ranking weight of elements to decision objectives in scheme level.
AlternativeWeight
GSI0.2286
Land Use Evenness0.1348
FSI0.1258
Link Connectivity Index0.1010
Destination Accessibility0.0917
Space Mate0.0692
Green Index0.0586
Land Use Diversity0.0566
Enclosure Rate0.0430
Function Density0.0357
Distance to Transit0.0306
Average Block Size0.0244
Table A7. Ranking weight of elements in the first intermediate layer for decision objectives.
ElementsWeight Attributes
Density0.4236
Design0.2270
Diversity0.2270
Position0.1223
Table A8. 5D consistency ratio: 0.0039; Weight of “5D”: 1.0000; λ max: 4.0104.
5dDensityDiversityDesignPositionWi
Density1.00002.00002.00003.00000.4236
Diversity0.50001.00001.00002.00000.2270
Design0.50001.00001.00002.00000.2270
Position0.33330.50000.50001.00000.1223
Table A9. Density Consistency ratio: 0.0088; Weight of “5D”: 0.4236; λ max: 3.0092.
DensityFSIGSISpace MateWi
FSI1.00000.50002.00000.2970
GSI2.00001.00003.00000.5396
Space mate0.50000.33331.00000.1634
Table A10. Diversity Consistency ratio: 0.0516; Weight of “5D”: 0.2270; λ max: 3.0536.
DiversityLand Use
Diversity
Land Use EvennessFunction DensityWi
Land Use Diversity1.00000.33332.00000.2493
Land Use Evenness3.00001.00003.00000.5936
Function Density0.50000.33331.00000.1571
Table A11. Design Consistency ratio: 0.0618; Weight of “5D”: 0.2270; λ max: 4.1649.
DesignLink Connectivity IndexAverage Block SizeGreen IndexEnclosure RateWi
Link Connectivity Index1.00003.00002.00003.00000.4448
Average Block Size0.33331.00000.50000.33330.1076
Green Index0.50002.00001.00002.00000.2581
Enclosure Rate0.33333.00000.50001.00000.1896
Table A12. Position Consistency ratio: 0.0000; Weight of “5D”: 0.1223; λ max: 2.0000.
PositionDestination AccessibilityDistance to TransitWi
Destination Accessibility1.00003.00000.7500
Distance to Transit0.33331.00000.2500

References

  1. Fang, C.L. Basic Rules and Key Paths for High-Quality Development of the New Urbanization in China. Geogr. Res. 2019, 38, 13–22. [Google Scholar]
  2. Porter, L.; Shaw, K. Whose Urban Renaissance? Routledge: London, UK, 2013; ISBN 9787521806885. [Google Scholar]
  3. Ruming, K. Urban Regeneration in Australia; Routledge: London, UK, 2018. [Google Scholar]
  4. Chen, J.; Pellegrini, P.; Wang, H. Comparative Residents’ Satisfaction Evaluation for Socially Sustainable Regeneration—The Case of Two High-Density Communities in Suzhou. Land 2022, 11, 1483. [Google Scholar] [CrossRef]
  5. Den Hartog, H. Searching for a New Identity in a Rapidly Transforming Urban Landscape the Cause of Generic Urban Development and the Loss of Identity. Built Herit. 2017, 1, 41–50. [Google Scholar] [CrossRef]
  6. Chen, J.; Pellegrini, P.; Xu, Y.; Ma, G.; Wang, H.; An, Y.; Shi, Y.; Feng, X. Evaluating Residents’ Satisfaction before and after Regeneration. The Case of a High-Density Resettlement Neighbourhood in Suzhou, China. Cogent Soc. Sci. 2022, 8. [Google Scholar] [CrossRef]
  7. Lu, S.; Huang, Y.; Shi, C.; Yang, X. Exploring the Associations between Urban Form and Neighborhood Vibrancy: A Case Study of Chengdu, China. ISPRS Int. J. Geo-Inf. 2019, 8, 165. [Google Scholar] [CrossRef] [Green Version]
  8. Li, Q.; Cui, C.; Liu, F.; Wu, Q.; Run, Y.; Han, Z. Multidimensional Urban Vitality on Streets: Spatial Patterns and Influence Factor Identification Using Multisource Urban Data. ISPRS Int. J. Geo-Inf. 2022, 11, 2. [Google Scholar] [CrossRef]
  9. Wang, T.; Li, Y.; Li, H.; Chen, S.; Li, H.; Zhang, Y. Research on the Vitality Evaluation of Parks and Squares in Medium-Sized Chinese Cities from the Perspective of Urban Functional Areas. Int. J. Environ. Res. Public Health 2022, 19, 15238. [Google Scholar] [CrossRef]
  10. Kang, C.; Fan, D.; Jiao, H. Validating Activity, Time, and Space Diversity as Essential Components of Urban Vitality. Environ. Plan. B Urban Anal. City Sci. 2021, 48, 1180–1197. [Google Scholar] [CrossRef]
  11. Fan, Z.; Duan, J.; Luo, M.; Zhan, H.; Liu, M.; Peng, W. How Did Built Environment Affect Urban Vitality in Urban Waterfronts? A Case Study in Nanjing Reach of Yangtze River. ISPRS Int. J. Geo-Inf. 2021, 10, 611. [Google Scholar] [CrossRef]
  12. Guo, X.; Chen, H.; Yang, X. An Evaluation of Street Dynamic Vitality and Its Influential Factors Based on Multi-Source Big Data. ISPRS Int. J. Geo-Inf. 2021, 10, 143. [Google Scholar] [CrossRef]
  13. Jiang, Y. A Study on Urban Vitality Measurement and Its Spatial Characteristics—A Case Study of the Main Urban Area of Wuhan. Urban Manag. Sci. Technol. 2021, 22, 4. [Google Scholar]
  14. Hui, E.C.-M.; Chen, T.; Lang, W.; Ou, Y. Urban Community Regeneration and Community Vitality Revitalization through Participatory Planning in China. Cities 2021, 110, 103072. [Google Scholar] [CrossRef]
  15. Li, X.; Wen, X. Analysis on Urban Vitality Based on Spatial Syntax. Urban Rural Plan. 2021, 18, 12–17. [Google Scholar] [CrossRef]
  16. Den Hartog, H. Shanghai New Towns: Searching for Community and Identity in a Sprawling Metropolis; 010 Publishers: Rotterdam, The Netherlands, 2010; ISBN 906450735X. [Google Scholar]
  17. Jin, X.; Long, Y.; Sun, W.; Lu, Y.; Yang, X.; Tang, J. Evaluating Cities’ Vitality and Identifying Ghost Cities in China with Emerging Geographical Data. Cities 2017, 63, 98–109. [Google Scholar] [CrossRef]
  18. Zeng, C.; Song, Y.; He, Q.; Shen, F. Spatially Explicit Assessment on Urban Vitality: Case Studies in Chicago and Wuhan. Sustain. Cities Soc. 2018, 40, 296–306. [Google Scholar] [CrossRef]
  19. Liu, S.; Zhang, L.; Long, Y.; Long, Y.; Xu, M. A New Urban Vitality Analysis and Evaluation Framework Based on Human Activity Modeling Using Multi-Source Big Data. ISPRS Int. J. Geo-Inf. 2020, 9, 617. [Google Scholar] [CrossRef]
  20. Pugalis, L. The Culture and Economics of Urban Public Space Design: Public and Professional Perceptions. Urban Des. Int. 2009, 14, 215–230. [Google Scholar] [CrossRef]
  21. Kunze, C.; Hecht, R. Semantic Enrichment of Building Data with Volunteered Geographic Information to Improve Mappings of Dwelling Units and Population. Comput. Environ. Urban Syst. 2015, 53, 4–18. [Google Scholar] [CrossRef]
  22. Ye, Y.; Huang, R.; Zhang, L. Human-Oriented Urban Design with Support of Multi-Source Data and Deep Learning: A Case Study on Urban Greenway Planning of Suzhou Creek, Shanghai. Landsc. Archit. 2021, 28, 39–45. [Google Scholar] [CrossRef]
  23. Yue, W.; Chen, Y.; Zhang, Q.; Liu, Y. Spatial Explicit Assessment of Urban Vitality Using Multi-Source Data: A Case of Shanghai, China. Sustainability 2019, 11, 638. [Google Scholar] [CrossRef] [Green Version]
  24. Cervero, R.; Kockelman, K. Travel Demand and the 3Ds: Density, Diversity, and Design. Transp. Res. Part D Transp. Environ. 1997, 2, 199–219. [Google Scholar] [CrossRef]
  25. Ye, Y.; Zhuang, Y. A Hypothesis of Urban Morphogenesis and Urban Vitality in Newly Built-up Areas: Analyses Basedon Street Accessibility, Building Density and Functional Mixture. Urban Plan. Int. 2017, 32, 43–49. [Google Scholar] [CrossRef]
  26. Ewing, R.; Cervero, R. Travel and the Built Environment: A Synthesis. Transp. Res. Rec. 2001, 1780, 87–114. [Google Scholar] [CrossRef] [Green Version]
  27. Ewing, R.; Cervero, R. Travel and the Built Environment: A Meta-Analysis. J. Am. Plan. Assoc. 2010, 76, 265–294. [Google Scholar] [CrossRef]
  28. Lu, Y.; Xiao, Y.; Ye, Y. Urban Density, Diversity and Design: Is More Always Better for Walking? A Study from Hong Kong. Prev. Med. 2017, 103, S99–S103. [Google Scholar] [CrossRef]
  29. Walburn, D. Is There a Fresh Chance for Local Authorities to Take the Lead in Local Economic Development? Local Econ. 2011, 26, 75–81. [Google Scholar] [CrossRef]
  30. Vale, D.S.; Pereira, M. Influence on Pedestrian Commuting Behavior of the Built Environment Surrounding Destinations: A Structural Equations Modeling Approach. Int. J. Sustain. Transp. 2016, 10, 730–741. [Google Scholar] [CrossRef]
  31. Ogra, A.; Ndebele, R. The Role of 6Ds: Density, Diversity, Design, Destination, Distance, and Demand Management in Transit Oriented Development (TOD). In Proceedings of the Neo-International Conference on Habitable Environments, San Diego, CA, USA, 31 October–2 November 2014; pp. 539–546. [Google Scholar]
  32. Goos, G.; Hartmanis, J.; Van, J.; Board, L.E.; Hutchison, D.; Kanade, T.; Kittler, J.; Kleinberg, J.M.; Kobsa, A.; Mattern, F.; et al. Human Behavior Understanding. In Proceedings of the First International Workshop, Istanbul, Turkey, 22 August 2010. [Google Scholar]
  33. Chen, L.; Lu, Y.; Ye, Y.; Xiao, Y.; Yang, L. Examining the Association between the Built Environment and Pedestrian Volume Using Street View Images. Cities 2022, 127, 103734. [Google Scholar] [CrossRef]
  34. Berawi, M.A.; Ibrahim, B.E.; Gunawan; Miraj, P. Developing a Conceptual Design of Transit-Oriented Development to Improve Urban Land Use Planning. J. Des. Built Environ. 2019, 19, 40–48. [Google Scholar] [CrossRef]
  35. Berghauser Pont, M.; Haupt, P. The Spacemate: Density and the Typomorphology of the Urban Fabric. In Urbanism Laboratory for Cities and Regions: Progress of Research Issues in Urbanism; IOS Press: Amsterdam, The Netherlands, 2005. [Google Scholar]
  36. Forsyth, A.; Oakes, J.M.; Schmitz, K.H.; Hearst, M. Does Residential Density Increase Walking and Other Physical Activity? Urban Stud. 2007, 44, 679–697. [Google Scholar] [CrossRef]
  37. Jacobs, J. The Death and Life of Great American Cities; Vintage: New York, NY, USA, 1961; ISBN 052543285X. [Google Scholar]
  38. Huang, J.; Obracht-Prondzynska, H.; Kamrowska-Zaluska, D.; Sun, Y.; Li, L. The Image of the City on Social Media: A Comparative Study Using “Big Data” and “Small Data” Methods in the Tri-City Region in Poland. Landsc. Urban Plan. 2021, 206, 103977. [Google Scholar] [CrossRef]
  39. Habibian, M.; Hosseinzadeh, A. Walkability Index across Trip Purposes. Sustain. Cities Soc. 2018, 42, 216–225. [Google Scholar] [CrossRef]
  40. Huang, J.; Cui, Y.; Li, L.; Guo, M.; Ho, H.C.; Lu, Y.; Webster, C. Re-Examining Jane Jacobs’ Doctrine Using New Urban Data in Hong Kong. Environ. Plan. B Urban Anal. City Sci. 2022, 23998083221106184. [Google Scholar] [CrossRef]
  41. Zhao, S.; Liang, Q.; Zhou, X.; Su, B. Application of Green Looking Ratio in Urban Road Greenland Design. J. Shenyang Coll. Educ. 2011, 7, 97–99. [Google Scholar] [CrossRef]
  42. Oliveira, V.; Medeiros, V. Morpho: Combining Morphological Measures. Environ. Plan. B Plan. Des. 2016, 43, 805–825. [Google Scholar] [CrossRef]
  43. Alshalalfah, B.W.; Shalaby, A.S. Case Study: Relationship of Walk Access Distance to Transit with Service, Travel, and Personal Characteristics. J. Urban Plan. Dev. 2007, 133, 114–118. [Google Scholar] [CrossRef]
  44. Steadman, P. Density and Built Form: Integrating “Spacemate” with the Work of Martin and March. Environ. Plan. B Plan. Des. 2014, 41, 341–358. [Google Scholar] [CrossRef]
  45. Ye, Y.; Li, D.; Liu, X. How Block Density and Typology Affect Urban Vitality: An Exploratory Analysis in Shenzhen, China. Urban Geogr. 2018, 39, 631–652. [Google Scholar] [CrossRef]
  46. Saaty, R.W. The Analytic Hierarchy Process-What It Is and How It Is Used. Math. Model. 1987, 9, 161–176. [Google Scholar] [CrossRef] [Green Version]
  47. Panchal, S.; Shrivastava, A.K. A Comparative Study of Frequency Ratio, Shannon’s Entropy and Analytic Hierarchy Process (AHP) Models for Landslide Susceptibility Assessment. ISPRS Int. J. Geo-Inf. 2021, 10, 603. [Google Scholar] [CrossRef]
  48. Lee, G.K.L.; Chan, E.H.W. The Analytic Hierarchy Process (AHP) Approach for Assessment of Urban Renewal Proposals. Soc. Indic. Res. 2008, 89, 155–168. [Google Scholar] [CrossRef]
  49. Awad, J.; Jung, C. Extracting the Planning Elements for Sustainable Urban Regeneration in Dubai with AHP (Analytic Hierarchy Process). Sustain. Cities Soc. 2022, 76, 103496. [Google Scholar] [CrossRef]
  50. Zhao, H.; Shi, J.; Qi, X.; Wang, X.; Jia, J. Pyramid Scene Parsing Network. In Proceedings of the IEEE Conference on Computer Vision and Pattern Recognition, Honolulu, HI, USA, 21–26 July 2017; IEEE: Piscataway, NJ, USA, 2016; pp. 2882–2890. [Google Scholar]
  51. Leung, S.M. What Makes the More Habitable High-Rise, High-Density Residential Environment in the Future of Hong Kong? Urban Des. Int. 2014, 1–26. [Google Scholar] [CrossRef]
  52. Zheng, D.; Dong, S.; Lin, C. The Necessity and Control Strategy of “Medium Density” in Metropolis. Int. Urban Plan. 2021, 36, 1–9. [Google Scholar] [CrossRef]
  53. Jiang, D.; Li, J. Several Thought about the Making of Vitality in Contemporary Cities. New Archit. 2016, 26, 21–25. [Google Scholar]
  54. Long, Y.; Huang, C.C. Does Block Size Matter? The Impact of Urban Design on Economic Vitality for Chinese Cities. Environ. Plan. B Urban Anal. City Sci. 2019, 46, 406–422. [Google Scholar] [CrossRef]
Figure 1. Conceptual framework of community vitality evaluation.
Ijgi 11 00626 g001
Figure 2. The image procession approach based on PSPNet and Cityscapes.
Ijgi 11 00626 g002
Figure 3. The geographic location of the study area, area boundaries, and contextual information.
Ijgi 11 00626 g003
Figure 4. Image data collection routes and the 54 navigation points.
Ijgi 11 00626 g004
Figure 6. Distribution map of potential vitality in Nanhuan New Village.
Ijgi 11 00626 g006
Figure 7. Closed shops on the roadside.
Ijgi 11 00626 g007
Figure 8. Distribution map of pedestrian flows.
Ijgi 11 00626 g008aIjgi 11 00626 g008b
Table 1. The input datasets used in this framework.
ItemUsageContentsSource
Crowd-gathering Street image dataCommunity vitality real reflection and verificationThe number of pedestrians and vehicles, collected by fixed-interval photography and processed by image recognition softwareXiaotu S2 Sports Camera during the 20-time site visits
Geospatial big dataThe ‘5D’ driving indicators measurement and assessmentA detailed base map covering the whole community, including the information of:
Pedestrian-accessible road networks
Building footprints with height
Urban plot with an area
Fine-grained POI data, modified according to real contextual conditions
Various navigation map suppliers, including Open Street Map, Google Satellite Map, Baidu Map, Gaode Map, etc.
The statistical unit for data fusionBasic supporting dataThe urban block is set as a basic unit for ‘5d’ driving factors measurement and assessment. The boundaries are determined based on satellite images and government planning documents.3D modeling using CAD and Rhinoceros
Basic analysis toolsCommunity vitality real reflection and verificationA suitable size regular grid for reflecting the real-life spatial distribution of community vitalityManually create fishnet using ArcGIS
Table 2. Quantification calculation method for community vitality impact factors designed in our framework.
Decision Objectives in Scheme LevelIndicators in the First Intermediate LayerEquationNumberData SourceDescription
DensityGround space index (GSI)GSI = Bx/Ax(1)Building footprints with height and plot area dataReferred to the Spacematrix by Berghauser Pont & Haupt (2005)
Floor space index (FSI)Fx = F × L
FSI = Fx/Ax
(2)
Spacemate/(3)
DiversityLand use diversity (LD) L D = k = 1 n P k l n P k (4)POI and plot area dataReferred the Shannon entropy method by Jiang (2021) and Dong, Zhang (2016), and Kunze and Hecht (2015)
Land use evenness (LE)LE = L D k L D m a x (5)
Function density (FD)FD= N k A k (6)
DesignLink connectivity (LC)LC = Street Connectivity Index in SDNAs(7)Pedestrian accessible road networksLC evaluates:
street density
the ratio of minor streets to major streets
Greenness index (GI)/ Street photos taken at fixed pointsThe average values of the proportion of greenness area/enclosed areas from all crowd-gathering photos are the inputs
Enclosure rate (ER)/
Block size (BS)/ Plot area dataQuantifying Jacobs’ (1961) theory
PositionDestination accessibility (DA)DA = Local Integration Index in SDNAs(8)Pedestrian-accessible route networksThe calculation uses Space Syntax with GIS SDNAs plug-in
Distance to transit (DT)/ Navigation map dataThe shortest distance between each block reflects it to the bus stop
Table 4. Basic information of ‘3H’ Nanhuan New Village.
IndicatorsNanhuan New Village
Total land area21.54 ha
Gross Floor Area (GFA)555,375.76 m2
Residential area and percentage391,425 m2
Floor Area Ratio (FAR)2.58
Building density26.8%
Greenness rate25.6%
Residential units4852
Parking lots2526
Table 5. A detailed description of the data source used in our empirical research.
ItemSourceQuantityTime
Street image dataField observations with Xiaotu S2 Sports Camera3029 photos1–15 August 2021
Building footprints with height
Urban blocks and building plots profile
Google Satellite Map, the world’s largest spatial information supply
(* Modified after field observations)
Accessed from: https://maps.google.com/, accessed on 1 August 2021.
97 polygonsAccessed on
August 2021
Pedestrian-accessible road networksBaidu Map and Gaode Map, China’s most extensively used map service platform
(* Modified after field observations) Accessed from: https://map.baidu.com/, accessed on 1 August 2021.
1479 lines
Fine-grained POI dataOpen Street Map, the world’s leading free wiki world map (Modified after field observations)
Accessed from: https://www.openstreetmap.org/, accessed on 1 August 2021.
68 points
* For user activity type inference needs, the original categories of POI are merged into 24 categories. They are rental services, lottery, photography, laundry, stationery, pedicure, real-estate agency, office, repairing, food retails, fashion, gym, travel agency, advertisement agency, food wholesales, tobacco and wine, education, restaurant, bank, convenience store, flower shop, appliance shop, baby caring and vacant outlet.
Table 6. AHP evaluation results for Potential Vitality Index (PVI).
Block* GSIFSISpacemateLDLEDFLCBSGIERDADTPVI
A0.0350.0990.0460.0050.0070.0130.0320.0270.0850.0230.0510.0320.45960
B0.0230.0640.04610.0080.0480.0970.0370.0250.0790.0100.0480.0320.52355
C0.0240.0670.04610000.0280.0250.0880.0040.08100.36621
D0.0240.0790.04610000.0260.0260.0920.0030.08100.38027
E0.0310.0870.04610000.0350.0230.0770.0100.07200.38546
F0.0540.1840.06920.018000.0660.0250.0740.0030.04400.54262
G0.0320.1550.06920.0020.0290.0590.0430.0230.0830.0060.05600.56120
H0.0420.1780.06920.002000.0510.0220.0820.0050.06700.52155
I0.1240.0870.02310.0140.0560.1130.0470.0250.0800.0190.0620.0210.67764
J0.1130.1050.02310.0270.0500.0990.0370.0290.0810.0130.0580.0210.66175
K0.1040.0870.02310.0240.0470.0950.0400.0290.0840.0130.0650.0210.63720
L0.0390.1640.06920.056000.0730.0280.0740.0030.06300.57206
M0.0420.1780.06920.052000.0600.0270.0770.0040.04900.56288
N0.0250.0550.04610.0010.0220.0450.0530.0310.0290.0060.0770.0400.43520
O0.1250.0760.02310.0170.0430.0860.0480.0340.0860.0080.0610.0240.63610
P0.0680.2280.06920.015000.0570.0370.0850.0230.05700.64284
Q0.0380.1610.06920.0350.0280.0550.0500.0300.0780.0190.05300.62036
* GSI: Ground space index, FSI: Floor space index, LD: Land use diversity, LE: Land use evenness, DF: Function diversity, LC: Link connectivity, BS: Block size, GI: Greenness index, ER: Enclosure rate, DA: Destination accessibility, DT: Distance to transit, PVI: Potential Vitality Index.
Table 7. Comparison between theoretical and realistic scenarios of ‘5d’ indicators on urban vitality.
DimensionIndicatorTheoretical CorrelationReal-Life
Correlation
AHP WeightAHP Weight by Dimension
DensityGround space index (GSI)++0.22860.4236
Floor space index (FSI)++0.1258
Spacemate++0.0692
DiversityLand use diversity (LD)++0.05680.2270
Land use evenness (LE)++0.1135
Function density (DF)++0.0568
DesignLink connectivity index (LC)++0.09290.2270
Block size (BS)Irrelevant0.0236
Green index (GI)++0.0731
Enclosure rate (ER)+0.0375
PositionDestination accessibility (DA)++0.08150.1223
Distance to transit (DT)++0.0408
Publisher’s Note: MDPI stays neutral with regard to jurisdictional claims in published maps and institutional affiliations.

