
Ecological Impact Prediction of Groundwater Change in Phreatic Aquifer under Multi-Mining Conditions

1
Inner Mongolia Key Laboratory of Water Resource Protection and Utilization, Water Conservancy and Civil Engineering College, Inner Mongolia Agricultural University, Hohhot 010018, China
2
Collaborative Innovation Center for Integrated Management of Water Resources and Water Environment in the Inner Mongolia Reaches of the Yellow River, Hohhot 010018, China
*
Author to whom correspondence should be addressed.
ISPRS Int. J. Geo-Inf. 2022, 11(7), 359; https://doi.org/10.3390/ijgi11070359
Submission received: 19 April 2022
/
Revised: 12 June 2022
/
Accepted: 20 June 2022
/
Published: 23 June 2022
(This article belongs to the Special Issue Geo-Information for Watershed Processes)
Abstract
:In aeolian sandy grass shoal catchment areas that rely heavily on groundwater, mining-induced geological deformation and aquifer drainage are likely to cause irreversible damage to natural groundwater systems and affect the original circulation of groundwater, thus threatening the ecological environment. This study aimed to predict the impact of groundwater level decline on vegetation growth in the Hailiutu River Basin (HRB), which is a coal-field area. Based on remote-sensing data, the land use/cover change was interpreted and analyzed, and the central areas of greensward land in the basin were determined. Subsequently, the correlation between groundwater depth and grassland distribution was analyzed. Then, the groundwater system under natural conditions was modeled using MODFLOW, and the groundwater flow field in 2029 was predicted by loading the generalized treatment of coal mine drainage water to the model. The change in groundwater depth caused by coal mining and its influence on the grassland were obtained. The results show that coal mining will decrease the groundwater depth, which would induce degradation risks in 4 of the original 34 aggregation centers of greensward land that originally depended on groundwater for growth in HRB because they exceeded the groundwater threshold. The prediction results show that the maximum settlement of groundwater level can reach 5 m in the northern (Yinpanhao), 6 m in the eastern (Dahaize), and 10 m in the southern (Balasu) region of HRB. Attention should be paid to vegetation degradation in areas where groundwater depth exceeds the minimum threshold for plant growth.
1. Introduction
As the transfer base of coal mining in China, the Inner Mongolia Autonomous Region and Shaanxi province are gaining importance [1,2]. Controlled by the burial characteristics, more than 90% of coal resources in China are extracted by underground mining [3]. However, high-intensity underground coal mining has brought about a series of water resource and ecological environmental problems [4,5]. Continuous development of underground coal mining would lead to the deformation and collapse of the overlying strata, resulting in fissures and subsidence, which will destroy the groundwater aquifer system [6], reduce the regional groundwater level, and affect the surface ecological environment. Unlike other regions, coal deposits in Inner Mongolia and Shaanxi are located in arid and semi-arid regions [7,8,9], which are areas of serious soil erosion in China, and their ecological environment is very fragile. Consequently, there is a major contradiction between groundwater loss through drainage by coal mining and the lack of water resources for vegetation growth. Therefore, it is meaningful to study the ecological changes caused by the decline of groundwater level due to coal mining.
Coal burial in China is characterized by strong geological reconstruction after coal formation due to which water inrush accidents occur frequently during coal mining [10]. Such accidents pose serious threats to the safety of miners and mine production equipment, hinder the development of coal industry and mining operations [11], and even bring a series of ecological and environmental problems. Therefore, it is necessary to study the groundwater system of coal mining areas. For example, Yu et al. [12] carried out field trials on coal mine geological engineering in the Bucun coal mine, China, based on theoretical calculation and numerical simulation, and proposed a combined controlling measure considering underground coal mining and the water environment. Andres and Jose [13] presented a conceptual and numerical model of two linked mines in Spain for the assessment of possible environmental risks following closure. Wu and Wang [14] presented a conceptual framework with multilayered groundwater flow systems for the characterization of water bursting and discharge in underground mines, based on the characteristics of regional geological conditions, and they analyzed mine water inrush and flooding events in the north China coal basin.
With the gradual improvement of governmental efforts and increase in people’s awareness on the protection of the ecological environment [15], the impact of coal mining on the ecological environment is receiving increasingly more attention [4]. For example, in order to evaluate related effects in mining areas and non-mining areas from an ecological viewpoint, Xiao et al. [16] constructed an ecosystem service measurement and evaluation index system in a typical high-intensity coal mining area using remote sensing and geographic information system (GIS) and obtained good application results. Aiming to investigate the contamination level, distribution, and possible sources of polycyclic aromatic hydrocarbons (PAHs) in six coal mines in Xuzhou, China, and assess their ecological risks, Chen et al. [17] determined the concentrations of 16 PAHs in 26 underground samples, including coal, mine water, and underground sludge. Quaranta et al. [18] studied the influence of coal slurry injection in two underground coal mines on the potential water quality of surface water and groundwater in the central Appalachians and predicted the standard excess of surface water and groundwater using a dilution analysis model.
Recent studies have defined three stages of impact (damage phase, post-damage phase, and restoration phase) based on the effect of mining-induced groundwater changes on vegetation conditions [19]. Xie et al. [20] established a hydrogeological conceptual model and a groundwater flow numerical model to predict mining-induced changes in the groundwater flow field over five years (30 April 2015 to 30 April 2020). Based on the vegetation index determined using remote-sensing data, Zhang and Wang [21] reported that groundwater depth has a prominent effect on the spatial variation of vegetation distribution in the Ordos Plateau of China.
The border between Inner Mongolia and Shaanxi feature mega-coal fields, which are slated for mining in the next decade [1,22]. However, these coal fields occur below the Mu Us Sandy Land, which has the most vulnerable environment in China [23,24]. Therefore, changes in the groundwater and natural environment induced by coal mining are bound to affect the sustainable development of the region. These effects are mainly manifested in the reduction in groundwater, deterioration of vegetation that relies heavily on groundwater for growth, and regional vegetation shifting toward more drought-tolerant species [25], which are not suitable for grazing. More seriously, when groundwater shortage exceeds the basic threshold for maintaining vegetation growth, desertification will occur, making the area unsuitable for human habitation. Therefore, when groundwater discharge by coal mining exceeds natural recharge, groundwater resources will inevitably decrease sharply, ultimately threatening the healthy development of regional agriculture, animal husbandry, and industry. In particular, the Hailiutu River Basin (HRB) is a typical representative of this area. HRB has multiple planned coal fields, and its ecological vegetation and agricultural development mainly depend on groundwater recharge [26]. The relationship between the groundwater and ecology of HRB and its surrounding areas has been widely studied. In areas with groundwater depth less than 10 m within the HRB, the mean and standard deviation of normalized difference vegetation index (NDVI) values have been found to decrease with increasing groundwater depth [27]. Mata-González et al. [28] reported that vegetation growth and plant diversity are closely related to groundwater depth, especially in arid and semi-arid regions, and areas with shallow groundwater have higher vegetation coverage and plant diversity. Accordingly, the decline of groundwater level caused by coal mining will inevitably affect the status of vegetation growth, especially in the aeolian sand grass shoal catchment area, which is heavily dependent on groundwater [29]. Previous studies have investigated and predicted the influence of coal mining on groundwater mainly by establishing groundwater models [30,31]. In these models, the drainage by coal mining is used as input [32]. Subsequently, future changes in the groundwater flow field are predicted after model calibration and verification [33]. However, the prediction of the impact of groundwater change on the ecological environment has not been comprehensively analyzed thus far. In particular, detailed information on the specific impact of model predictions on the corresponding spatial distribution of a certain vegetation type after water level changes is lacking.
To address this gap, this study predicted the grassland degradation risk associated with groundwater decline induced by coal mining. Selecting HRB as a representative of the coal fields of Inner Mongolia and Shaanxi, mining-induced changes in groundwater circulation and their effects on the ecological environment were investigated. The groundwater depth of HRB was determined by measuring submersible wells, and the distribution of greensward land in the basin was interpreted using remote-sensing satellite images. Finally, changes in the groundwater flow field in the next 10 years (2020–2029), after the commencement of mining in first three mining areas in the basin, were simulated using a numerical model.
2. Materials and Methods
2.1. Study Area
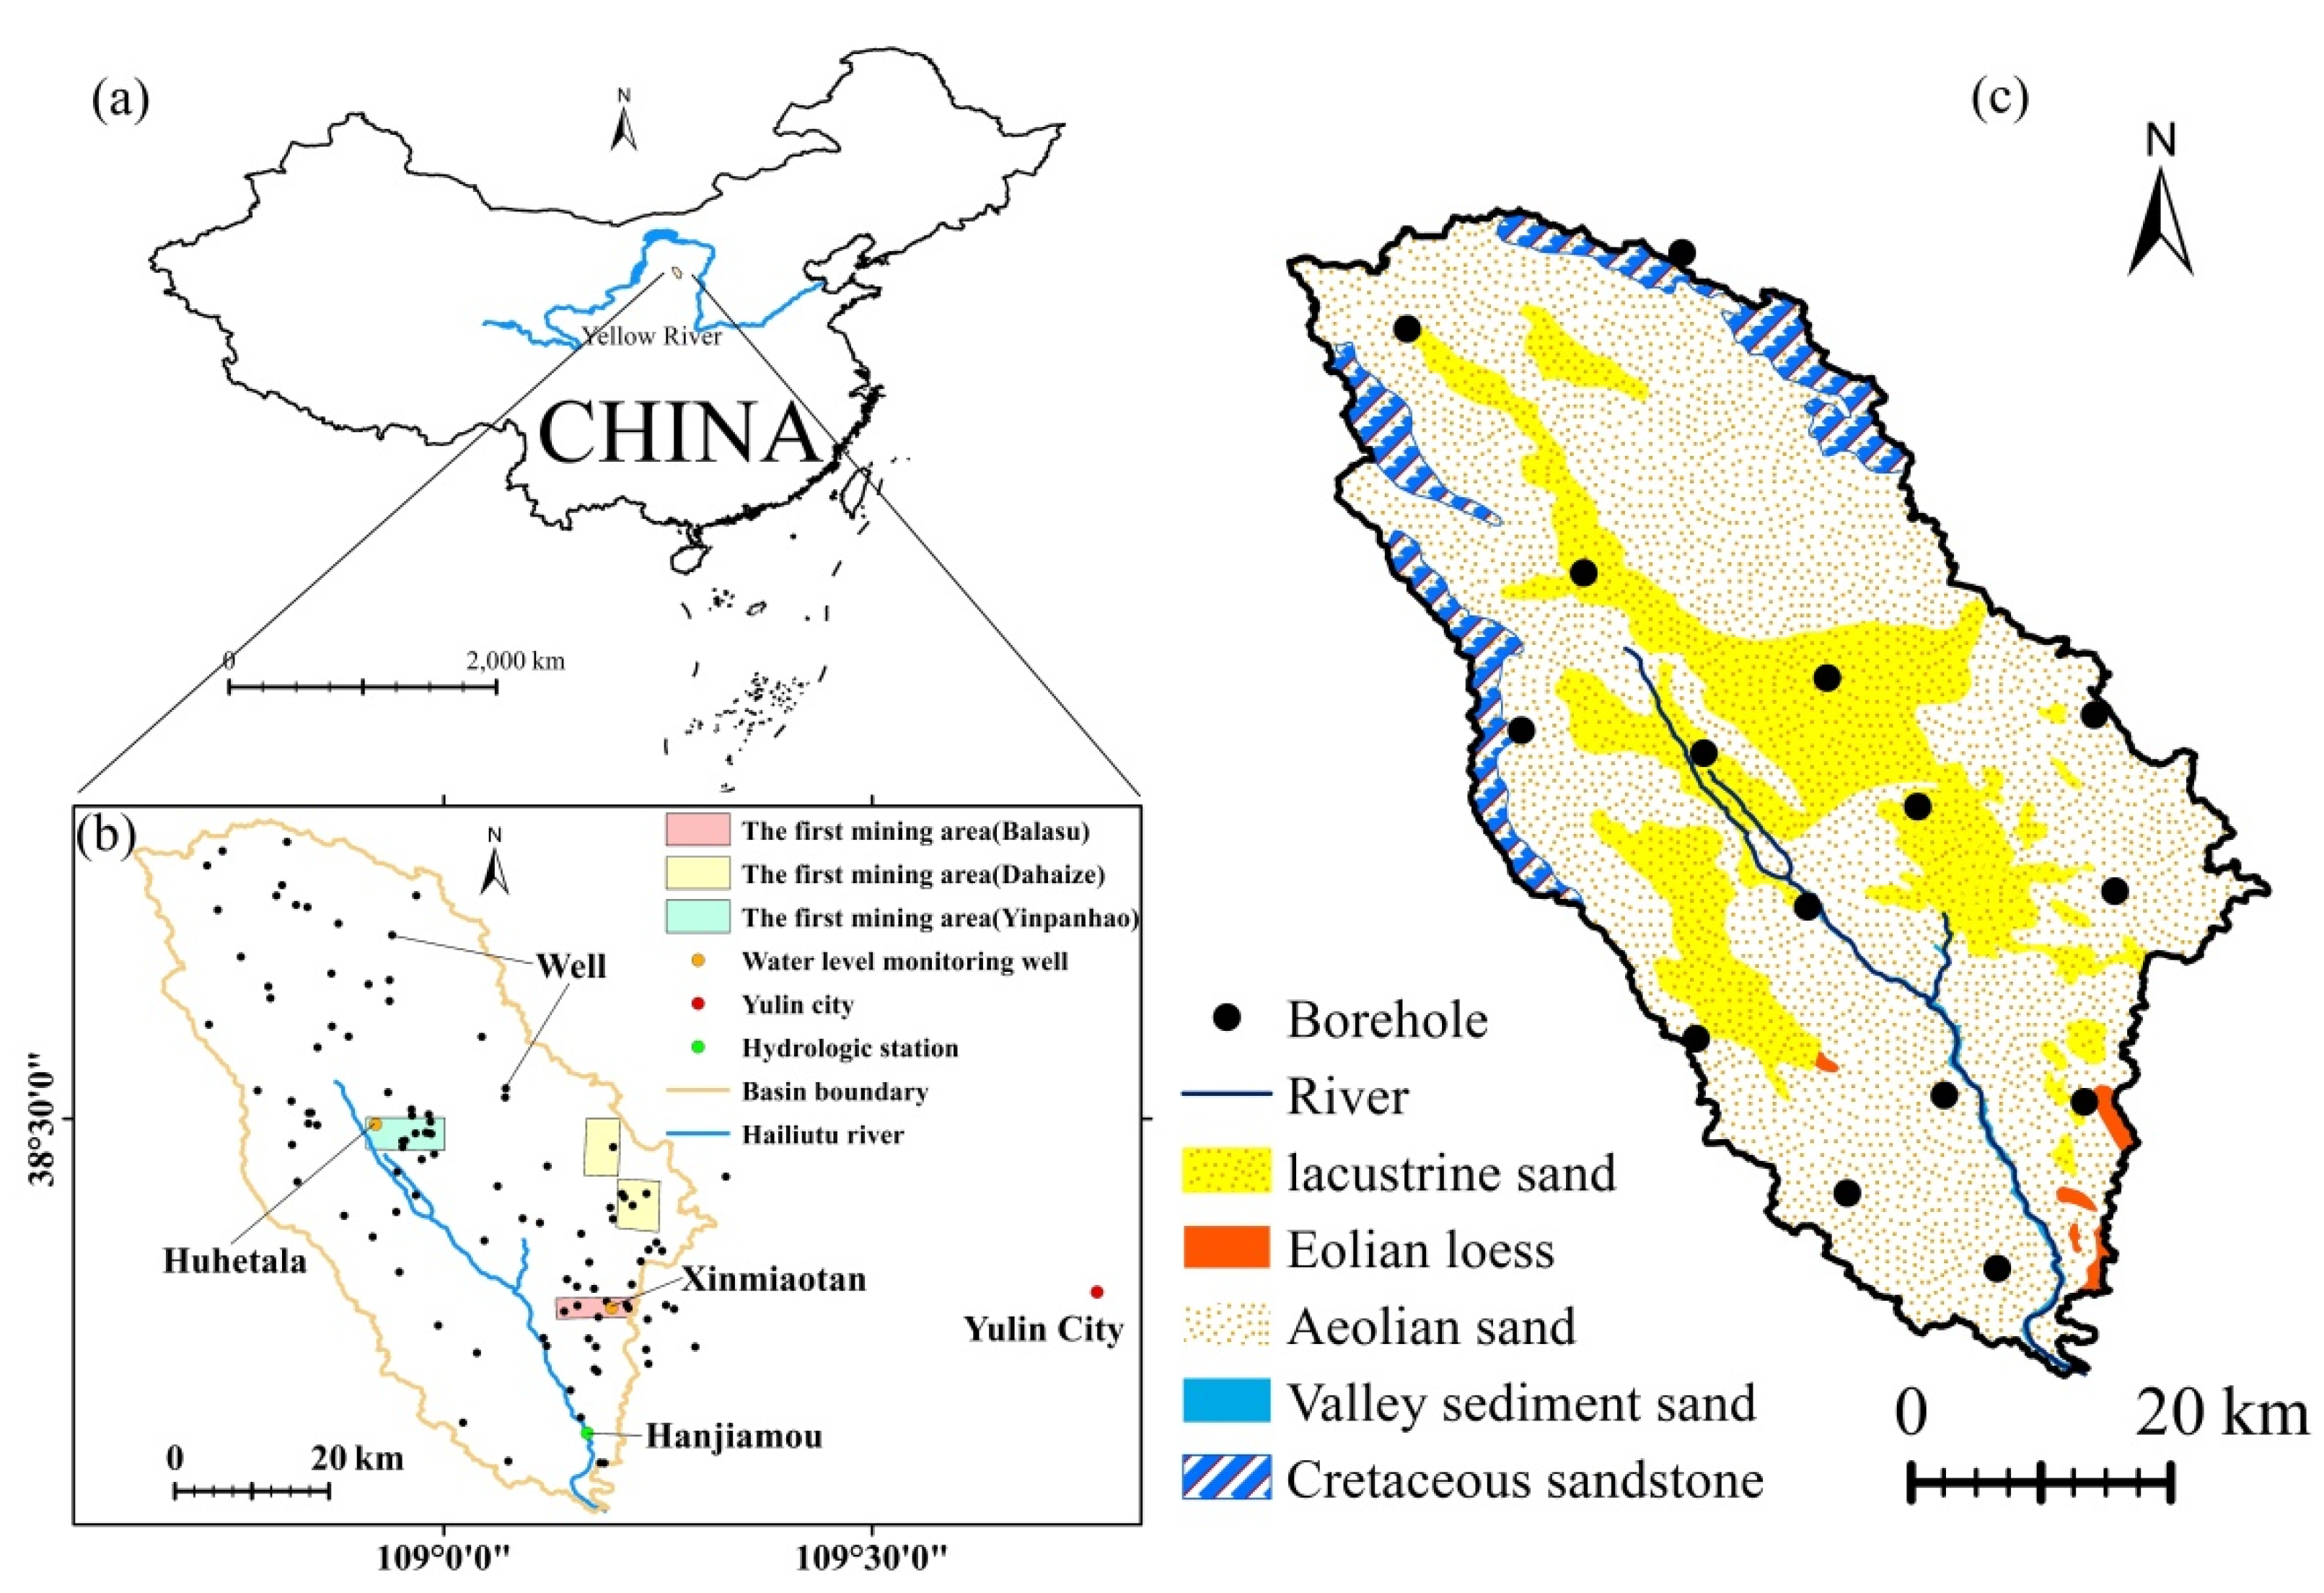
HRB is located at the junction of Inner Mongolia and Shaanxi (Figure 1), which is an important coal mining base in northwest China. This basin belongs to the middle course of the Yellow River Basin. HRB is a small multiple bottomland basin in the transition area from the Ordos Plateau to the northern Shaanxi Loess Plateau [34]. The entire basin lies above the Mu Us Sandy Land, and the surface is mainly covered by Quaternary aeolian sand and lacustrine sand [35] (Figure 1). The basin covers an area of approximately 2600 km2 and has a surface elevation ranging from 1020 m in the southeast to 1480 m above mean sea level in the northwest [36]. The perennial Hailiutu River flows from the northwest to the southeast of the basin and enters the Wuding River, the main tributary of the middle Yellow River. The Hanjiamao hydrological station is located at the outlet of watershed catchments, which had an average annual runoff of 0.8 × 10⁶ m3 from 1957 to 2014. HRB has a typical steppe environment with arid, semi-arid sandy land and beach land. It has a temperate continental monsoon climate, and atmospheric precipitation is the main source of water supply. The annual precipitation is 370 mm, and the annual average potential evaporation is 2000 mm [37]. The precipitation is mainly concentrated between July and September, and the wind direction is mainly northwest.
2.2. Geology and Hydrogeology
The study area has flat terrain, gentle strata, simple geological structure, and no distinct faults. The tectonic activity is not strong [38], and the watershed of HRB is composed of denudation loess ridges and high dunes [39]. Along at the river channel, the topography is steep, mainly due to river scouring and cutting of Cretaceous strata through flow erosion at the outlet of the basin. In addition to psammophytes, grass, and farmland, most of the land surface is covered by Quaternary sand dunes, with scattered spots of small ponds formed by groundwater. The Quaternary layer has various diagenetic features, but the thickness is generally small. Mesozoic and Cenozoic strata are widely exposed and generally water bearing, and the Lower Cretaceous Huanhe Formation of the Baoan Group is exposed only in some areas [40]. Within the basin, the Quaternary and Cretaceous aquifers exhibit distinct vertical variation, and their thickness varies widely.
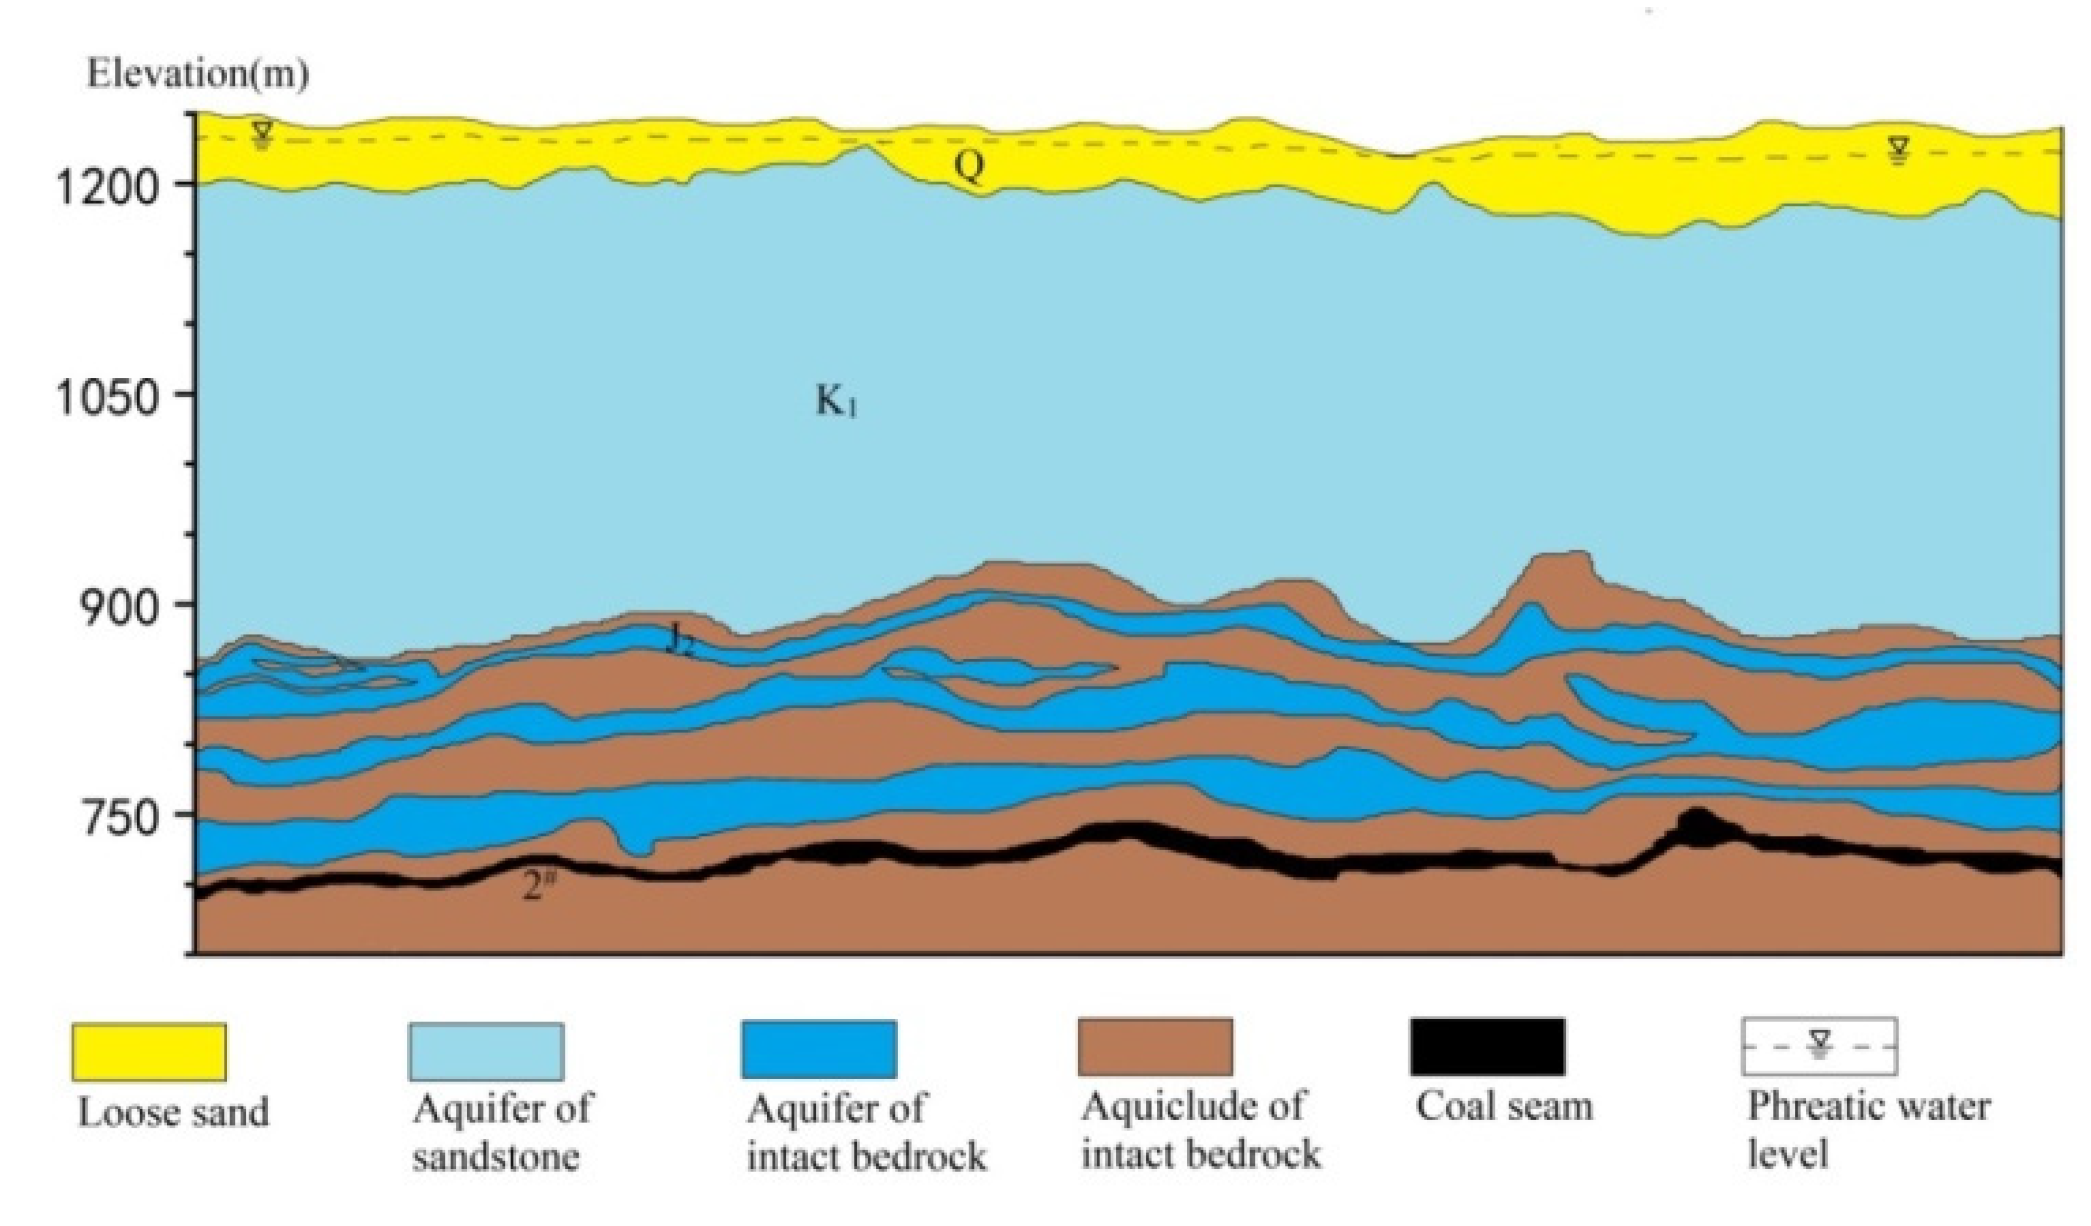
The average thickness of the upper Quaternary loose rock soil is approximately 50 m. The thickness of the Cretaceous sandstone aquifers is approximately 350 m. Between the main 2# coal seam and the Cretaceous floor is a special aquifer group formed by the alternate deposition of sandstone aquifers and impervious layers, which is the main source of mine water inrush [41]. The thickness of this special aquifer group is approximately 180 m. The Jurassic 2# coal seam in the study area is the first mining coal seam with an average thickness of 5 m (Figure 2). Restricted by the paleotopography during deposition, the thickness of each stratum in the basin varies greatly [42]. Generally, the strata are the thickest in the paleochannel and low-lying center, gradually thinning to both sides, and nip-out at the watershed [43]. However, the thickness of Quaternary strata gradually decreases from downstream to upstream, and the thickness of some beach land in the middle of the basin increases. The thickness of Cretaceous strata gradually increases from downstream to upstream, forming a large aquifer. Among them, there is no continuous and effective aquifuge between Quaternary and Cretaceous aquifers, but there are multiple aquifuge and aquifer alternations in the Jurassic strata [44]. Therefore, the aquifer above Cretaceous strata is regarded as a water-rich layer, and the aquifer below is regarded as a weak aquifer. Based on the above, the Quaternary and Cretaceous strata in the study area can be regarded as a unified phreatic aquifer group. The Quaternary and Cretaceous aquifer groups have different thicknesses, but they generally exhibit a continuous distribution. Stratigraphic integration is relatively gentle among the Jurassic strata, and the 2# coal seam is also evenly distributed in the basin because of the stress action of the upper strata [45].
2.3. Land Use/Cover Classification
Land use/cover change (LUCC) can provide crucial information for global environmental change and human environmental science [46]. LUCC can directly reflect the way humans utilize the land and the influence of human activities on the ecological environment [47]. In this study, we used Landsat images (TM/ETM+/OLI) of moderate resolution (30 m), remote-sensing data, and optical images from October 2019 acquired from the United States Geological Survey (USGS). We selected remote-sensing images with no or less cloud cover to improve the accuracy of land cover classification. For HRB, only one-scene images are required. Regarding the images, the cloud cover was 0.49%, and the Landsat path/row numbers were 128/33. After pretreatment, which involved radiometric calibration and atmospheric correction, land cover information was extracted using a supervised classification method [48]. In this study, land cover was classified into seven classes: greensward, psammophyte, water bodies, roads, buildings, farmland, and bare sand. The classification was performed according to the quantity and distribution characteristics in land use/cover types of the study area determined through field surveying and the research objectives of this study. We selected training samples from field investigations and Google Earth Engine for land use classification. A total of 287 samples were selected from evenly distributed sampling points in the watershed, including 58 greensward, 23 psmmophyte, 6 water bodies, 20 roads, 45 buildings, 68 farmlands, and 67 bare sandy lands. For pixel sample training, 70% of the samples were employed, and the remaining samples were used for testing (Table 1).
The distribution of greensward area in HRB was processed in the ENVI software, which was used to validate the classification results. Although greensward area accounts for only 7.1% of the basin, its sensitivity to changes in groundwater depth is the highest among all land use types.
2.4. Interpolation of Groundwater Depth
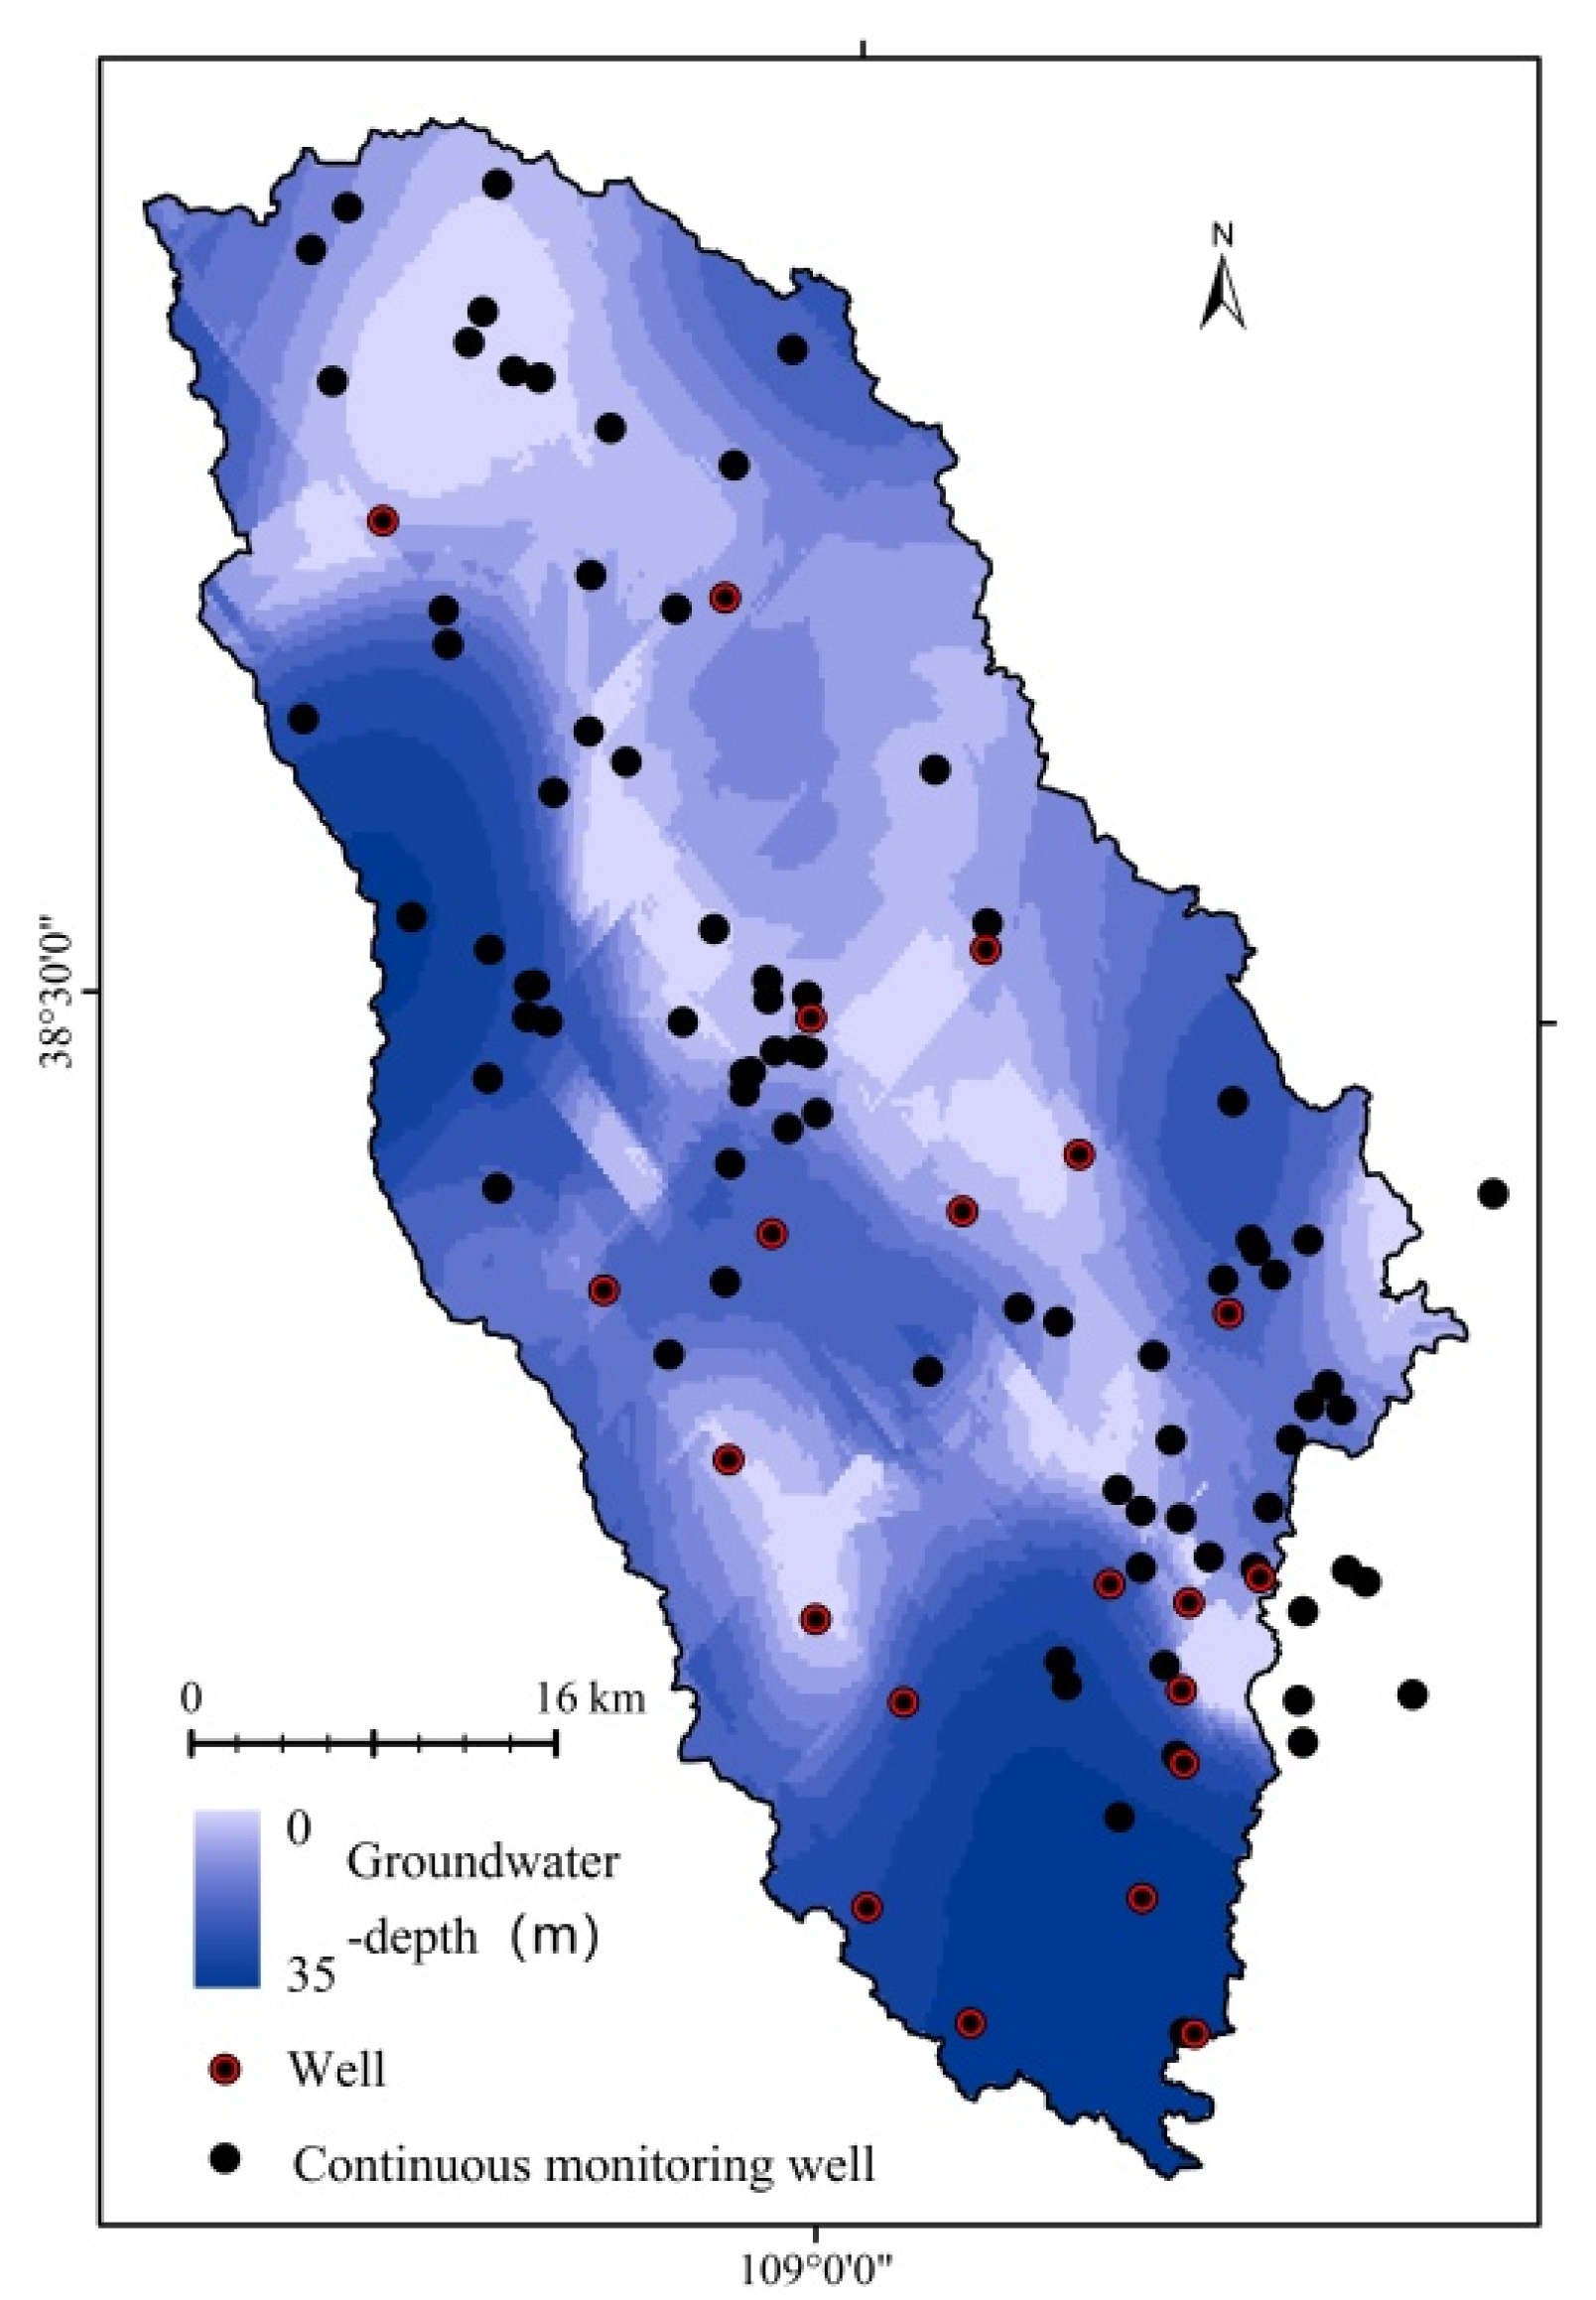
Spatial interpolation is an effective tool for studying groundwater distribution and has been widely used in the field of groundwater resources [49]. As only limited point-scale groundwater depth information can be obtained through monitoring stations in HRB, we used spatial interpolation to process the measured 100 wells and obtain spatially continuous groundwater depth data. To ensure that the wells were spatially representative, we selected 21 wells for continuous monitoring from July to early September (Figure 3). The monitoring showed that the average variation of groundwater level was only 0.1 m. To gain a more realistic view of groundwater depth in the watershed, we used the measured groundwater depth as the main variable and some small lakes and river node locations in the watershed as auxiliary variables, and we used the Co-kriging method of the ArcGIS software for interpolation [50]. Co-kriging is an extension of ordinary kriging, in which the best estimation method of regionalized variables is developed from a single attribute to two or more synergistic regionalized attributes, and one or more auxiliary variables are applied. These auxiliary variables, which are interpolated and estimated, are related to the main variables, and the correlations between the variables are assumed to be used to improve the accuracy of the main prediction target [51]. The interpolation of groundwater depth is mainly based on the following equation:
where x is variable location, is the predicted value for the x position, is the measured value of the primary variable, is the measured value of the covariate, λ is Co-kriging weights for Z, n is the number of the primary variable, and m is the number of the covariate.
2.5. Model Description and Setup
Groundwater was simulated to predict changes in groundwater level in the basin under the combined exploitation of multiple underground mines and to study the change in groundwater resources using the simulated water level. The circulation of the groundwater system was simulated using the MODFLOW groundwater model, based on Darcy’s law and the foundation of Dupuit, which are widely used in groundwater research [52,53]. MODFLOW was implemented in the GMS software platform to simulate the watershed. Through MODFLOW finite difference numerical simulation, HRB was subdivided into square meshes of 200 rows and 200 columns, on average. Finally, the watershed was divided into 20,986 grids. To establish the model, hydrological data, hydrogeological information, meteorological data, and groundwater level data were acquired from various sources. Geological drilling information and topographic elevation data are needed in the initial stage of the model. Hydrogeological parameters, water level, evaporation, and rainfall were applied as the driving forces of the hydrological cycle. For the initial groundwater flow field, important data were acquired through a groundwater survey from April to May 2019. Simulated and measured values were compared according to various evaluation metrics, and the model was optimized by fitting the actual values. The optimized model was finally used to predict the future conditions. In the groundwater simulation, the input factor values required adjustments within a certain range for adaptation to the ground conditions.
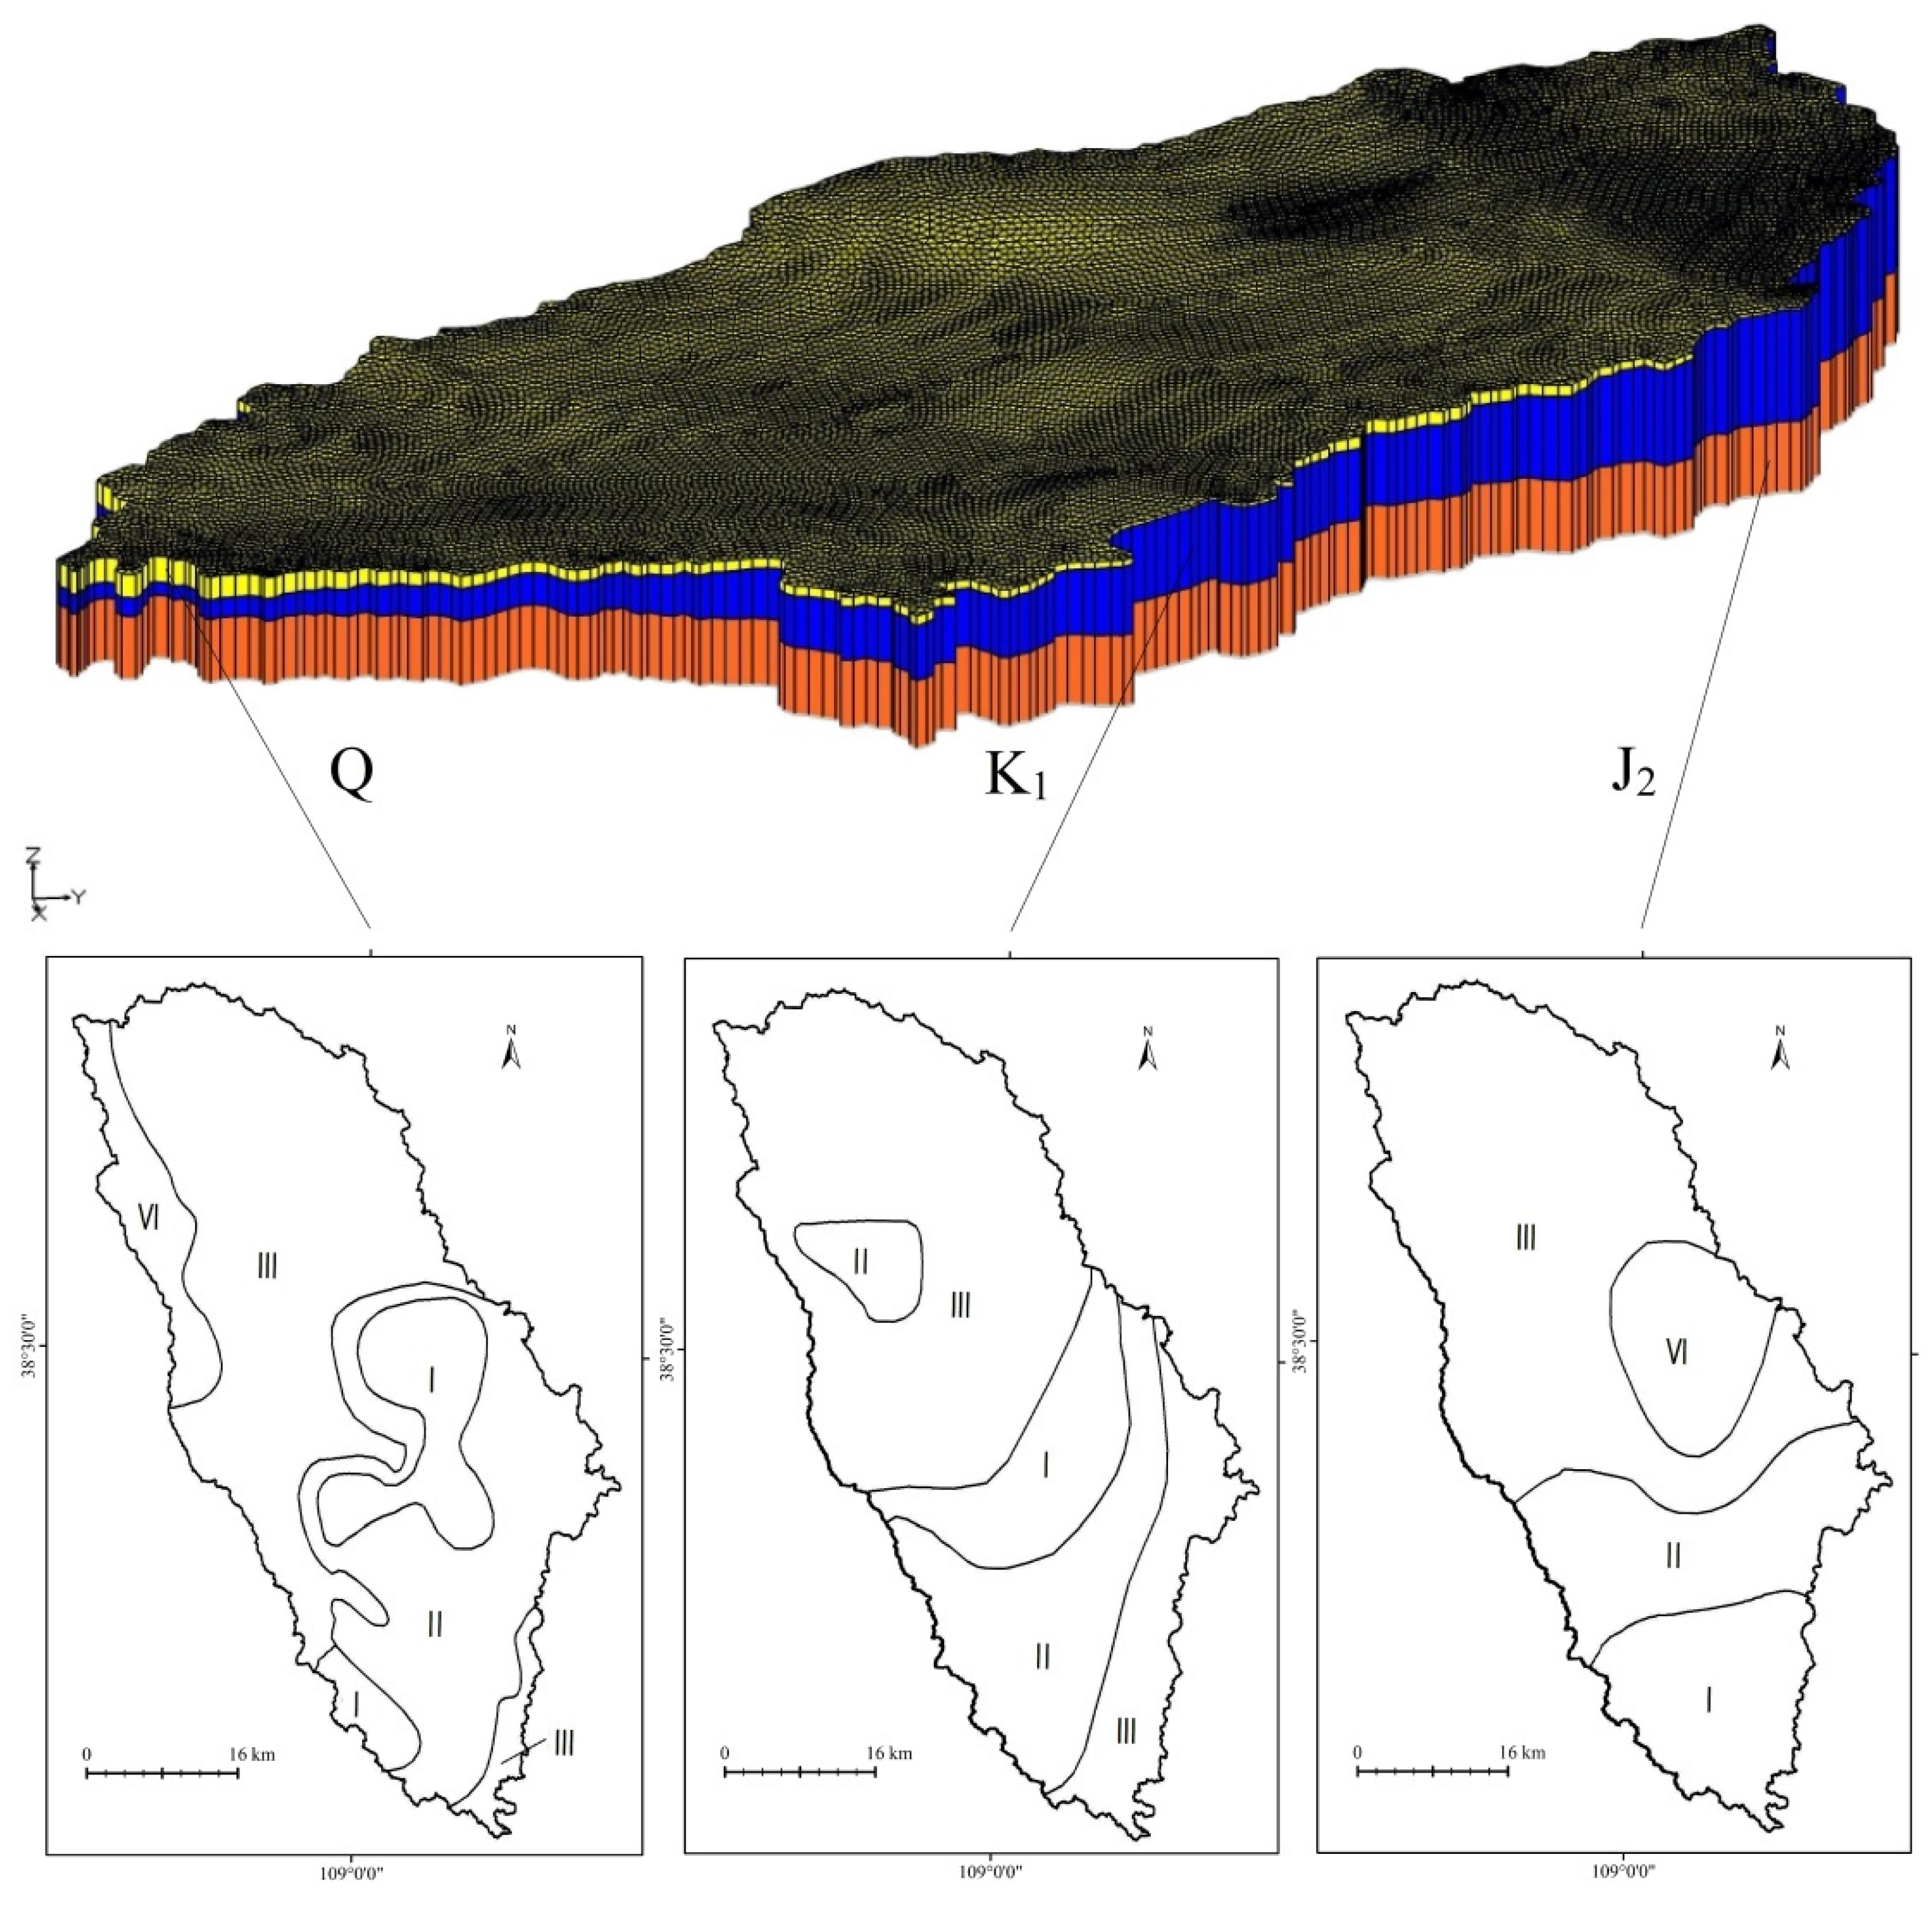
In order to establish an effective groundwater model, the aquifer system was generalized into three layers consisting of Quaternary aquifers, Cretaceous aquifers, and Jurassic strata above the 2# coal seam considering the strata lithology, groundwater occurrence, and hydrodynamic characteristics of the study area. In addition, the boundary conditions and internal structure of the study area were generalized according to the actual relationship between water supply and discharge (Figure 4). The phreatic aquifer in the basin is directly related to the atmosphere and vertical water exchange through surface processes such as precipitation infiltration, evaporation and drainage, and farmland irrigation. Horizontal groundwater movement is determined by the topography and geological characteristics of the study area. Based on the accurate description of the conceptual hydrogeological model of groundwater system, a mathematical model of the basin was established. This three-dimensional and finite difference groundwater flow model is based on the groundwater flow equation, combined with the three-dimensional mathematical model of non-steady flow. The model was visualized in GMS. The final mathematical model of the basin is as follows:
where is the water storage coefficient, h is the groundwater head or elevation (m), is the hydraulic conductivity in the horizontal direction (m/d), is the hydraulic conductivity in the perpendicular direction (m/d), W is the strength of source and sink (m3/d), q(x,y,z,t) is the inflow or outflow function from a unit area in a unit time of the second boundary condition, Γ is the flow boundary, И is the head boundary, Ω is the scope of the model, is the river permeability coefficient (m/d), is the sedimentation thickness of the river channel (m), is the water level in the river (m), and is the stream flow (m3/d).
According to the characteristics of aquifers in the watershed and the distribution of the groundwater flow field, shallow water aquifers in the watershed were divided into flow boundary and closed boundary aquifers. Along the streamflow direction of groundwater, the north of the watershed is the recharge boundary, and the south is the discharge boundary. The Hailiutu River receives water from continuous groundwater discharge, and it was thus simulated as a drain [21,36]. In order to characterize the discharge process of the river in detail, the river course was divided into 7 sections, and the actual flow was measured in each section. The measured average flow was input into the model. The phreatic aquifer in HRB is directly recharged by atmospheric precipitation. As the sandy land is characterized by a high infiltration rate, scarce vegetation on the surface, and low evaporation capacity, the free surface of the phreatic aquifer is regarded as the boundary surface of vertical recharge. In the model setting, precipitation directly recharges groundwater, and evaporation is affected by groundwater depth. Moreover, farmland irrigation wells are evenly distributed in the basin, which can be regarded as the surface discharge of groundwater resources. For the simulation of recharge and evaporation processes, the Recharge Package and Evapotranspiration Package of MODFLOW were implemented [54], with data obtained from the measured precipitation and evaporation at the meteorological stations of Yulin City near the basin. The groundwater flow conditions of all aquifers in the study area are essentially similar, but the hydrogeological parameters are spatially different. The hydrogeological parameters were mainly determined through pumping tests, but the initial hydrogeological parameters simulated by the model may not closely match the actual situation. This is because the parameters obtained by the pumping test are only point data, while the model requires area data. Considering the characteristics of the groundwater flow field and hydrogeology data collected during the geological survey, based on hydrogeological parameters, the phreatic aquifer was divided into 4 zones (Quaternary) and 3 zones (Cretaceous), and the confined aquifer (Jurassic) was divided into 4 zones (Figure 5). Groundwater in the study area is mainly recharged by atmospheric precipitation, and the infiltration coefficient of precipitation is determined by the surface geotechnical properties. The infiltration coefficients of precipitation are 0.34 (aeolian sand), 0.26 (lacustrine sand), 0.29 (valley sediment sand), 0.07 (eolian loess), and 0.09 (Cretaceous sandstone) for the five zones of the top layer (Figure 1c). The depth limit of phreatic evaporation was defined as 4 m according to preliminary knowledge of the investigator. Water quotas for farmland irrigation were recorded from actual observations.
2.6. Model Calibration and Validation
Through the accurate calibration of the measured and calculated water levels, the groundwater flow in HRB was successfully simulated. The actual observed groundwater level and flow field were mainly fitted by trial-and-error calibration, such that the simulated groundwater levels are reasonably coordinated with the observed values. The observed groundwater level data from July 2019 to December 2019 (184 days in total) were used for model calibration. To ensure that the dynamic change in the simulated groundwater level was as close as possible to the observed data, the hydrogeological parameters were constantly adjusted [55]. At the end of the simulation (184 days), no significant difference was observed between the simulated non-pressurized aquifer flow field and the measured groundwater flow field.
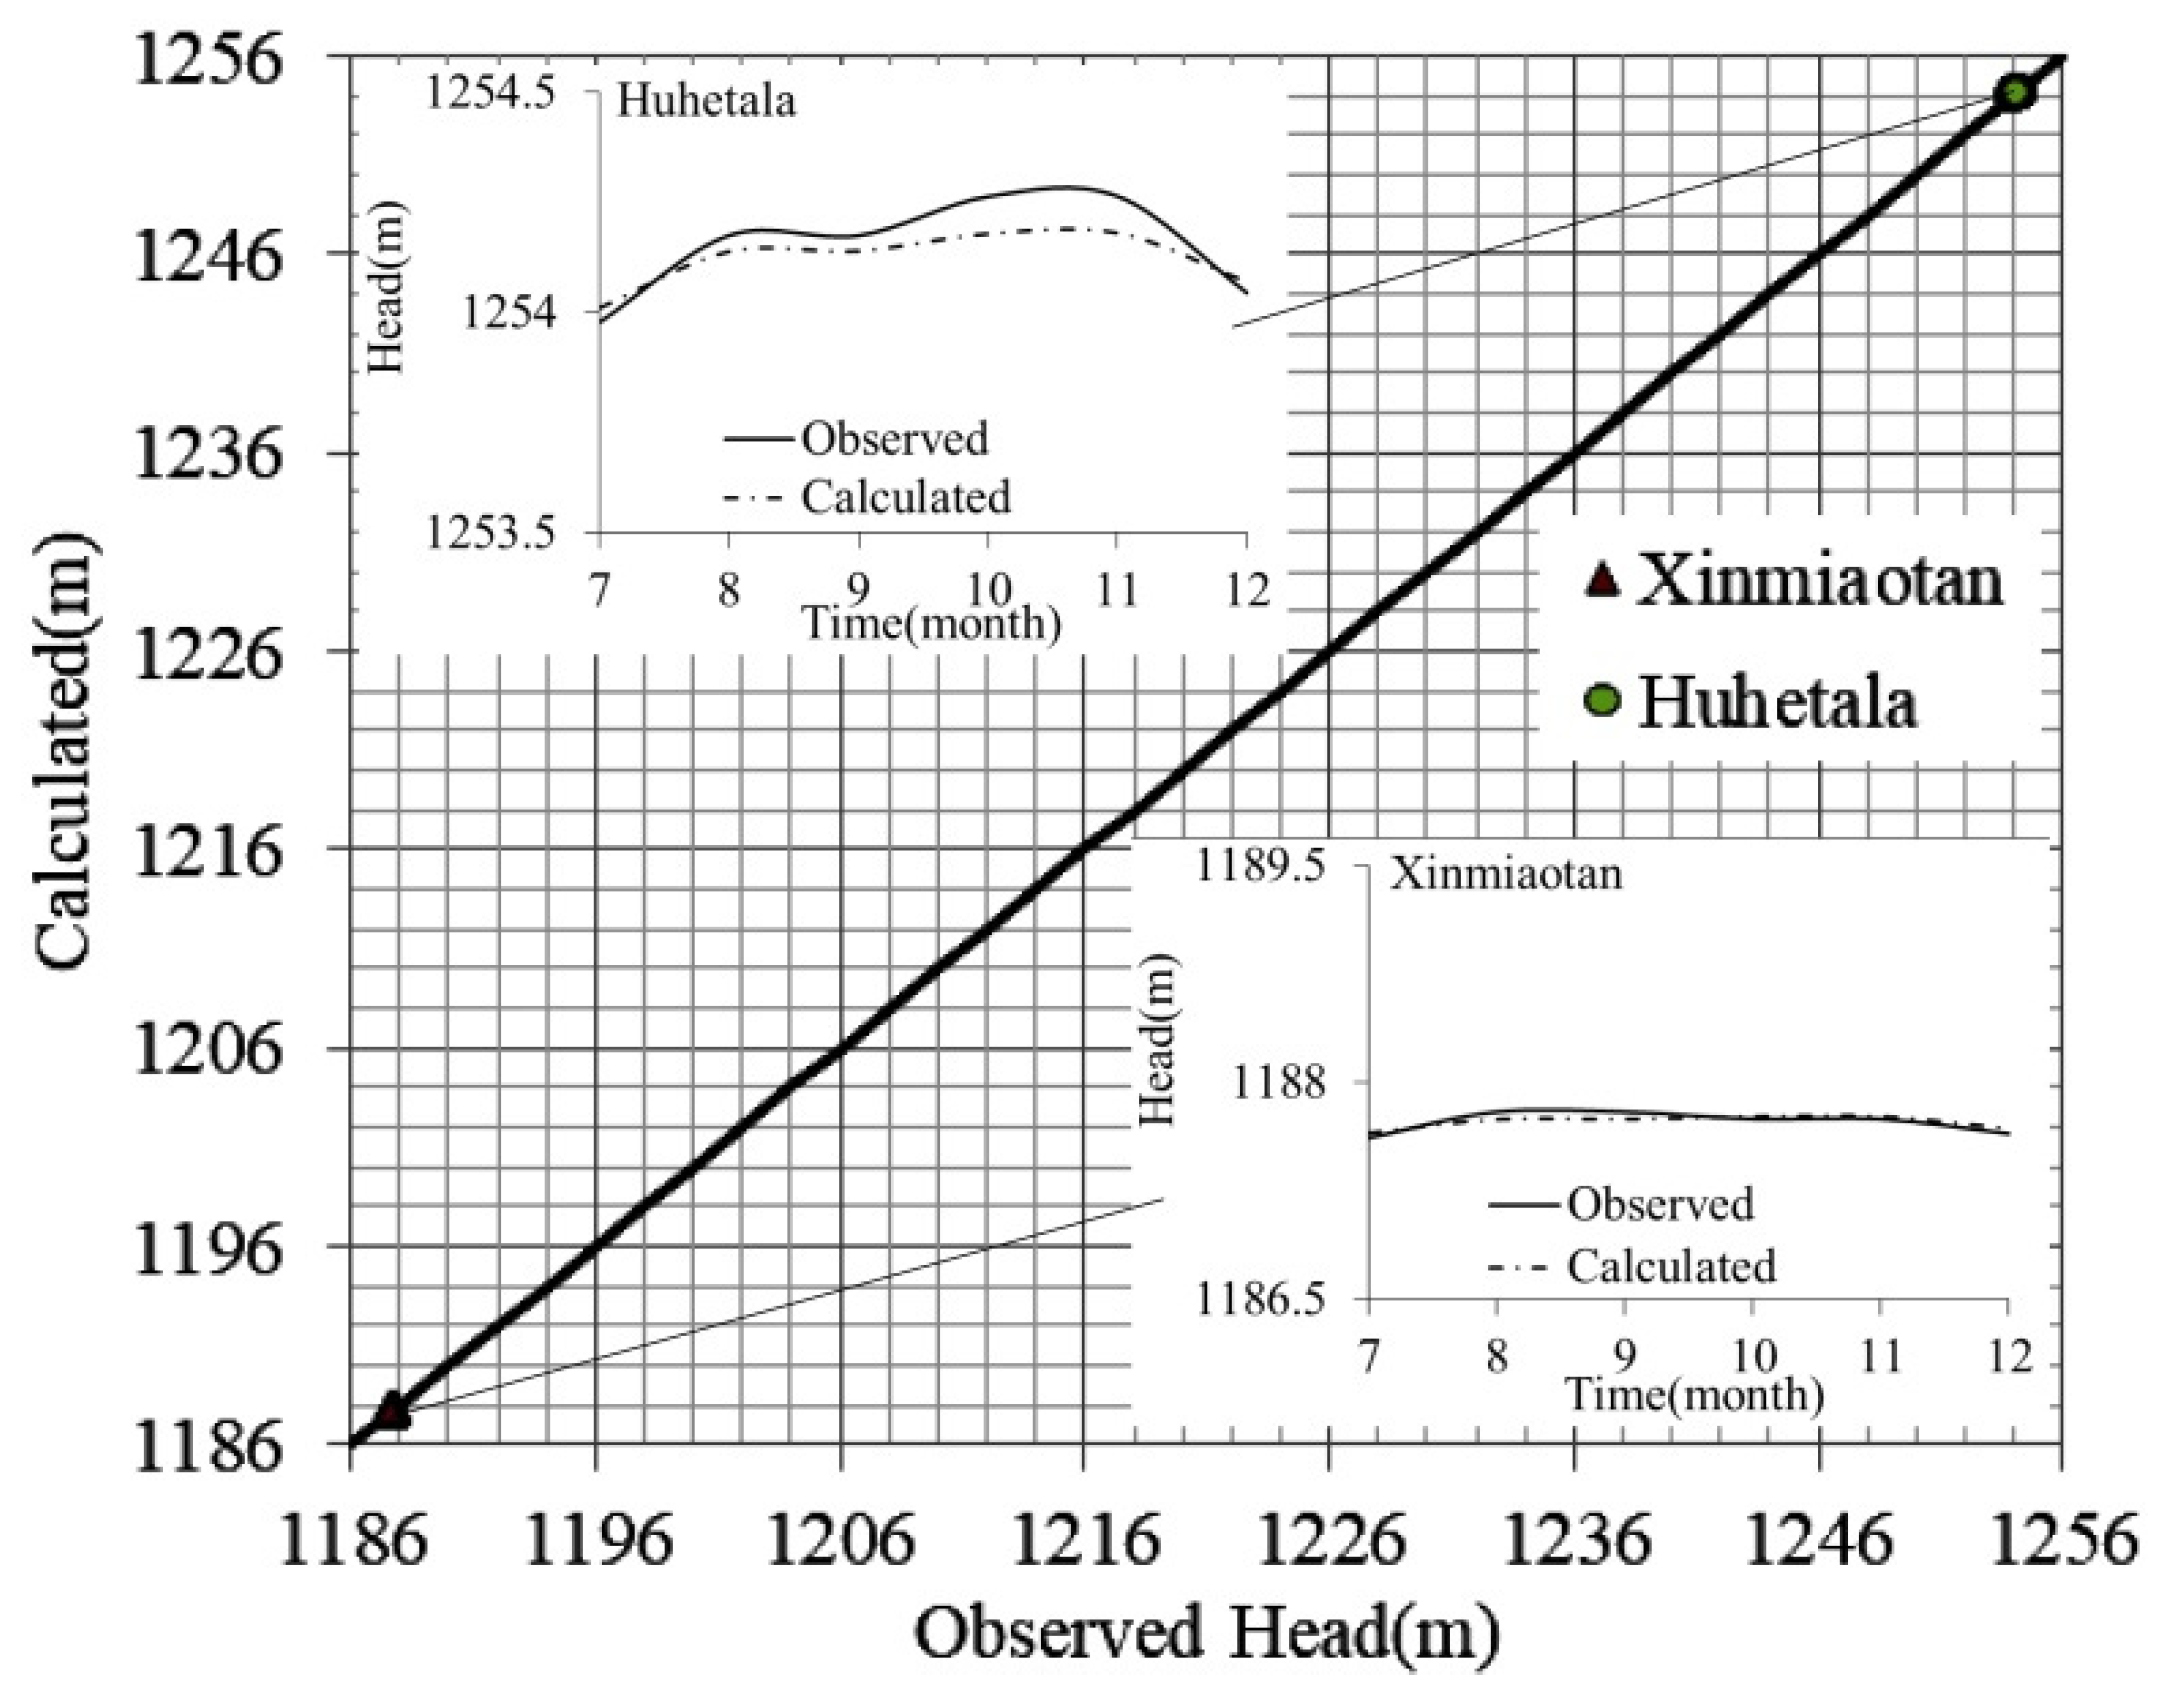
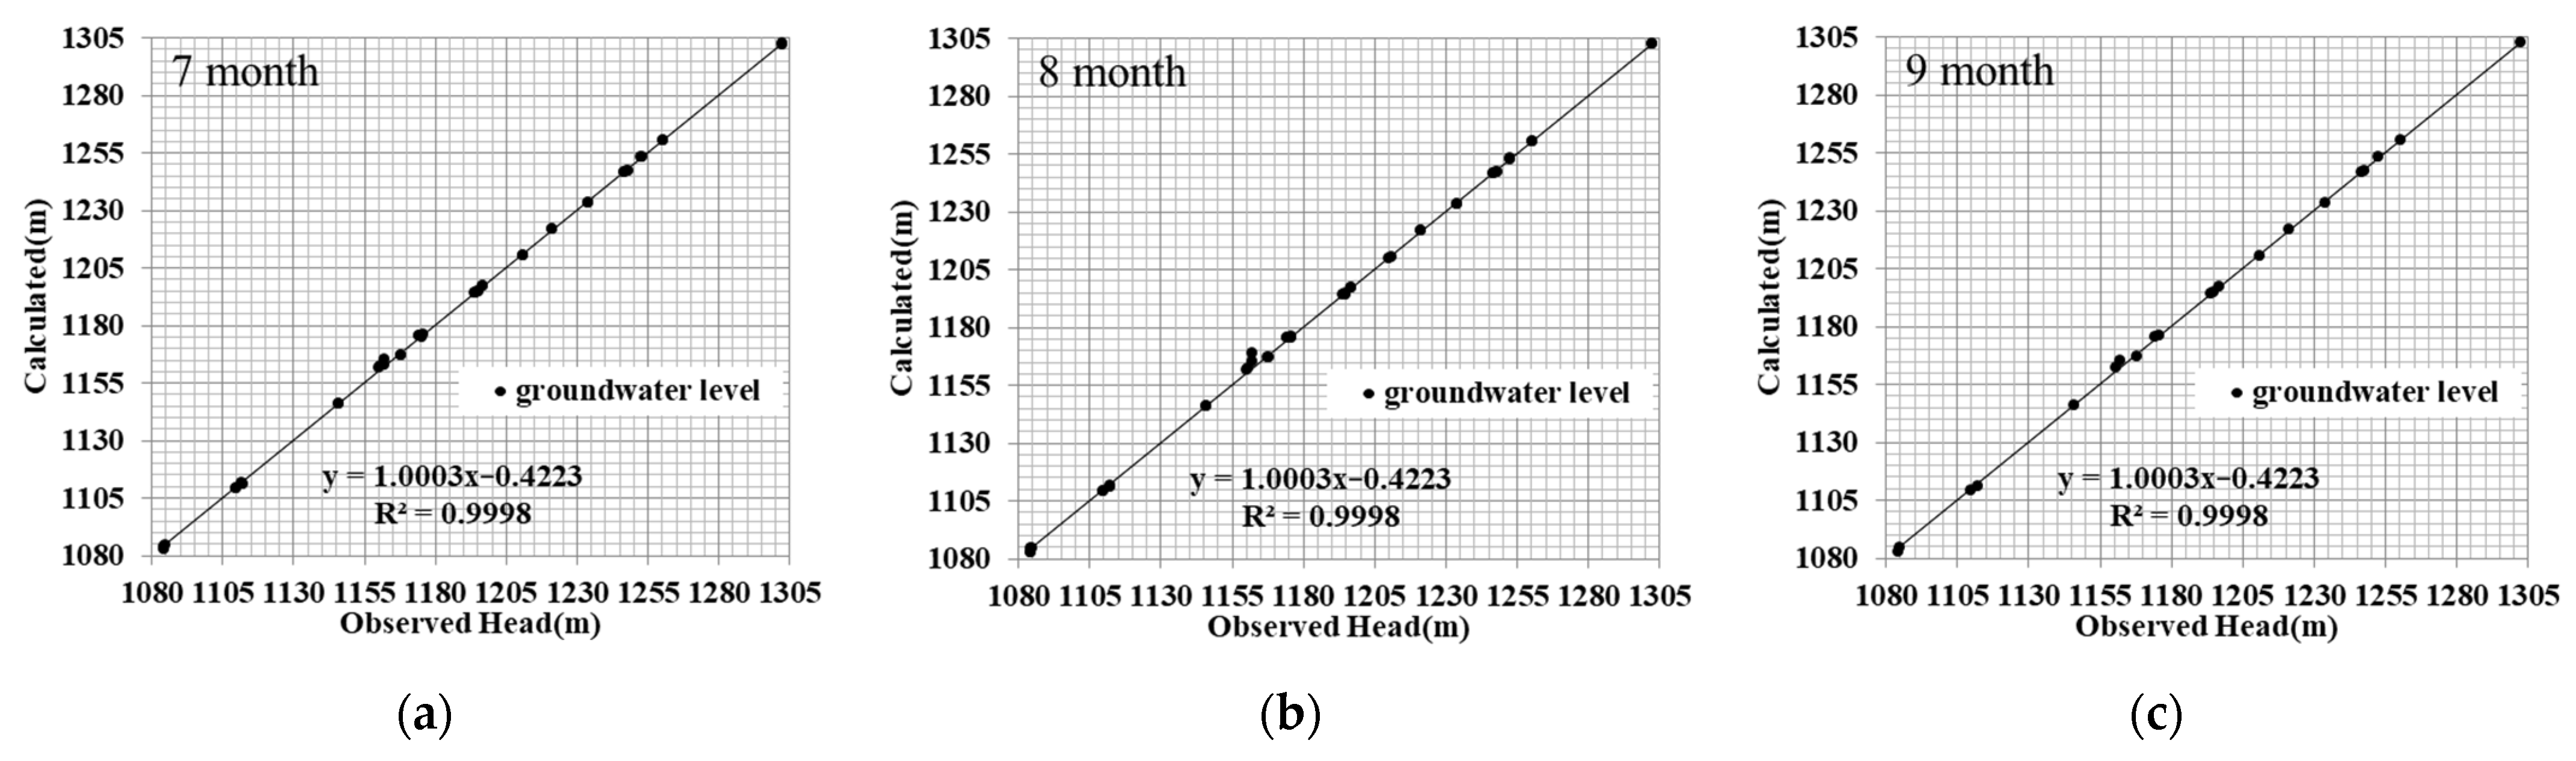
As shown in Figure 6 and Figure 7, the simulated groundwater level and the observed groundwater level were in line with the groundwater hydraulic properties of the basin. The groundwater levels of our long-term observation wells in Huhetala and Xinmiaotan are in good agreement with the simulated values. According to the centralized survey of the 21 selected wells at the beginning of each month from July to September, the water levels in the observation wells agree with the simulated values (Figure 7). Moreover, the maximum groundwater level error between the observed data and the simulated data of the two observation wells was 0.5 m, which is negligible compared to the natural variation of groundwater level. In the fitting process, hydrogeological parameters, as important data, were repeatedly adjusted manually to meet the actual situation, and the spatial distribution of hydrogeological parameters was finally determined. The hydrogeological parameters determined after model verification are shown in Table 2. In addition, as shown in Table 3, the discharge term in the basin was basically equal to the recharge term, indicating that the water cycle of HRB is in a dynamic equilibrium state, further indicating that the generalization of the water resources cycle in the study area is valid. Groundwater recharge mainly occurs through meteoric precipitation and lateral recharge, and drainage occurs mainly through surface evaporation, overflow to surface water, lateral discharge of groundwater, and artificial exploitation. The final verification results show that the groundwater model of HRB meets the accuracy requirements, which can reflect the hydraulic characteristics of the groundwater system in the basin and can be used to predict the change of groundwater level in the basin after coal mining.
2.7. Mine Inflow
In order to ensure the safety of underground mining, groundwater in the upper aquifer of the coal seam and water inrush will be drained, which will significantly affect the groundwater flow field of the overlying aquifer and the natural circulation of groundwater resources in the region. Using the established numerical model of groundwater flow, the relationship between groundwater level and drainage in the mining area can be quantitatively described and predicted, and the possible impact can be analyzed. For the prediction, coal mine drainage should be preliminarily input to the model, while other hydrological data remain unchanged. After coal seam mining, the deformation and failure of the overlying strata would generate caved, fractured, and continuous deformation zones [6,56], which is the main reason for the change in the groundwater system. Considering that the study area has thick coal seams for mining, the combined thickness of caved and fractured zones corresponds to the major drained aquifers. Through the field investigation of the study area and surrounding coal mines, the water conductive fracture zone of the coal mine was found to develop only in the area above the working face, and the strata outside the mining face remained largely unaffected. Therefore, the effective thickness of the drainage layer is defined as the distance between the top boundary of the fractured zone with water flow and the bottom boundary of the coal seam. Considering the current situation of deep buried coal seams in HRB [45], with coal mining, the largest water-conducting layer would include only the Jurassic formation, and it would be separated from the Cretaceous bottom by a certain distance. The distance would be 100.87 m in the Yinpanhao (Yph) coal mine, 94.22 m in the Dahaize (Dhz) coal mine, and 110.9 m in the Balasu (Bls) coal mine. Pumping wells for simulating mine inflow were expanded to the drainage layer previously defined on the basis of the first mining area. According to the prediction report of the collected mine water inflows, the drainage water of the three coal mines was 13,549.8 m3/d (Yph), 35,520 m3/d (Dhz), and 37,000.8 m3/d (Bls), and the planned mining volume of the three coal mines was 15 Mt/a (Yph), 15 Mt/a (Dhz), and 10 Mt/a (Bls). The drainage water of Bls was equal to that of Dhz, and the drainage water of Yph was the smallest. The drainage water increased gradually from upstream to downstream, according to the location of the coal mines in the basin.
3. Results and Discussion
3.1. Relationship between Vegetation and Groundwater Depth
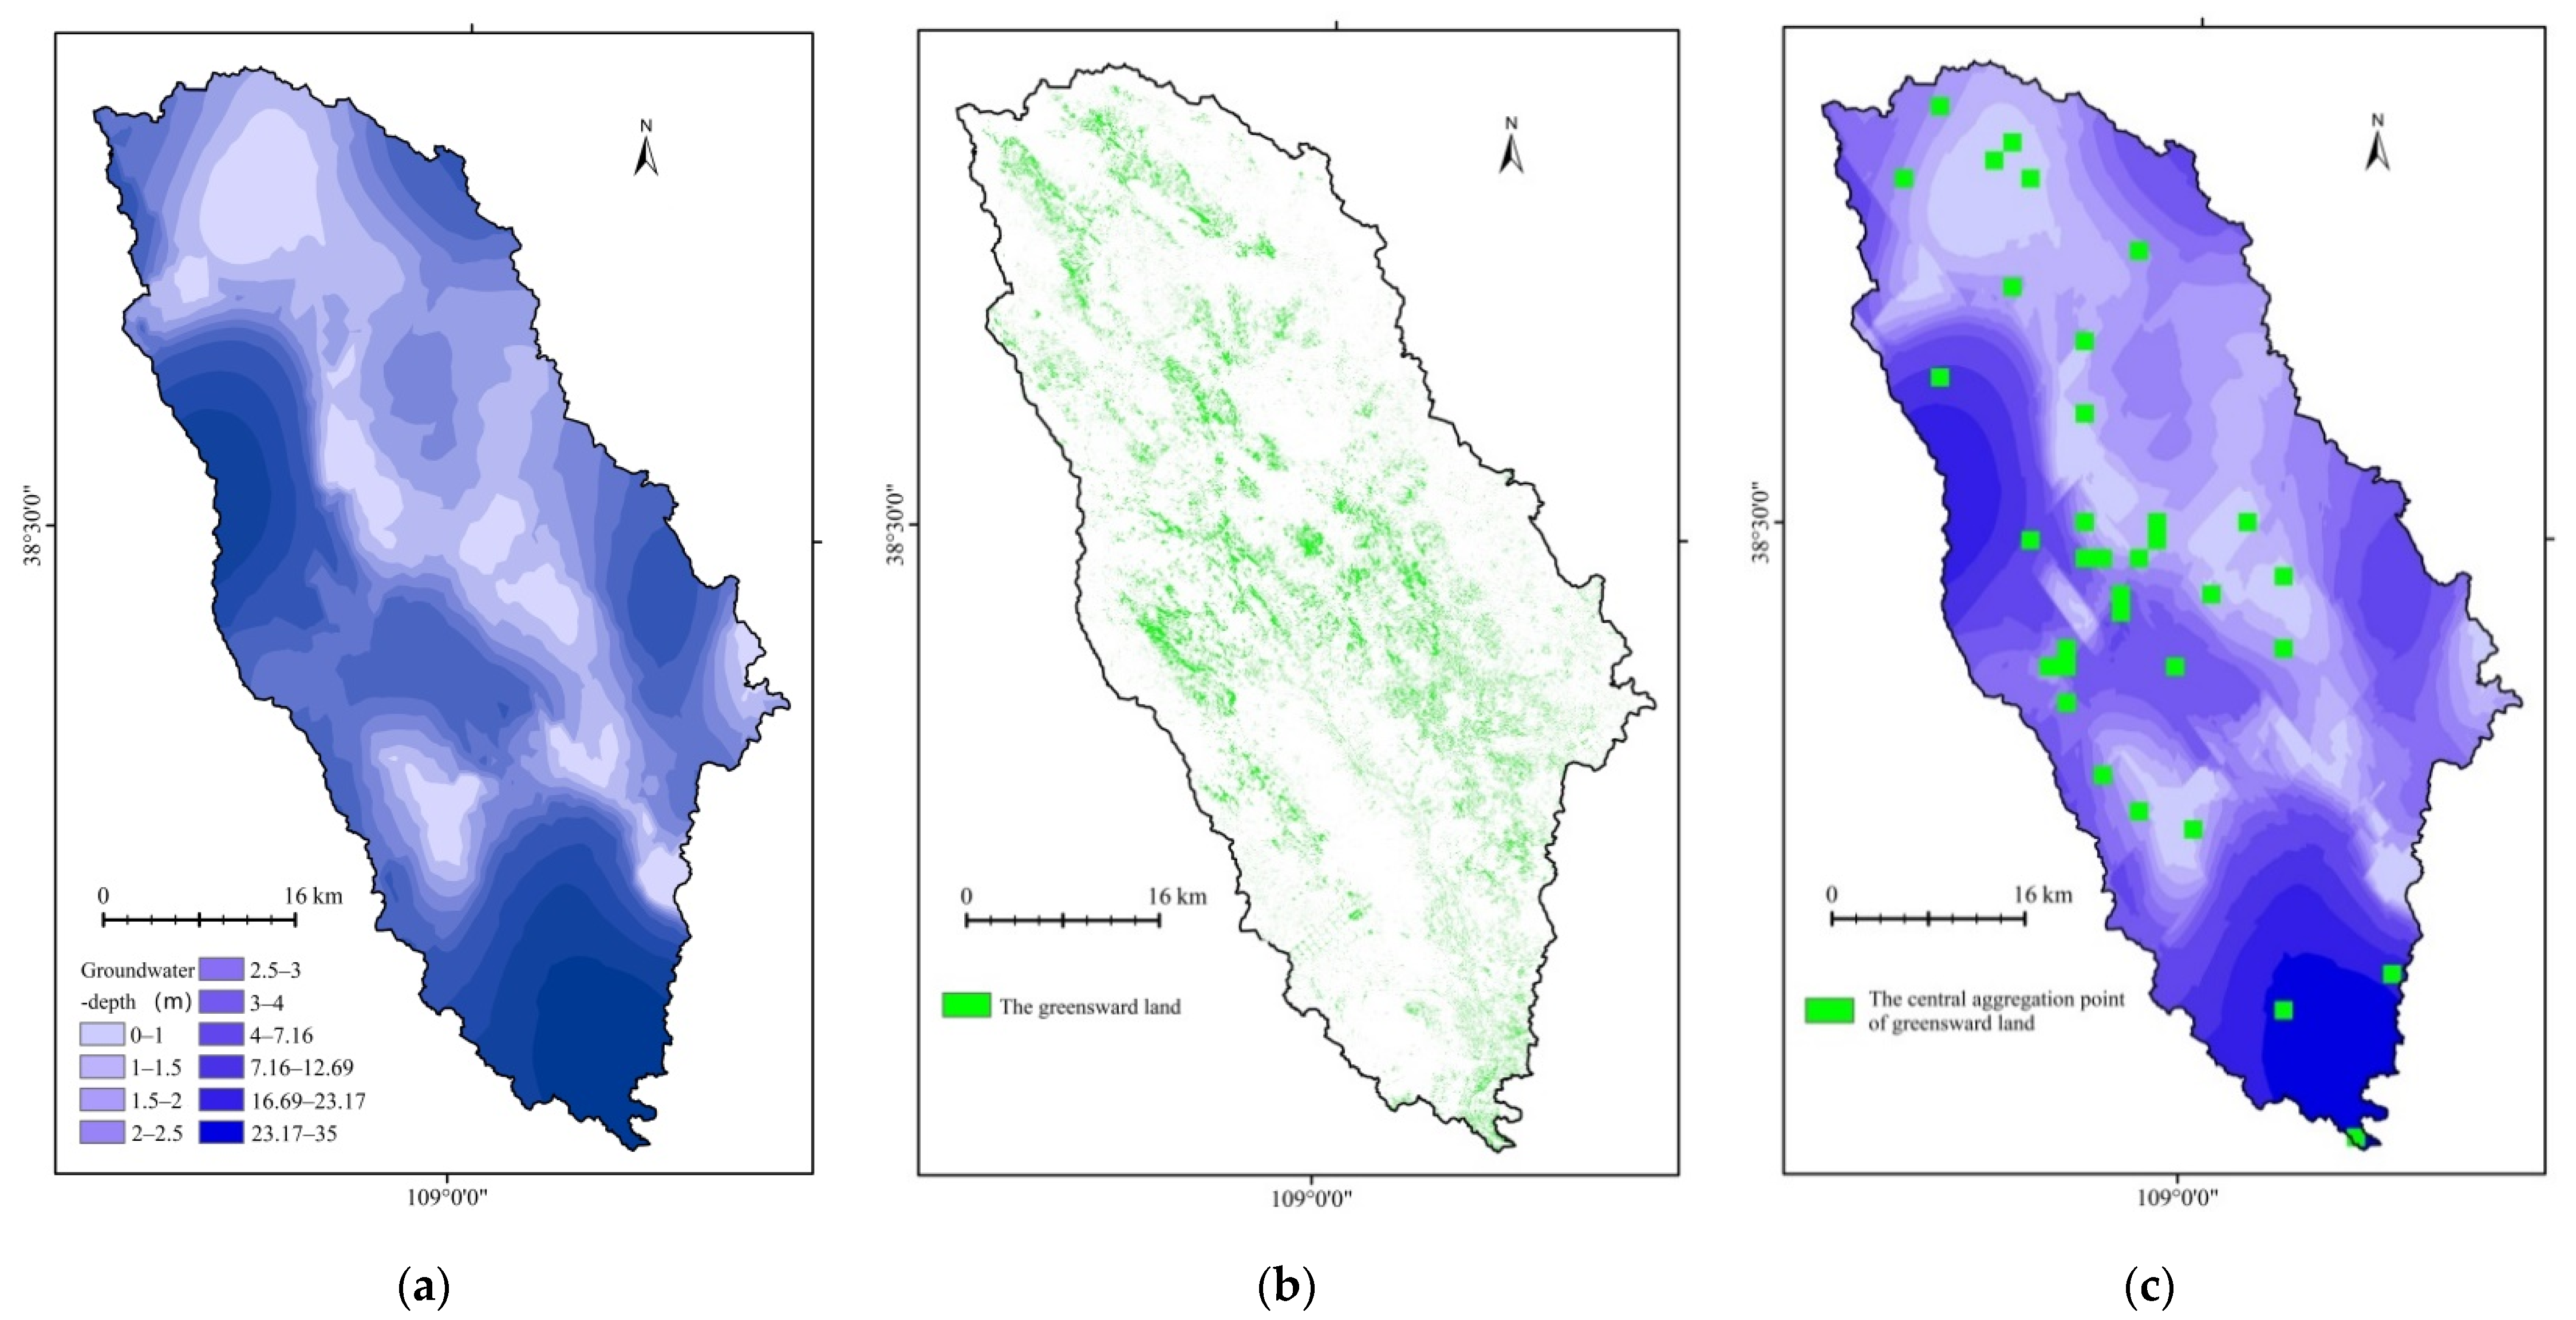
Compared with the use of only groundwater depth as the interpolation factor, Co-kriging interpolation provides results with smoother spatial distribution without any sudden point aggregation characteristics, which can better reflect the spatial distribution of groundwater [57]. Therefore, during the field survey of 100 wells (Figure 3) in October 2019, the groundwater depth of the basin (Figure 8a) was acquired by Co-kriging interpolation. The results show that groundwater depth exhibits wide spatial variability across the study area. Specifically, groundwater depth is relatively large in the south and northwest regions, mainly distributed in the loess ridge and high dunes. On the basin scale, areas with suitable groundwater depth for vegetation are mainly distributed in the upper and middle reaches. According to the results of the land use type distribution (Figure 8b), vegetation coverage is relatively high in the areas with suitable groundwater depth, concentrated in the middle and upper reaches of the basin. Comparing Figure 8a,b, it can be ascertained that the location of shallow groundwater depth coincides with the dominant greensward area, which exhibits central aggregation points. Accordingly, the frequency graph of each pixel was plotted cumulatively, and the value of central aggregation points was determined based on the following conditions: greensward land use type with a resolution of 1500 m and dominant greensward pixels over other land use classifications. The dependency of greensward land on groundwater depth was investigated by organizing pair data of greensward land and groundwater depth on the same base map (Figure 8c). The diagram of the final results reveals 34 central aggregation points of greensward land, of which 24% are distributed in areas with groundwater depth less than 3 m and 11.17% in areas with groundwater depth more than 10 m.
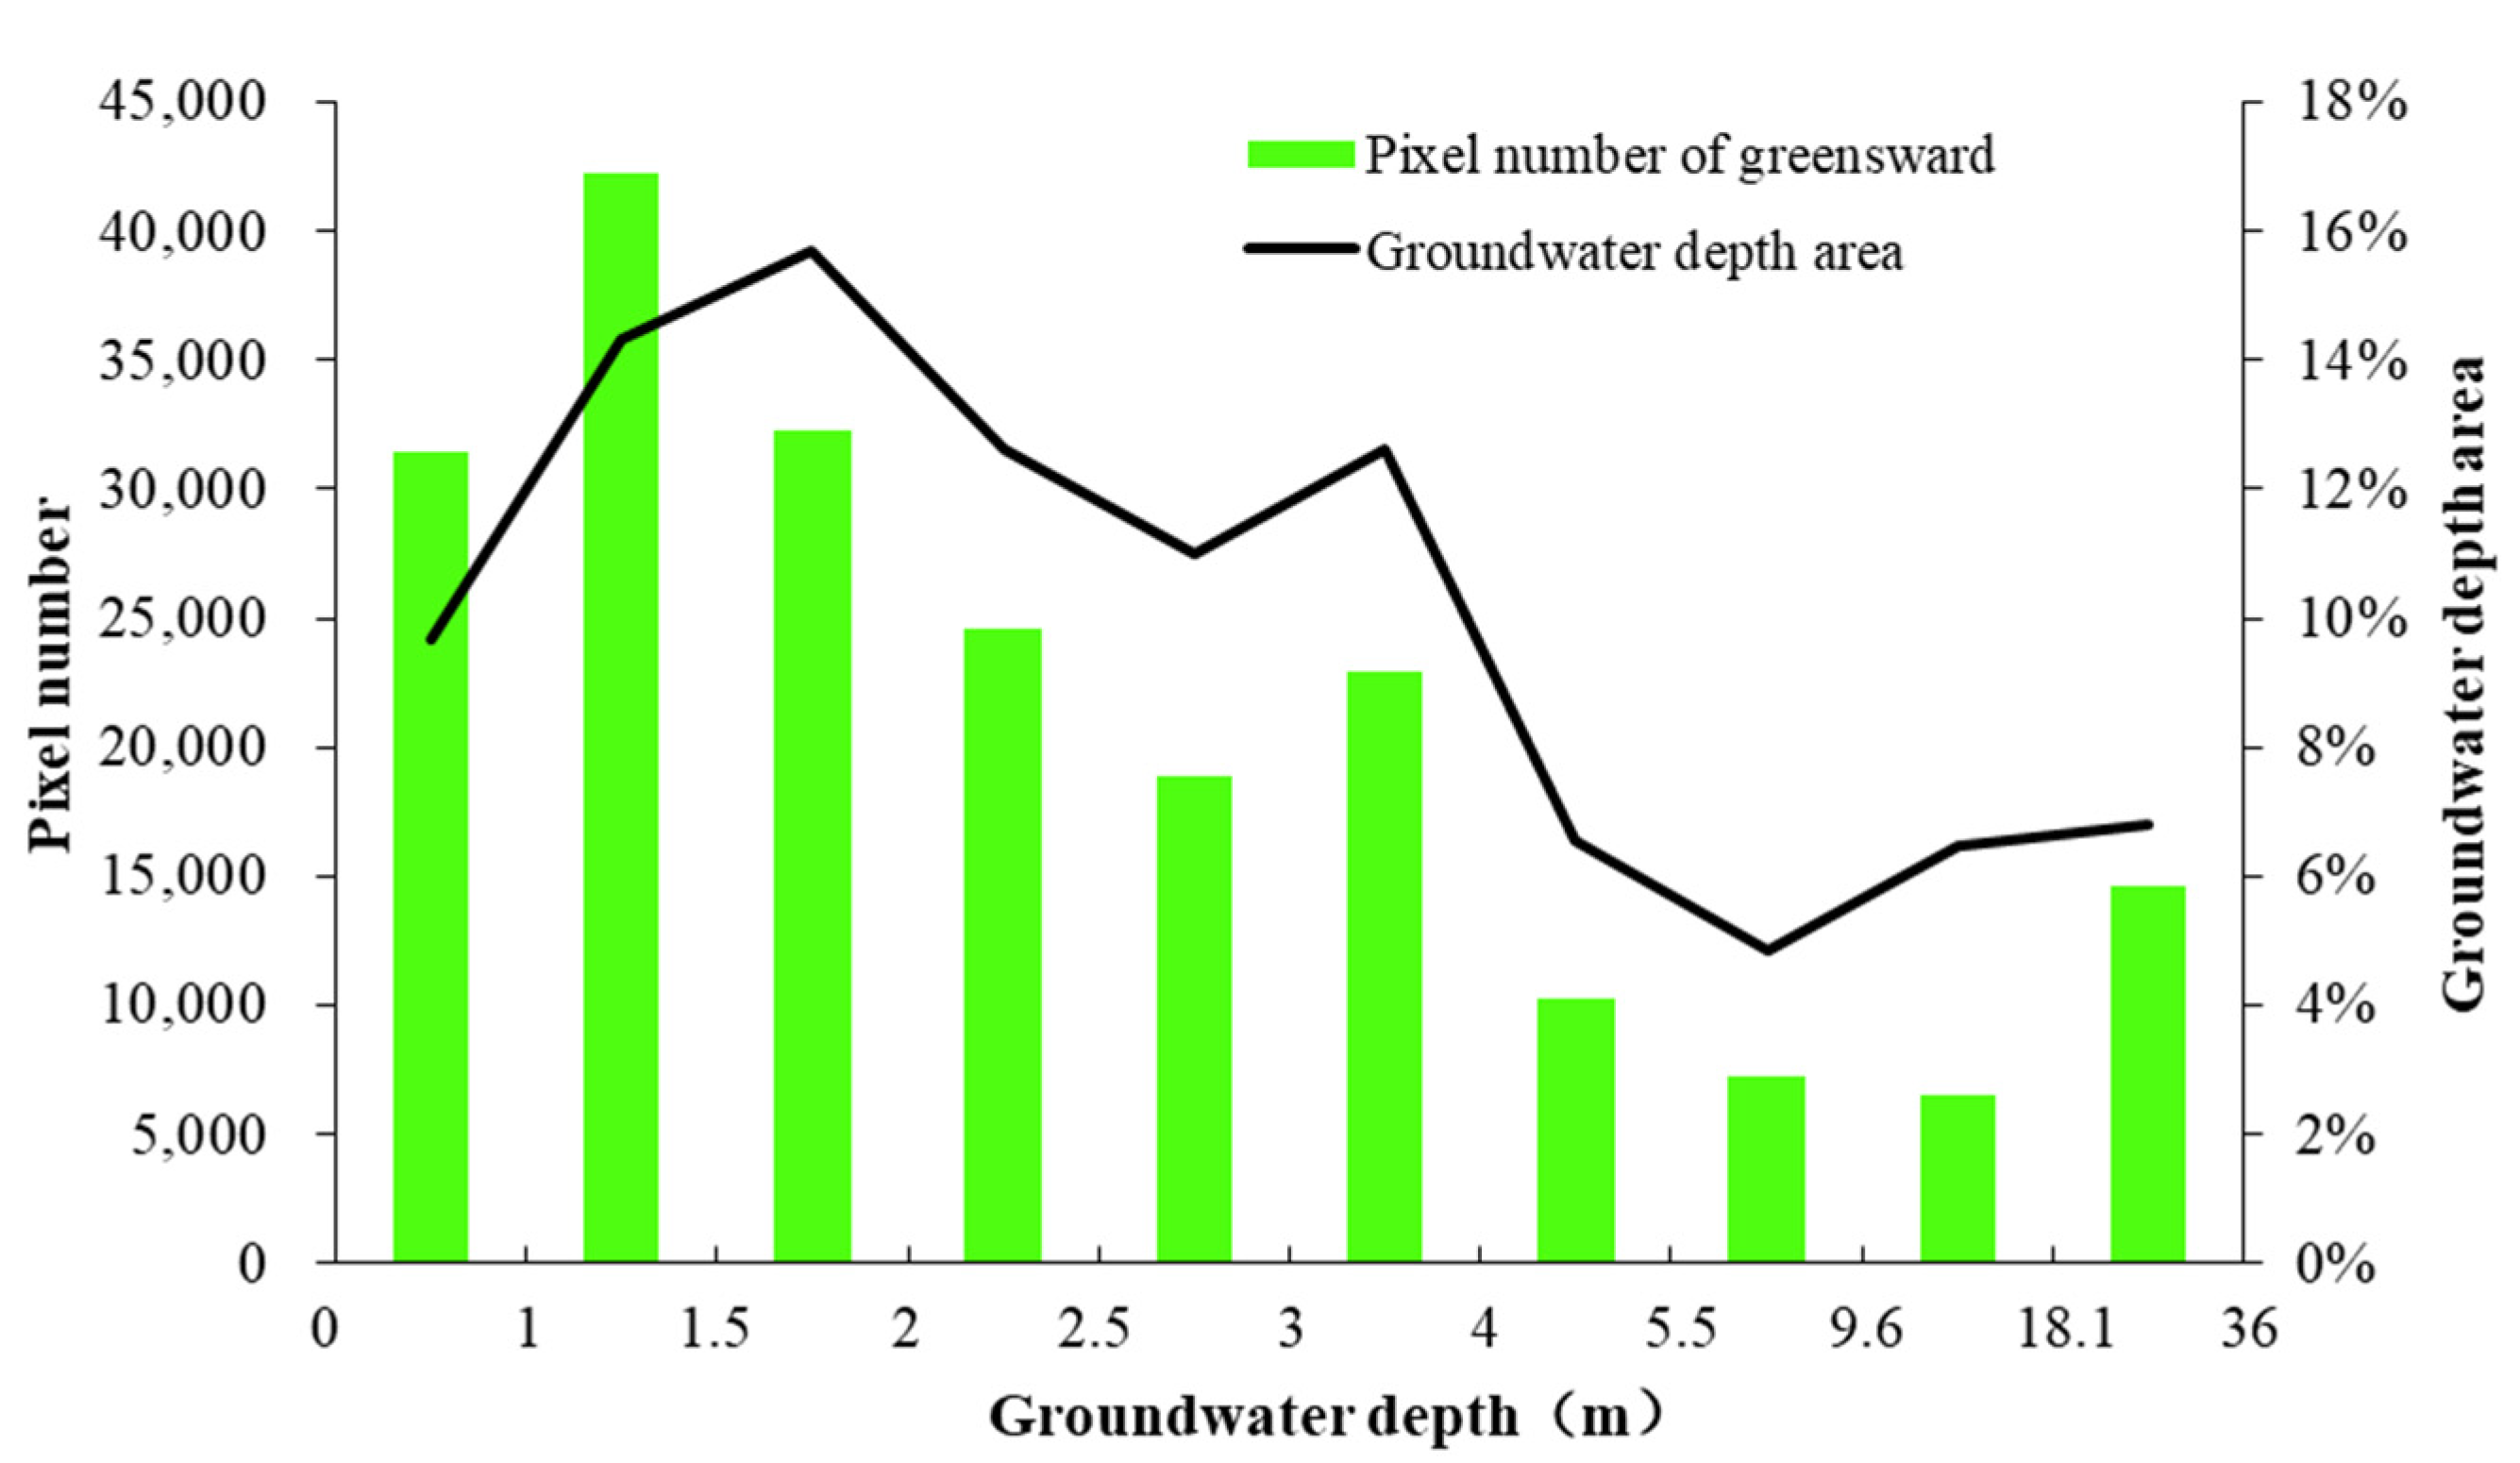
The dominant spatial pattern of the distribution of greensward land in HRB is presented in Figure 8b. Greensward land clearly occupies a relatively independent niche in space, which is related to groundwater depth, and indirectly reflects its different dependences on different groundwater depth conditions. The pixel number of greensward land was counted from LUCC data, and 82% of the greensward area was found to be distributed in areas with groundwater depth of 0–4 m (Figure 9). From the relationship between the distribution of groundwater depth and the number of greensward pixels, the groundwater depth of 4 m can be ascertained to be an important threshold. In aeolian sandy soil, grass can grow normally only when the deep roots of grass have access to groundwater. If the groundwater depth exceeds the root depth, the survivability of grass significantly declines. For example, greensward land is unlikely to develop in sand dunes because the groundwater level exceeds 8 m. The results suggest that grass growth is seriously limited in areas where the groundwater depth exceeds 4 m. It is noteworthy that groundwater irrigation also determines the coverage of green space. Figure 8c also confirms this, but this aspect is not the focus of our study.
The relationship between groundwater and ecological vegetation has always been an important issue for research [58,59]. In particular, the relationship between vegetation and groundwater is very complex in arid and semi-arid areas, where plant roots have a strong response to changes in groundwater [60]. It is not sufficient to discuss the relationship between vegetation and groundwater depth by taking only a specific area of HRB as an example. To comprehensively present the characteristics of vegetation coverage in arid and semi-arid regions suitable for groundwater burial depth, we compared studies on vegetation and groundwater in similar regions to confirm the credibility of our conclusions [61,62,63,64,65,66]. As shown in Table 4, some arid and semi-arid regions around the world have a limited range of groundwater levels for the healthy growth of vegetation. If the minimum threshold of groundwater required for vegetation growth is exceeded, the growth of vegetation will be affected. Attributable to the difference in hydrogeology, different study areas exhibit distinct differences in the threshold. Nevertheless, comparing the conclusions of previous studies, the threshold of groundwater burial depth for the normal growth of herbs was found to be approximately 2–5 m, which is essentially the same as the results obtained in this study. This can be explained by the limited root systems of herbs.
3.2. Groundwater Level Prediction
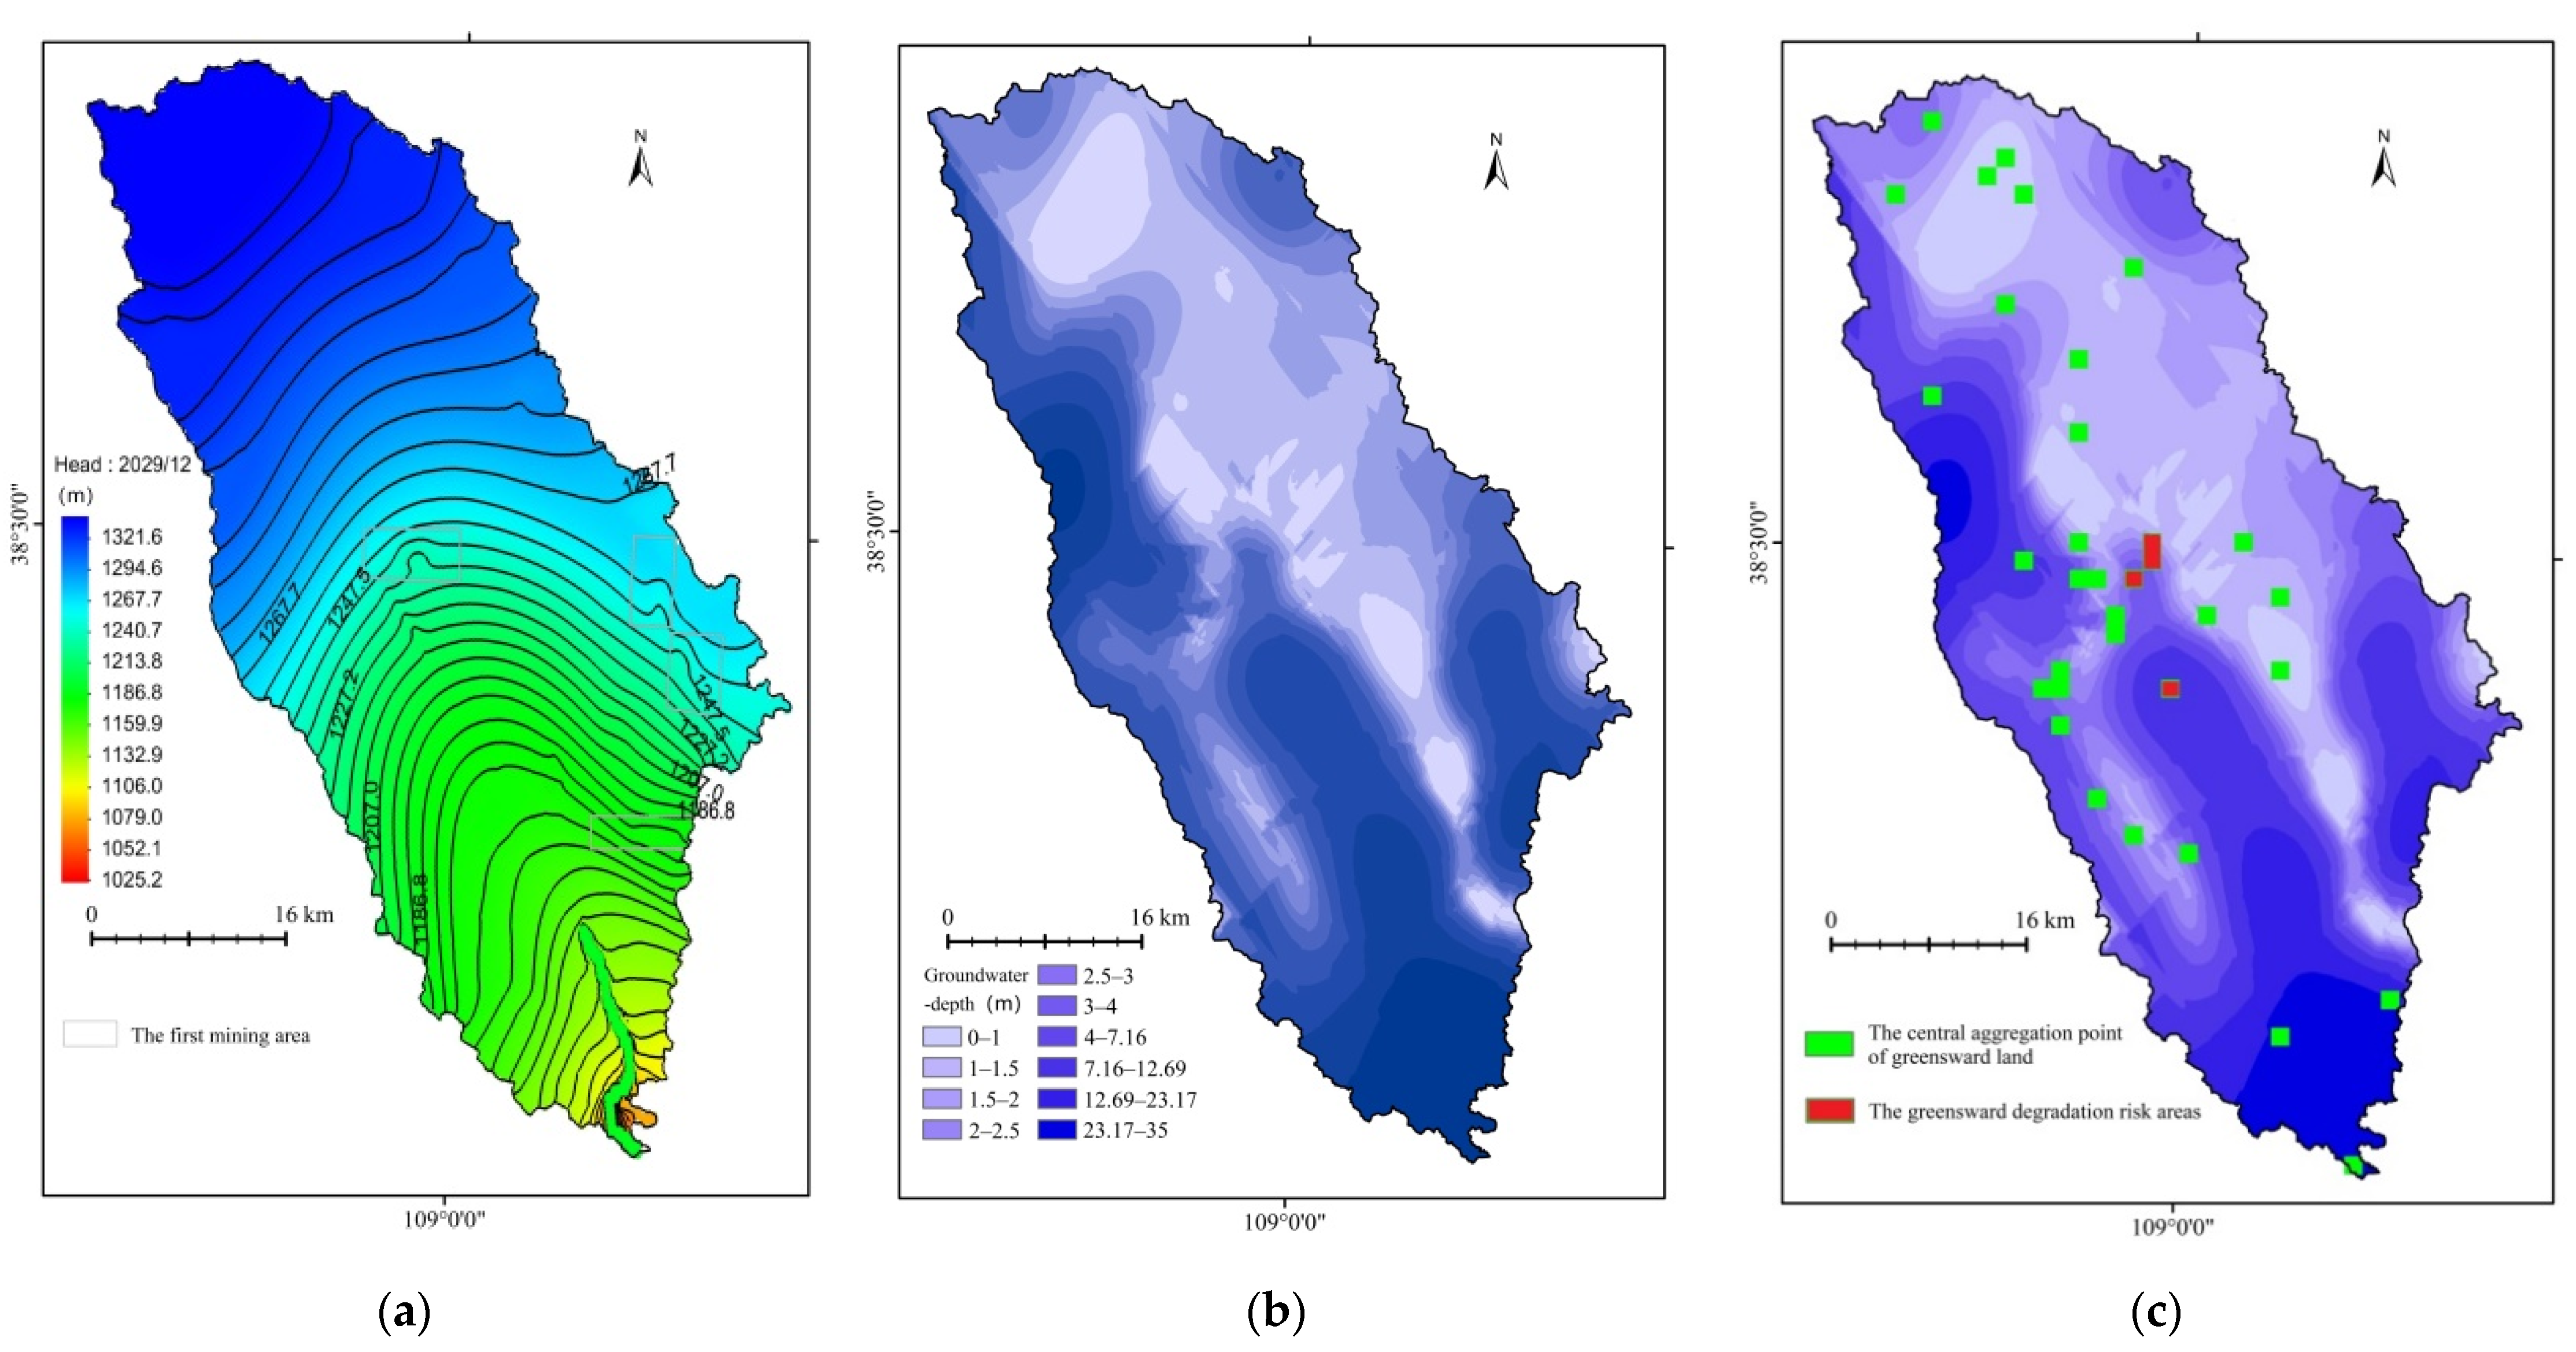
According to the groundwater model established after verification, aquifer drainage caused by coal seam mining was separated, and mine gushing water was set as the output of the model. Finally, the model was used to predict future changes in groundwater induced by coal mining. In the model, wells were used to simulate mine water inflow. A simulation was performed for each grid of the first mining area, and the inflow was then interpolated within the effective mining drainage layer of the Jurassic strata. The value of total mine water inflow of the grids should be close to the value of the previously mentioned prediction report. Therefore, to ensure accurate simulation results, all pumping wells were set in the mesh grids. These wells, representing mine water inflow, were negative and were evenly distributed in the first mining area of Yph, Dhz, and Bls. In the model, the first mining area of the three coal mines was assumed to satisfy the designed production volume in the future. By running the model, the groundwater flow field of the aquifers in the next 10 years (2020–2029) could be predicted. Figure 10a shows the simulated flow of the phreatic aquifer in December 2029.
The change of the flow field curve represents the influence of coal mine drainage. Therefore, the flow field curve of the phreatic aquifer above the first mining area of the coal mine is different from that of other areas of the basin. It can be observed that the maximum drawdown may be as high as 5 m (Yph), 6 m (Dhz), and 10 m (Bls), indicating three cones of depression centered on the three mines. The cone of depression exerts a distinct influence in Yph, but the change of flow field in Dhz and Bls coal mines is more complicated because of the influence of groundwater watershed on the hydraulic gradient. Overall, mining activities affected groundwater in phreatic aquifers within a certain range [2]. The size of groundwater depression is closely related not only to the amount of drainage by the coal mine but also to the geographical location of coal mines in the basin. An obvious drop of groundwater levels could be observed for floor leakages in the first mining area of the three coal mines (Figure 10b), and the groundwater depth shows no significant change in the upstream of HRB because it is located far away from coal mining sites. It is essentially certain that, as coal mining continues, groundwater depression will continue to expand, thereby affecting the hydrological cycle of the basin.
3.3. Vegetation Change Prediction
Given the single vegetation structure and sensitive environment of the study area, the ecological function of the vegetation community is susceptible to interference from climate change and human activities, which may even completely destroy the original vegetation cover [21]. Because HRB is the recharge source area of the Wuding River Basin, and precipitation is the main source of groundwater recharge in the basin, groundwater resources are important ecological factors. The greensward land in the basin is mainly supported by groundwater. Therefore, groundwater depth is the decisive factor controlling the distribution of greensward land. Grass coverage and occurrence frequency are related to groundwater depth. With the increase in groundwater depth, the coverage, density, and population richness of grass decrease. The growth and development of grass is higher in areas with suitable groundwater depth, with higher frequency and coverage. On the contrary, in water deficit areas, the growth and development of grass are relatively poor, with low occurrence frequency and corresponding coverage. The most suitable groundwater level for grass growth in HRB is 0–4 m, and this groundwater depth range is also the key guarantee to maintaining the sustainable development of the ecosystem in arid and semi-arid greensward areas [67,68]. If the groundwater level continues to decline below 4 m, the growth and development of greensward vegetation in pastoral areas will be limited, and the number of biological populations will gradually decrease. As the groundwater depth continues to drop below 7 m, arid greensward areas will undoubtedly undergo irreversible desertification. Therefore, the upper limit for the stable survival of the existing greensward vegetation can be determined to be 0 m and the lower limit to be 4 m.
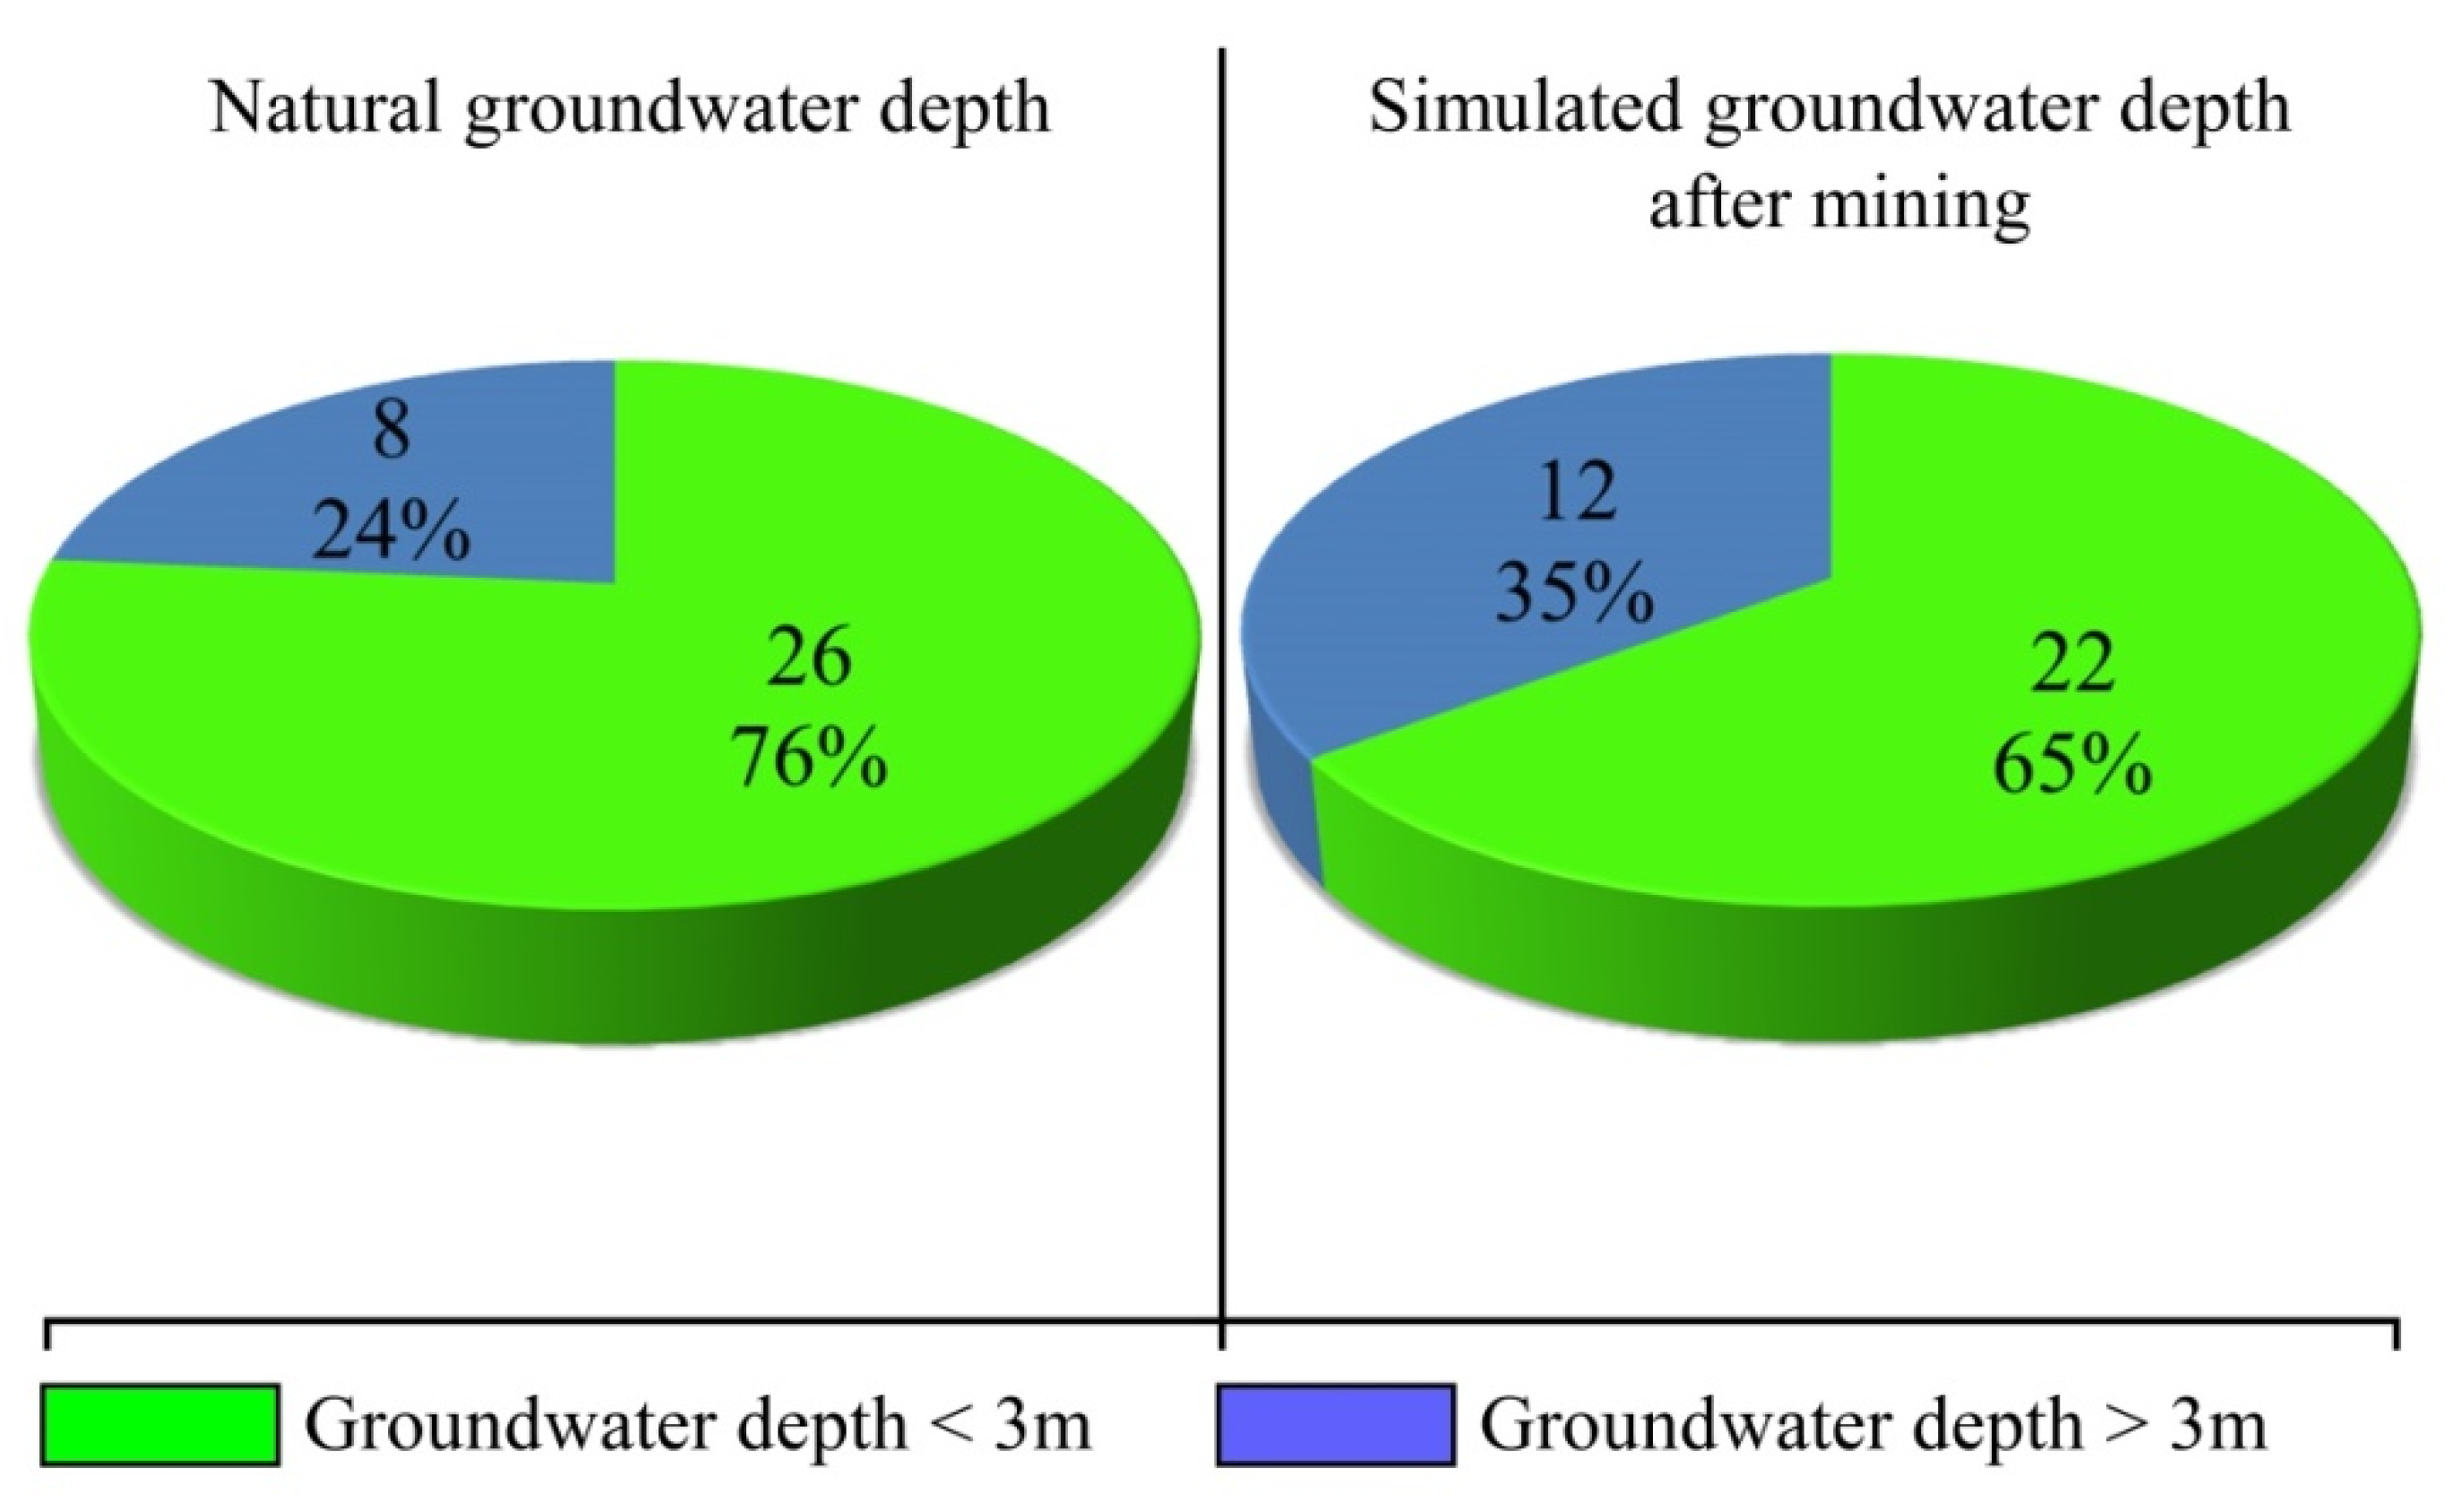
Using MODFLOW to predict the groundwater flow field in the basin after 10 years, we obtained the groundwater depth of the future basin, and central aggregation points of greensward land over the spatial distribution of groundwater depth were determined (Figure 10c). Compared with Figure 8b, the groundwater level in the first mining area of Yph decreased significantly, and the groundwater depth increased. The change of the flow field above the first mining area causes the increase in groundwater depth near the river, and this area is the central aggregation point of greensward land in the basin. The increase in groundwater depth will seriously affect the normal growth of grass vegetation. Therefore, these regions require serious attention. As mentioned earlier, the groundwater depth of 4 m is an important threshold. However, in order to take necessary measures before reaching the warning line, attention should be paid to affected areas when the groundwater depth drops below 3 m. Accordingly, the central aggregation point of greensward land in this region is marked as red to alert the government and local population of the degradation risk. By red tagging, four greensward degradation risk areas were found to be concentrated in the area and surroundings of Yph in the midstream of the basin. As clearly shown in Figure 11, the predicted groundwater depth in this area after coal mining exceeds 3 m, increasing the proportion central aggregation points with groundwater depth greater than 3 m to 35%. Although the greensward coverage near Dhz and Bls is small, and there is no major central aggregation point of the greensward land, attention should also be paid to the impact of groundwater level decline on ecological vegetation diversity. Finally, the prediction of groundwater and grassland coverage under multi-mining conditions shows that the overall ecological prospect of the basin is negative without the protection of the ecological environment. From the final research results, the change of groundwater in the next 10 years will affect only the growth of vegetation within a certain range. However, the influence of groundwater depth change caused by coal mining on natural vegetation should be carefully examined at the watershed scale.
Although vegetation can adapt to changes in the environment, some vegetation types [69] require a certain amount of groundwater to maintain normal growth. With changes in groundwater, groundwater-sensitive plants may completely disappear from the corresponding area. Although the environmental crisis caused by coal mining is globally widespread [70], the coal industry is particularly important for regional economic development and national energy security in developing regions. Unless a breakthrough is achieved in the technology of renewable energy, and renewable energy is made affordable, coal mines will continue to operate, which will lead to the deterioration of the ecological environment after the drainage of groundwater [71]. Indeed, the best solution is to prevent mining and stop the destruction, but this solution is not feasible for developing countries and poor countries. We believe that coal mining activities in developed countries should be gradually discontinued, and clean energy measures should be increasingly implemented, such as in Germany [72]. For developing countries, the mining of coal resources should be limited by environmental protection. Under the condition of maintaining environmental sustainability, underground resources should be gradually exploited, and part of the profits from coal mining should be used for the management of hazards caused by coal mining, such as in China [73]. The contradiction between coal mining and environmental protection requires the preliminary intervention of government departments, for which the prediction of potential environmental changes caused by coal mining and subsequent active formulation of environmental protection policies are necessary.
4. Conclusions
In this study, variations in the flow field of phreatic groundwater caused by the joint action of multiple coal mines in a basin were explored, and the groundwater flow field in the basin in the next few years was predicted. The results show that the MODFLOW model exhibits good performance in simulating the variation law of the groundwater flow field. The law of groundwater movement in the natural state of the basin was first determined by simulating groundwater movement in the basin under non-mining conditions, and the model as well as the accuracy of the completed system were verified. The drainage attributable to underground coal mining was input to the established MODFLOW model, and potential changes in groundwater depth throughout the basin were simulated. Through the correlation between groundwater depth and distribution of greensward land obtained by remote-sensing interpretation, the influence of mining on the future distribution of greensward land was predicted. The following conclusions can be drawn:
- The topographical features of HRB comprise arid and semi-arid dunes and denuded loess ridges. The distribution of greensward land is closely related to aquifer thickness and groundwater depth. Greensward land is mainly distributed in the upstream and midstream of the basin, especially in areas with shallow groundwater depth and thicker aquifers. The sporadic distribution of greensward land in some areas is related to artificial pumping irrigation. There are 34 central aggregation points of greensward land in HRB. Among them, 24% is distributed in areas with groundwater depth less than 3 m and only 8.82% in areas with groundwater depth more than 10 m. Furthermore, grassland accounts for only 11.11% of the total area in the downstream of the basin. The relationship between groundwater depth and central aggregation points of greensward land in the basin contributes to deeper understanding of the distribution of vulnerable vegetation in the Mu Us Sandy Land.
- The combined action of multiple underground mines has a strong impact on the phreatic aquifer system in the basin, and coal mine drainage changes the flow field and increases the depth of groundwater. The MODFLOW simulation of the groundwater aquifer flow field in 2020–2029 suggests that coal mining will have distinct effects on the groundwater aquifer above the first mining area. However, variations in the groundwater hydraulic gradient induced by coal mining would not be prominent in the next 10 years compared with the hydraulic gradient caused by differences in terrain. The groundwater model reveals three cones of groundwater depression centered on three mines, and the maximum drawdown may be as high as 5 m (Yph), 6 m (Dhz), and 10 m (Bls).
- According to the prediction of changes in groundwater depth induced by the combined mining of multiple underground mines in HRB, the groundwater level will prominently decrease around Yph, posing degradation risks to four central aggregation points of greensward land in the basin. It is necessary to implement timely measures to counter the changes. Although the coverage of greensward land is small in the first mining area of Dhz and Bls, the depth of groundwater decline is greater than that of Yph, and its impact on plant growth is more serious. This simulation approach provides a reference for the prediction of the distribution of vegetation with changes in groundwater depth.
Author Contributions
Shenghui Zhou developed the initial and final versions of this manuscript and analyzed the data. Tingxi Liu and Limin Duan contributed their expertise and insights, overseeing all of the analysis and supporting the writing of the final manuscript. All authors have read and agreed to the published version of the manuscript.
Funding
This research was funded by the National Key R&D Program of China (No. 2018YFC0406400), the National Natural Science Foundation of China (Nos. 51939006 and 51620105003), the Inner Mongolia Major science and technology projects (Nos. 2020ZD0009 and 2019ZD007), the Inner Mongolia Science and Technology Plan Project (Nos. 2020 and 2021GG0071), the Ministry of Education Innovative Research Team (No. IRT_17R60), the Innovation Team in Priority Areas Accredited by the Ministry of Science and Technology (No. 2015RA4013), the Natural Science Foundation of Inner Mongolia Autonomous Region of China (No. 2020JQ06).
Institutional Review Board Statement
Not applicable.
Informed Consent Statement
Informed consent was obtained from all subjects involved in the study.
Data Availability Statement
Please contact corresponding author.
Conflicts of Interest
The authors declare no conflict of interest.
References
- Bai, X.; Ding, H.; Lian, J.; Ma, D.; Yang, X.; Sun, N.; Xue, W.; Chang, Y. Coal production in China: Past, present, and future projections. Int. Geol. Rev. 2018, 60, 535–547. [Google Scholar] [CrossRef]
- Qu, S.; Shi, Z.; Wang, G.; Han, J. Application of multiple approaches to investigate hydraulic connection in multiple aquifers system in coalfield. J. Hydrol. 2021, 595, 125673. [Google Scholar] [CrossRef]
- Tao, M.; Cheng, W.; Nie, K.; Zhang, X.; Cao, W. Life cycle assessment of underground coal mining in China. Sci. Total Environ. 2022, 805, 150231. [Google Scholar] [CrossRef] [PubMed]
- Tao, S.; Fang, J.; Zhao, X.; Zhao, S.; Shen, H.; Hu, H.; Tang, Z.; Wang, Z.; Guo, Q. Rapid loss of lakes on the Mongolian Plateau. Proc. Natl. Acad. Sci. USA 2015, 112, 2281–2286. [Google Scholar] [CrossRef] [Green Version]
- Xiao, W.; Lv, X.; Zhao, Y.; Sun, H.; Li, J. Ecological resilience assessment of an arid coal mining area using index of entropy and linear weighted analysis: A case study of Shendong Coalfield, China. Ecol. Indic. 2020, 109, 105843. [Google Scholar] [CrossRef]
- Zhang, J.; Shen, B. Coal mining under aquifers in China: A case study. Int. J. Rock Mech. Min. 2004, 41, 629–639. [Google Scholar] [CrossRef]
- Chen, W.; Li, H.; Wu, Z. Western China energy development and west to east energy transfer: Application of the Western China Sustainable Energy Development Model. Energy Policy 2010, 38, 7106–7120. [Google Scholar] [CrossRef]
- Li, N.; Yan, C.; Xie, J. Remote sensing monitoring recent rapid increase of coal mining activity of an important energy base in northern China, a case study of Mu Us Sandy Land. Resour. Conserv. Recycl. 2015, 94, 129–135. [Google Scholar] [CrossRef]
- Jin, J.; Yan, C.; Tang, Y.; Yin, Y. Mine Geological Environment Monitoring and Risk Assessment in Arid and Semiarid Areas. Complexity 2021, 2021, 3896130. [Google Scholar] [CrossRef]
- Cao, D.; Zhan, W.; Li, H.; Li, X.; Liu, D.; Wei, Y. Tectonic setting and risk zoning of dynamic geologicl disasters in coal mines in China. J. China Coal Soc. 2020, 45, 2376–2388. (In Chinese) [Google Scholar]
- Wu, C.; Wu, X.; Zhu, G.; Qian, C. Predicting mine water inflow and groundwater levels for coal mining operations in the Pangpangta coalfield, China. Environ. Earth Sci. 2019, 78, 130. [Google Scholar] [CrossRef]
- Yu, S.; Xu, J.; Zhu, W.; Wang, S.; Liu, W. Development of a combined mining technique to protect the underground workspace above confined aquifer from water inrush disaster. Bull. Eng. Geol. Environ. 2020, 79, 3649–3666. [Google Scholar] [CrossRef]
- Gonzalez-Quiros, A.; Fernández-Álvarez, J.P. Conceptualization and finite element groundwater flow modeling of a flooded underground mine reservoir in the Asturian Coal Basin, Spain. J. Hydrol. 2019, 578, 124036. [Google Scholar] [CrossRef]
- Wu, Q.; Wang, M. Characterization of water bursting and discharge into underground mines with multilayered groundwater flow systems in the North China coal basin. Hydrogeol. J. 2006, 14, 882–893. [Google Scholar] [CrossRef]
- Fang, Z.; Kong, X.; Sensoy, A.; Cui, X.; Cheng, F. Government’s awareness of environmental protection and corporate green innovation: A natural experiment from the new environmental protection law in china. Econ. Anal. Policy. 2021, 70, 294–312. [Google Scholar] [CrossRef]
- Xiao, W.; Zhang, W.; Ye, Y.; Lv, X.; Yang, W. Is underground coal mining causing land degradation and significantly damaging ecosystems in semi-arid areas? A study from an Ecological Capital perspective. Land. Degrad. Dev. 2020, 31, 1969–1989. [Google Scholar] [CrossRef]
- Chen, D.; Feng, Q.; Liang, H.; Gao, B.; Alam, E. Distribution characteristics and ecological risk assessment of polycyclic aromatic hydrocarbons (PAHs) in underground coal mining environment of Xuzhou. Hum. Ecol. Risk. Assess. 2019, 25, 1564–1578. [Google Scholar] [CrossRef]
- Quaranta, J.D.; Mack, B.; Van Aken, B.; Ducatman, A.; Ziemkiewicz, P. Practical application of dilution analysis for estimating groundwater quality effects due to coal slurry injection into underground mine voids. Mine Water Environ. 2014, 33, 353–361. [Google Scholar] [CrossRef]
- Shen, Z.; Zhang, Q.; Chen, D.; Singh, V.P. Varying effects of mining development on ecological conditions and groundwater storage in dry region in Inner Mongolia of China. J. Hydrol. 2021, 597, 125759. [Google Scholar] [CrossRef]
- Xie, P.; Li, W.; Yang, D.; Jiao, J. Hydrogeological model for groundwater prediction in the Shennan mining area, China. Mine Water Environ. 2018, 37, 505–517. [Google Scholar] [CrossRef]
- Zhang, H.; Wang, X.-S. The impact of groundwater depth on the spatial variance of vegetation index in the Ordos Plateau, China: A semivariogram analysis. J. Hydrol. 2020, 588, 125096. [Google Scholar] [CrossRef]
- Zhang, H.; Shen, L.; Zhong, S.; Elshkaki, A. Economic structure transformation and low-carbon development in energy-rich cities: The case of the contiguous area of shanxi and shaanxi provinces, and inner Mongolia Autonomous Region of China. Sustainability 2020, 12, 1875. [Google Scholar] [CrossRef] [Green Version]
- Wang, X.; Chen, F.H.; Dong, Z.; Xia, D. Evolution of the southern Mu Us Desert in North China over the past 50 years: An analysis using proxies of human activity and climate parameters. Land. Degrad. Dev. 2005, 16, 351–366. [Google Scholar] [CrossRef]
- Zhang, D.; Deng, H. Historical human activities accelerated climate-driven desertification in China’s Mu Us Desert. Sci. Total Environ. 2020, 708, 134771. [Google Scholar] [CrossRef] [PubMed]
- Orellana, F.; Verma, P.; Loheide, S.P.; Daly, E. Monitoring and modeling water-vegetation interactions in groundwater-dependent ecosystems. Rev. Geophys. 2012, 50, RG3003. [Google Scholar] [CrossRef]
- Jin, X.; Guo, R.; Zhang, Q.; Zhou, Y.; Zhang, D.; Yang, Z. Response of vegetation pattern to different landform and water-table depth in Hailiutu River basin, Northwestern China. Environ. Earth Sci. 2014, 71, 4889–4898. [Google Scholar] [CrossRef]
- Lv, J.; Wang, X.S.; Zhou, Y.; Qian, K.; Wan, L.; Eamus, D.; Tao, Z. Groundwater-dependent distribution of vegetation in Hailiutu River catchment, a semi-arid region in China. Ecohydrology 2013, 6, 142–149. [Google Scholar] [CrossRef]
- Mata-González, R.; Averett, J.P.; Abdallah, M.A.; Martin, D.W. Variations in Groundwater Level and Microtopography Influence Desert Plant Communities in Shallow Aquifer Areas. Environ. Manag. 2022, 69, 45–60. [Google Scholar] [CrossRef]
- Shao, G.; Zhang, D.; Guan, Y.; Xie, Y.; Huang, F. Application of SWAT model with a modified groundwater module to the semi-arid Hailiutu River Catchment, Northwest China. Sustainability 2019, 11, 2031. [Google Scholar] [CrossRef] [Green Version]
- Xue, S.; Liu, Y.; Liu, S.; Li, W.; Wu, Y.; Pei, Y. Numerical simulation for groundwater distribution after mining in Zhuanlongwan mining area based on visual MODFLOW. Environ. Earth Sci. 2018, 77, 400. [Google Scholar] [CrossRef]
- Wu, Q.; Liu, Y.; Zhou, W.; Li, B.; Zhao, B.; Liu, S.; Sun, W.; Zeng, Y. Evaluation of water inrush vulnerability from aquifers overlying coal seams in the Menkeqing coal mine, China. Mine Water Environ. 2015, 34, 258–269. [Google Scholar] [CrossRef]
- Light, D.D.; Donovan, J.J. Mine-water flow between contiguous flooded underground coal mines with hydraulically compromised barriers. Environ. Eng. Geosci. 2015, 21, 147–164. [Google Scholar] [CrossRef]
- Mu, W.; Wu, Q.; Xing, Y.; Qian, C.; Wang, Y.; Du, Y. Using numerical simulation for the prediction of mine dewatering from a karst water system underlying the coal seam in the Yuxian Basin, Northern China. Environ. Earth Sci. 2018, 77, 215. [Google Scholar] [CrossRef]
- Pande, C.B.; Moharir, K.N.; Singh, S.K.; Elbeltagi, A.; Pham, Q.B.; Panneerselvam, B.; Varade, A.M.; Kouadri, S. Groundwater flow modeling in the basaltic hard rock area of Maharashtra, India. Appl. Water Sci. 2022, 12, 1–14. [Google Scholar] [CrossRef]
- Yue, L.; Li, J.; Zheng, G.; Li, Z. Evolution of the Ordos Plateau and environmental effects. Sci. China Ser. D: Earth Sci. 2007, 50, 19–26. [Google Scholar] [CrossRef]
- Yang, Z.; Zhou, Y.; Wenninger, J.; Uhlenbrook, S.; Wang, X.; Wan, L. Groundwater and surface-water interactions and impacts of human activities in the Hailiutu catchment, northwest China. Hydrogeol. J. 2017, 25, 1341–1355. [Google Scholar] [CrossRef]
- Jing, T.; Fang, N.; Zeng, Y.; Huang, X.; Shi, Z. Catchment properties controlling suspended sediment transport in wind-water erosion crisscross region. J. Hydrol. Reg. Stud. 2022, 39, 100980. [Google Scholar] [CrossRef]
- Zhou, S.; Liu, T.; Duan, L.; Zhang, W.; Ji, R.; Sun, L. Simulation and Prediction of Precipitation in the Hailiutu River Basin Based on Time Series. Res. Soil Water Conserv. 2021, 28, 88–94. (In Chinese) [Google Scholar]
- Qu, S.; Wang, G.; Shi, Z.; Zhou, P.; Xu, Q.; Zhu, Z. Temporal changes of hydraulic properties of overburden aquifer induced by longwall mining in Ningtiaota coalfield, northwest China. J. Hydrol. 2020, 582, 124525. [Google Scholar] [CrossRef]
- Russell, J.; Goodman, P.; Cai, F. From dust to dust: Quaternary wind erosion of the Mu Us Desert and Loess Plateau, China. Geology 2015, 43, 835–838. [Google Scholar]
- Kapp, P.; Pullen, A.; Pelletier, J.D.; Jin, R.; Teng, X.; Li, X.; Si, Q.; Wang, W. Genesis of sandstone-type uranium deposits along the northern margin of the Ordos Basin, China. Geosci. Front. 2020, 11, 215–227. [Google Scholar]
- Fang, G.; Liu, Y.; Liang, X.; Huang, H. Hydrogeological characteristics and mechanism of a water-rich coal seam in the Jurassic coalfield, northern Shaanxi Province, China. Arab. J. Geosci. 2020, 13, 1088. [Google Scholar] [CrossRef]
- Zhang, W. The early Ordovician Majiagou reservoir of the Jingbian Field, northwest China: Karstic peritidal dolomite. Carbonates Evaporites 2004, 19, 93–106. [Google Scholar] [CrossRef]
- Yang, J.; Dong, S.; Wang, H.; Li, G.; Wang, T.; Wang, Q. Mine water source discrimination based on hydrogeochemical characteristics in the northern Ordos Basin, China. Mine Water Environ. 2021, 40, 433–441. [Google Scholar] [CrossRef]
- Chen, W.; Li, W.; He, J.; Qiao, W.; Wang, Q.; Yang, Y. Impact of mining-induced bed separation spaces on a cretaceous aquifer: A case study of the Yingpanhao coal mine, Ordos Basin, China. Hydrogeol. J. 2022, 30, 691–706. [Google Scholar] [CrossRef]
- Hu, Y.; Zhen, L.; Zhuang, D. Assessment of land-use and land-cover change in Guangxi, China. Sci. Rep. 2019, 9, 2189. [Google Scholar] [CrossRef] [Green Version]
- Lu, M.; Chen, J.; Tang, H.; Rao, Y.; Yang, P.; Wu, W. Land cover change detection by integrating object-based data blending model of Landsat and MODIS. Remote. Sens. Environ. 2016, 184, 374–386. [Google Scholar] [CrossRef]
- Guo, L.; Xi, X.; Yang, W.; Liang, L. Monitoring Land Use/Cover Change Using Remotely Sensed Data in Guangzhou of China. Sustainability 2021, 13, 2944. [Google Scholar] [CrossRef]
- Antonakos, A.; Lambrakis, N. Spatial Interpolation for the Distribution of Groundwater Level in an Area of Complex Geology Using Widely Available GIS Tools. Environ. Process. 2021, 8, 993–1026. [Google Scholar] [CrossRef]
- Nikroo, L.; Kompani-Zare, M.; Sepaskhah, A.R.; Fallah Shamsi, S.R. Groundwater depth and elevation interpolation by kriging methods in Mohr Basin of Fars province in Iran. Environ. Monit. Assess. 2010, 166, 387–407. [Google Scholar] [CrossRef]
- Madani, N.; Emery, X. A comparison of search strategies to design the cokriging neighborhood for predicting coregionalized variables. Stoch. Environ. Res. Risk Assess. 2019, 33, 183–199. [Google Scholar] [CrossRef] [Green Version]
- Serrano-Hidalgo, C.; Guardiola-Albert, C.; Heredia, J.; Elorza Tenreiro, F.J.; Naranjo-Fernández, N. Selecting Suitable MODFLOW Packages to Model Pond–Groundwater Relations Using a Regional Model. Water 2021, 13, 1111. [Google Scholar] [CrossRef]
- Sreekanth, J.; Crosbie, R.; Pickett, T.; Cui, T.; Peeters, L.; Slatter, E.; Northey, J.; Merrin, L.E.; Davies, P.; Miotlinski, K. Regional-scale modelling and predictive uncertainty analysis of cumulative groundwater impacts from coal seam gas and coal mining developments. Hydrogeol. J. 2020, 28, 193–218. [Google Scholar] [CrossRef]
- Vasilevskiy, P.; Wang, P.; Pozdniakov, S.; Wang, T.; Zhang, Y.; Zhang, X.; Yu, J. Simulating River/Lake–Groundwater Exchanges in Arid River Basins: An Improvement Constrained by Lake Surface Area Dynamics and Evapotranspiration. Remote Sens. 2022, 14, 1657. [Google Scholar] [CrossRef]
- Sun, W.; Wu, Q.; Liu, H.; Jiao, J. Prediction and assessment of the disturbances of the coal mining in Kailuan to karst groundwater system. Phys. Chem. Earth. 2015, 89, 136–144. [Google Scholar] [CrossRef]
- Shi, Z.; Hu, X.; Wang, C.-Y. Hydro-mechanical coupling in the shallow crust–Insight from groundwater level and satellite radar imagery in a mining area. J. Hydrol. 2021, 594, 125649. [Google Scholar] [CrossRef]
- Niu, T.; Yu, J.; Yue, D.; Yu, Q.; Hu, Y.; Long, Q.; Li, S.; Mao, X. Differential Law and Influencing Factors of Groundwater Depth in the Key Agricultural and Pastoral Zones Driven by the Minimum Hydrological Response Unit. Appl. Sci. 2020, 10, 7105. [Google Scholar] [CrossRef]
- Eamus, D.; Zolfaghar, S.; Villalobos-Vega, R.; Cleverly, J.; Huete, A. Groundwater-dependent ecosystems: Recent insights from satellite and field-based studies. Hydrol. Earth Syst. Sci. 2015, 19, 4229–4256. [Google Scholar] [CrossRef] [Green Version]
- Niu, G.Y.; Troch, P.A.; Paniconi, C.; Scott, R.L.; Durcik, M.; Zeng, X.; Huxman, T.; Goodrich, D.; Pelletier, J. An integrated modelling framework of catchment-scale ecohydrological processes: 2. The role of water subsidy by overland flow on vegetation dynamics in a semi-arid catchment. Ecohydrology 2014, 7, 815–827. [Google Scholar] [CrossRef]
- Fan, Y.; Miguez-Macho, G.; Jobbágy, E.G.; Jackson, R.B.; Otero-Casal, C. Hydrologic regulation of plant rooting depth. Proc. Natl. Acad. Sci. USA 2017, 114, 10572–10577. [Google Scholar] [CrossRef] [Green Version]
- McLendon, T.; Hubbard, P.J.; Martin, D.W. Partitioning the use of precipitation-and groundwater-derived moisture by vegetation in an arid ecosystem in California. J. Arid Environ. 2008, 72, 986–1001. [Google Scholar] [CrossRef]
- Scott, R.L.; Huxman, T.E.; Williams, D.G.; Goodrich, D.C. Ecohydrological impacts of woody-plant encroachment: Seasonal patterns of water and carbon dioxide exchange within a semiarid riparian environment. Glob. Chang. Biol. 2006, 12, 311–324. [Google Scholar] [CrossRef]
- Xu, H.-L.; Mao, Y.; Li, J.-M. Changes in groundwater levels and the response of natural vegetation to transfer of water to the lower reaches of the Tarim River. J. Environ. Sci. 2007, 19, 1199–1207. [Google Scholar] [CrossRef]
- Zhang, W.; Zhao, L.; Yu, X.; Zhang, L.; Wang, N.A. Estimation of Groundwater Evapotranspiration Using Diurnal Groundwater Level Fluctuations under Three Vegetation Covers at the Hinterland of the Badain Jaran Desert. Adv. Meteorol. 2020, 2020, 8478140. [Google Scholar] [CrossRef]
- Alshehri, F.; Sultan, M.; Karki, S.; Alwagdani, E.; Alsefry, S.; Alharbi, H.; Sahour, H.; Sturchio, N. Mapping the distribution of shallow groundwater occurrences using Remote Sensing-based statistical modeling over southwest Saudi Arabia. Remote Sens. 2020, 12, 1361. [Google Scholar] [CrossRef]
- Wang, Z.; Wang, W.; Zhang, Z.; Hou, X.; Duan, L.; Yao, D. Assessment of the effect of water-table depth on riparian vegetation along the middle and lower reaches of the Manasi River, Northwest China. Hydrogeol. J. 2021, 29, 579–589. [Google Scholar] [CrossRef]
- Jia, L.; Jiao, R.; Liao, Z.; Long, Y. The Ecological Quality Present Situation and Water Requirement Research of Grassland Vegetation in rid Pastorl Areas. China Rural. Water Hydropower 2013, 6, 49–52+56. (In Chinese) [Google Scholar]
- Fan, L.; Hou, G.; Tao, Z. Characteristics of Groundwater and Its Relation with Vegetation Distribution in Sara Wusu Formation of Mu US Desert. J. Soil Water Conserv. 2018, 32, 151–157. (In Chinese) [Google Scholar]
- Niu, G.Y.; Fang, Y.H.; Chang, L.L.; Jin, J.; Yuan, H.; Zeng, X. Enhancing the Noah-MP ecosystem response to droughts with an explicit representation of plant water storage supplied by dynamic root water uptake. J. Adv. Model. Earth Syst. 2020, 12, e2020MS002062. [Google Scholar] [CrossRef]
- Currell, M.; Irvine, D.; Werner, A.; McGrath, C. Science sidelined in approval of Australia’s largest coal mine. Nat. Sustain. 2020, 3, 644–649. [Google Scholar] [CrossRef]
- Ma, Q.; Wu, J.; He, C.; Fang, X. The speed, scale, and environmental and economic impacts of surface coal mining in the Mongolian Plateau. Resour. Conserv. Recycl. 2021, 173, 105730. [Google Scholar] [CrossRef]
- Kessler, T.; Mugova, E.; Jasnowski-Peters, H.; Rinder, T.; Stemke, M.; Wolkersdorfer, C.; Hilberg, S.; Melchers, C.; Struckmeier, W.; Wieber, G. Groundwater in former German coal mining areas—a scientific perspective on mine floodings. Grundwasser 2020, 25, 259–272. [Google Scholar] [CrossRef]
- Xu, J.; Lv, C.; Zhang, M.; Yao, L.; Zeng, Z. Equilibrium strategy-based optimization method for the coal-water conflict: A perspective from China. J. Environ. Manag. 2015, 160, 312–323. [Google Scholar] [CrossRef] [PubMed]
Figure 1.
Location of the study area: (a) Location of the studied river basin in China; (b) Location of wells, hydrological stations, and first mining areas of coal mines in the basin; (c) Borehole drilling sites and geological background.
Figure 1.
Location of the study area: (a) Location of the studied river basin in China; (b) Location of wells, hydrological stations, and first mining areas of coal mines in the basin; (c) Borehole drilling sites and geological background.

Figure 2.
Schematic stratigraphic section of the study area.

Figure 3.
Groundwater depth interpolation and well location.

Figure 4.
Division of recharge and discharge areas in the basin.

Figure 5.
Three-dimensional hydrogeological solid model and hydrogeological parameter partitioning.

Figure 6.
Comparison of observed head and calculated head.

Figure 7.
Comparison of observation head and calculated head of 21 monthly continuous monitoring wells.
Figure 7.
Comparison of observation head and calculated head of 21 monthly continuous monitoring wells.

Figure 8.
(a) Interpolation of groundwater depth in the watershed; (b) Distribution of greensward land use type in the watershed; (c) Location of the center of greensward land in the watershed (colors of the groundwater flow field are illuminated for contrast).
Figure 8.
(a) Interpolation of groundwater depth in the watershed; (b) Distribution of greensward land use type in the watershed; (c) Location of the center of greensward land in the watershed (colors of the groundwater flow field are illuminated for contrast).

Figure 9.
Distribution area of groundwater depth and the number of greensward pixels.

Figure 10.
(a) Groundwater simulation flow field in the watershed; (b) Interpolation of simulated groundwater depth in the watershed; (c) Location of greensward aggregation centers in the watershed (colors of the groundwater flow field are illuminated for contrast).
Figure 10.
(a) Groundwater simulation flow field in the watershed; (b) Interpolation of simulated groundwater depth in the watershed; (c) Location of greensward aggregation centers in the watershed (colors of the groundwater flow field are illuminated for contrast).

Figure 11.
Proportion and number of greensward aggregation centers at different groundwater depths.


Table 1.
Description of land use/cover classification.
| LUCC | Training | Testing | Total | Description |
|---|---|---|---|---|
| Greensward | 144,330 | 61,855 | 206,185 | Emergence of green |
| Psammophyte | 857,465 | 367,485 | 1,224,950 | No obvious geometric features, mostly dark green or brown in color |
| Water bodies | 3331 | 1427 | 4758 | Lakes and reservoirs, and some wide rivers |
| Roads | 7146 | 3063 | 10,209 | Usually near buildings, in a regular straight line |
| Buildings | 45,126 | 19,340 | 64,466 | Regular geometry exists, concentrated distribution, with red or blue roofs |
| Farmland | 348,413 | 149,320 | 497,733 | Emergence of green, with clear geometric boundaries |
| Bare sand | 622,805 | 266,916 | 889,721 | Yellow, with the feeling of sand flowing |
Table 2.
Hydrogeological parameters of aquifers.
| Stratum Area | Hydraulic Conductivity (m/d) | Specific Yield | Storage Coefficient (m−1) | |
|---|---|---|---|---|
| Q | Ⅰ | 7 | 0.26 | - |
| Ⅱ | 3.5 | 0.2 | - | |
| Ⅲ | 1.5 | 0.06 | - | |
| Ⅵ | 0.8 | 0.01 | - | |
| K1 | Ⅰ | 0.25 | 0.05 | - |
| Ⅱ | 0.3 | 0.05 | - | |
| Ⅲ | 0.3 | 0.06 | - | |
| J2 | Ⅰ | 0.003 | - | 1.5 × 10⁻⁷ |
| Ⅱ | 0.004 | - | 1.9 × 10⁻⁸ | |
| Ⅲ | 0.008 | - | 3.3 × 10⁻⁷ | |
| Ⅵ | 0.007 | - | 4.0 × 10⁻⁸ | |
Table 3.
Results of groundwater budget in the study area.
| Balance Project | Annual Amount (×106 m3/a) | |
|---|---|---|
| Recharge | Precipitation | 361.83 |
| Lateral recharge | 3.23 | |
| Discharge | Evaporation | 197.58 |
| Lateral discharge | 4.17 | |
| River discharge | 81.99 | |
| Artificial exploitation | 80.43 | |
| - | 0.89 | |
Table 4.
Relationship between vegetation growth and groundwater level in different areas.
| Research Objectives | Number of Studies | The Link between Vegetation and Groundwater Levels |
|---|---|---|
| The Owens Valley of California, USA (1991–2004) | 30 permanent monitoring sites | About 3.5 m is the groundwater threshold for normal vegetation coverage in most areas |
| The riparian area in southeastern Arizona, USA (2003) | Three sites | The average annual groundwater depth of the grassland is 2.6 m |
| The lower section of the Tarim River, China (2005) | Nine 50 m wide transects | When the groundwater depth is −3.14 m, the density and diversity of above-ground plants are significantly improved |
| The hinterland of the Badain Jaran Desert, China (2014) | 10 long-term observation sites | In the area where the groundwater depth is 0–2 m, the growth of vegetation is more vigorous |
| Al Qunfudah City and the surrounding coastal plain in southwest Saudi Arabia (2018) | Six locations | Vegetation coverage is higher in areas where the groundwater depth is less than 5 m |
| The Manasi River riparian zone, China (2018–2019) | 13 sites | The water-table depth appropriate for herbs is 1–1.5 m |
Publisher’s Note: MDPI stays neutral with regard to jurisdictional claims in published maps and institutional affiliations. |
© 2022 by the authors. Licensee MDPI, Basel, Switzerland. This article is an open access article distributed under the terms and conditions of the Creative Commons Attribution (CC BY) license (https://creativecommons.org/licenses/by/4.0/).
Share and Cite
MDPI and ACS Style
Zhou, S.; Liu, T.; Duan, L. Ecological Impact Prediction of Groundwater Change in Phreatic Aquifer under Multi-Mining Conditions. ISPRS Int. J. Geo-Inf. 2022, 11, 359. https://doi.org/10.3390/ijgi11070359
AMA Style
Zhou S, Liu T, Duan L. Ecological Impact Prediction of Groundwater Change in Phreatic Aquifer under Multi-Mining Conditions. ISPRS International Journal of Geo-Information. 2022; 11(7):359. https://doi.org/10.3390/ijgi11070359
Chicago/Turabian StyleZhou, Shenghui, Tingxi Liu, and Limin Duan. 2022. "Ecological Impact Prediction of Groundwater Change in Phreatic Aquifer under Multi-Mining Conditions" ISPRS International Journal of Geo-Information 11, no. 7: 359. https://doi.org/10.3390/ijgi11070359
Note that from the first issue of 2016, this journal uses article numbers instead of page numbers. See further details here.