
Block2vec: An Approach for Identifying Urban Functional Regions by Integrating Sentence Embedding Model and Points of Interest


Abstract
:1. Introduction
2. Study Area and Dataset
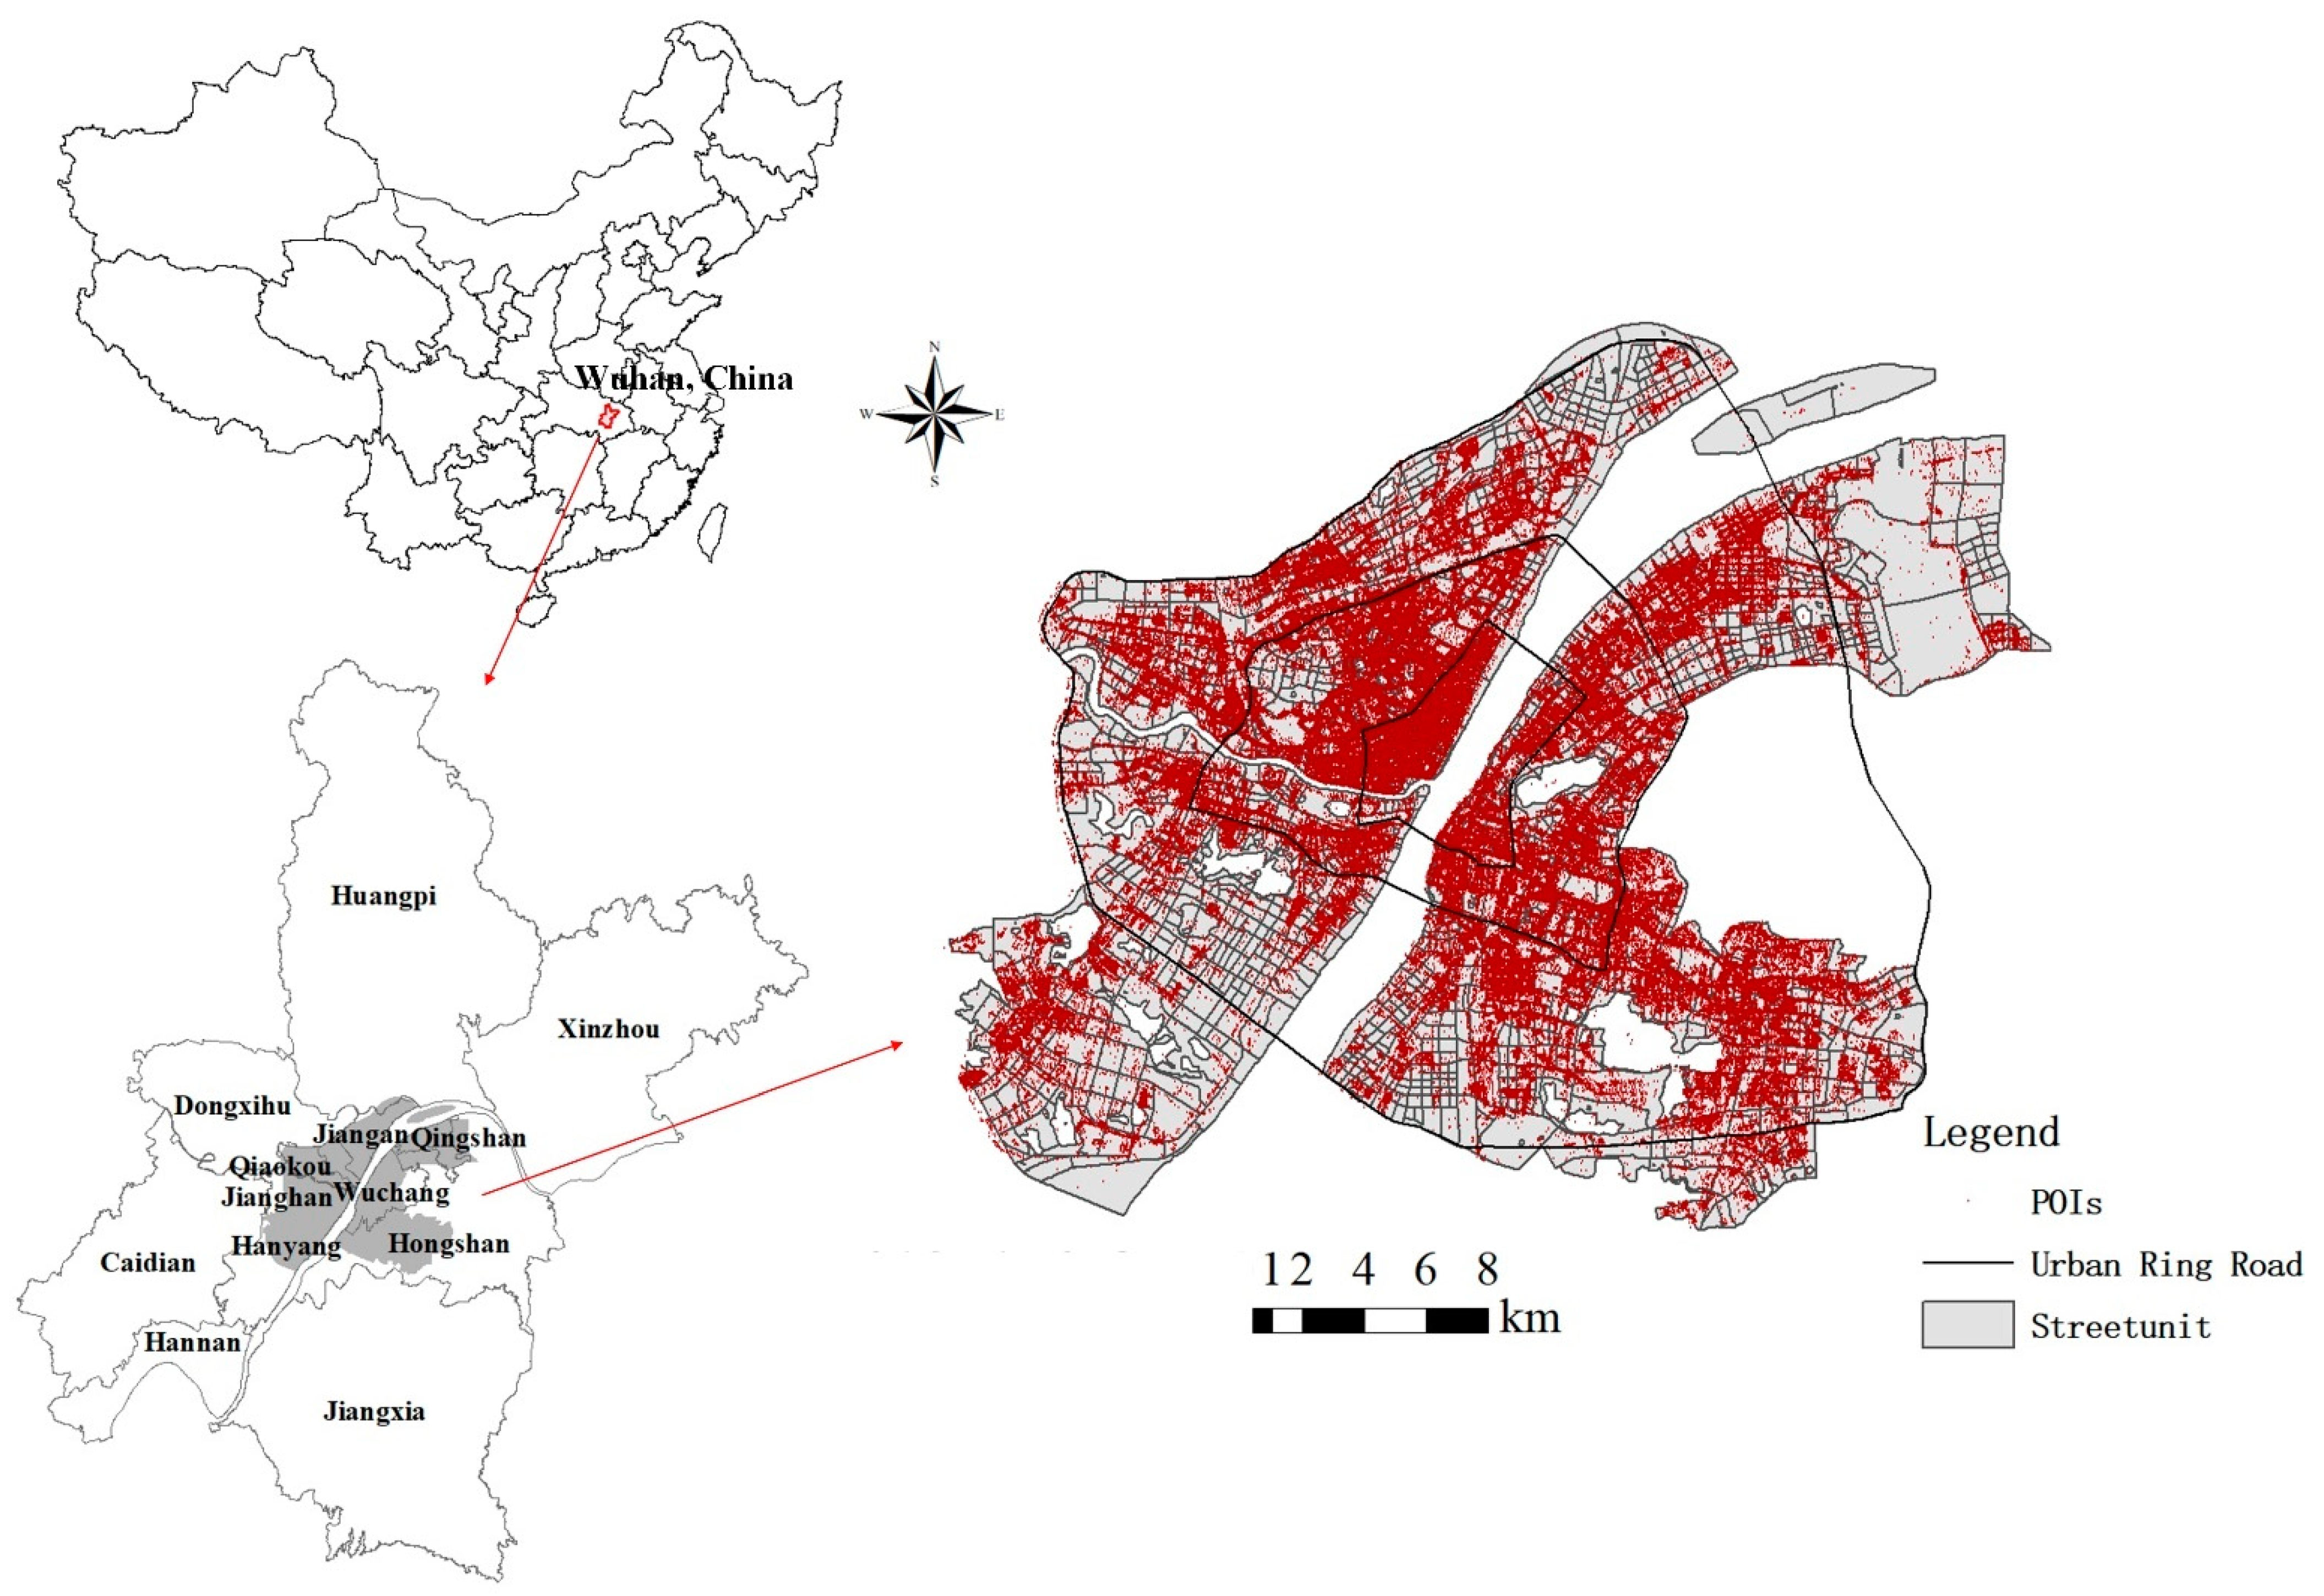
2.1. Study Area
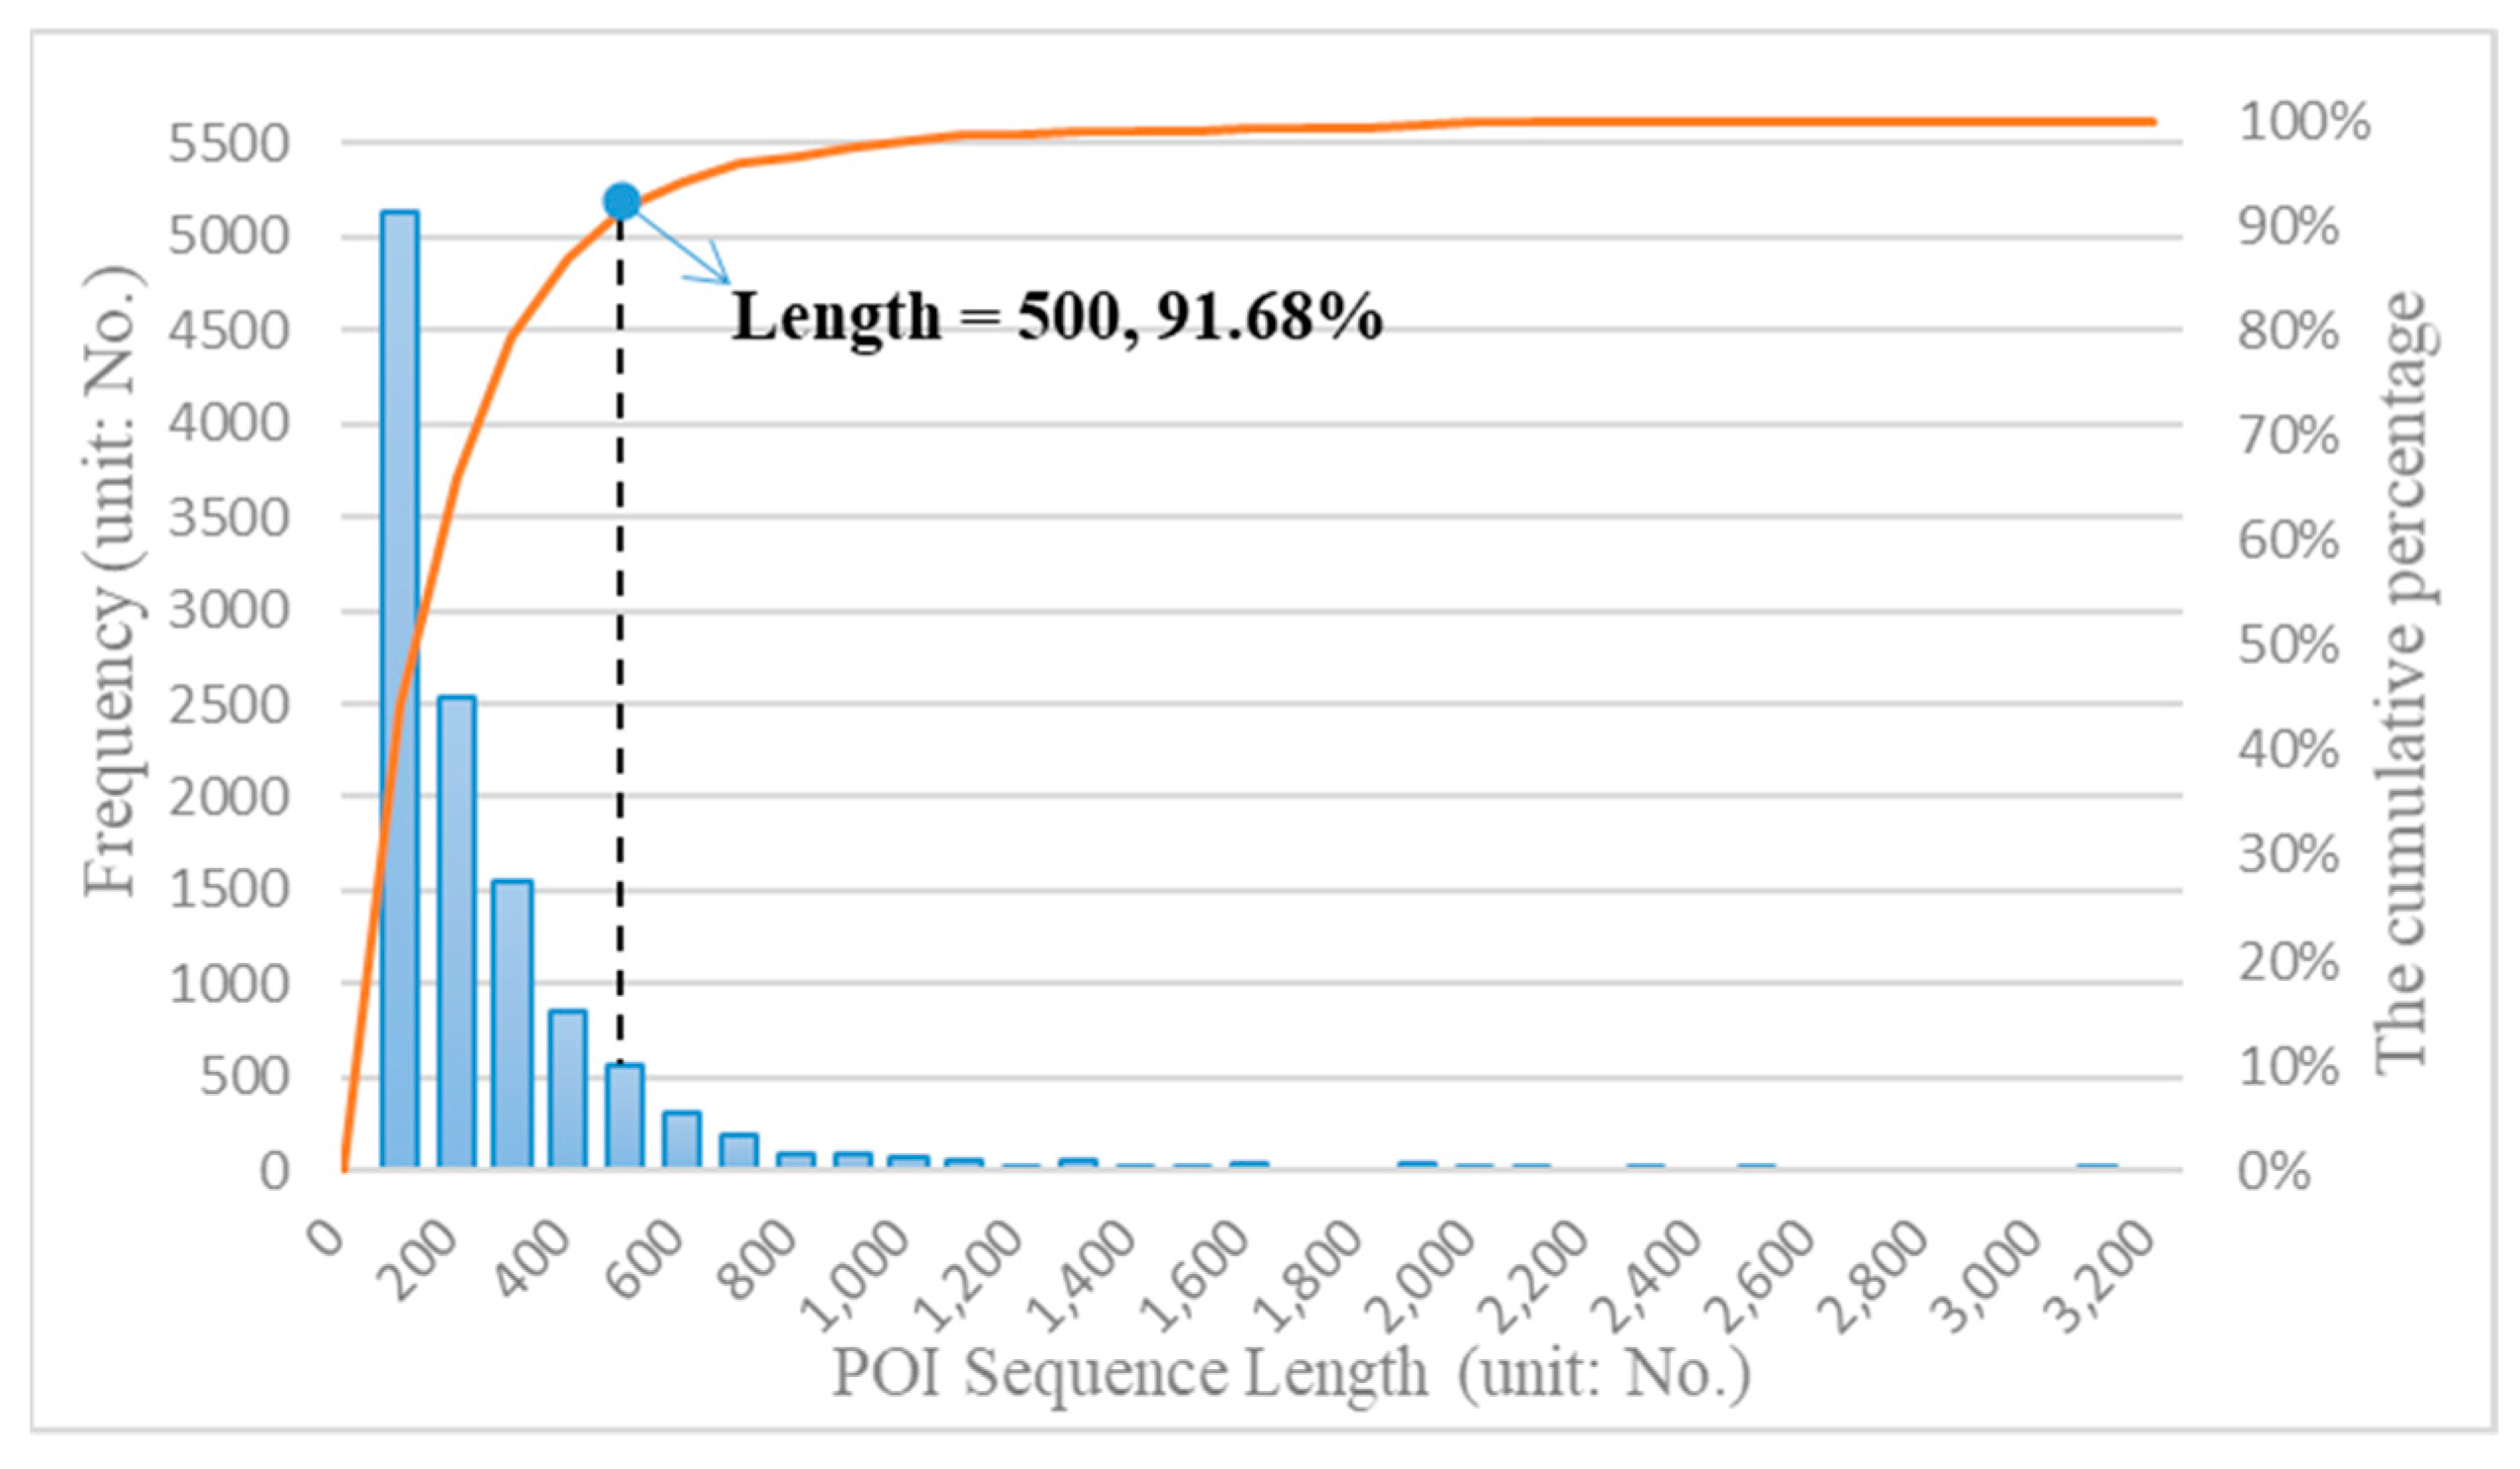
2.2. Dataset
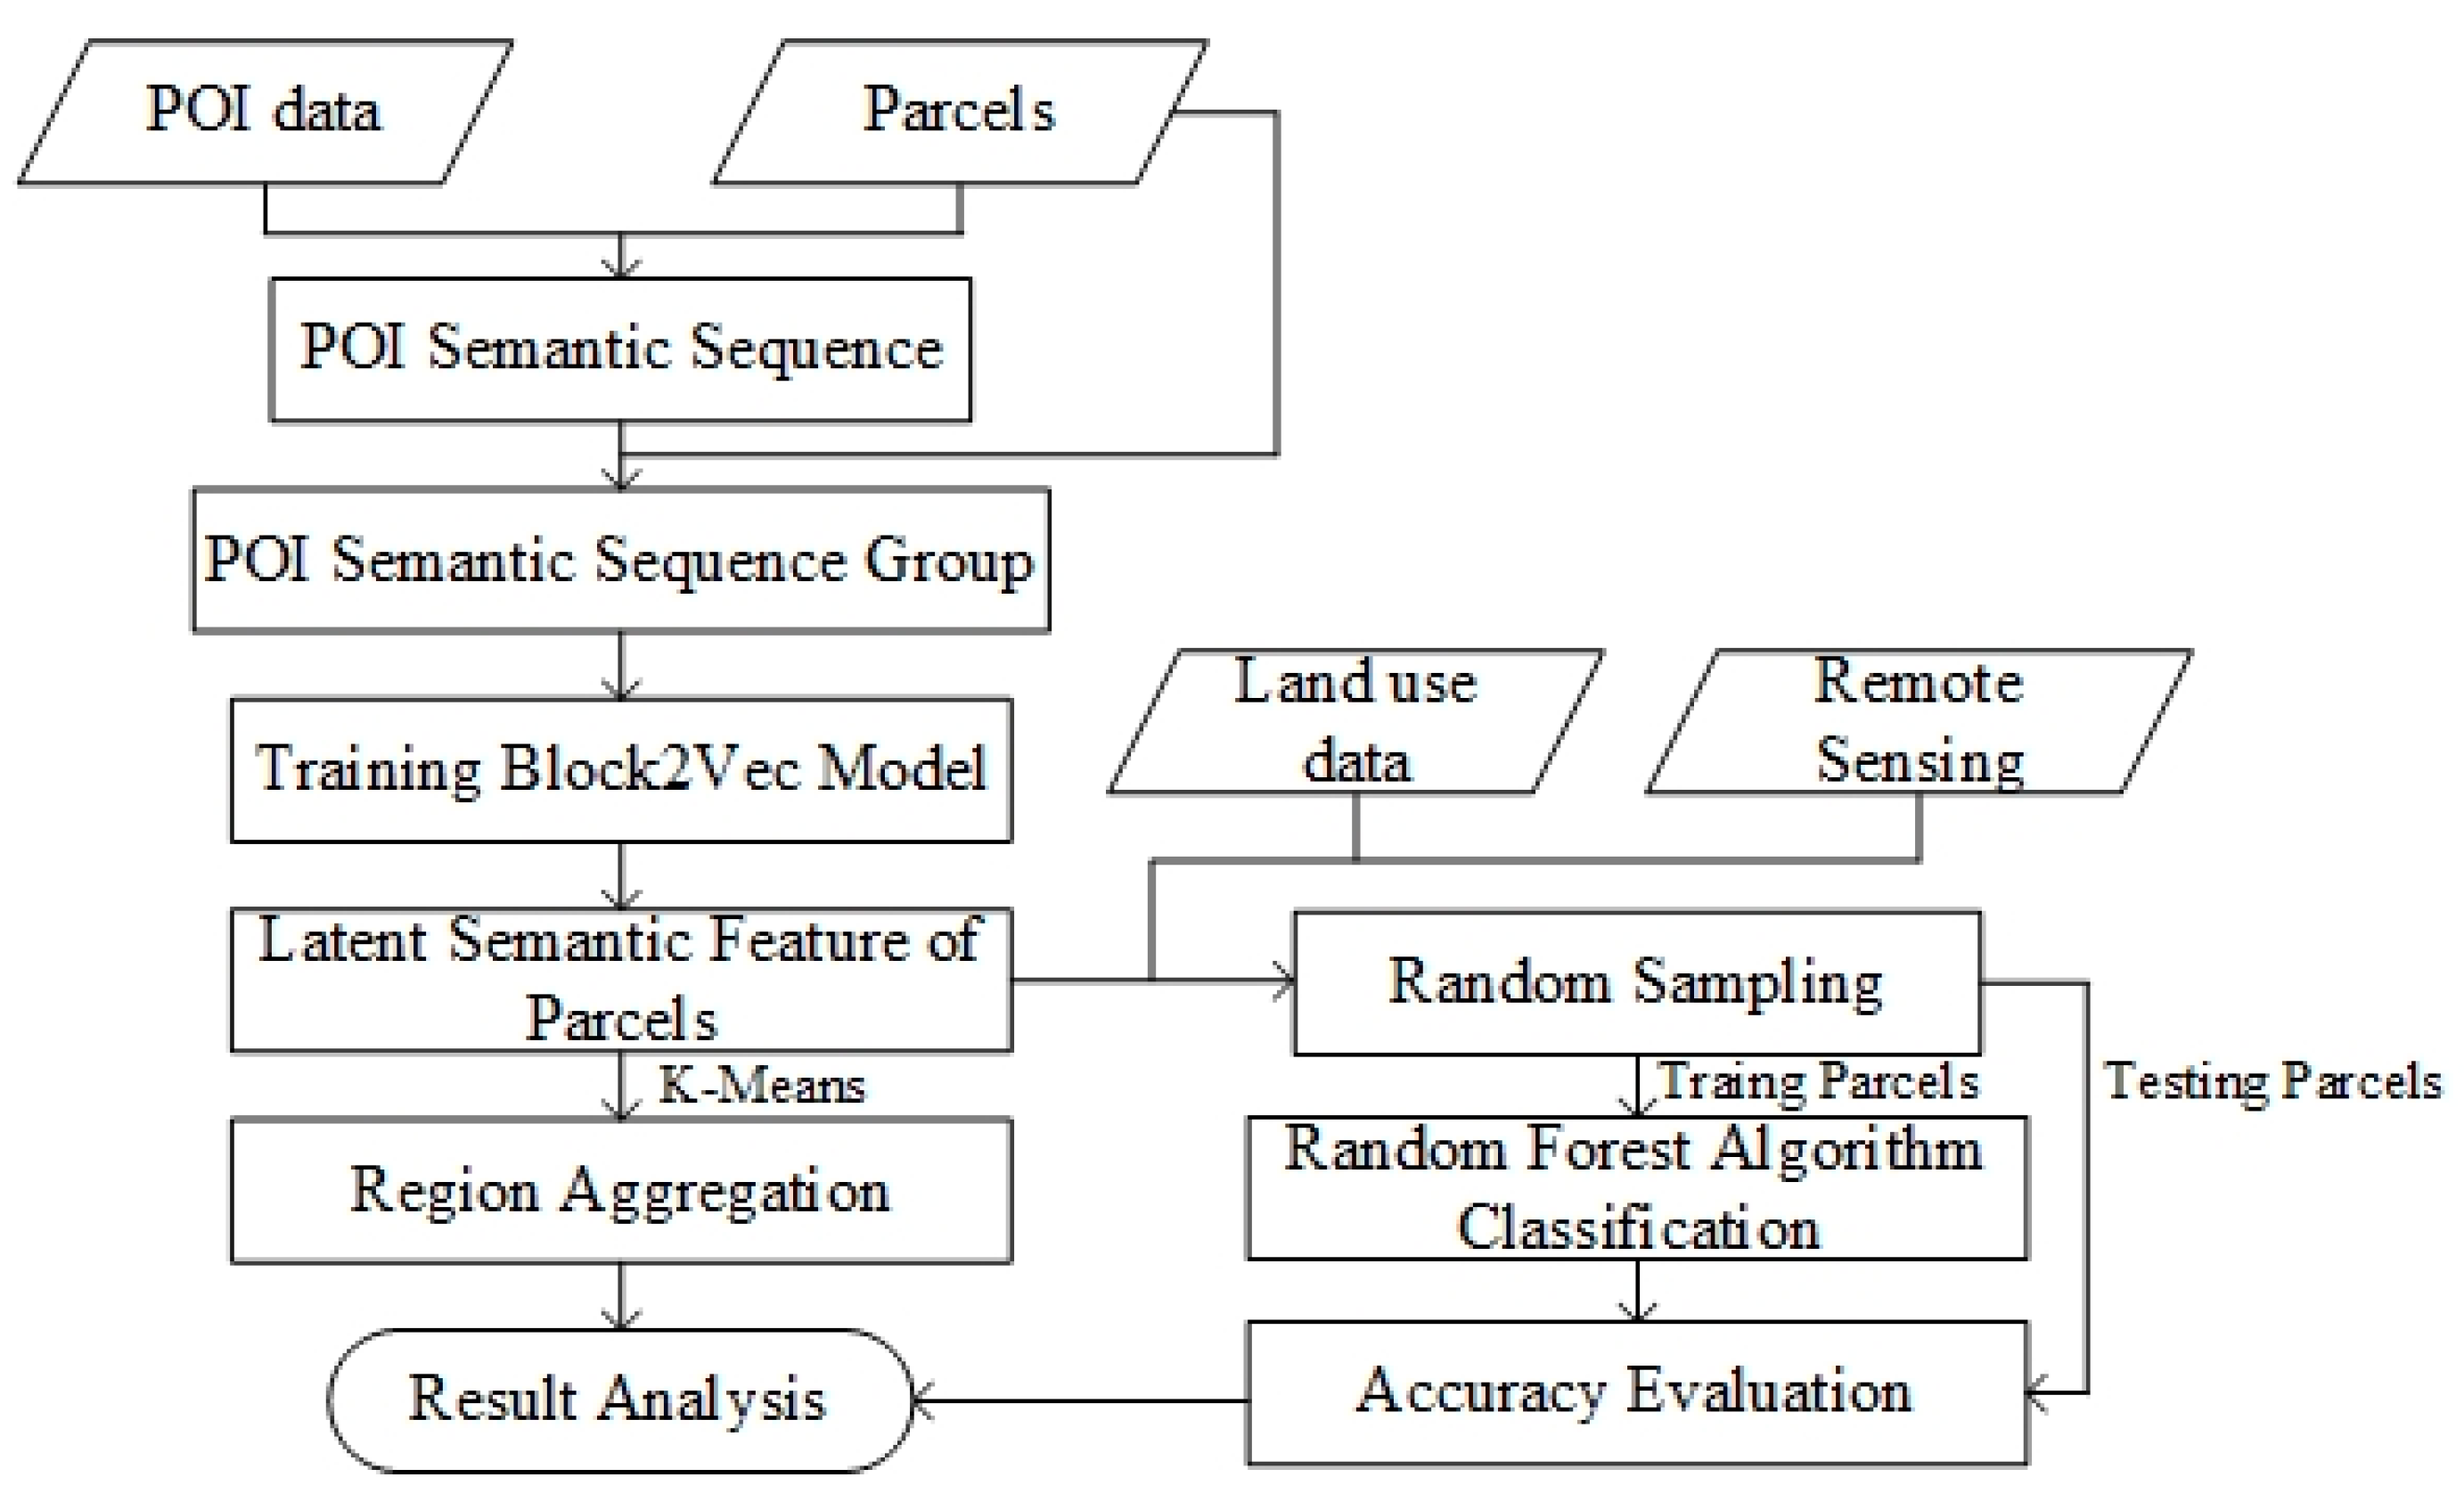
3. Methodology
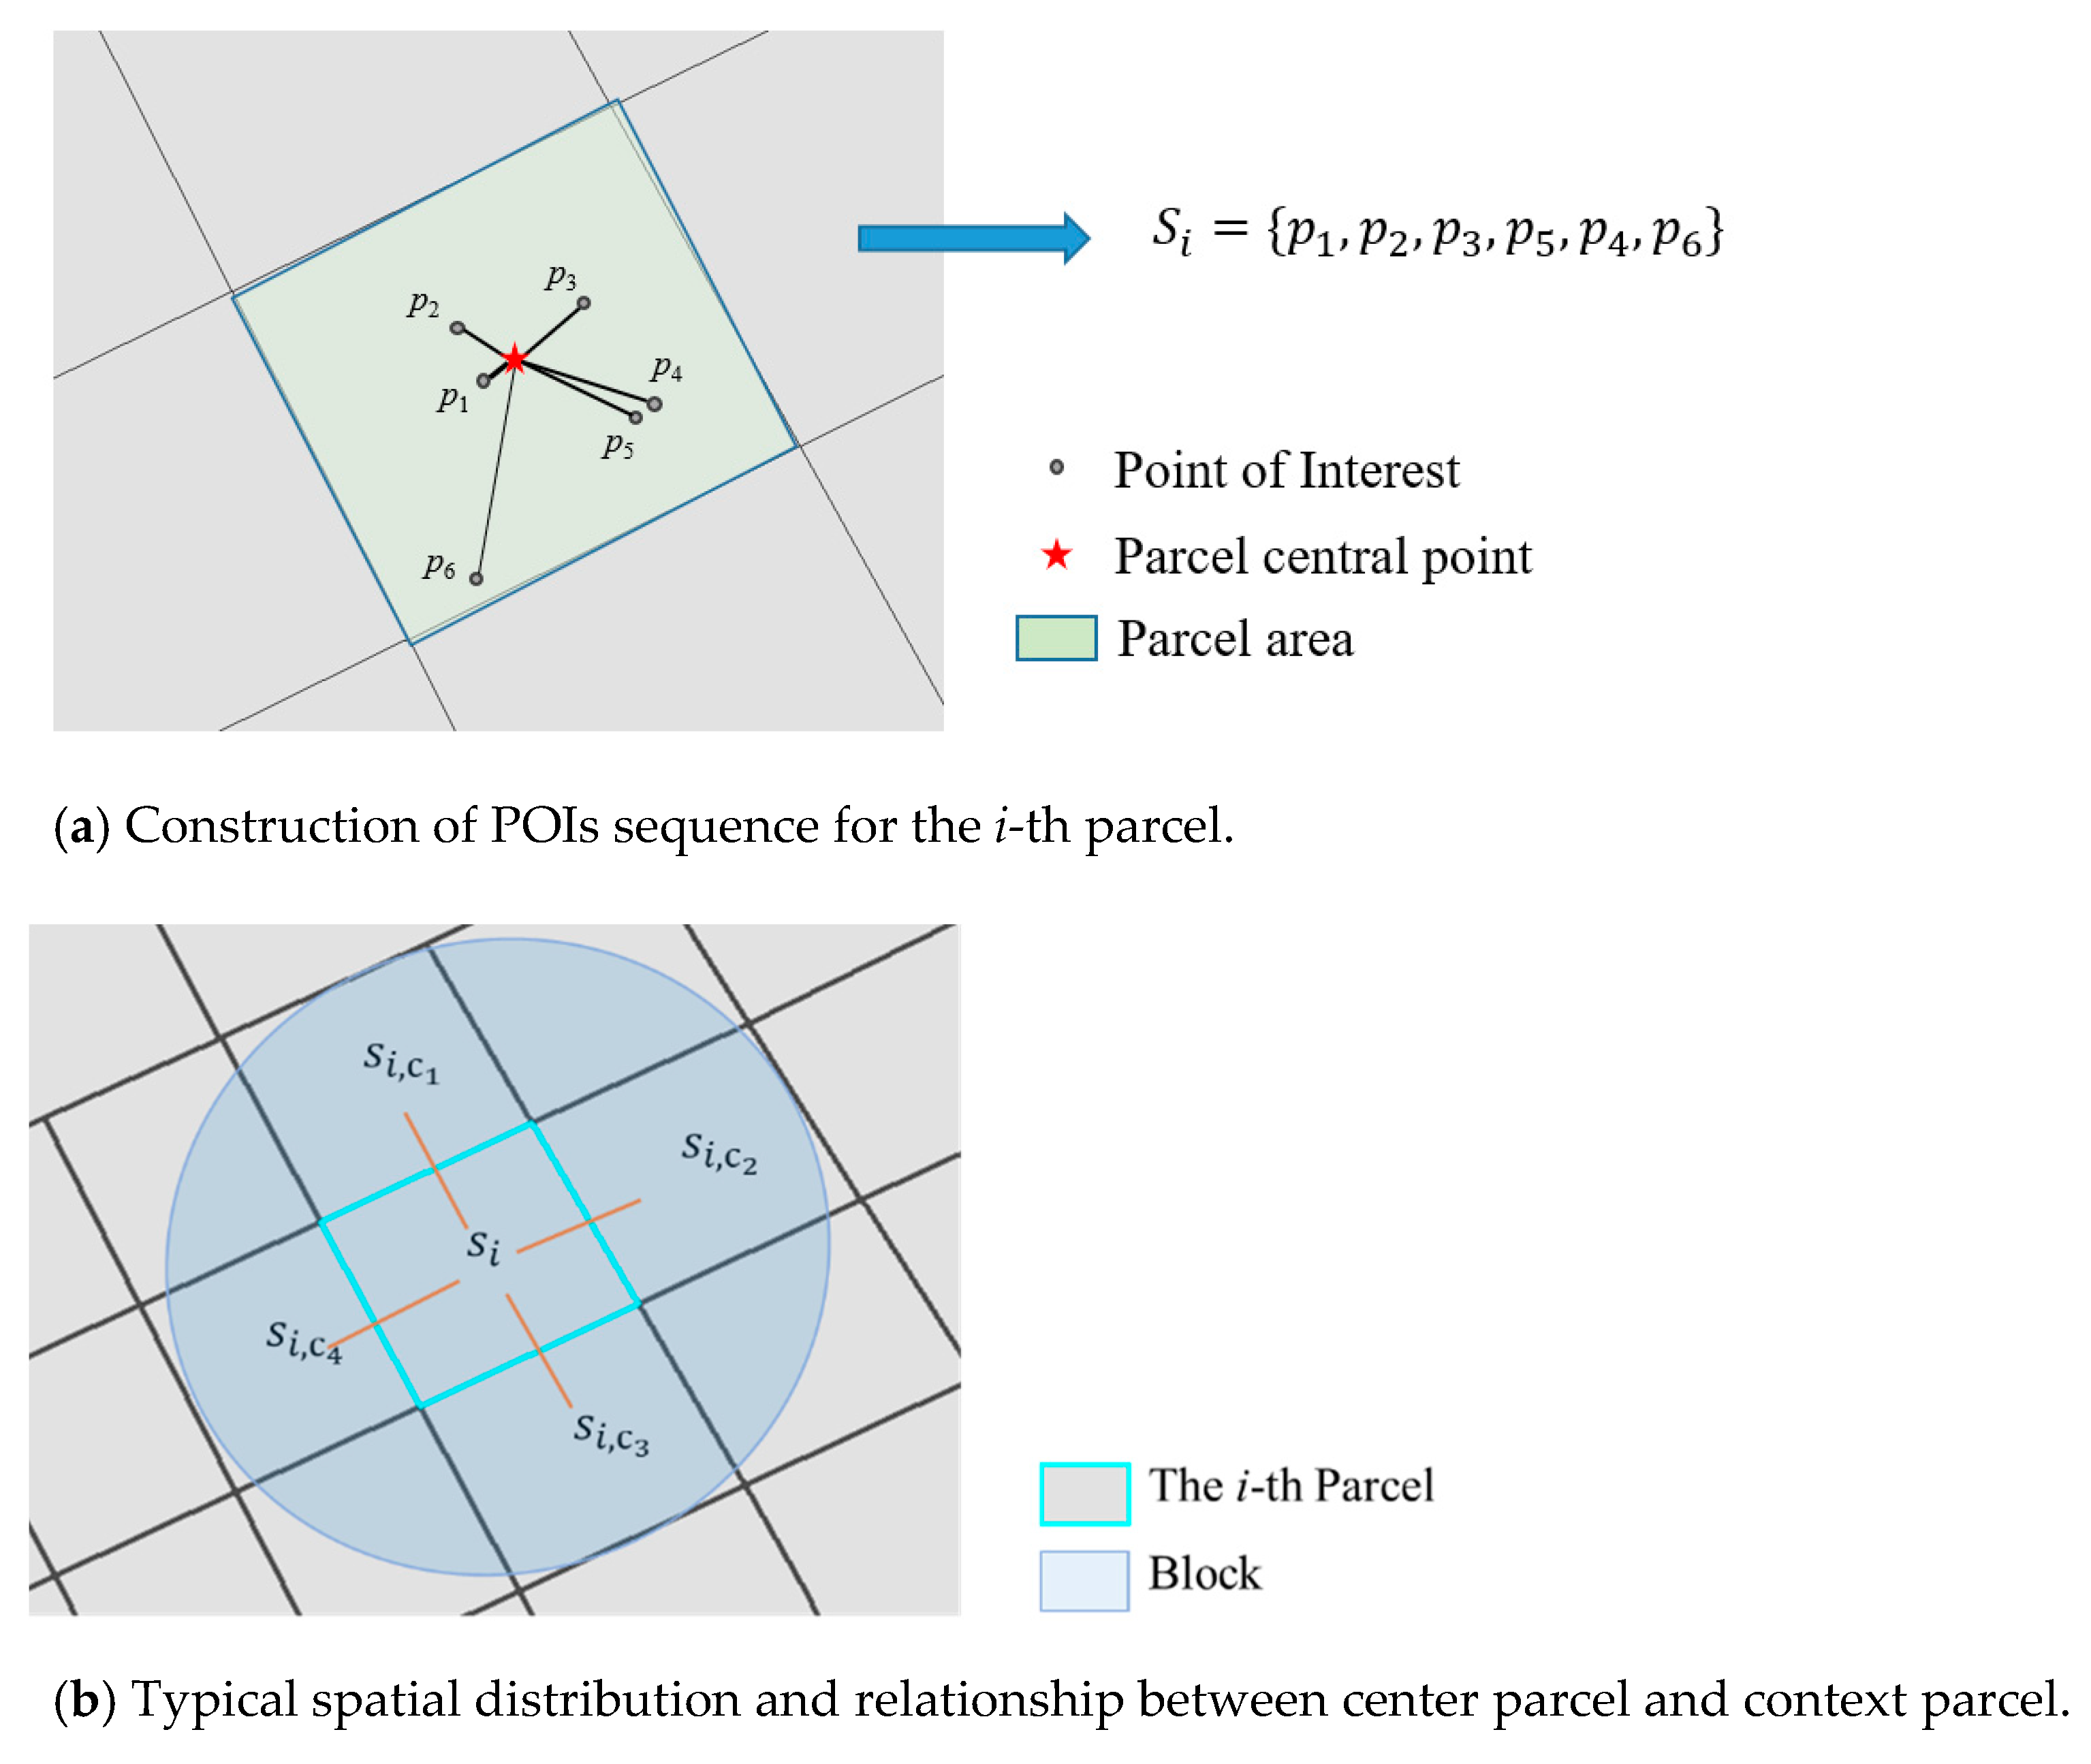
3.1. Constructing Semantic Sequence for Each Parcel
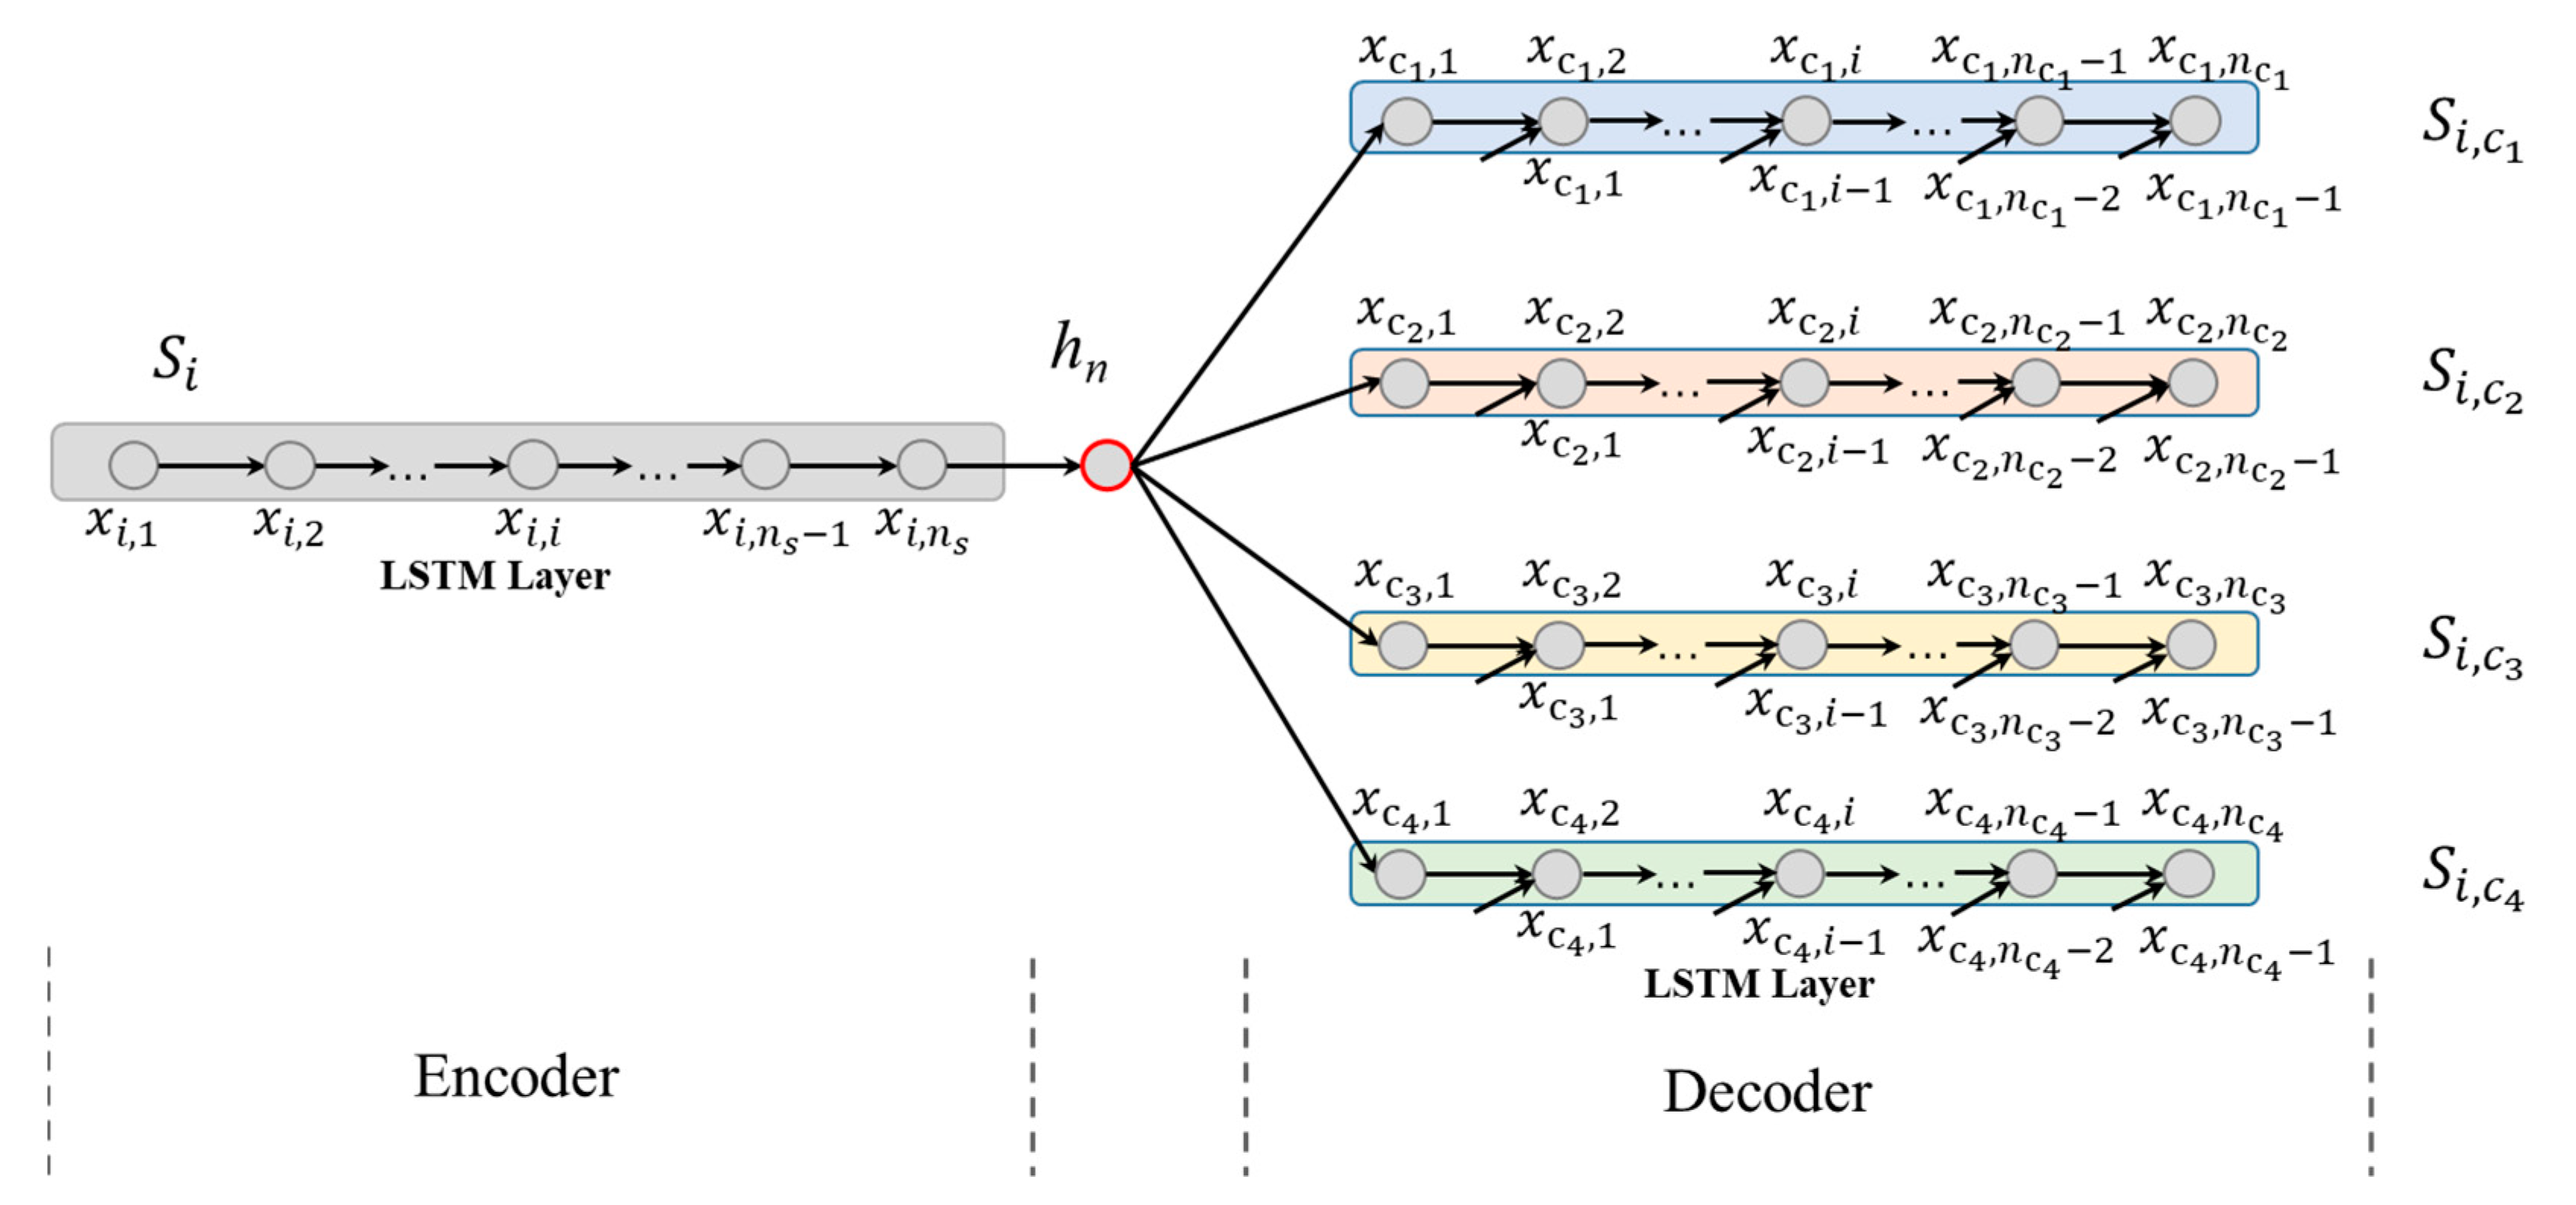
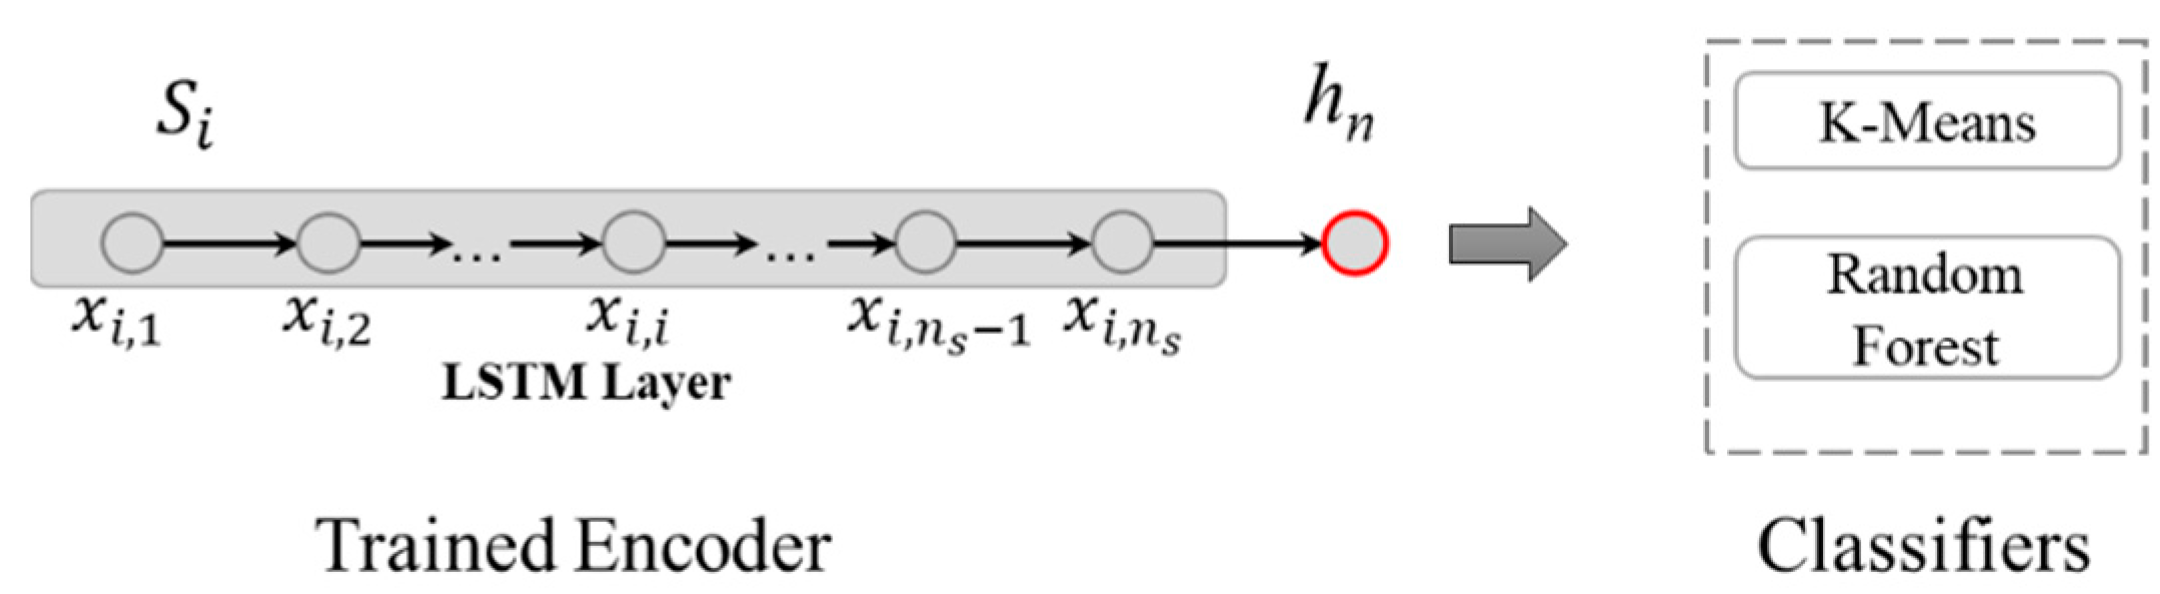
3.2. Latent Semantic Feature Extraction Model
3.3. Identification of Urban Functional Regions Based on Latent Semantics
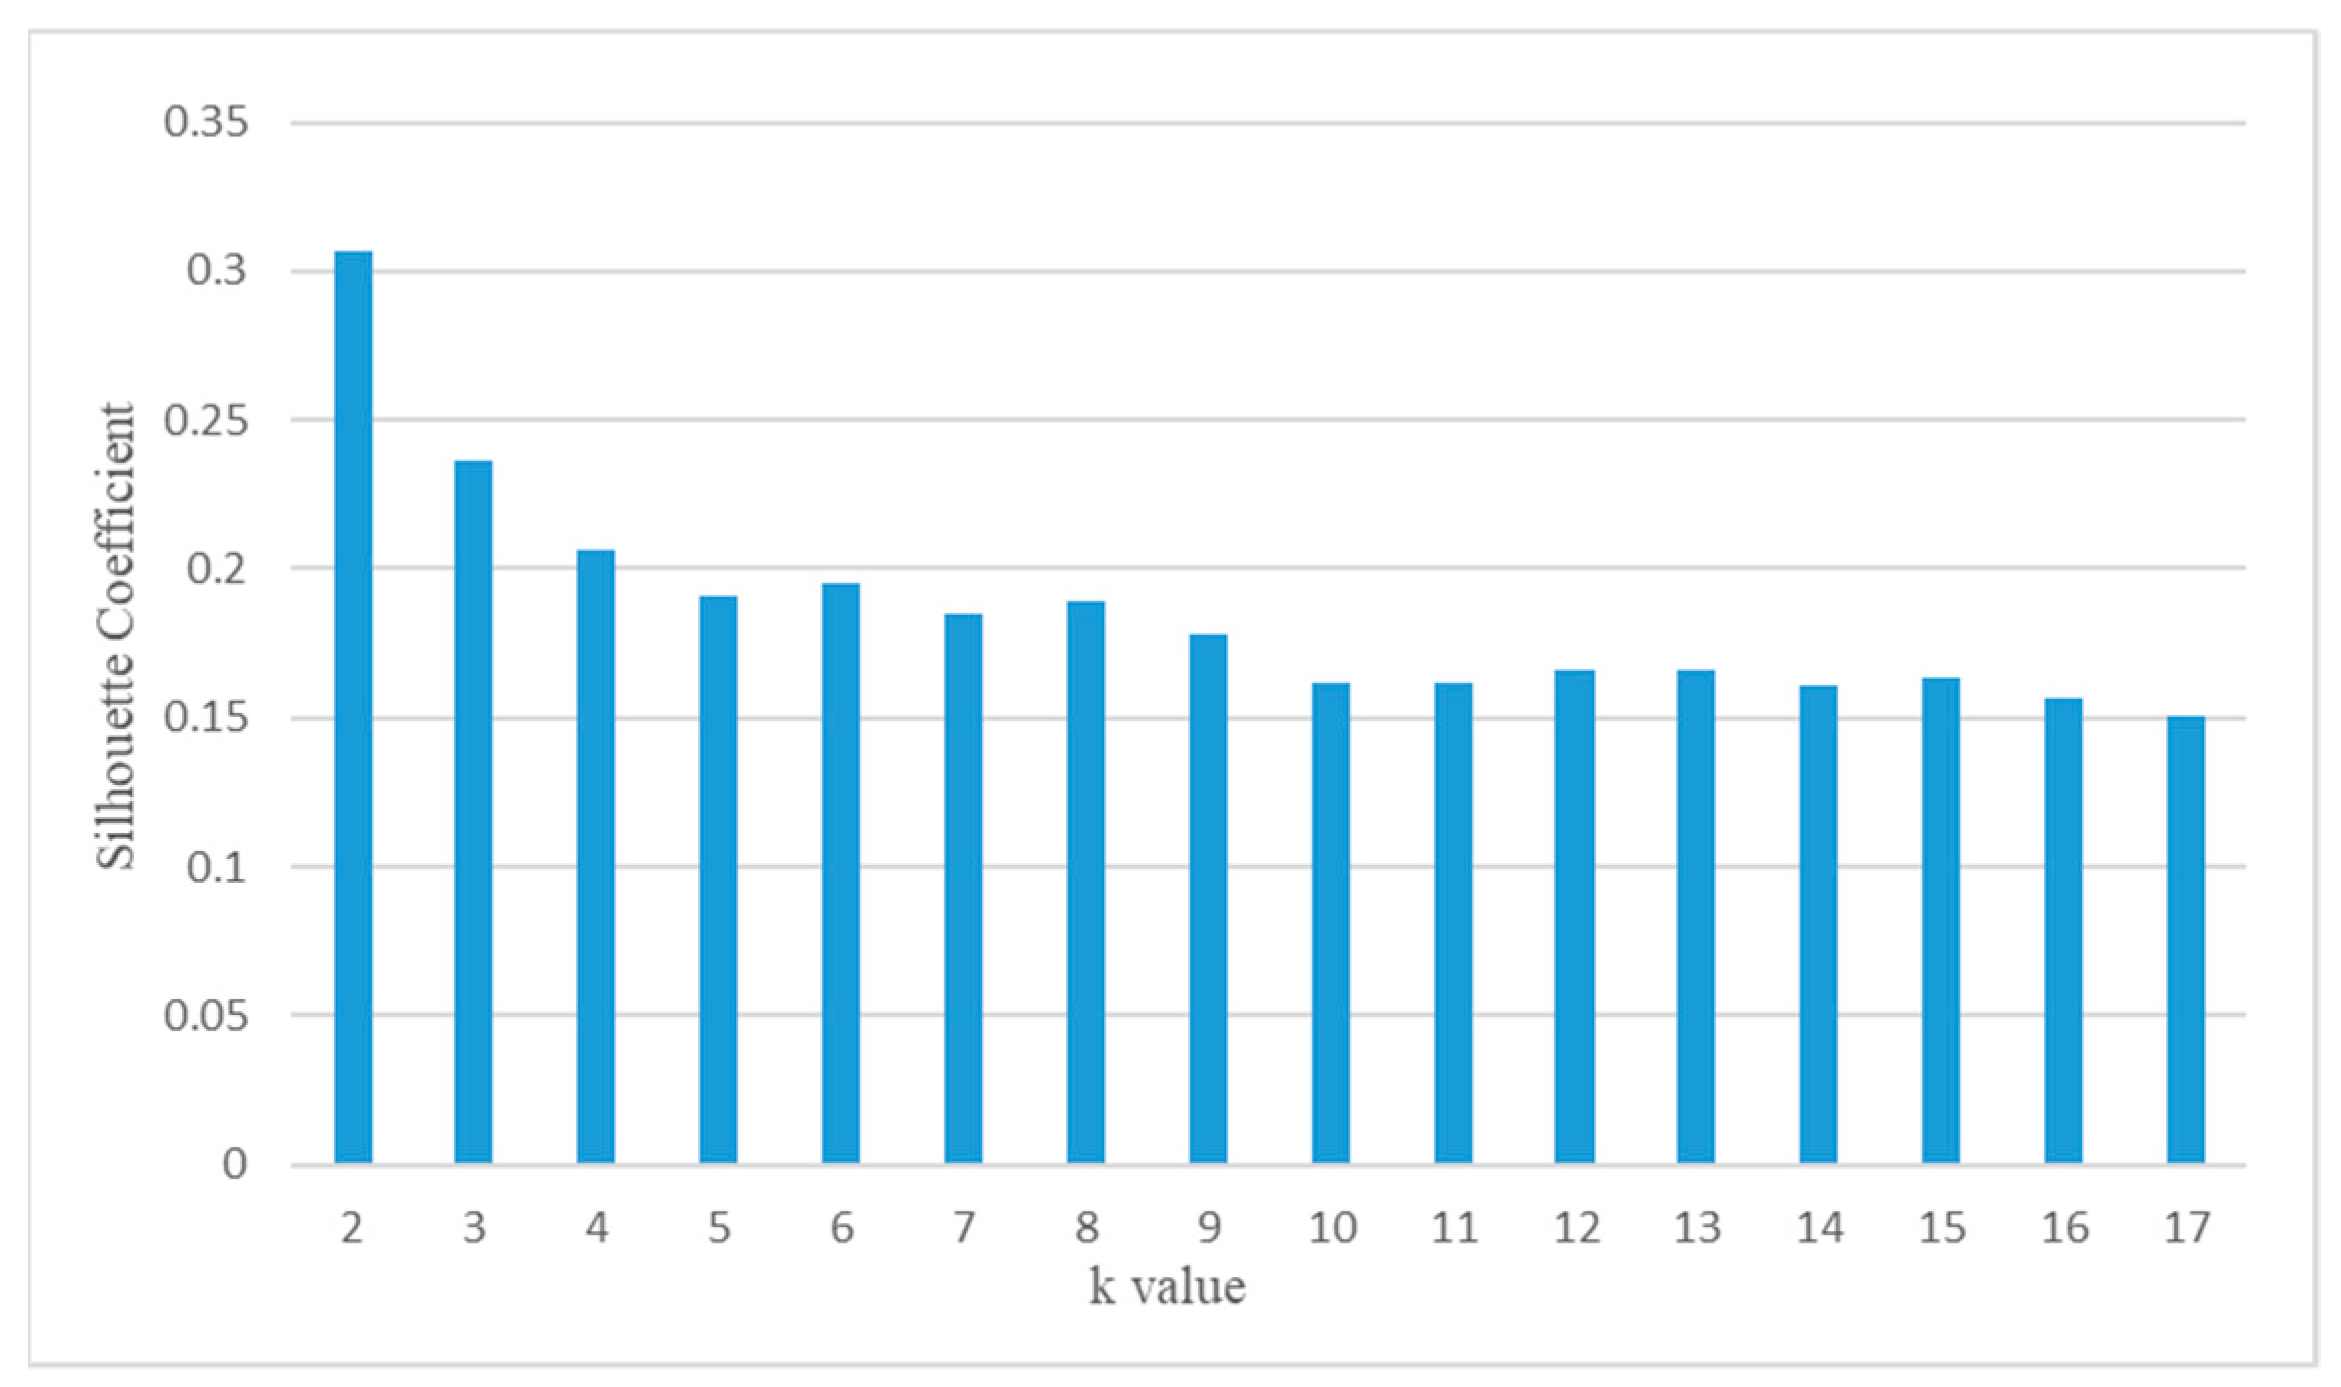
3.3.1. K-Means-Based Parcel Aggregation
3.3.2. RFA-Based Parcel Classification
4. Results
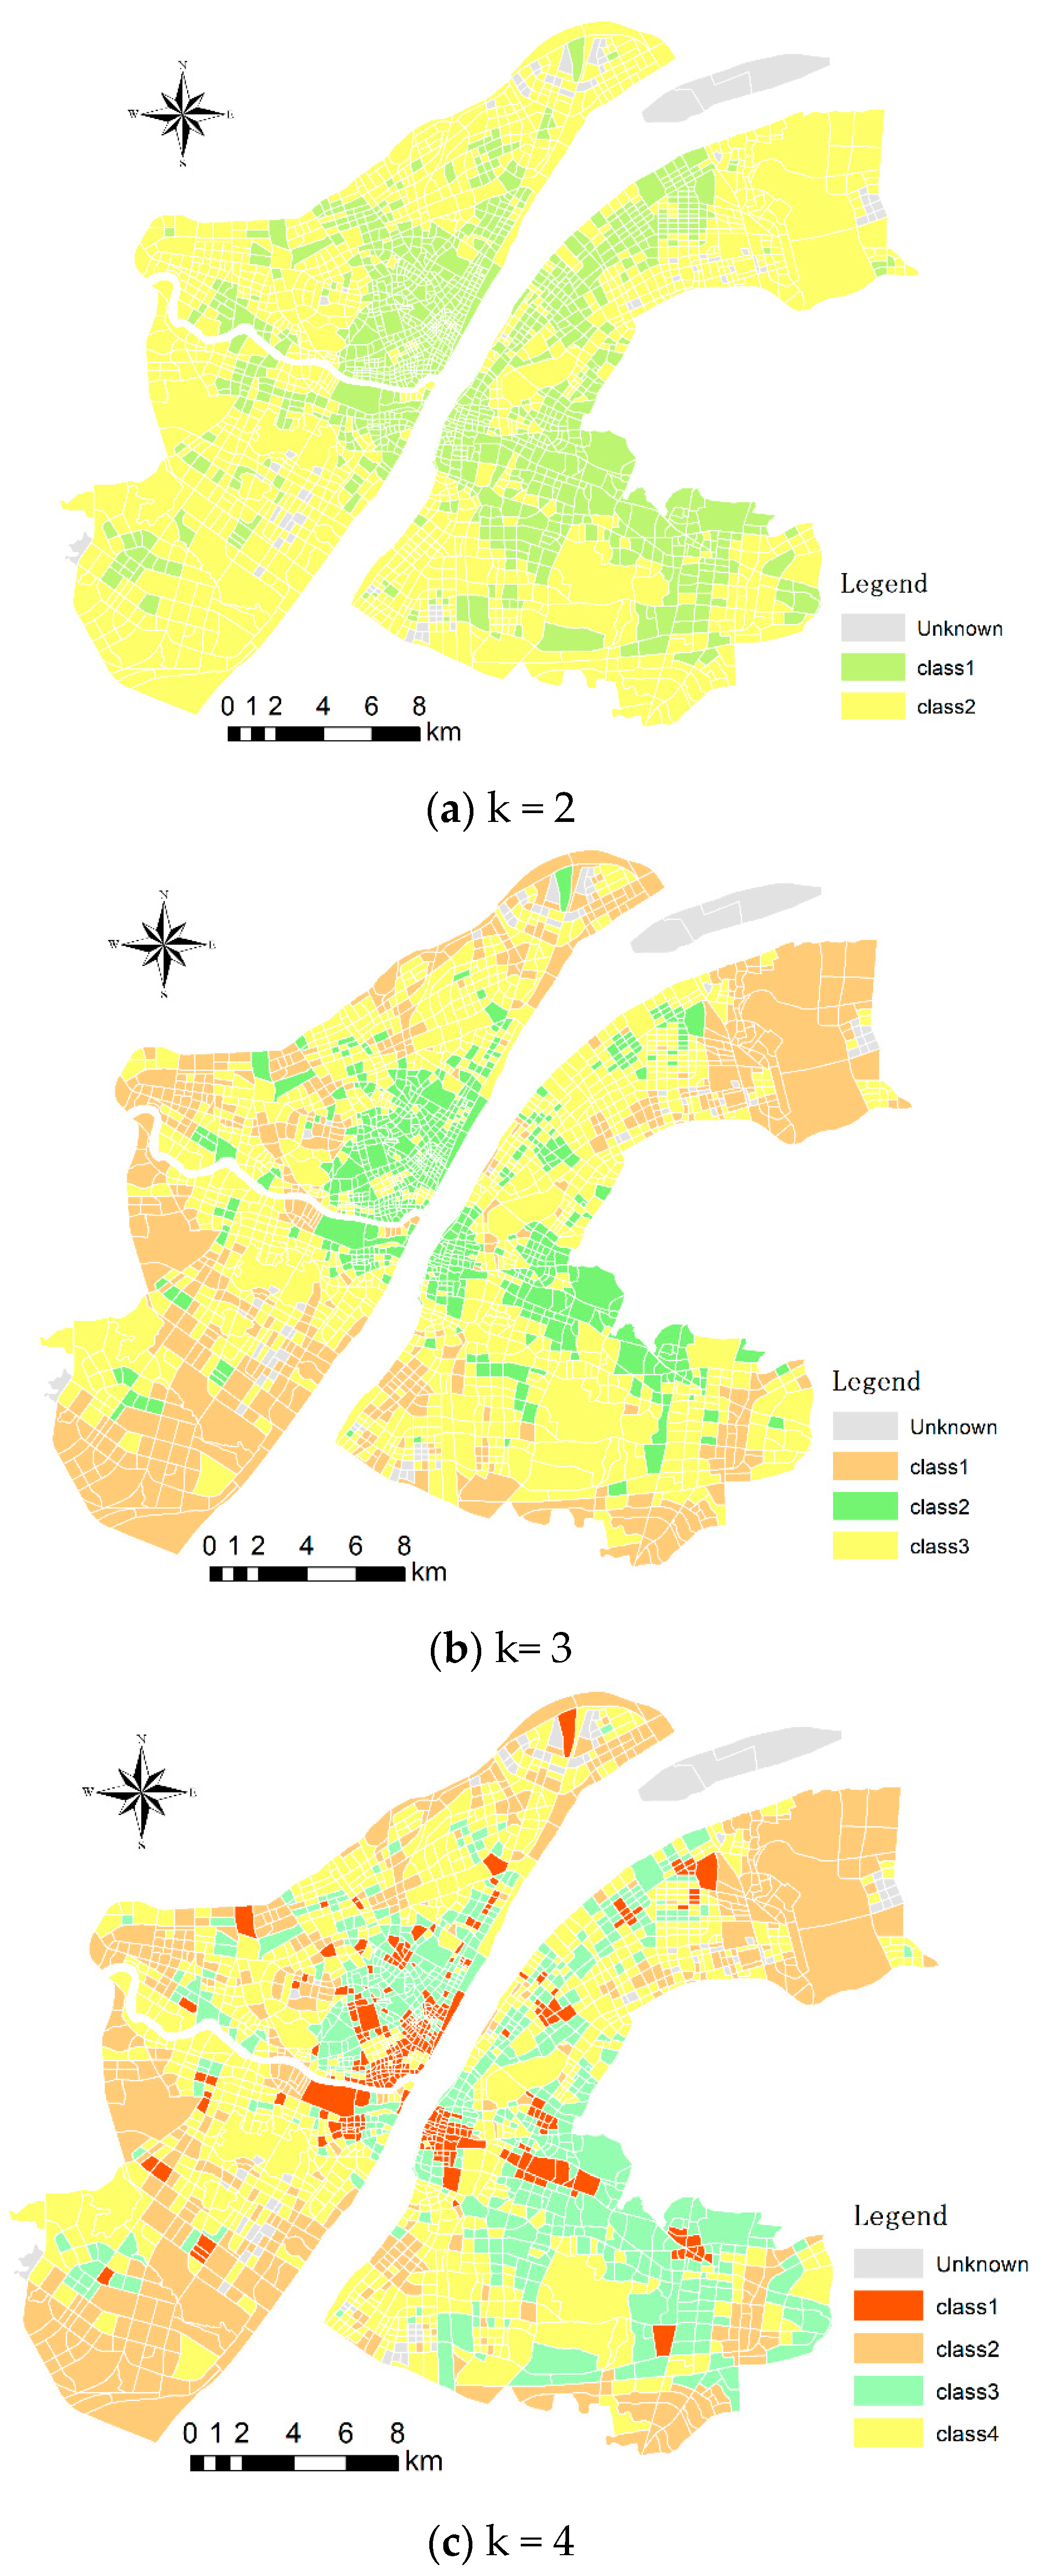
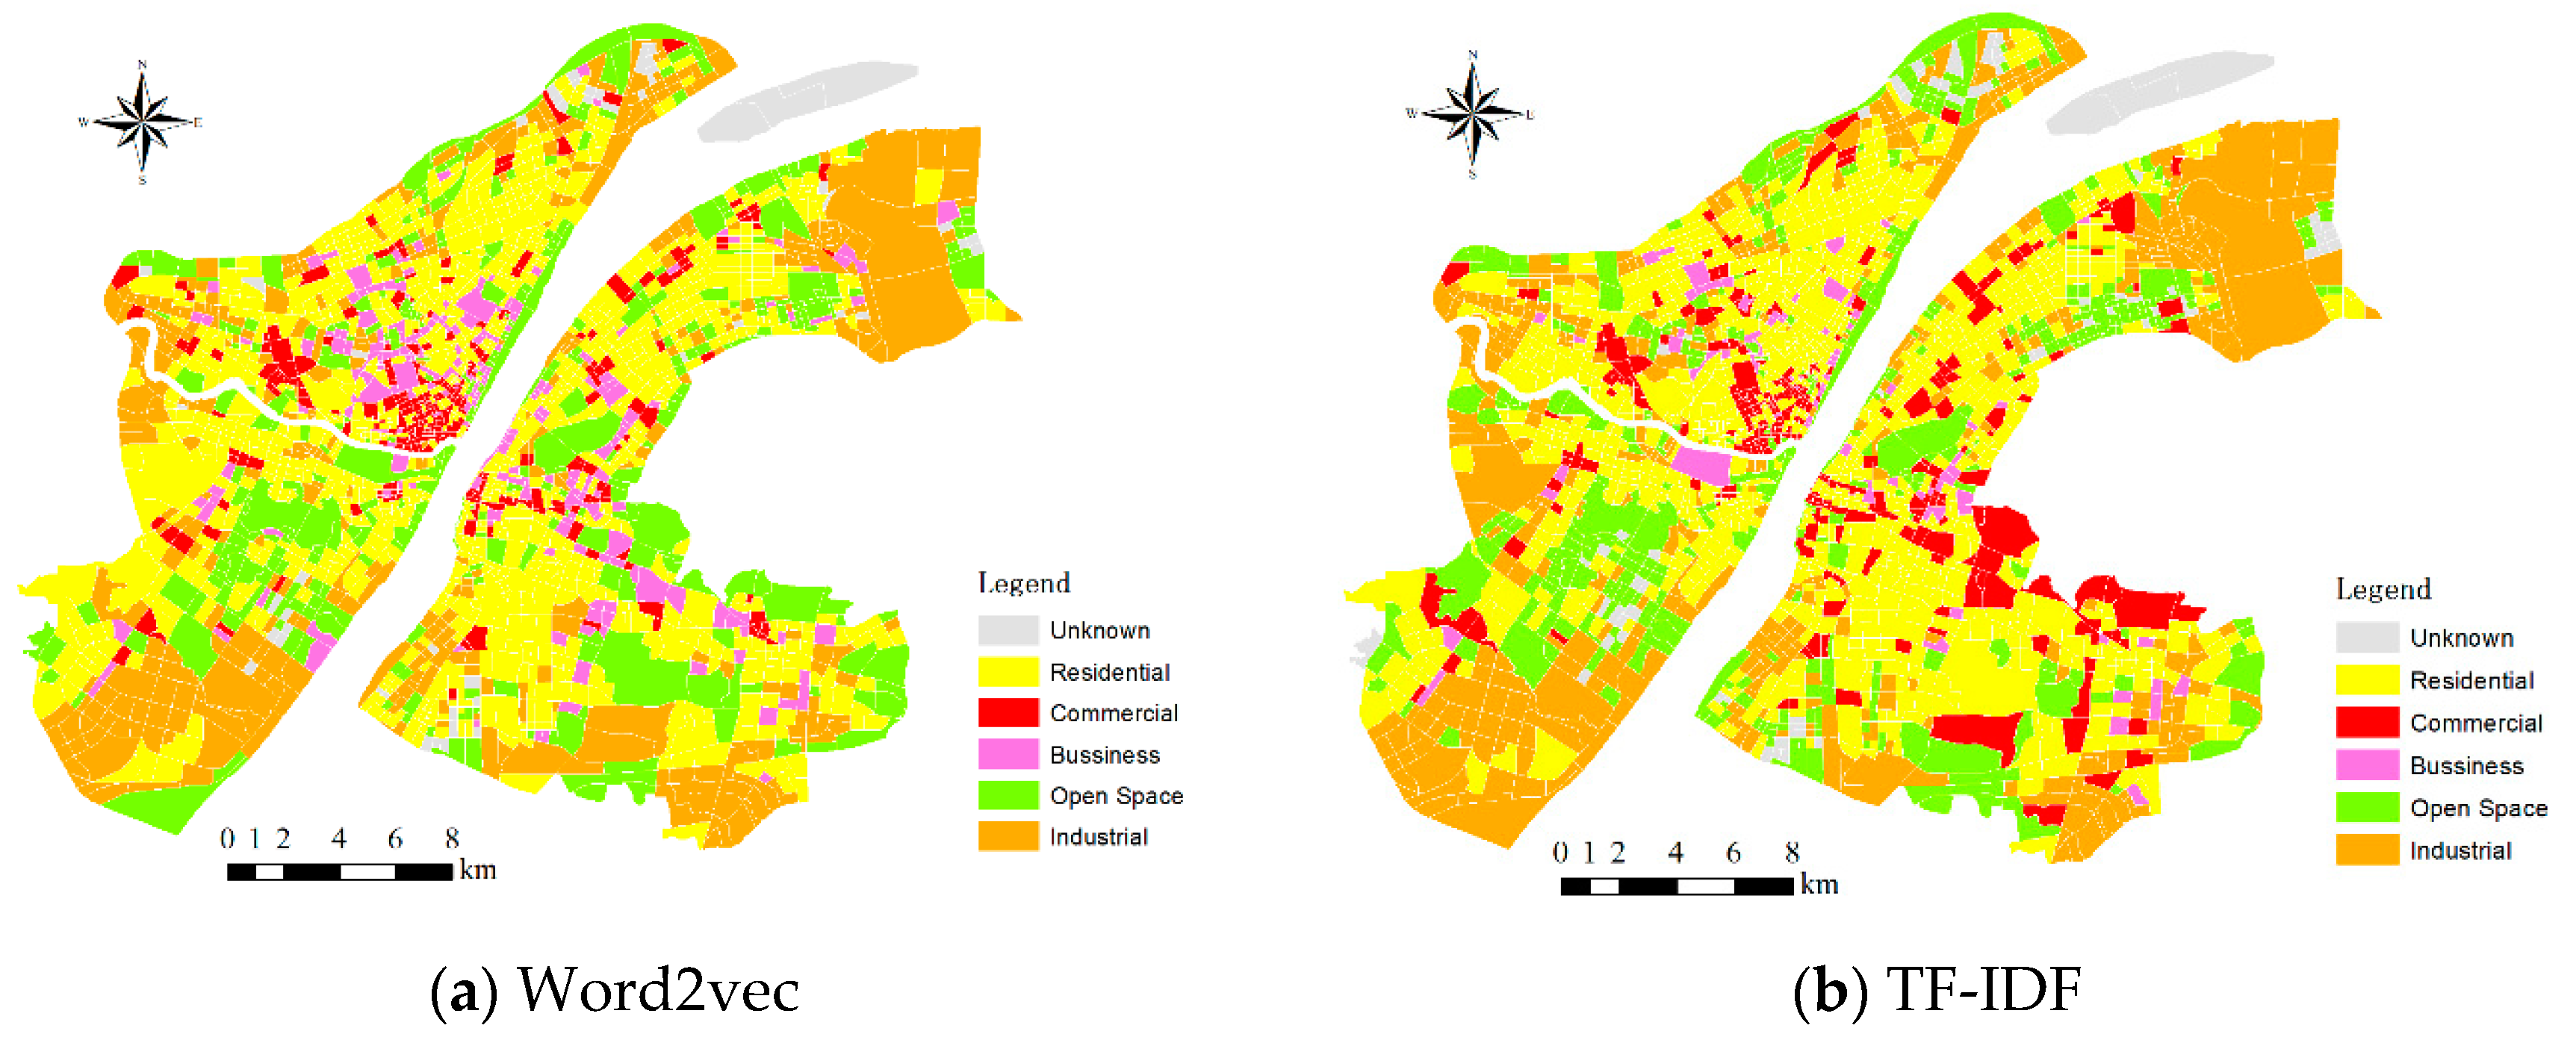
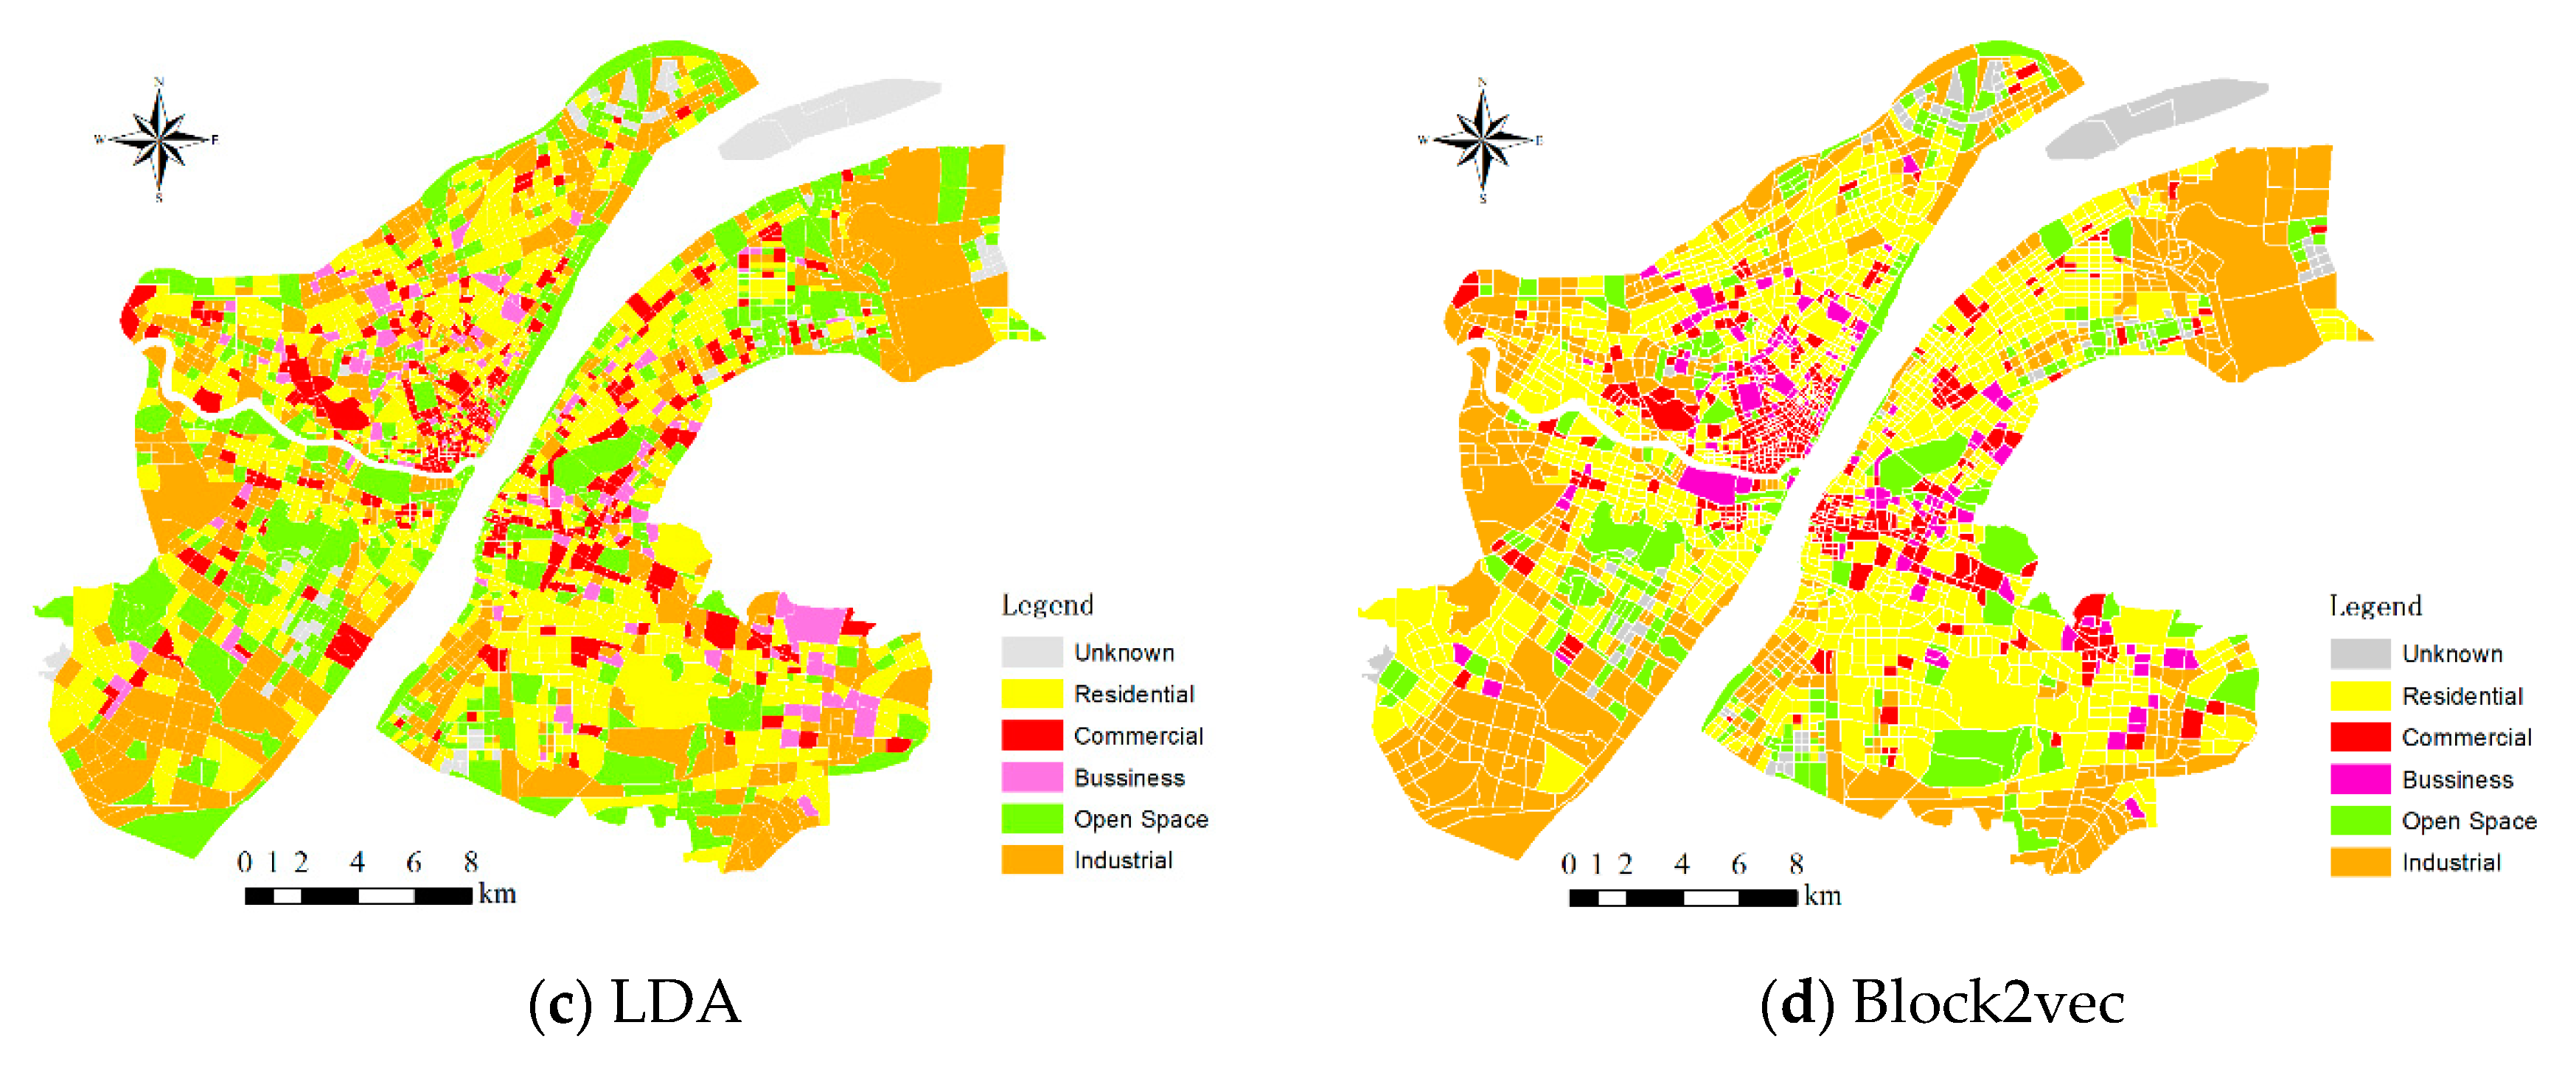
4.1. Identification of the Urban Functional Regions
4.1.1. Urban Functional Regions Aggregation by K-Means Algorithm
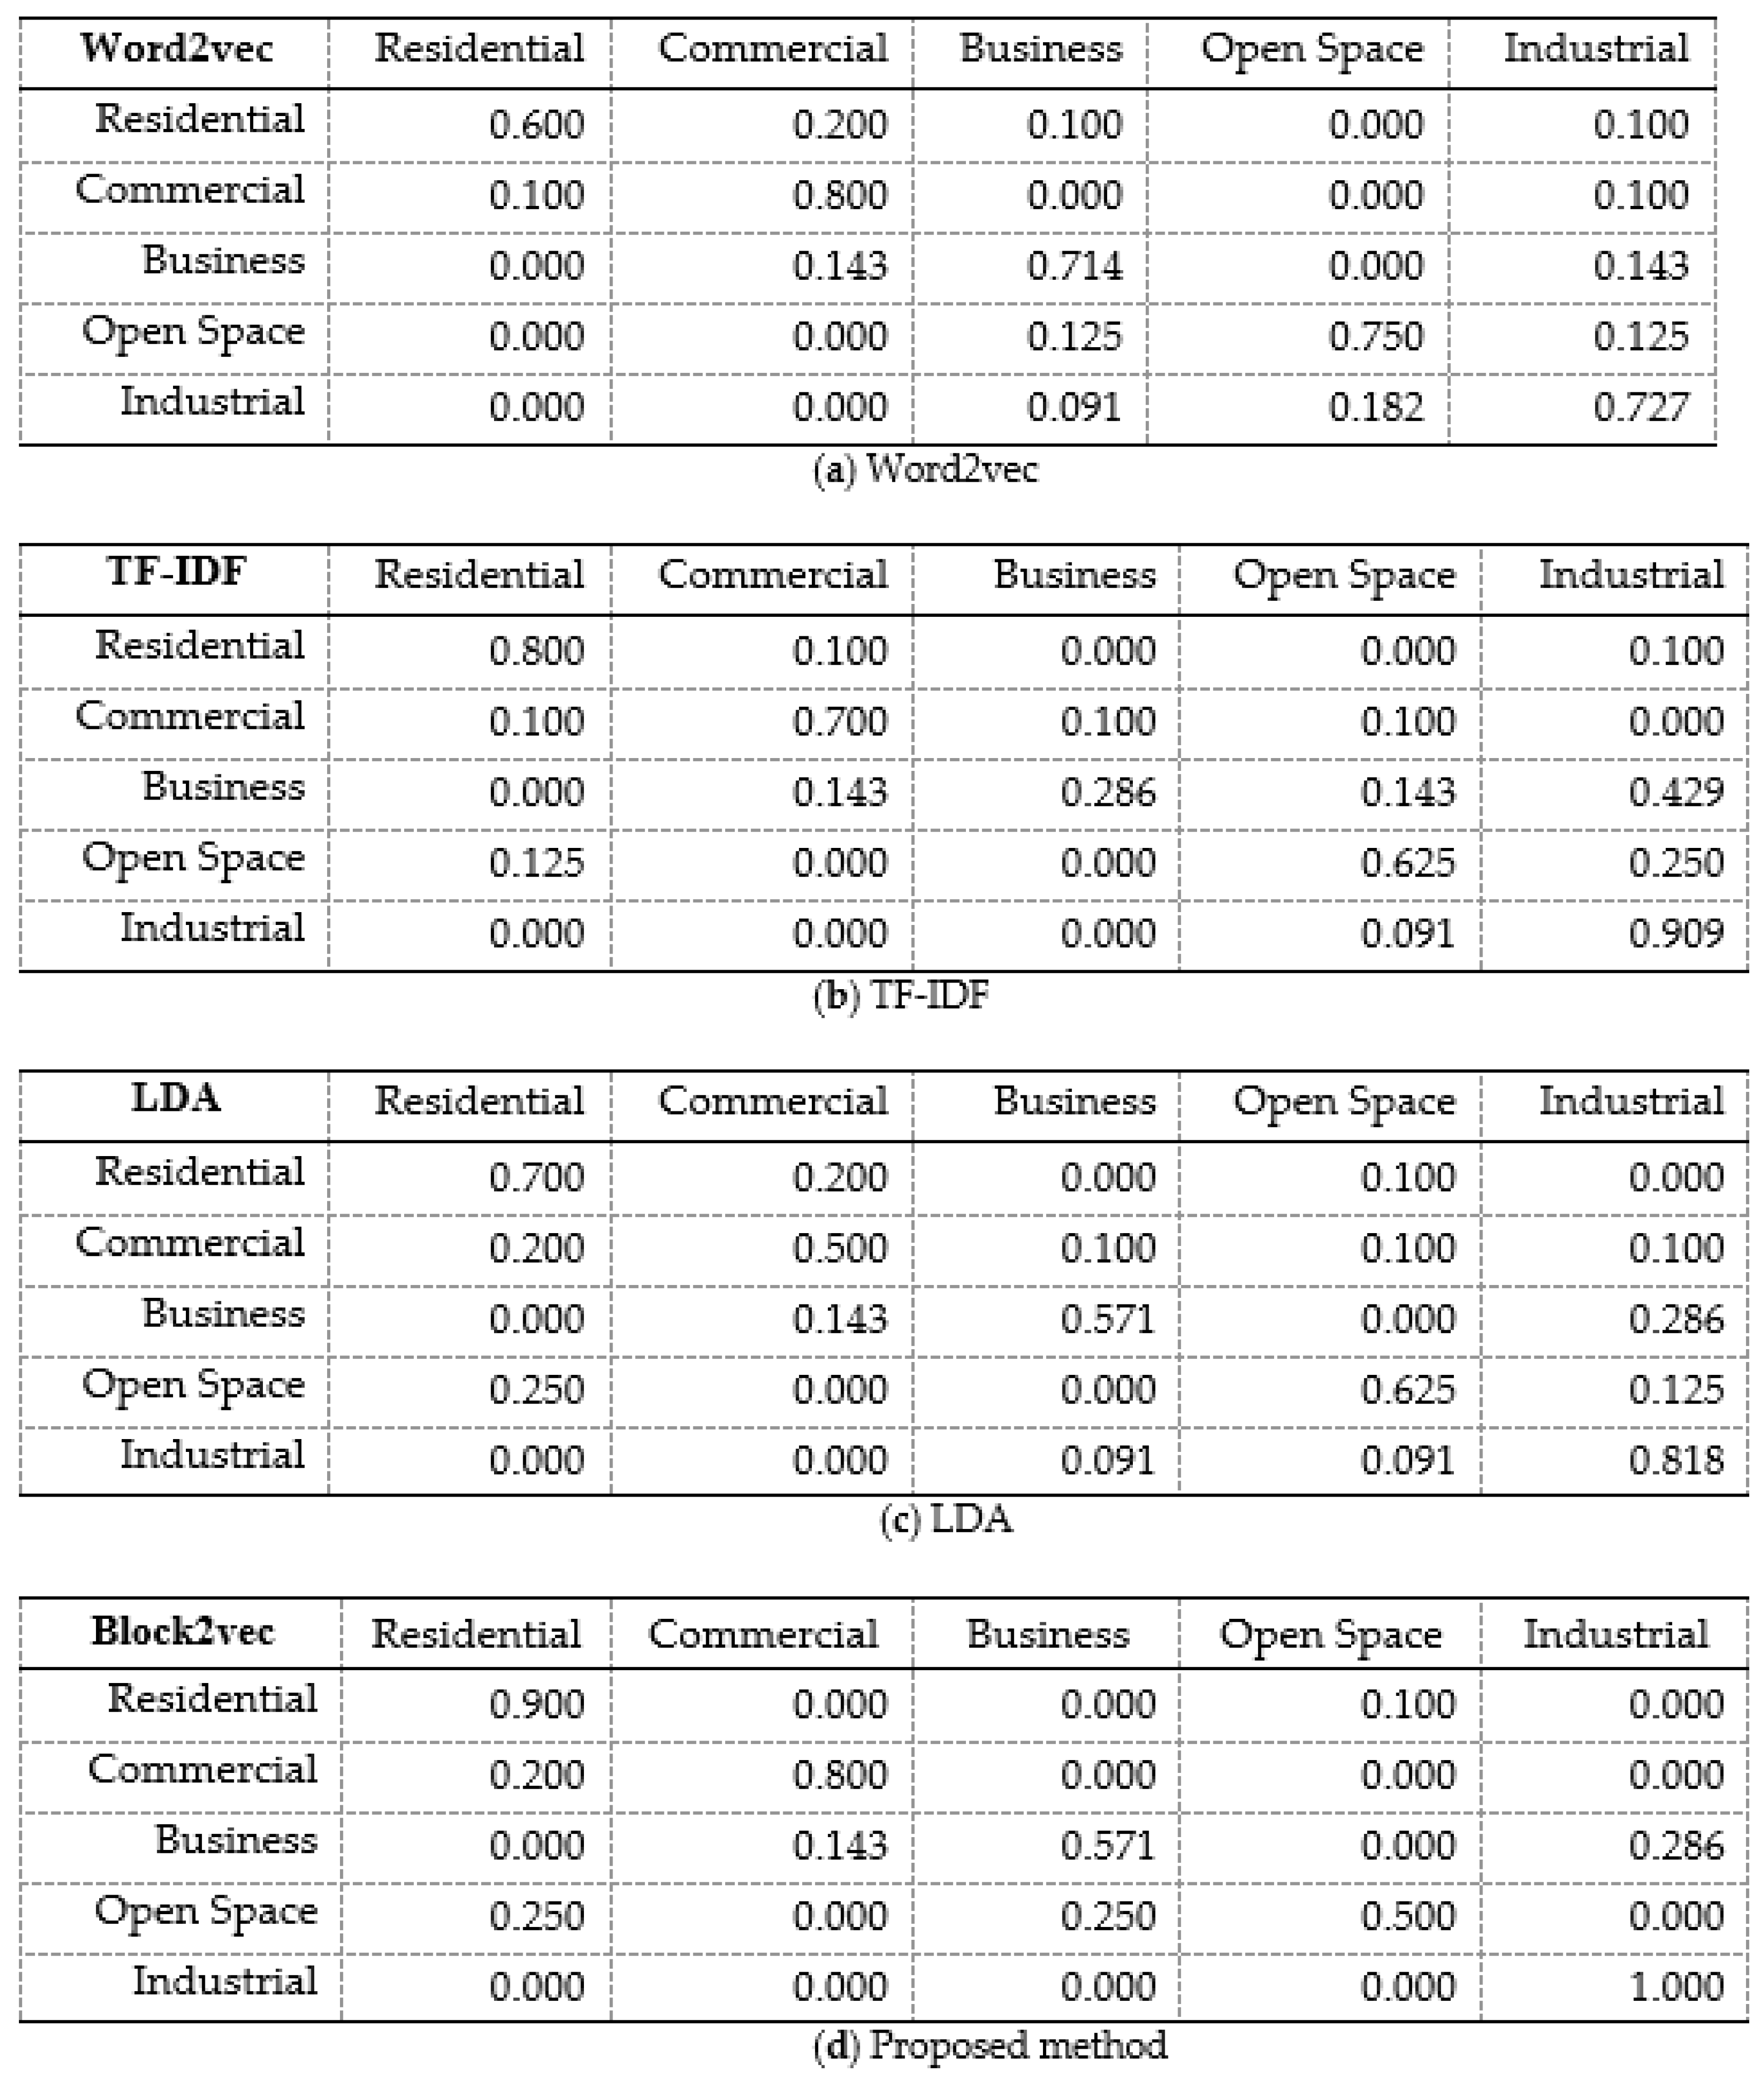
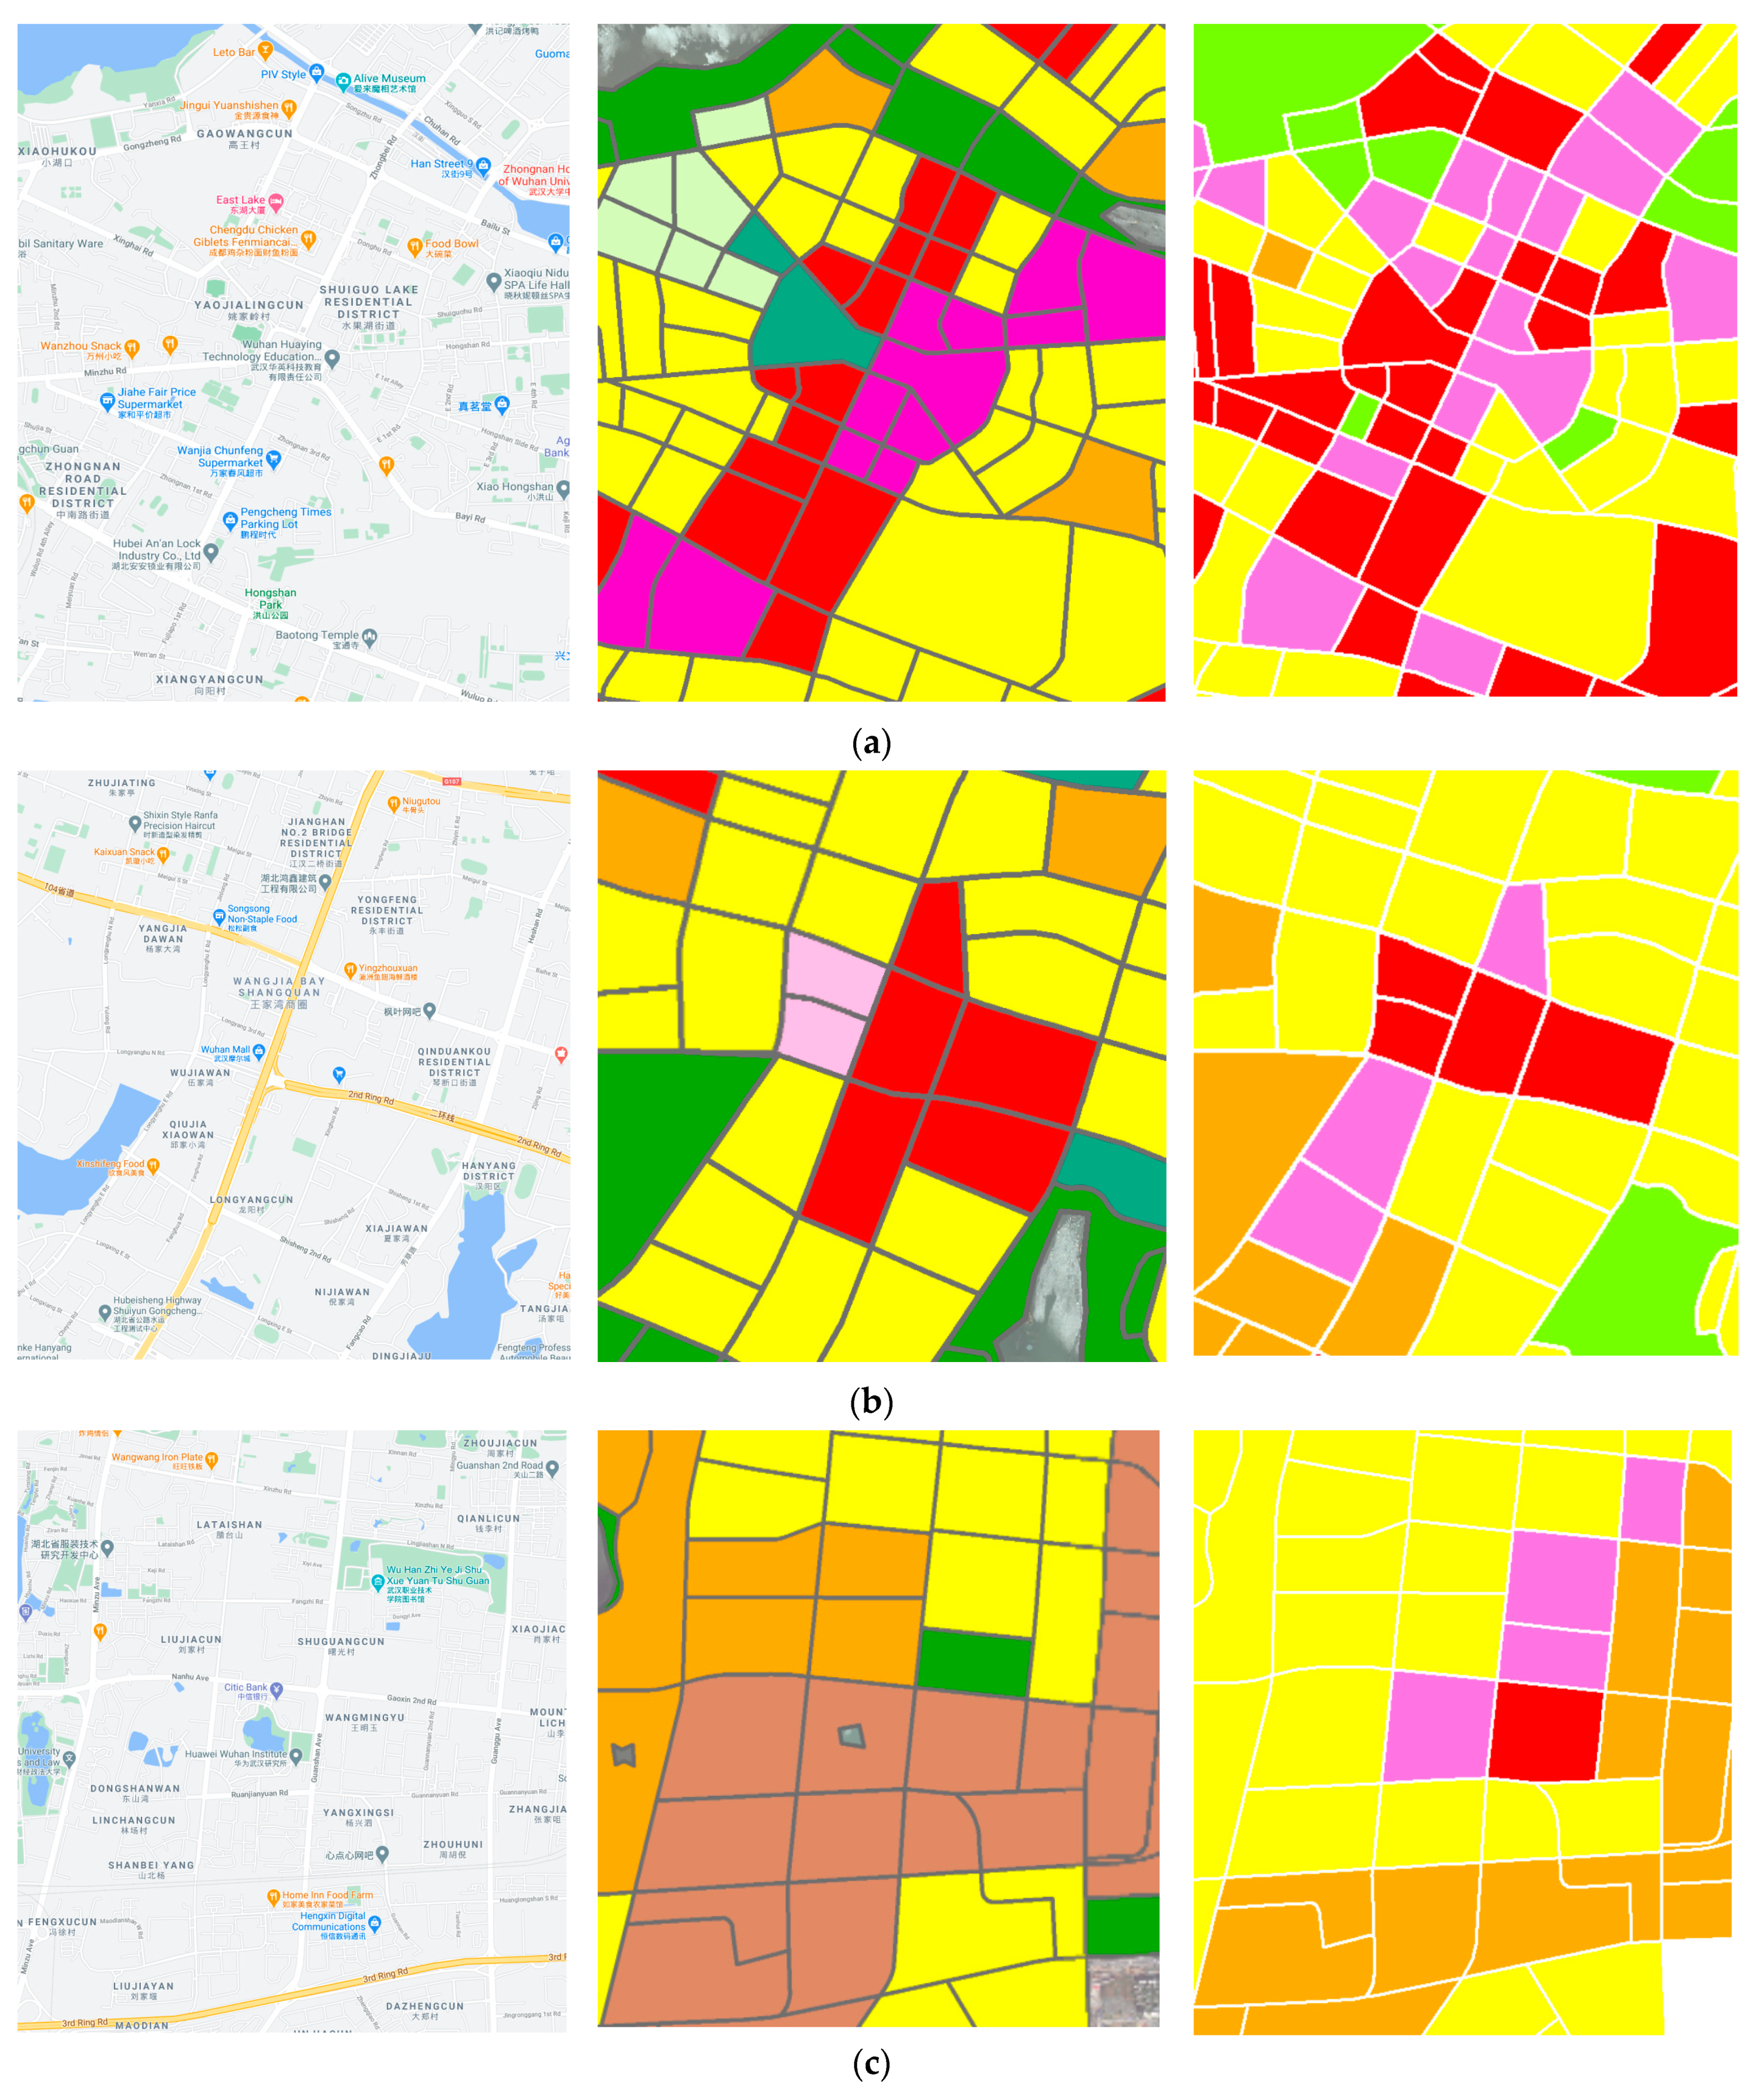
4.1.2. Identification of Urban Functional Regions Based on Random Forest Algorithm
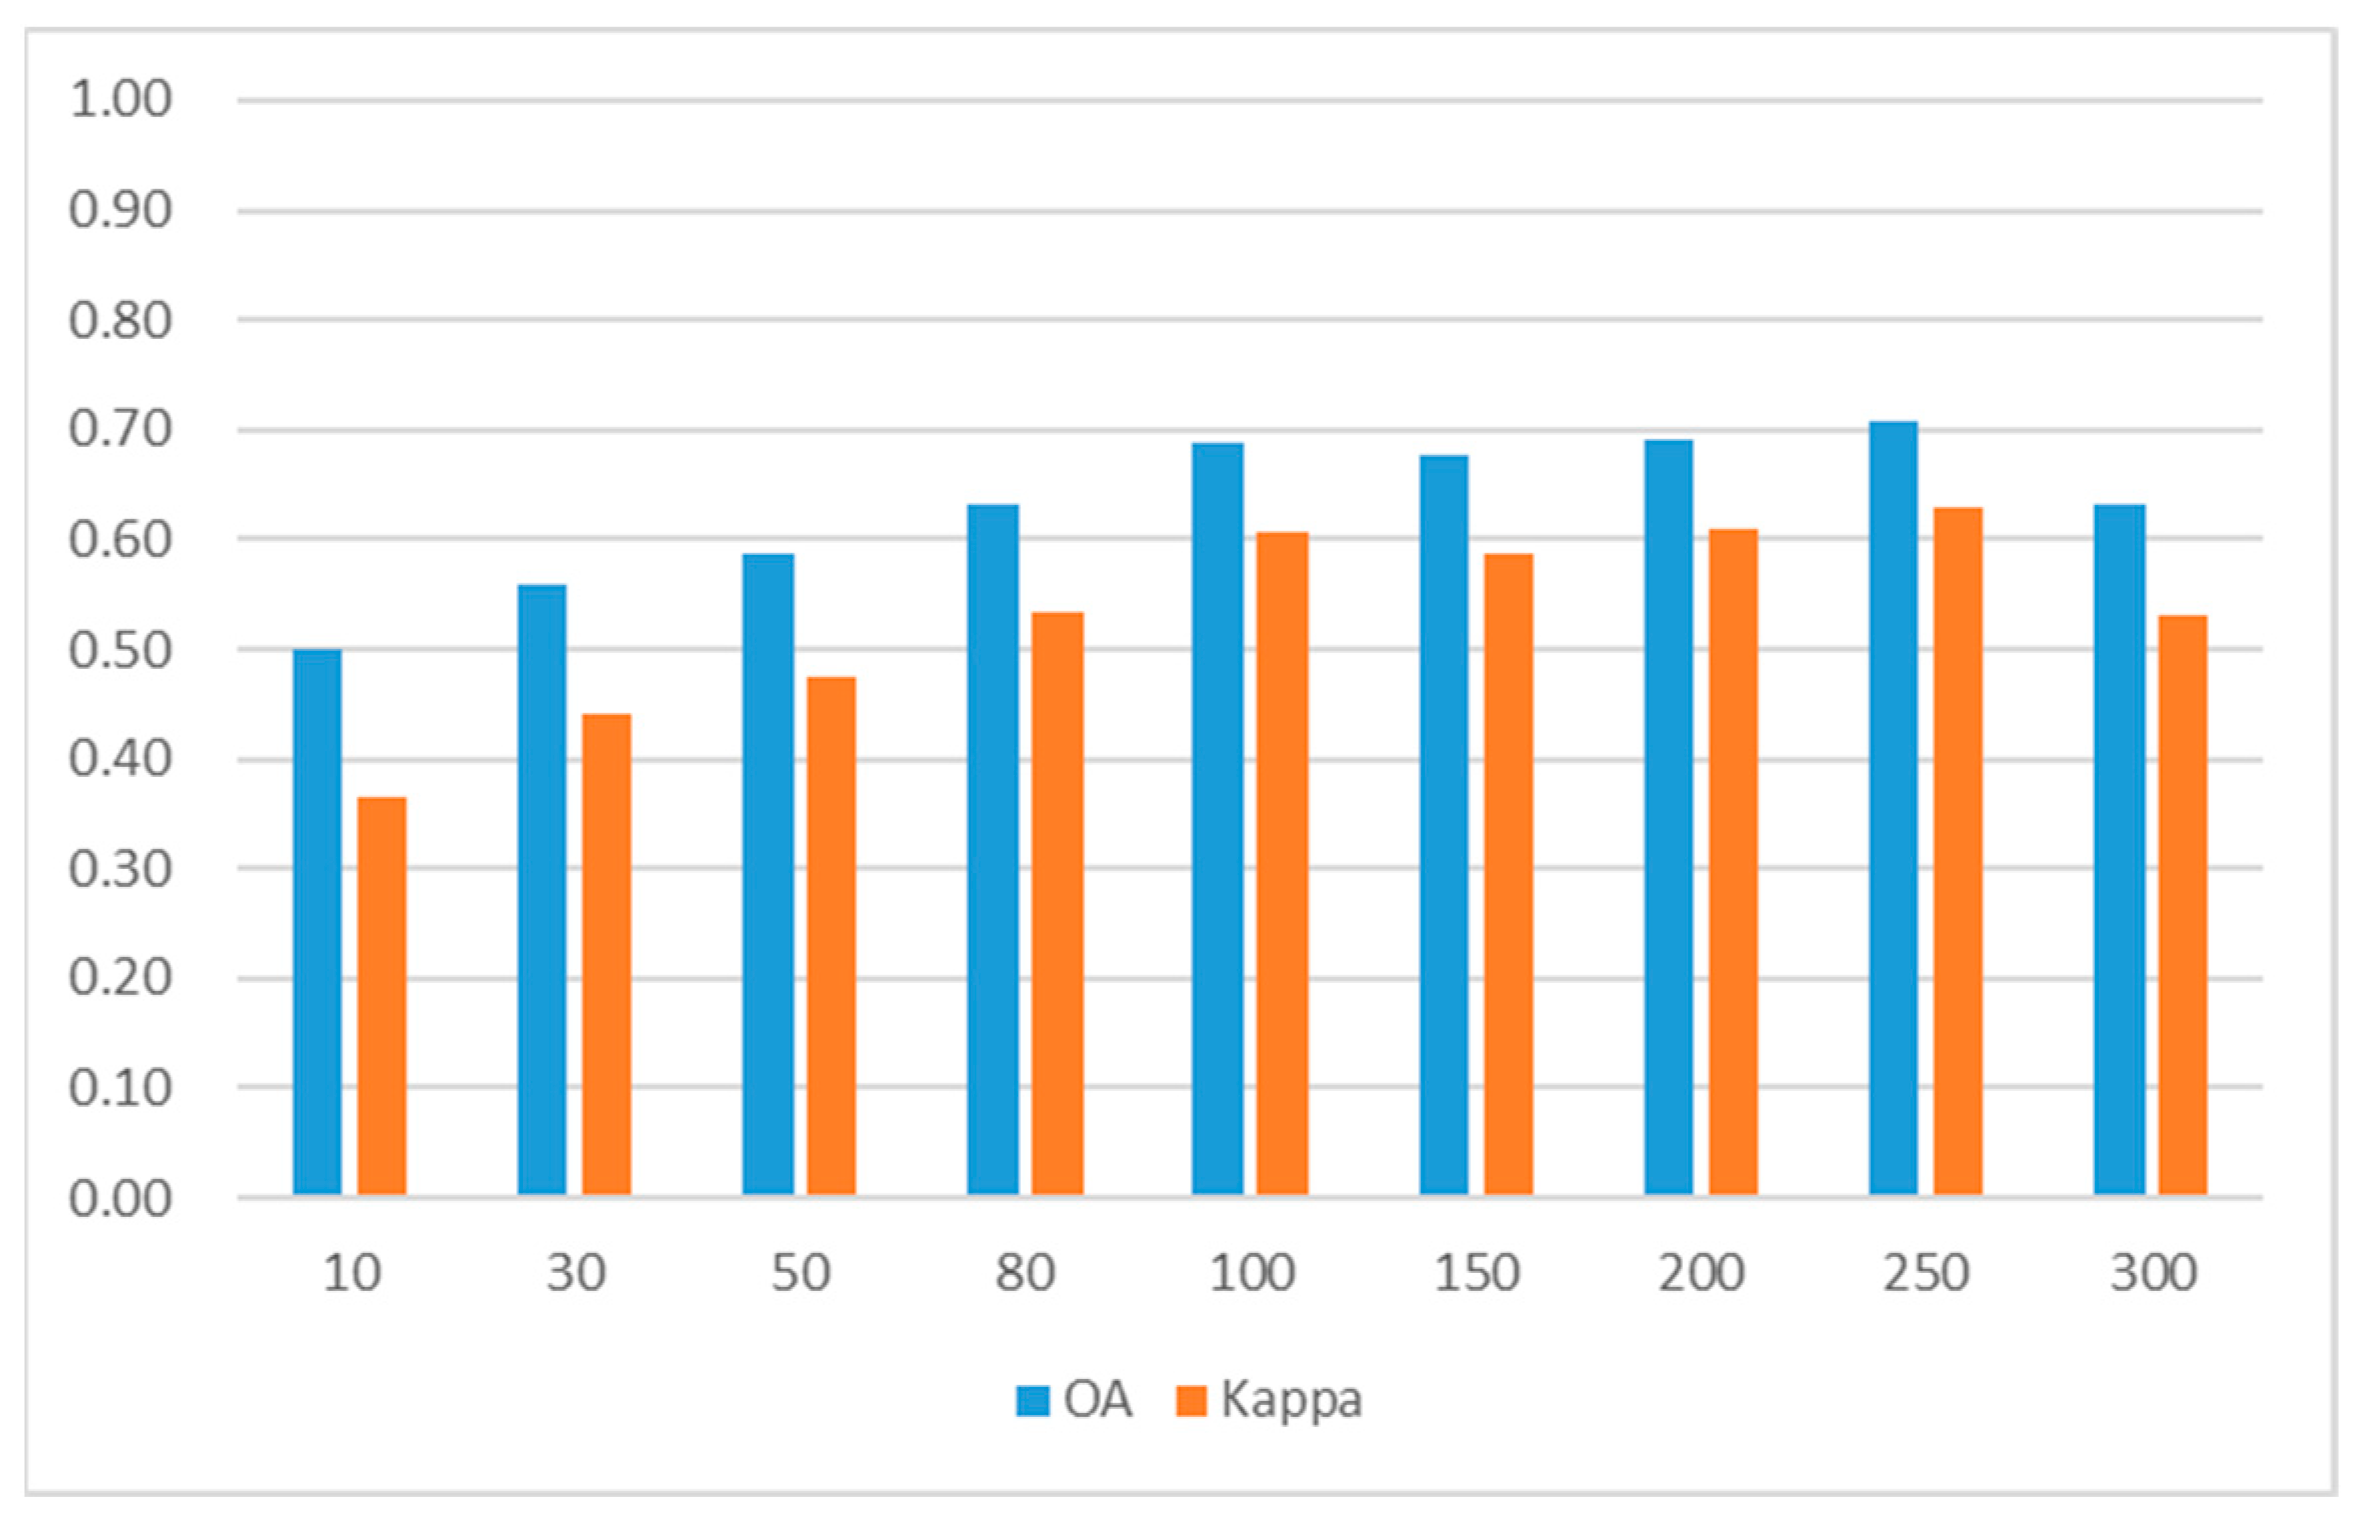
4.2. The Influence of the Size of Latent Semantic Features
5. Discussion
6. Conclusions and Future Work
Author Contributions
Funding
Data Availability Statement
Conflicts of Interest
References
- Zhong, C.; Huang, X.; Müller Arisona, S.; Schmitt, G.; Batty, M. Inferring building functions from a probabilistic model using public transportation data. Comput. Environ. Urban Syst. 2014, 48, 124–137. [Google Scholar] [CrossRef]
- Gao, S.; Janowicz, K.; Couclelis, H. Extracting urban functional regions from points of interest and human activities on location-based social networks. Trans. GIS 2017, 21, 446–467. [Google Scholar] [CrossRef]
- Jin, X.; Long, Y.; Sun, W.; Lu, Y.; Yang, X.; Tang, J. Evaluating cities’ vitality and identifying ghost cities in China with emerging geographical data. Cities 2017, 63, 98–109. [Google Scholar] [CrossRef]
- Yue, Y.; Zhuang, Y.; Yeh, A.G.O.; Xie, J.Y.; Ma, C.L.; Li, Q.Q. Measurements of POI-based mixed use and their relationships with neighbourhood vibrancy. Int. J. Geogr. Inf. Sci. 2017, 31, 658–675. [Google Scholar] [CrossRef] [Green Version]
- Forghani, M.; Karimipour, F. Interplay between urban communities and human-crowd mobility: A study using contributed geospatial data sources. Trans. GIS 2018, 22, 1008–1028. [Google Scholar] [CrossRef]
- Yue, M.; Kang, C.; Andris, C.; Qin, K.; Liu, Y.; Meng, Q. Understanding the interplay between bus, metro, and cab ridership dynamics in Shenzhen, China. Trans. GIS 2018, 22, 855–871. [Google Scholar] [CrossRef]
- Zhang, M.; Zhao, P. The impact of land-use mix on residents’ travel energy consumption: New evidence from Beijing. Transp. Res. Part D Transp. Environ. 2017, 57, 224–236. [Google Scholar] [CrossRef]
- Zhai, W.; Bai, X.; Shi, Y.; Han, Y.; Peng, Z.-R.; Gu, C. Beyond Word2vec: An approach for urban functional region extraction and identification by combining Place2vec and POIs. Comput. Environ. Urban Syst. 2019, 74, 1–12. [Google Scholar] [CrossRef]
- Yuan, J.; Zheng, Y.; Xie, X. Discovering regions of different functions in a city using human mobility and POIs. In Proceedings of the 18th ACM SIGKDD International Conference on Knowledge Discovery and Data Mining—KDD ’12, Beijing, China, 12–16 August 2012. [Google Scholar]
- Yao, Y.; Li, X.; Liu, X.; Liu, P.; Liang, Z.; Zhang, J.; Mai, K. Sensing spatial distribution of urban land use by integrating points-of-interest and Google Word2Vec model. Int. J. Geogr. Inf. Sci. 2017, 31, 825–848. [Google Scholar] [CrossRef]
- Maat, K.; van Wee, B.; Stead, D. Land use and travel behaviour: Expected effects from the perspective of utility theory and activity-based theories. Environ. Plan. B Plan. Des. 2005, 32, 33–46. [Google Scholar] [CrossRef] [Green Version]
- Ellis, E.; Pontius, R. Land-Use and Land-Cover Change. The Encyclopedia of Earth. 2007. Available online: https://ecotope.org/people/ellis/papers/ellis_eoe_lulcc_2007.pdf (accessed on 30 September 2016).
- La Rosa, D.; Privitera, R. Characterization of non-urbanized areas for land-use planning of agricultural and green infrastructure in urban contexts. Landsc. Urban Plan. 2013, 109, 94–106. [Google Scholar] [CrossRef]
- Han, X.; Zhong, Y.; Zhao, B.; Zhang, L. Scene classification based on a hierarchical convolutional sparse auto-encoder for high spatial resolution imagery. Int. J. Remote Sens. 2017, 38, 514–536. [Google Scholar] [CrossRef]
- Zhong, Y.; Fei, F.; Liu, Y.; Zhao, B.; Jiao, H.; Zhang, L. SatCNN: Satellite image dataset classification using agile convolutional neural networks. Remote Sens. Lett. 2017, 8, 136–145. [Google Scholar] [CrossRef]
- Tao, C.; Pan, H.; Li, Y.; Zou, Z. Unsupervised spectral-spatial feature learning with stacked sparse autoencoder for hyperspectral imagery classification. IEEE Geosci. Remote Sens. Lett. 2015, 12, 2438–2442. [Google Scholar] [CrossRef]
- Li, J.; Huang, X.; Zhang, L. Semi-supervised sparse relearning representation classification for high-resolution remote sensing imagery. In Proceedings of the International Geoscience and Remote Sensing Symposium (IGARSS), Beijing, China, 10–15 July 2016. [Google Scholar]
- Mohammadimanesh, F.; Salehi, B.; Mahdianpari, M.; Gill, E.; Molinier, M. A new fully convolutional neural network for semantic segmentation of polarimetric SAR imagery in complex land cover ecosystem. ISPRS J. Photogramm. Remote Sens. 2019, 151, 223–236. [Google Scholar] [CrossRef]
- Li, Y.; Chen, Y.; Liu, G.; Jiao, L. A novel deep fully convolutional network for PolSAR image classification. Remote Sens. 2018, 10, 1984. [Google Scholar] [CrossRef] [Green Version]
- Tao, C.; Chen, S.; Li, Y.; Xiao, S. PolSAR land cover classification based on roll-invariant and selected hidden polarimetric features in the rotation domain. Remote Sens. 2017, 9, 660. [Google Scholar] [CrossRef] [Green Version]
- Tu, W.; Cao, J.; Yue, Y.; Shaw, S.L.; Zhou, M.; Wang, Z.; Chang, X.; Xu, Y.; Li, Q. Coupling mobile phone and social media data: A new approach to understanding urban functions and diurnal patterns. Int. J. Geogr. Inf. Sci. 2017, 30, 2331–2358. [Google Scholar] [CrossRef]
- Liu, Y.; Liu, X.; Gao, S.; Gong, L.; Kang, C.; Zhi, Y.; Chi, G.; Shi, L. Social sensing: A new approach to understanding our socioeconomic environments. Ann. Assoc. Am. Geogr. 2015, 105, 512–530. [Google Scholar] [CrossRef]
- Pei, T.; Sobolevsky, S.; Ratti, C.; Shaw, S.L.; Li, T.; Zhou, C. A new insight into land use classification based on aggregated mobile phone data. Int. J. Geogr. Inf. Sci. 2014, 28, 1988–2007. [Google Scholar] [CrossRef] [Green Version]
- Jia, Y.; Ge, Y.; Ling, F.; Guo, X.; Wang, J.; Wang, L.; Chen, Y.; Li, X. Urban land use mapping by combining remote sensing imagery and mobile phone positioning data. Remote Sens. 2018, 10, 446. [Google Scholar] [CrossRef] [Green Version]
- Liu, X.; He, J.; Yao, Y.; Zhang, J.; Liang, H.; Wang, H.; Hong, Y. Classifying urban land use by integrating remote sensing and social media data. Int. J. Geogr. Inf. Sci. 2017, 31, 1675–1696. [Google Scholar] [CrossRef]
- Toole, J.L.; Ulm, M.; González, M.C.; Bauer, D. Inferring land use from mobile phone activity. In Proceedings of the ACM SIGKDD International Workshop on Urban Computing, Beijing, China, 12 August 2012; pp. 1–8. [Google Scholar]
- Ríos, S.A.; Muñoz, R. Land Use detection with cell phone data using topic models: Case Santiago, Chile. Comput. Environ. Urban Syst. 2017, 61, 39–48. [Google Scholar] [CrossRef]
- Tu, W.; Hu, Z.; Li, L.; Cao, J.; Jiang, J.; Li, Q.; Li, Q. Portraying urban functional zones by coupling remote sensing imagery and human sensing data. Remote Sens. 2018, 10, 141. [Google Scholar] [CrossRef] [Green Version]
- Mao, H.; Ahn, Y.Y.; Bhaduri, B.; Thakur, G. Improving land use inference by factorizing mobile phone call activity matrix. J. Land Use Sci. 2017, 12, 138–153. [Google Scholar] [CrossRef]
- Caceres, N.; Benitez, F.G. Supervised land use inference from mobility patterns. J. Adv. Transp. 2018, 2018, 8710402. [Google Scholar] [CrossRef]
- Pan, G.; Qi, G.; Wu, Z.; Zhang, D.; Li, S. Land-use classification using taxi GPS traces. IEEE Trans. Intell. Transp. Syst. 2013, 14, 113–123. [Google Scholar] [CrossRef]
- Liu, X.; Kang, C.; Gong, L.; Liu, Y. Incorporating spatial interaction patterns in classifying and understanding urban land use. Int. J. Geogr. Inf. Sci. 2016, 30, 334–350. [Google Scholar] [CrossRef]
- Wang, Y.; Gu, Y.; Dou, M.; Qiao, M. Using spatial semantics and interactions to identify urban functional regions. ISPRS Int. J. Geo Inf. 2018, 7, 130. [Google Scholar] [CrossRef] [Green Version]
- Long, Y.; Shen, Z. Discovering functional zones using bus smart card data and points of interest in Beijing. In Geospatial Analysis to Support Urban Planning in Beijing; Springer: Cham, Switzerland, 2015; Volume 116, pp. 193–217. [Google Scholar] [CrossRef] [Green Version]
- Frias-Martinez, V.; Frias-Martinez, E. Spectral clustering for sensing urban land use using Twitter activity. Eng. Appl. Artif. Intell. 2014, 35, 237–245. [Google Scholar] [CrossRef] [Green Version]
- Zhang, Y.; Li, Q.; Tu, W.; Mai, K.; Yao, Y.; Chen, Y. Functional urban land use recognition integrating multi-source geospatial data and cross-correlations. Comput. Environ. Urban Syst. 2019, 78, 101374. [Google Scholar] [CrossRef]
- Jiang, S.; Alves, A.; Rodrigues, F.; Ferreira, J.; Pereira, F.C. Mining point-of-interest data from social networks for urban land use classification and disaggregation. Comput. Environ. Urban Syst. 2015, 53, 36–46. [Google Scholar] [CrossRef] [Green Version]
- Liu, X.; Long, Y. Automated identification and characterization of parcels with OpenStreetMap and points of interest. Environ. Plan. B Plan. Des. 2016, 43, 341–360. [Google Scholar] [CrossRef]
- Yu, Z.; Capra, L.; Wolfson, O.; Yang, H. Urban computing: Concepts, methodologies, and applications. ACM Trans. Intell. Syst. Technol. 2014, 5, 1–55. [Google Scholar] [CrossRef]
- Yuan, N.J.; Zheng, Y.; Xie, X.; Wang, Y.; Zheng, K.; Xiong, H. Discovering urban functional zones using latent activity trajectories. IEEE Trans. Knowl. Data Eng. 2015, 27, 712–725. [Google Scholar] [CrossRef]
- Chen, Y.; Liu, X.; Li, X.; Liu, X.; Yao, Y.; Hu, G.; Xu, X.; Pei, F. Delineating urban functional areas with building-level social media data: A dynamic time warping (DTW) distance based k-medoids method. Landsc. Urban Plan. 2017, 160, 48–60. [Google Scholar] [CrossRef]
- Yan, B.; Mai, G.; Janowicz, K.; Gao, S. From ITDL to Place2Vec—Reasoning about place type similarity and relatedness by learning embeddings from augmented spatial contexts. In Proceedings of the GIS ACM International Symposium on Advances in Geographic Information Systems, Redondo Beach, CA, USA, 7–10 November 2017. [Google Scholar]
- Yao, Y.; Liang, H.; Li, X.; Zhang, J.; He, J. Sensing urban land-use patterns by integrating Google Tensorflow and scene-classification models. Int. Arch. Photogramm. Remote Sens. Spatial Inf. Sci. 2017, XLII-2/W7, 981–988. [Google Scholar] [CrossRef] [Green Version]
- Kiros, R.; Zhu, Y.; Salakhutdinov, R.; Zemel, R.S.; Torralba, A.; Urtasun, R.; Fidler, S. Skip-thought vectors. In Proceedings of the NIPS’15: 28th International Conference on Neural Information Processing Systems, Montreal, QC, Canada, 8–13 December 2014; MIT Press: Cambridge, MA, USA, 2015. [Google Scholar]
- Sutskever, I.; Vinyals, O.; Le, Q.V. Sequence to sequence learning with neural networks. In Proceedings of the NIPS’15: 28th International Conference on Neural Information Processing Systems, Montreal, QC, Canada, 8–13 December 2014; MIT Press: Cambridge, MA, USA, 2015. [Google Scholar]
- Sundermeyer, M.; Schlüter, R.; Ney, H. LSTM neural networks for language modeling. In Proceedings of the 13th Annual Conference of the International Speech Communication Association, INTERSPEECH 2012, Portland, OR, USA, 9–13 September 2012. [Google Scholar]
- Cho, K.; van Merriënboer, B.; Gulcehre, C.; Bahdanau, D.; Bougares, F.; Schwenk, H.; Bengio, Y. Learning phrase representations using RNN encoder-decoder for statistical machine translation. In Proceedings of the EMNLP 2014 Conference on Empirical Methods in Natural Language Processing, Doha, Qatar, 25–29 October 2014. [Google Scholar]
- Wang, S.; Cao, J.; Chen, H.; Peng, H.; Huang, Z. SeqST-GAN: Seq2Seq generative adversarial nets for multi-step urban crowd flow prediction. ACM Trans. Spat. Algorithms Syst. 2020, 6, 22. [Google Scholar] [CrossRef]
- Rousseeuw, P.J. Silhouettes: A graphical aid to the interpretation and validation of cluster analysis. J. Comput. Appl. Math. 1987, 20, 53–65. [Google Scholar] [CrossRef] [Green Version]
- Breiman, L. Random Forrest. Mach. Learn. 2001, 45, 5–32. [Google Scholar] [CrossRef] [Green Version]
- Biau, G. Analysis of a random forests model. J. Mach. Learn. Res. 2012, 13, 1063–1095. [Google Scholar]
- Liénou, M.; Maître, H.; Datcu, M. Semantic annotation of satellite images using latent dirichlet allocation. IEEE Geosci. Remote Sens. Lett. 2010, 7, 28–32. [Google Scholar] [CrossRef]
- Liu, X.; Andris, C.; Rahimi, S. Place niche and its regional variability: Measuring spatial context patterns for points of interest with representation learning. Comput. Environ. Urban Syst. 2019, 75, 146–160. [Google Scholar] [CrossRef]


| Code | POI Category | Proportions | Code | POI Category | Proportions |
|---|---|---|---|---|---|
| 1 | Car service | 1.18% | 11 | Tourism Attraction | 0.37% |
| 2 | Car repair | 0.24% | 12 | Residence | 4.59% |
| 3 | Car sales | 0.62% | 13 | Governmental and Public Organizations | 1.77% |
| 4 | Motorcycle Service | 0.04% | 14 | Science and Education | 3.93% |
| 5 | Catering Service | 16.60% | 15 | Transportation facilities | 3.39% |
| 6 | Shopping Mall | 23.79% | 16 | Bank/Financial | 1.54% |
| 7 | Living Service | 11.75% | 17 | Factory | 6.50% |
| 8 | Sports and Recreation | 2.37% | 18 | Road Facility | 0.02% |
| 9 | Hospital | 2.56% | 19 | Address and Location | 15.78% |
| 10 | Accommodation Services | 1.99% | 20 | Public Facility | 0.96% |
| Methods | Overall Accuracy | Kappa Score |
|---|---|---|
| Word2vec | 0.6657 ± 0.0137 | 0.5769 ± 0.0173 |
| TF-IDF | 0.6486 ± 0.0254 | 0.5523 ± 0.0330 |
| LDA | 0.5972 ± 0.0196 | 0.5014 ± 0.0249 |
| Block2vec | 0.7186 ± 0.0186 | 0.6429 ± 0.0237 |
Publisher’s Note: MDPI stays neutral with regard to jurisdictional claims in published maps and institutional affiliations. |
© 2021 by the authors. Licensee MDPI, Basel, Switzerland. This article is an open access article distributed under the terms and conditions of the Creative Commons Attribution (CC BY) license (https://creativecommons.org/licenses/by/4.0/).
Share and Cite
Sun, Z.; Jiao, H.; Wu, H.; Peng, Z.; Liu, L. Block2vec: An Approach for Identifying Urban Functional Regions by Integrating Sentence Embedding Model and Points of Interest. ISPRS Int. J. Geo-Inf. 2021, 10, 339. https://doi.org/10.3390/ijgi10050339
Sun Z, Jiao H, Wu H, Peng Z, Liu L. Block2vec: An Approach for Identifying Urban Functional Regions by Integrating Sentence Embedding Model and Points of Interest. ISPRS International Journal of Geo-Information. 2021; 10(5):339. https://doi.org/10.3390/ijgi10050339
Chicago/Turabian StyleSun, Zhihao, Hongzan Jiao, Hao Wu, Zhenghong Peng, and Lingbo Liu. 2021. "Block2vec: An Approach for Identifying Urban Functional Regions by Integrating Sentence Embedding Model and Points of Interest" ISPRS International Journal of Geo-Information 10, no. 5: 339. https://doi.org/10.3390/ijgi10050339