
Built Environment Accessibility and Disability as Predictors of Well-Being among Older Adults: A Norwegian Cross-Sectional Study

 , ,
, ,
Abstract
:1. Introduction
2. Materials and Methods
2.1. Data
2.2. Variables
2.2.1. Independent Variables
2.2.2. Dependent Variables
2.2.3. Demographic Variables
2.2.4. Statistical Analysis
3. Results
3.1. Participants’ Characteristics
3.2. Descriptive Statistics
3.3. Interaction Effect between Disability and the Built Environment on Indicators of Well-Being
4. Discussion
5. Conclusions
Supplementary Materials
Author Contributions
Funding
Institutional Review Board Statement
Informed Consent Statement
Data Availability Statement
Acknowledgments
Conflicts of Interest
References
- World Health Organization. Global Report on Health Equity for Persons with Disabilities. Available online: https://www.who.int/publications/i/item/9789240063600 (accessed on 26 February 2023).
- United Nations Department of Economic and Social Affairs. Disability and Development Report: Realizing the Sustainable Development Goals by, for and with Persons with Disabilities. Available online: https://www.un.org/development/desa/disabilities/publication-disability-sdgs.html (accessed on 1 March 2023).
- World Health Organization. World Report on Disability. Available online: https://www.who.int/publications/i/item/9789241564182 (accessed on 12 December 2022).
- Marmot, M. The Health Gap: The Challenge of an Unequal World. Lancet 2015, 386, 2442–2444. [Google Scholar] [CrossRef]
- Vos, T.; Lim, S.S.; Abbafati, C.; Abbas, K.M.; Abbasi, M.; Abbasifard, M.; Abbasi-Kangevari, M.; Abbastabar, H.; Abd-Allah, F.; Abdelalim, A.; et al. Global Burden of 369 Diseases and Injuries in 204 Countries and Territories, 1990–2019: A Systematic Analysis for the Global Burden of Disease Study 2019. Lancet 2020, 396, 1204–1222. [Google Scholar] [CrossRef]
- World Health Organization. Decade of Healthy Ageing: Baseline Report. Available online: https://www.who.int/publications/i/item/9789240017900 (accessed on 5 January 2023).
- United Nations Department of Economic and Social Affairs. World Population Ageing 2019: Highlights; United Nations: New York, NY, USA, 2020; p. 60. [CrossRef]
- World Health Organization. World Report on Ageing and Health. Available online: https://www.who.int/publications/i/item/9789241565042 (accessed on 3 January 2023).
- World Health Organization. Who Policy on Disability. Available online: https://www.who.int/publications/i/item/9789240020627 (accessed on 6 February 2023).
- Jerez-Roig, J.; Bosque-Prous, M.; Giné-Garriga, M.; Bagur-Calafat, C.; Bezerra de Souza, D.L.; Teixidó-Compañó, E.; Espelt, A. Regional Differences in the Profile of Disabled Community-Dwelling Older Adults: A European Population-Based Cross-Sectional Study. PLoS ONE 2018, 13, e0208946. [Google Scholar] [CrossRef]
- Okoro, C.A.; Dhingra, S.S. Severity of Psychological Distress among Adults with and without Disabilities. Soc. Work Public Health 2014, 29, 671–685. [Google Scholar] [CrossRef]
- Hsieh, N.; Waite, L. Disability, Psychological Well-Being, and Social Interaction in Later Life in China. Res. Aging 2019, 41, 362–389. [Google Scholar] [CrossRef]
- McCaffery, J.M.; Anderson, A.; Coday, M.; Espeland, M.A.; Gorin, A.A.; Johnson, K.C.; Knowler, W.C.; Myers, C.A.; Rejeski, W.J.; Steinberg, H.O.; et al. Loneliness Relates to Functional Mobility in Older Adults with Type 2 Diabetes: The Look Ahead Study. J. Aging Res. 2020, 2020, 7543702. [Google Scholar] [CrossRef]
- Fässberg, M.M.; Cheung, G.; Canetto, S.S.; Erlangsen, A.; Lapierre, S.; Lindner, R.; Draper, B.; Gallo, J.J.; Wong, C.; Wu, J.; et al. A Systematic Review of Physical Illness, Functional Disability, and Suicidal Behaviour among Older Adults. Aging Ment. Health 2016, 20, 166–194. [Google Scholar] [CrossRef]
- Portella, A.A. Built Environment. In Encyclopedia of Quality of Life and Well-Being Research, 1st ed.; Michalos, A.C., Ed.; Springer: Dordrecht, The Netherlands, 2014; pp. 454–461. [Google Scholar] [CrossRef]
- Martin, J.J. Benefits and Barriers to Physical Activity for Individuals with Disabilities: A Social-Relational Model of Disability Perspective. Disabil. Rehabil. 2013, 35, 2030–2037. [Google Scholar] [CrossRef]
- Abdi, S.; Spann, A.; Borilovic, J.; de Witte, L.; Hawley, M. Understanding the Care and Support Needs of Older People: A Scoping Review and Categorisation Using the Who International Classification of Functioning, Disability and Health Framework (ICF). BMC Geriatr. 2019, 19, 195. [Google Scholar] [CrossRef]
- Rosenberg, D.E.; Huang, D.L.; Simonovich, S.D.; Belza, B. Outdoor Built Environment Barriers and Facilitators to Activity among Midlife and Older Adults with Mobility Disabilities. Gerontologist 2013, 53, 268–279. [Google Scholar] [CrossRef]
- Levasseur, M.; Généreux, M.; Bruneau, J.F.; Vanasse, A.; Chabot, É.; Beaulac, C.; Bédard, M.M. Importance of Proximity to Resources, Social Support, Transportation and Neighborhood Security for Mobility and Social Participation in Older Adults: Results from a Scoping Study. BMC Public Health 2015, 15, 503. [Google Scholar] [CrossRef]
- Cramm, J.M.; Van Dijk, H.M.; Nieboer, A.P. The Creation of Age-Friendly Environments Is Especially Important to Frail Older People. Ageing Soc. 2018, 38, 700–720. [Google Scholar] [CrossRef]
- Roy, N.; Dubé, R.; Després, C.; Freitas, A.; Légaré, F. Choosing between Staying at Home or Moving: A Systematic Review of Factors Influencing Housing Decisions among Frail Older Adults. PLoS ONE 2018, 13, e0189266. [Google Scholar] [CrossRef]
- White, D.K.; Jette, A.M.; Felson, D.T.; Lavalley, M.P.; Lewis, C.E.; Torner, J.C.; Nevitt, M.C.; Keysor, J.J. Are Features of the Neighborhood Environment Associated with Disability in Older Adults? Disabil. Rehabil. 2010, 32, 639–645. [Google Scholar] [CrossRef]
- Ma, T.; Kobel, C.; Ivers, R. Older People’s out-of-Home Mobility and Wellbeing in Australia: Personal, Built Environment, and Transportation Factors Associated with Unmet Mobility Needs. Front. Public Health 2023, 11, 1–7. [Google Scholar] [CrossRef]
- Anthun, K.S.; Maass, R.E.; Hope, S.; Espnes, G.A.; Bell, R.; Khan, M.; Lillefjell, M. Addressing Inequity: Evaluation of an Intervention to Improve Accessibility and Quality of a Green Space. Int. J. Environ. Res. Public Health 2019, 16, 5015. [Google Scholar] [CrossRef]
- Lamanna, M.; Klinger, C.A.; Liu, A.; Mirza, R.M. The Association between Public Transportation and Social Isolation in Older Adults: A Scoping Review of the Literature. Can. J. Aging. 2020, 39, 393–405. [Google Scholar] [CrossRef]
- Maass, R.; Lindström, B.; Lillefjell, M. Neighborhood-Resources for the Development of a Strong Soc and the Importance of Understanding Why and How Resources Work: A Grounded Theory Approach. BMC Public Health 2017, 17, 704. [Google Scholar] [CrossRef]
- Yuan, Y.; Huang, F.; Lin, F.; Zhu, P.; Zhu, P. Green Space Exposure on Mortality and Cardiovascular Outcomes in Older Adults: A Systematic Review and Meta-Analysis of Observational Studies. Aging Clin. Exp. Res. 2021, 33, 1783–1797. [Google Scholar] [CrossRef]
- Choi, Y.J. Age-Friendly Features in Home and Community and the Self-Reported Health and Functional Limitation of Older Adults: The Role of Supportive Environments. J. Urban Health 2020, 97, 471–485. [Google Scholar] [CrossRef]
- Au, A.M.L.; Chan, S.C.Y.; Yip, H.M.; Kwok, J.Y.C.; Lai, K.Y.; Leung, K.M.; Lee, A.L.F.; Lai, D.W.L.; Tsien, T.; Lai, S.M.K. Age-Friendliness and Life Satisfaction of Young-Old and Old-Old in Hong Kong. Curr. Gerontol. Geriatr. Res. 2017, 2017, 1–10. [Google Scholar] [CrossRef]
- Matsuda, N.; Murata, S.; Torizawa, K.; Isa, T.; Ebina, A.; Kondo, Y.; Tsuboi, Y.; Fukuta, A.; Okumura, M.; Shigemoto, C.; et al. Association between Public Transportation Use and Loneliness among Urban Elderly People Who Stop Driving. Gerontol. Geriatr. Med. 2019, 5, 1–5. [Google Scholar] [CrossRef]
- Frieden, T.R. A Framework for Public Health Action: The Health Impact Pyramid. Am. J. Public Health 2010, 100, 590–595. [Google Scholar] [CrossRef]
- WHO Regional Office for Europe. Age-Friendly Environments in Europe: Indicators, Monitoring and Assessments. Available online: https://www.who.int/europe/publications/i/item/WHO-EURO-2018-1088-40834-55192 (accessed on 23 February 2023).
- About the Global Network for Age-Friendly Cities and Communities. Available online: https://extranet.who.int/agefriendlyworld/who-network/ (accessed on 1 March 2023).
- Norwegian Ministry of Health and Care Services. More Years—More Opportunities: The Norwegian Government’s Strategy for an Age-Friendly Society. Available online: https://www.regjeringen.no/en/dokumenter/more-years--more-opportunities/id2477934/ (accessed on 15 November 2022).
- World Health Organization. Who Global Disability Action Plan 2014–2021: Better Health for All People with Disability. Available online: https://www.who.int/publications/i/item/who-global-disability-action-plan-2014–2021 (accessed on 2 March 2023).
- Timeline: News from Norwegian Ministries about the Coronavirus Disease COVID-19. Available online: https://www.regjeringen.no/en/topics/koronavirus-covid-19/timeline-for-news-from-norwegian-ministries-about-the-coronavirus-disease-covid-19/id2692402/ (accessed on 26 April 2023).
- World Health Organization. How to Use the ICF: A Practical Manual for Using the International Classification of Functioning, Disability and Health. Available online: https://www.who.int/publications/m/item/how-to-use-the-icf---a-practical-manual-for-using-the-international-classification-of-functioning-disability-and-health (accessed on 10 December 2022).
- Diener, E. New Findings and Future Directions for Subjective Well-Being Research. Am. Psychol. 2012, 67, 590–597. [Google Scholar] [CrossRef]
- Nes, R.B.; Hansen, T.; Barstad, A. Livskvalitet: Anbefalinger for Et Bedre Målesystem. [Quality of Life: Recommendations for a National Measurement System]. Available online: https://www.fhi.no/publ/2018/livskvalitet.-anbefalinger-for-et-bedre-malesystem/ (accessed on 5 February 2023).
- Hughes, M.E.; Waite, L.J.; Hawkley, L.C.; Cacioppo, J.T. A Short Scale for Measuring Loneliness in Large Surveys: Results from Two Population-Based Studies. Res. Aging 2004, 26, 655–672. [Google Scholar] [CrossRef]
- Schmalbach, B.; Zenger, M.; Tibubos, A.N.; Kliem, S.; Petrowski, K.; Brähler, E. Psychometric Properties of Two Brief Versions of the Hopkins Symptom Checklist: Hscl-5 and Hscl-10. Assessment 2019, 28, 617–631. [Google Scholar] [CrossRef]
- Cohen, J. Statistical Power Analysis for the Behavioral Sciences, 2nd ed.; Routledge: New York, NY, USA, 1988; p. 567. [Google Scholar] [CrossRef]
- Knapstad, M.; Nilsen, T.S.; Aarø, L.E.; Schønning, A.; Nes, R.; Skogen, J.C. Folkehelseundersøkinga i Møre Og Romsdal: Framgangsmåte Og Utvalde Resultat. [Public Health Survey in Møre Og Romsdal: Procedure and Selected Results]. Available online: https://www.fhi.no/publ/2021/folkehelseundersokinga-i-more-og-romsdal-2021/ (accessed on 4 November 2022).
- Truong, L.T.; Somenahalli, S.V.C. Exploring Frequency of Public Transport Use among Older Adults: A Study in Adelaide, Australia. Travel Behav. Soc. 2015, 2, 148–155. [Google Scholar] [CrossRef]
- Herbolsheimer, F.; Mahmood, A.; Ungar, N.; Michael, Y.L.; Oswald, F.; Chaudhury, H. Perceptions of the Neighborhood Built Environment for Walking Behavior in Older Adults Living in Close Proximity. J. Appl. Gerontol. 2020, 40, 1697–1705. [Google Scholar] [CrossRef]
- Skog, O.-J. The Prevention Paradox Revisited. Addiction 1999, 94, 751–757. [Google Scholar] [CrossRef]
- Lesorogol, C.; Baumann, A.A.; Eyler, A.; Metzger, M.W.; Reis, R.S.; Tabak, R.G. Building Healthy, Diverse and Thriving Communities. In Toward a Livable Life: A 21st Century Agenda for Social Work; Rank, M.R., Ed.; Oxford University Press: New York, NY, USA, 2020; pp. 211–232. [Google Scholar]
- Lämås, K.; Bölenius, K.; Sandman, P.-O.; Bergland, Å.; Lindkvist, M.; Edvardsson, D. Thriving among Older People Living at Home with Home Care Services—A Cross-Sectional Study. J. Adv. Nurs. 2020, 76, 999–1008. [Google Scholar] [CrossRef]
- Rantakokko, M.; Iwarsson, S.; Portegijs, E.; Viljanen, A.; Rantanen, T. Associations between Environmental Characteristics and Life-Space Mobility in Community-Dwelling Older People. J. Aging Health 2015, 27, 606–621. [Google Scholar] [CrossRef] [PubMed]
- Winters, M.; Voss, C.; Ashe, M.C.; Gutteridge, K.; McKay, H.; Sims-Gould, J. Where Do They Go and How Do They Get There? Older Adults’ Travel Behaviour in a Highly Walkable Environment. Soc. Sci. Med. 2015, 133, 304–312. [Google Scholar] [CrossRef] [PubMed]
- Reinhard, E.; Courtin, E.; van Lenthe, F.J.; Avendano, M. Public Transport Policy, Social Engagement and Mental Health in Older Age: A Quasi-Experimental Evaluation of Free Bus Passes in England. J. Epidemiol. Community Health 2018, 72, 361. [Google Scholar] [CrossRef] [PubMed]
- Frost, S.S.; Goins, R.T.; Hunter, R.H.; Hooker, S.P.; Bryant, L.L.; Kruger, J.; Pluto, D. Effects of the Built Environment on Physical Activity of Adults Living in Rural Settings. Am. J. Health Promot. 2010, 24, 267–283. [Google Scholar] [CrossRef]
- Bancroft, C.; Joshi, S.; Rundle, A.; Hutson, M.; Chong, C.; Weiss, C.C.; Genkinger, J.; Neckerman, K.; Lovasi, G. Association of Proximity and Density of Parks and Objectively Measured Physical Activity in the United States: A Systematic Review. Soc. Sci. Med. 2015, 138, 22–30. [Google Scholar] [CrossRef]
- Paluska, S.A.; Schwenk, T.L. Physical Activity and Mental Health. Sports Med. 2000, 29, 167–180. [Google Scholar] [CrossRef]
- Wood, L.; Hooper, P.; Foster, S.; Bull, F. Public Green Spaces and Positive Mental Health—Investigating the Relationship between Access, Quantity and Types of Parks and Mental Wellbeing. Health Place 2017, 48, 63–71. [Google Scholar] [CrossRef]
- Hartig, T.; Böök, A.; Garvill, J.; Olsson, T.; Gärling, T. Environmental Influences on Psychological Restoration. Scand. J. Psychol. 1996, 37, 378–393. [Google Scholar] [CrossRef]
- Hansen, T.; Sevenius Nilsen, T.; Knapstad, M.; Skirbekk, V.; Skogen, J.; Vedaa, Ø.; Nes, R.B. Covid-Fatigued? A Longitudinal Study of Norwegian Older Adults’ Psychosocial Well-Being before and during Early and Later Stages of the COVID-19 Pandemic. Eur. J. Ageing 2022, 19, 463–473. [Google Scholar] [CrossRef]
- Clarsen, B.; Skogen, J.C.; Nilsen, T.S.; Aarø, L.E. Revisiting the Continuum of Resistance Model in the Digital Age: A Comparison of Early and Delayed Respondents to the Norwegian Counties Public Health Survey. BMC Public Health 2021, 21, 730. [Google Scholar] [CrossRef]
- Disability Data in Humanitarian Action. Available online: https://www.humanity-inclusion.org.uk/en/projects/disability-data-in-humanitarian-action (accessed on 22 February 2023).
- Aarø, L.E.; Skogen, J.C.; Røysamb, E.; Nilsen, T.S.; Vedaa, Ø.; Nes, R.B.; Klepp, K.-I. Evaluering Av «Minimumslisten» Slik Den Inngår i Folkehelseundersøkelsene i Fylkene [Evaluation of the “Minimum List” as Included in the Counties Public Health Surveys]. In Fra nord til sør [Quality of Life in Norway: From North to South]; Nes, R.B., Nilsen, T.S., Eds.; Norwegian Institute of Public Health: Oslo, Norway, 2020; pp. 93–106. [Google Scholar]


| Men | Women | Total | |||||
|---|---|---|---|---|---|---|---|
| n | (%) | n | (%) | n | (%) | p | |
| 1(a) Chronic disease / health problems | |||||||
| No | 2179 | (49.6) | 1722 | (44.9) | 3901 | (47.5) | <0.001 |
| Yes | 2211 | (50.4) | 2109 | (55.1) | 4320 | (52.5) | |
| 1(b) Reduced participation | |||||||
| Large degree | 425 | (9.7) | 438 | (11.5) | 863 | (10.5) | <0.001 |
| Some degree | 1010 | (23.1) | 1143 | (29.9) | 2153 | (26.3) | |
| Small degree or not at all 1 | 2944 | (67.2) | 2239 | (58.6) | 5183 | (63.2) | |
| 2(a) Functional impairment/problems from injury | |||||||
| No | 3041 | (69.3) | 2662 | (69.3) | 5703 | (69.3) | 0.986 |
| Yes | 1348 | (30.7) | 1179 | (30.7) | 2527 | (30.7) | |
| 2(b) Reduced participation | |||||||
| Large degree | 286 | (6.5) | 202 | (5.3) | 488 | (5.9) | <0.001 |
| Some degree | 709 | (16.2) | 751 | (19.6) | 1460 | (17.8) | |
| Small degree or not at all 1 | 3389 | (77.3) | 2887 | (75.2) | 6276 | (76.3) | |
| Disability 2 | |||||||
| Severe | 474 | (10.7) | 466 | (12.1) | 940 | (11.4) | <0.001 |
| Moderate | 1199 | (27.2) | 1292 | (33.6) | 2491 | (30.2) | |
| Mild or no disability | 2731 | (62.0) | 2092 | (54.3) | 4823 | (58.4) | |
| Severe Disability | Moderate Disability | Mild or No Disability | Total | p | |||||
|---|---|---|---|---|---|---|---|---|---|
| Sex, n (%) | |||||||||
| Men | 474 | (10.8) | 1199 | (27.2) | 2731 | (62.0) | 4404 | (53.4) | <0.001 |
| Women | 466 | (12.1) | 1292 | (33.6) | 2092 | (54.3) | 3850 | (46.6) | |
| Age groups, n (%) | |||||||||
| 60–64 | 308 | (12.4) | 773 | (31.1) | 1407 | (56.6) | 2488 | (30.1) | <0.001 |
| 65–69 | 286 | (11.7) | 726 | (29.7) | 1436 | (58.7) | 2448 | (29.7) | |
| 70–74 | 182 | (9.8) | 527 | (28.4) | 1147 | (61.8) | 1856 | (22.5) | |
| 75–79 | 101 | (10.1) | 299 | (29.8) | 604 | (60.2) | 1004 | (12.2) | |
| ≥80 | 62 | (13.6) | 166 | (36.3) | 229 | (50.1) | 457 | (5.5) | |
| Partner status, n (%) | |||||||||
| Married/cohabiting | 683 | (10.7) | 1884 | (29.5) | 3826 | (59.8) | 6393 | (77.7) | <0.001 |
| Non-resident partner | 22 | (6.9) | 93 | (29.1) | 205 | (64.1) | 320 | (3.9) | |
| Single | 229 | (15.2) | 506 | (33.5) | 775 | (51.3) | 1510 | (18.4) | |
| Financial situation, n (%) | |||||||||
| Difficult | 216 | (28.5) | 283 | (37.3) | 260 | (34.3) | 759 | (9.7) | <0.001 |
| Quite easy | 287 | (13.0) | 758 | (34.3) | 1167 | (52.8) | 2212 | (28.2) | |
| Easy | 393 | (8.0) | 1320 | (27.0) | 3172 | (64.9) | 4885 | (62.2) | |
| BE accessibility (1–5), M (SD) | 2.83 | (1.46) | 3.07 | (1.42) | 3.25 | (1.41) | 3.15 | (1.43) | <0.001 |
| Quality of life (0–10), M (SD) | 6.43 | (2.28) | 7.58 | (1.69) | 8.21 | (1.48) | 7.81 | (1.75) | <0.001 |
| Thriving (1–4), M (SD) | 3.68 | (0.59) | 3.79 | (0.45) | 3.85 | (0.39) | 3.81 | (0.44) | <0.001 |
| Loneliness (1–5), M (SD) | 2.38 | (0.92) | 2.12 | (0.75) | 1.86 | (0.67) | 2.00 | (0.75) | <0.001 |
| Psychological distress (1–4), M (SD) | 1.63 | (0.62) | 1.39 | (0.45) | 1.23 | (0.35) | 1.33 | (0.44) | <0.001 |
| Crude Model | Fully Adjusted Model 1 | |||||
|---|---|---|---|---|---|---|
| F | p | η2 | F | p | η2 | |
| Quality of life | ||||||
| Disability 2 | 367.955 | <0.001 | 0.093 | 270.187 | <0.001 | 0.073 |
| Accessibility 2 | 66.206 | <0.001 | 0.035 | 54.737 | <0.001 | 0.031 |
| Disability * BE Accessibility 3 | 1.509 | 0.148 | 0.002 | 1.025 | 0.414 | 0.001 |
| Thriving | ||||||
| Disability 2 | 30.645 | <0.001 | 0.008 | 22.565 | <0.001 | 0.007 |
| Accessibility 2 | 151.524 | <0.001 | 0.078 | 137.891 | <0.001 | 0.075 |
| Disability * BE Accessibility 3 | 3.787 | <0.001 | 0.004 | 4.973 | <0.001 | 0.006 |
| Loneliness | ||||||
| Disability 2 | 187.785 | <0.001 | 0.050 | 116.352 | <0.001 | 0.033 |
| Accessibility 2 | 55.212 | <0.001 | 0.030 | 56.732 | <0.001 | 0.032 |
| Disability * BE Accessibility 3 | 1.652 | 0.105 | 0.002 | 2.040 | 0.038 | 0.002 |
| Psychological distress | ||||||
| Disability 2 | 307.912 | <0.001 | 0.079 | 202.846 | <0.001 | 0.056 |
| Accessibility 2 | 23.709 | <0.001 | 0.013 | 16.906 | <0.001 | 0.010 |
| Disability * BE Accessibility 3 | 2.940 | 0.003 | 0.003 | 3.094 | 0.002 | 0.004 |
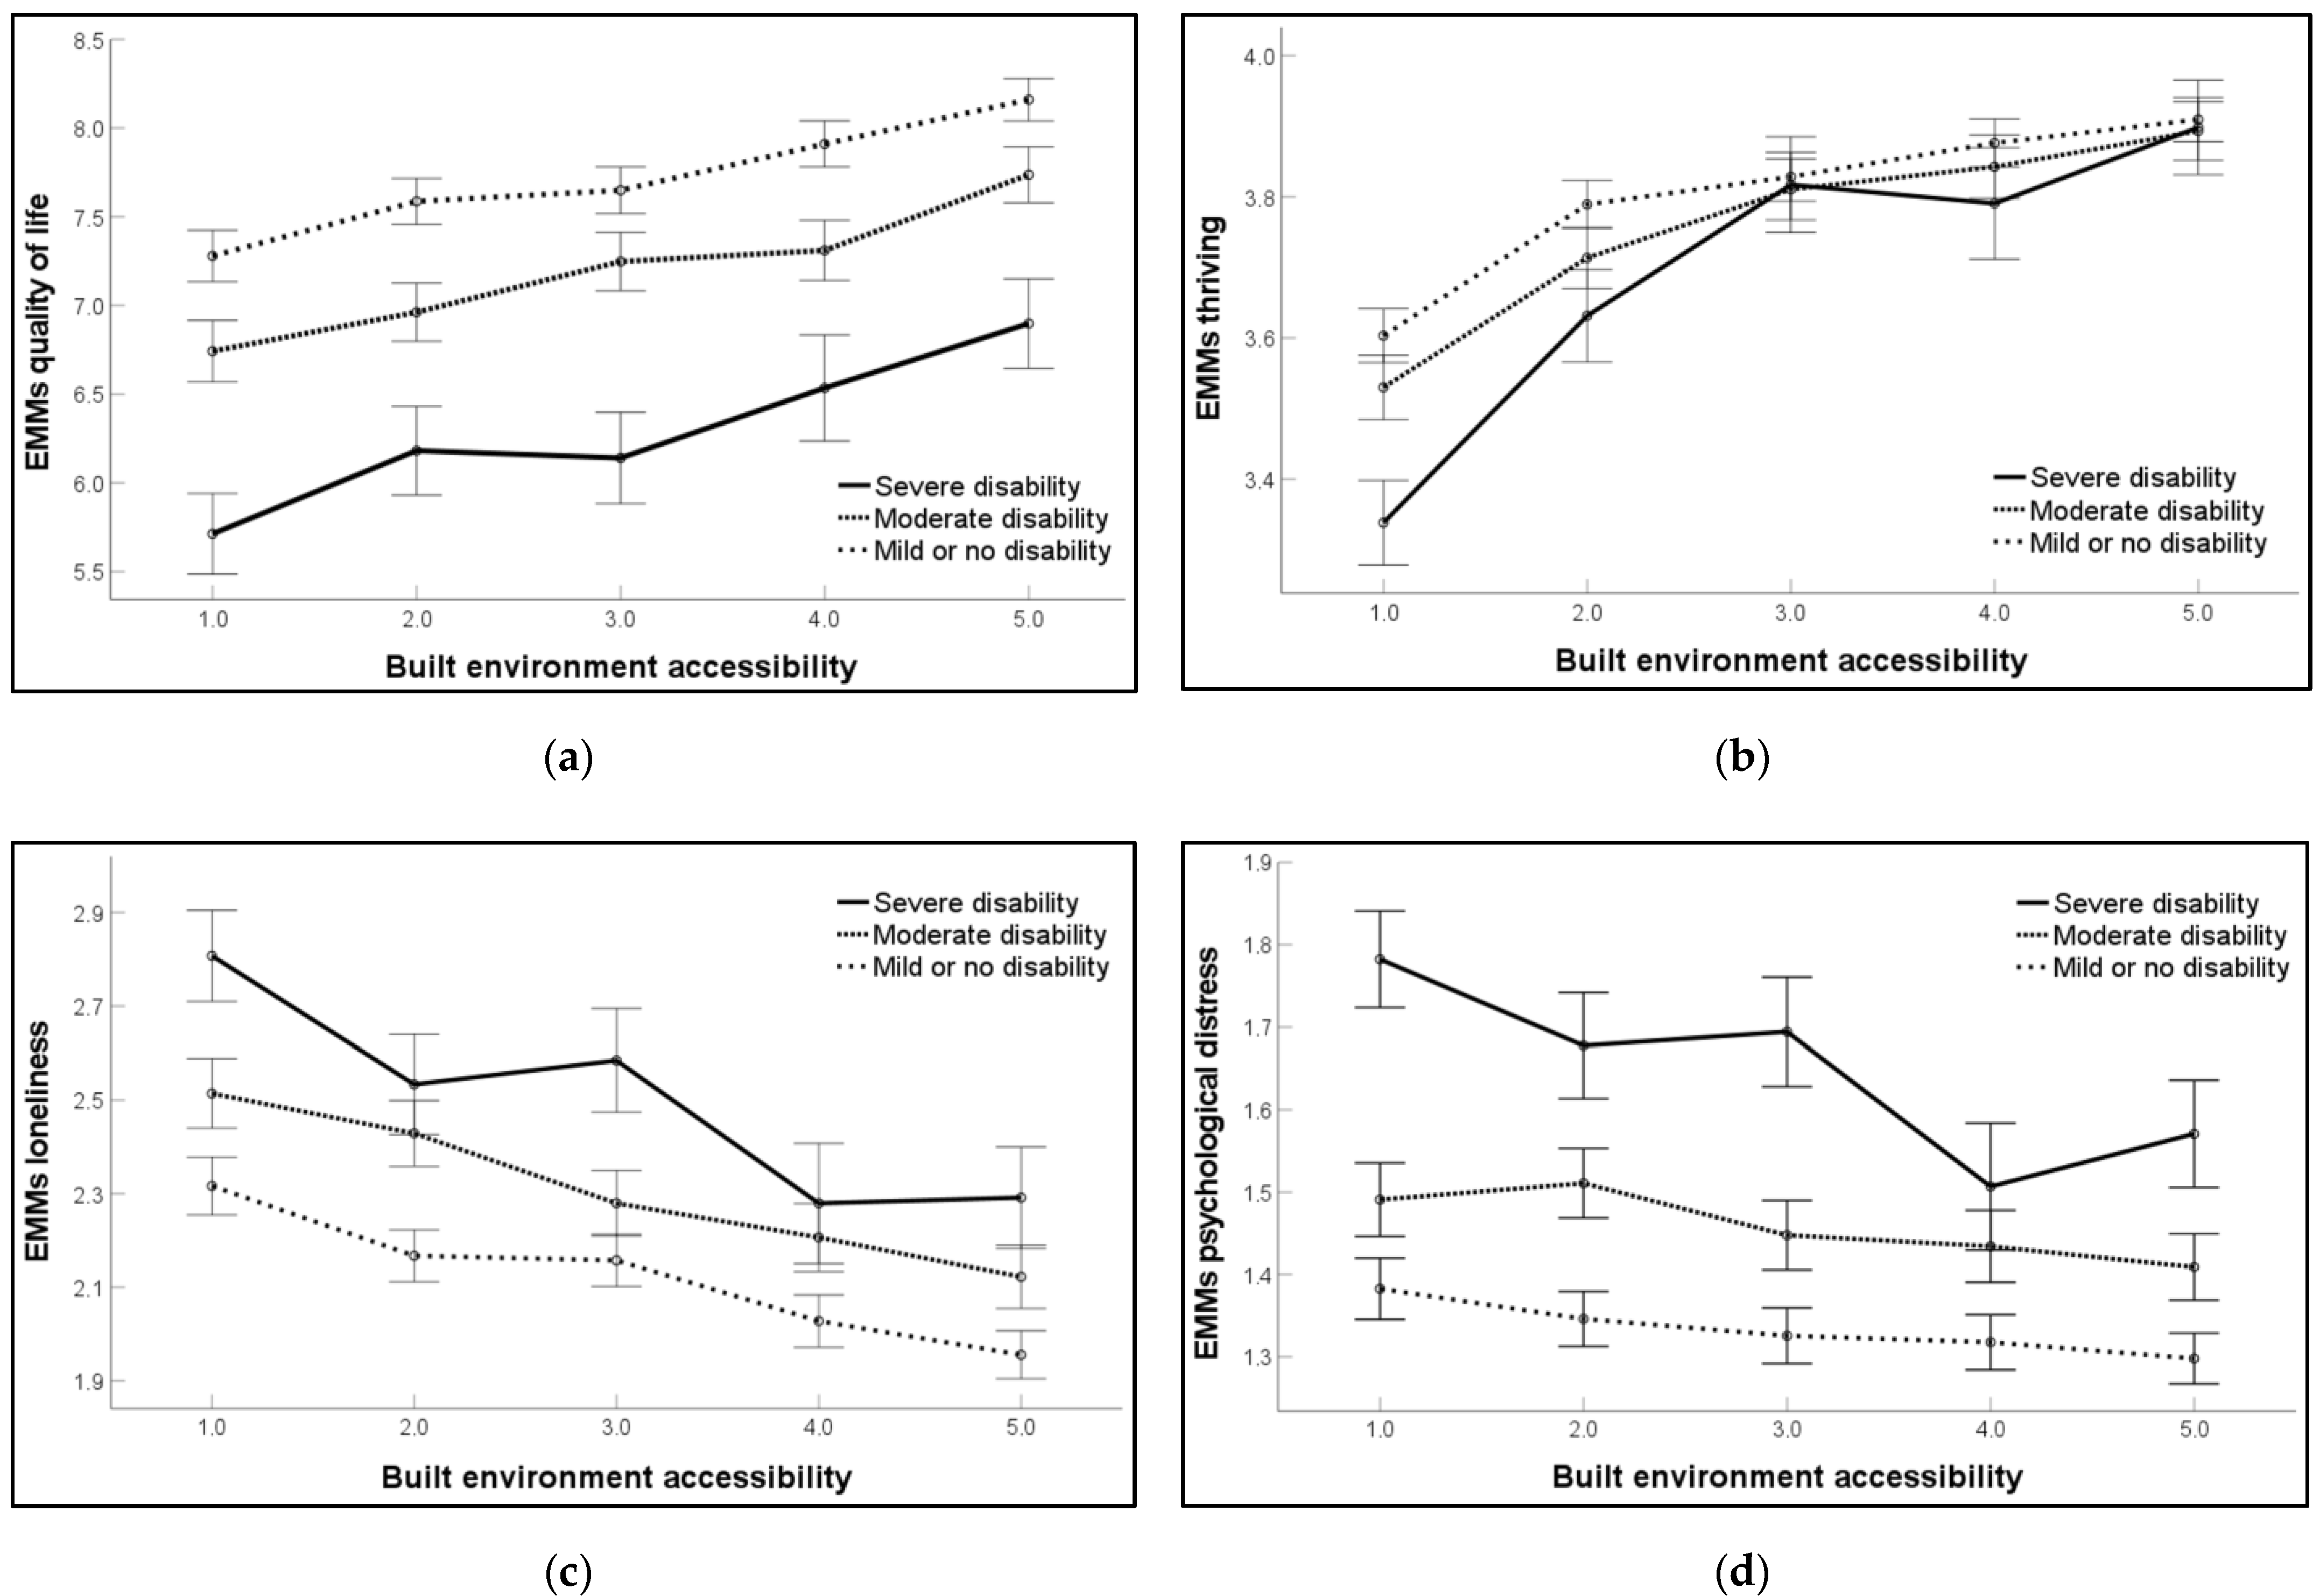
| Built Environment Accessibility | Disability | Quality of Life (0–10) | Thriving (1–4) | Loneliness (1–5) | Psychological Distress (1–4) | ||||||||
|---|---|---|---|---|---|---|---|---|---|---|---|---|---|
| M | SE | 95% CI | M | SE | 95% CI | M | SE | 95% CI | M | SE | 95% CI | ||
| 1 = Very poor | Severe | 5.71 | 0.12 | 5.49–5.94 | 3.34 | 0.03 | 3.28–3.40 | 2.79 | 0.05 | 2.70–2.89 | 1.78 | 0.03 | 1.72–1.84 |
| Moderate | 6.74 | 0.09 | 6.57–6.91 | 3.53 | 0.02 | 3.45–3.58 | 2.49 | 0.04 | 2.42–2.57 | 1.50 | 0.02 | 1.45–1.54 | |
| Mild or no disability | 7.28 | 0.07 | 7.13–7.42 | 3.60 | 0.02 | 3.57–3.64 | 2.30 | 0.03 | 2.24–2.36 | 1.38 | 0.02 | 1.35–1.42 | |
| 2 = Poor | Severe | 6.18 | 0.13 | 5.93–6.43 | 3.63 | 0.03 | 3.57–3.70 | 2.51 | 0.06 | 2.41–2.62 | 1.70 | 0.03 | 1.61–1.74 |
| Moderate | 6.96 | 0.08 | 6.80–7.13 | 3.71 | 0.02 | 3.67–3.76 | 2.41 | 0.04 | 2.34–2.48 | 1.51 | 0.02 | 1.47–1.55 | |
| Mild or no disability | 7.59 | 0.07 | 7.46–7.72 | 3.79 | 0.02 | 3.76–3.82 | 2.15 | 0.03 | 2.10–2.20 | 1.35 | 0.02 | 1.31–1.38 | |
| 3 = Neither good nor poor | Severe | 6.14 | 0.13 | 5.88–6.40 | 3.82 | 0.04 | 3.75–3.89 | 2.57 | 0.06 | 2.45–2.68 | 1.70 | 0.03 | 1.63–1.76 |
| Moderate | 7.25 | 0.09 | 7.08–7.41 | 3.81 | 0.02 | 3.77–3.85 | 2.26 | 0.04 | 2.19–2.33 | 1.45 | 0.02 | 1.41–1.49 | |
| Mild or no disability | 7.65 | 0.07 | 7.52–7.78 | 3.83 | 0.02 | 3.79–3.86 | 2.14 | 0.03 | 2.08–2.19 | 1.33 | 0.02 | 1.29–1.36 | |
| 4 = Good | Severe | 6.54 | 0.15 | 6.24–6.84 | 3.79 | 0.04 | 3.71–3.87 | 2.26 | 0.07 | 2.13–2.39 | 1.51 | 0.04 | 1.43–1.58 |
| Moderate | 7.31 | 0.09 | 7.14–7.48 | 3.84 | 0.02 | 3.80–3.89 | 2.19 | 0.04 | 2.11–2.26 | 1.43 | 0.02 | 1.39–1.48 | |
| Mild or no disability | 7.91 | 0.07 | 7.78–8.04 | 3.88 | 0.02 | 3.84–3.81 | 2.01 | 0.03 | 2.00–2.06 | 1.32 | 0.02 | 1.28–1.35 | |
| 5 = Very good | Severe | 6.90 | 0.13 | 6.65–7.15 | 3.90 | 0.03 | 3.83–3.97 | 2.27 | 0.06 | 2.20–2.38 | 1.57 | 0.03 | 1.51–1.64 |
| Moderate | 7.74 | 0.08 | 7.58–7.89 | 3.89 | 0.02 | 3.85–3.94 | 2.10 | 0.03 | 2.04–2.17 | 1.41 | 0.02 | 1.37–1.45 | |
| Mild or no disability | 8.16 | 0.06 | 8.04–8.28 | 3.91 | 0.02 | 3.88–3.94 | 1.94 | 0.03 | 1.88–2.00 | 1.30 | 0.02 | 1.28–1.33 | |
Disclaimer/Publisher’s Note: The statements, opinions and data contained in all publications are solely those of the individual author(s) and contributor(s) and not of MDPI and/or the editor(s). MDPI and/or the editor(s) disclaim responsibility for any injury to people or property resulting from any ideas, methods, instructions or products referred to in the content. |
© 2023 by the authors. Licensee MDPI, Basel, Switzerland. This article is an open access article distributed under the terms and conditions of the Creative Commons Attribution (CC BY) license (https://creativecommons.org/licenses/by/4.0/).
Share and Cite
Forster, G.K.; Aarø, L.E.; Alme, M.N.; Hansen, T.; Nilsen, T.S.; Vedaa, Ø. Built Environment Accessibility and Disability as Predictors of Well-Being among Older Adults: A Norwegian Cross-Sectional Study. Int. J. Environ. Res. Public Health 2023, 20, 5898. https://doi.org/10.3390/ijerph20105898
Forster GK, Aarø LE, Alme MN, Hansen T, Nilsen TS, Vedaa Ø. Built Environment Accessibility and Disability as Predictors of Well-Being among Older Adults: A Norwegian Cross-Sectional Study. International Journal of Environmental Research and Public Health. 2023; 20(10):5898. https://doi.org/10.3390/ijerph20105898
Chicago/Turabian StyleForster, Grace Katharine, Leif Edvard Aarø, Maria Nordheim Alme, Thomas Hansen, Thomas Sevenius Nilsen, and Øystein Vedaa. 2023. "Built Environment Accessibility and Disability as Predictors of Well-Being among Older Adults: A Norwegian Cross-Sectional Study" International Journal of Environmental Research and Public Health 20, no. 10: 5898. https://doi.org/10.3390/ijerph20105898