

Multi-Level Classification of Driver Drowsiness by Simultaneous Analysis of ECG and Respiration Signals Using Deep Neural Networks
 , and
, and
Abstract
:1. Introduction
2. Materials and Methods
2.1. Participants
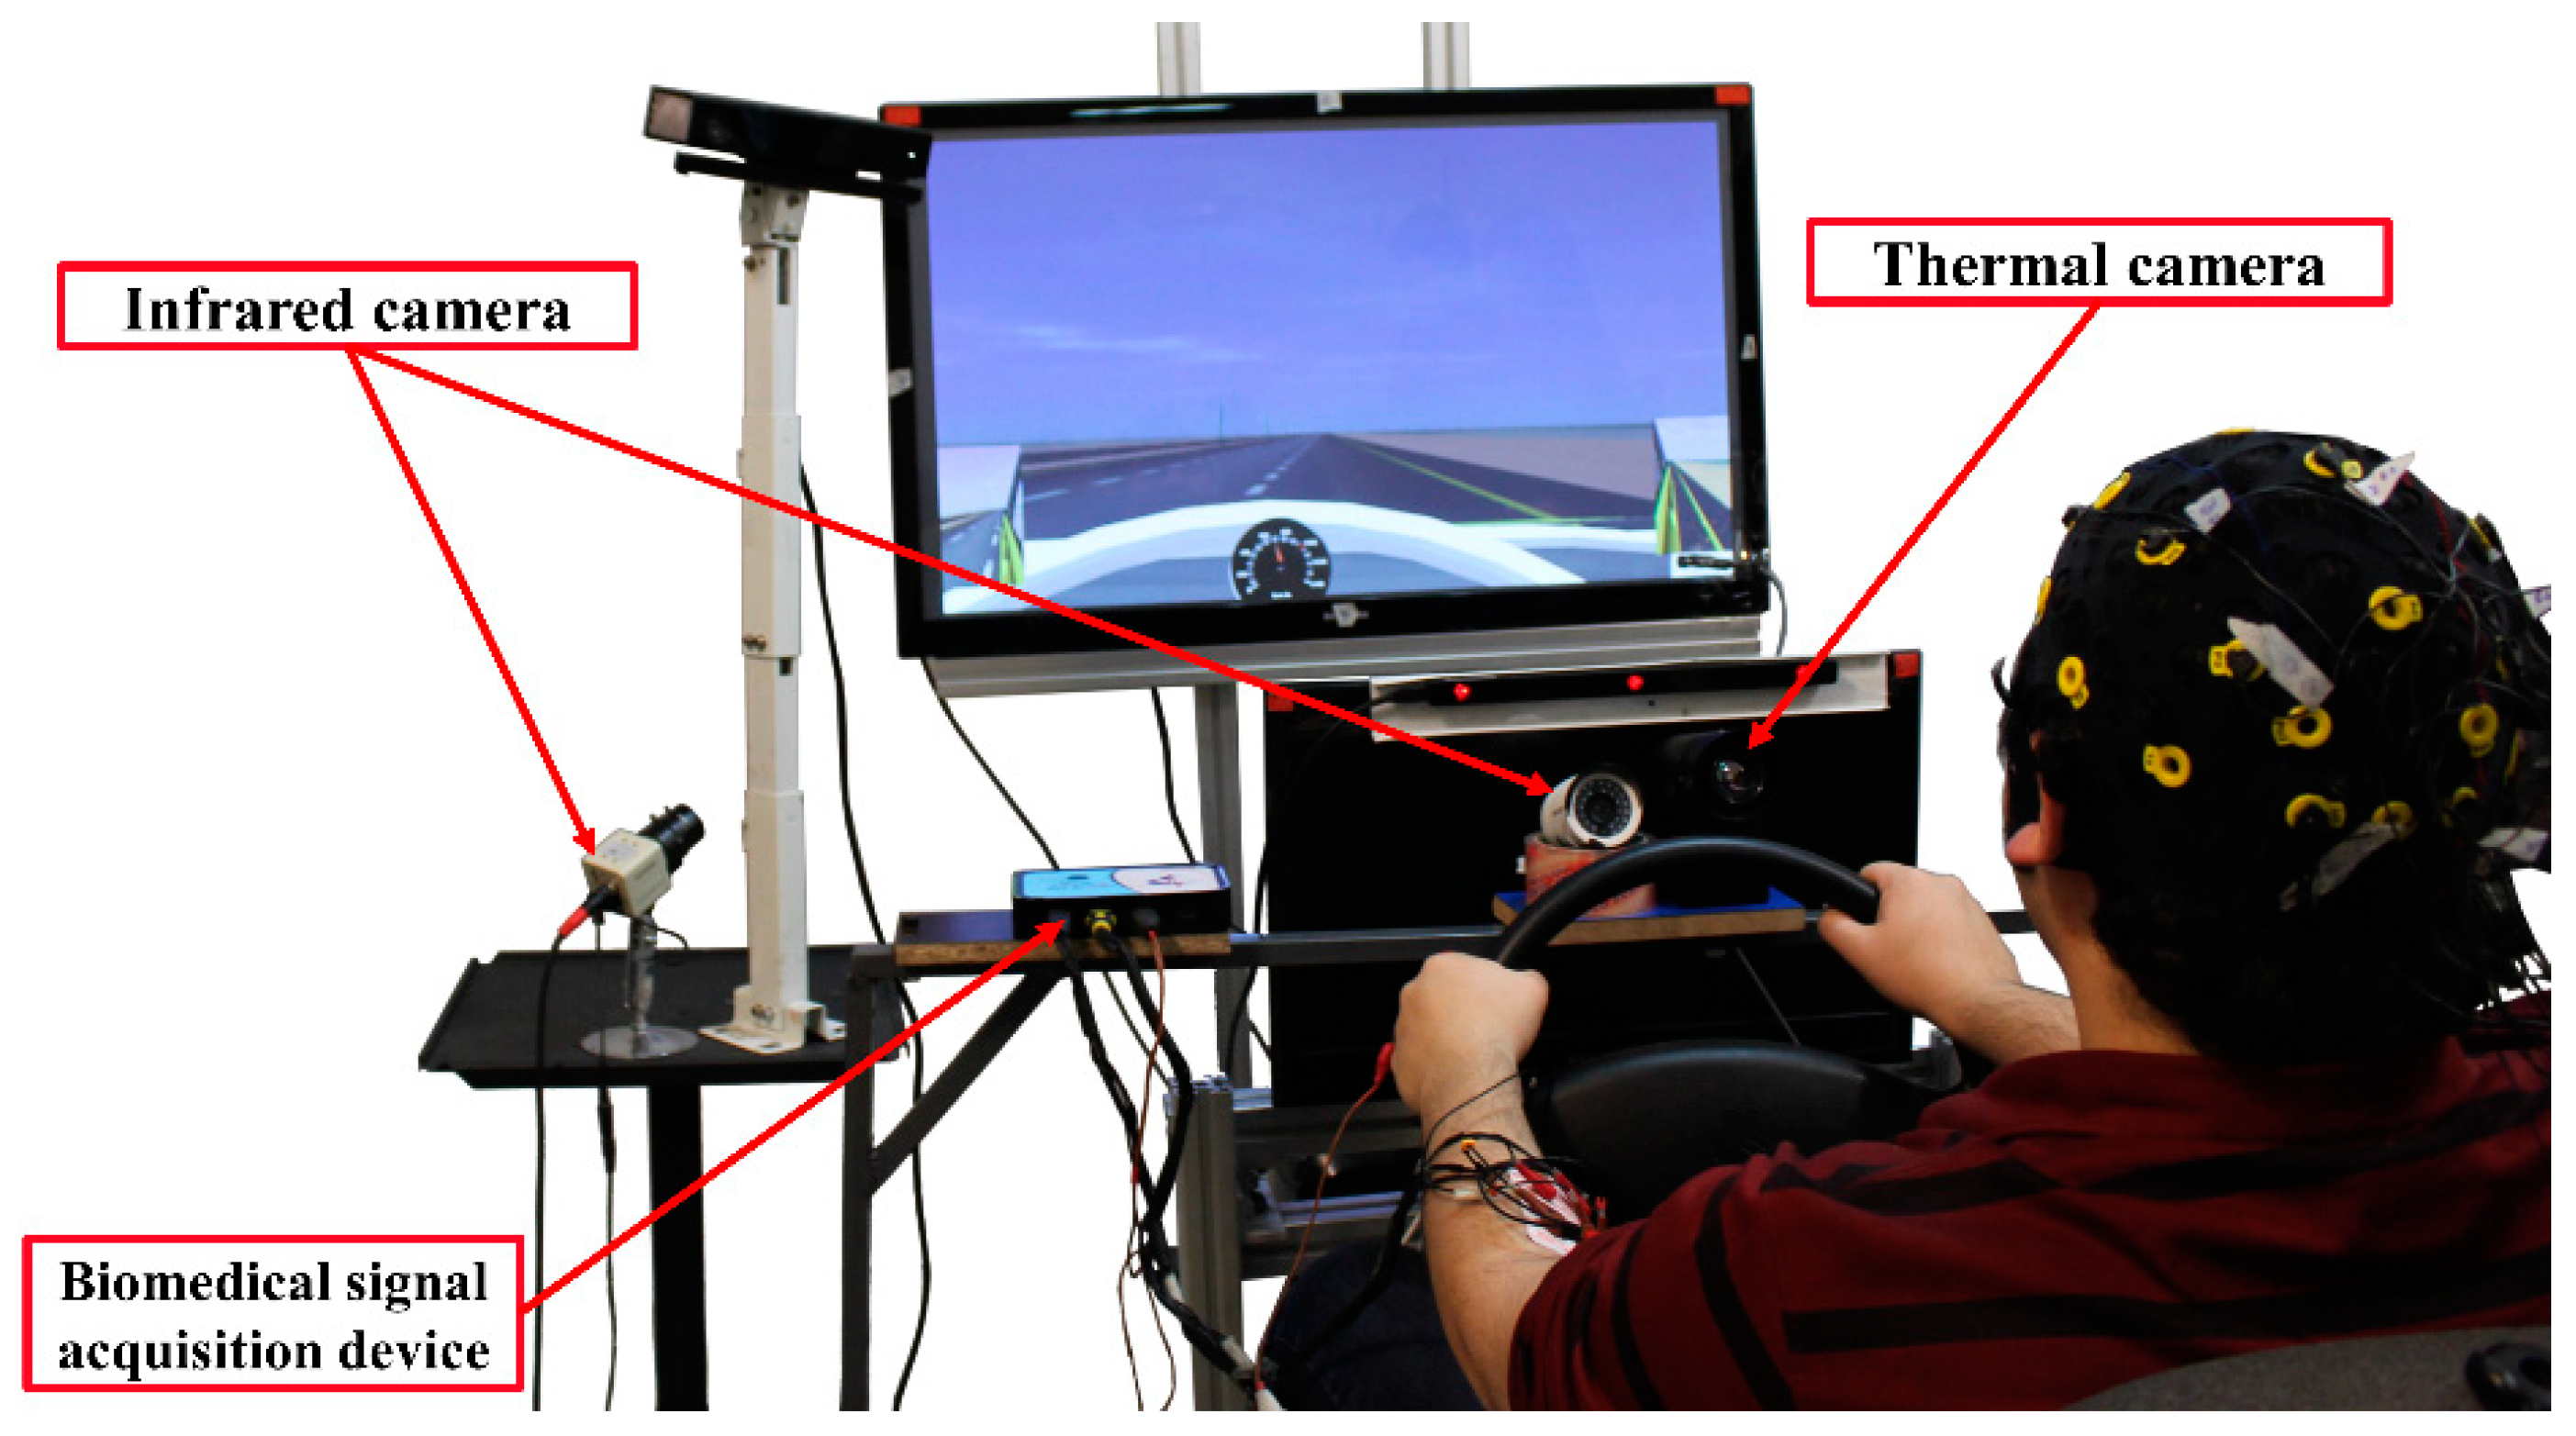
2.2. Test equipment
2.2.1. ECG
2.2.2. Respiration
2.3. Experimental protocol
2.4. Drowsiness Scale
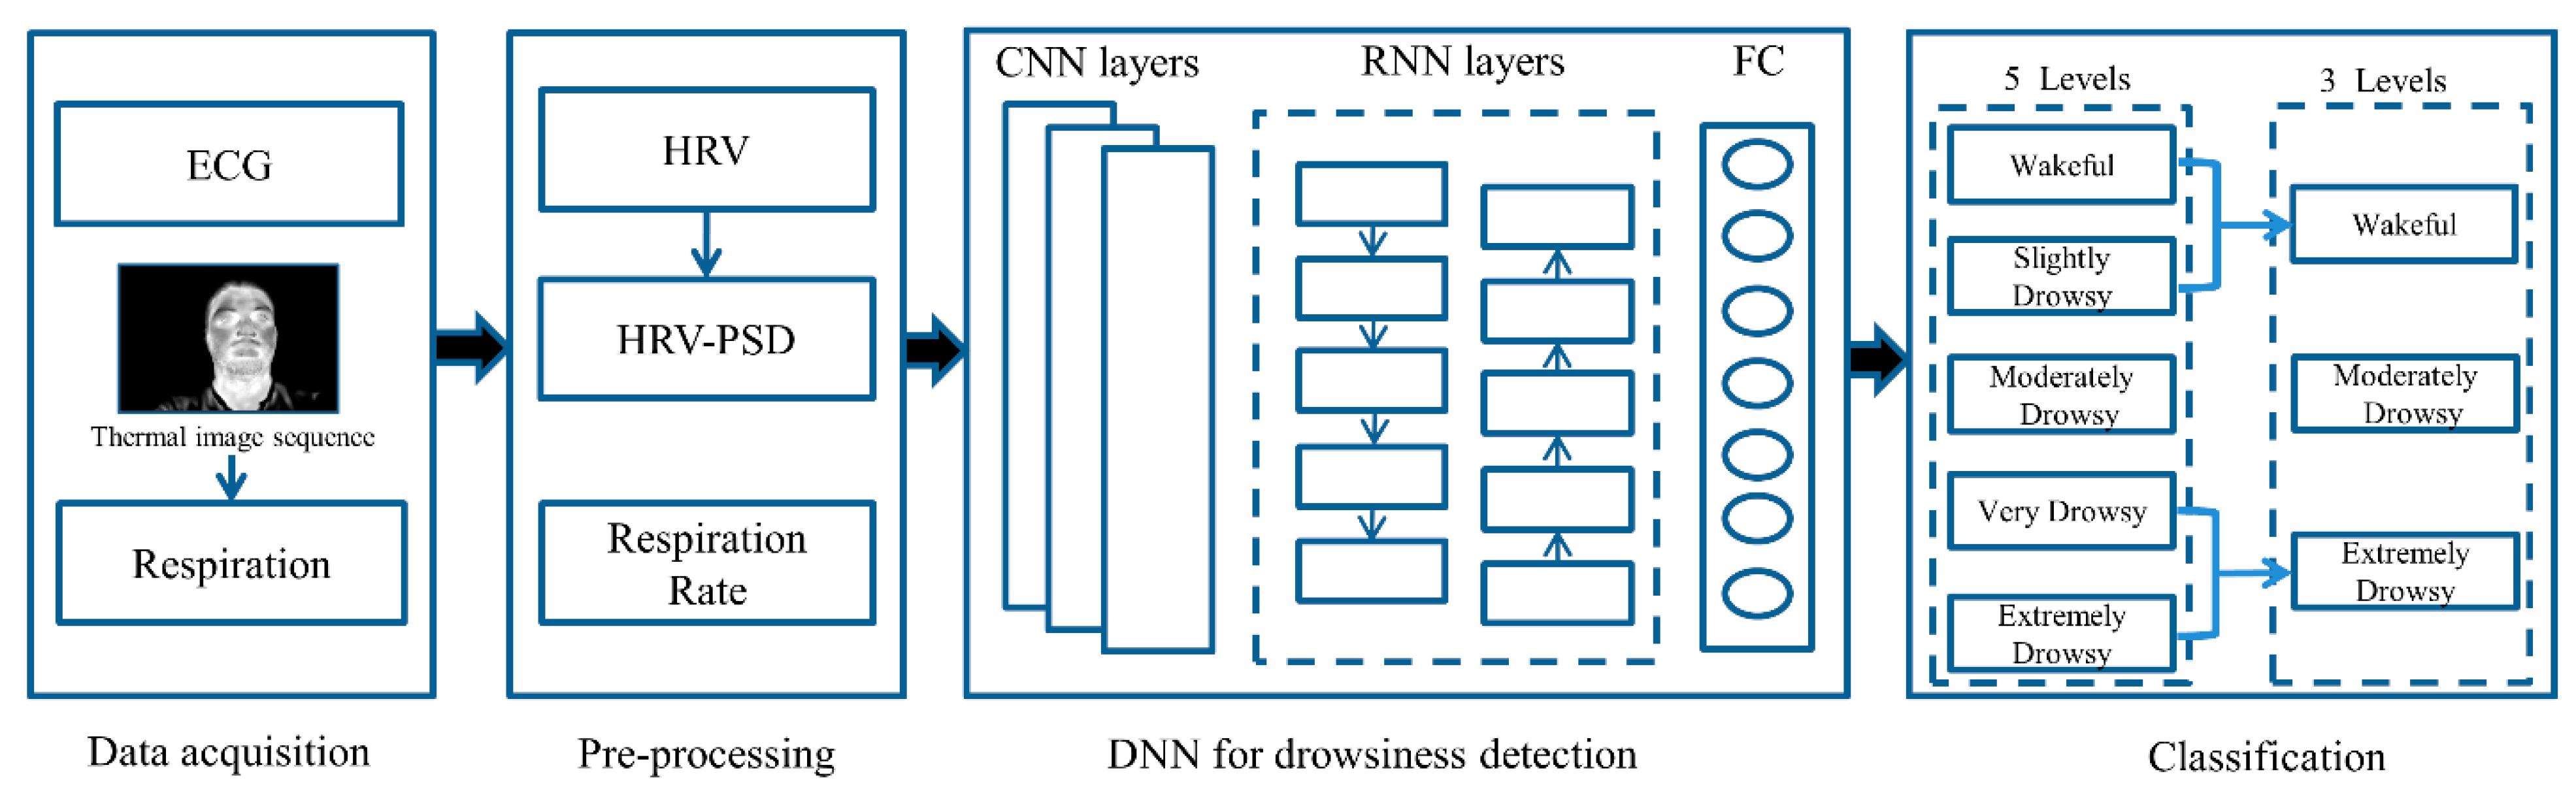
2.5. Deep Neural Networks
Model Architecture
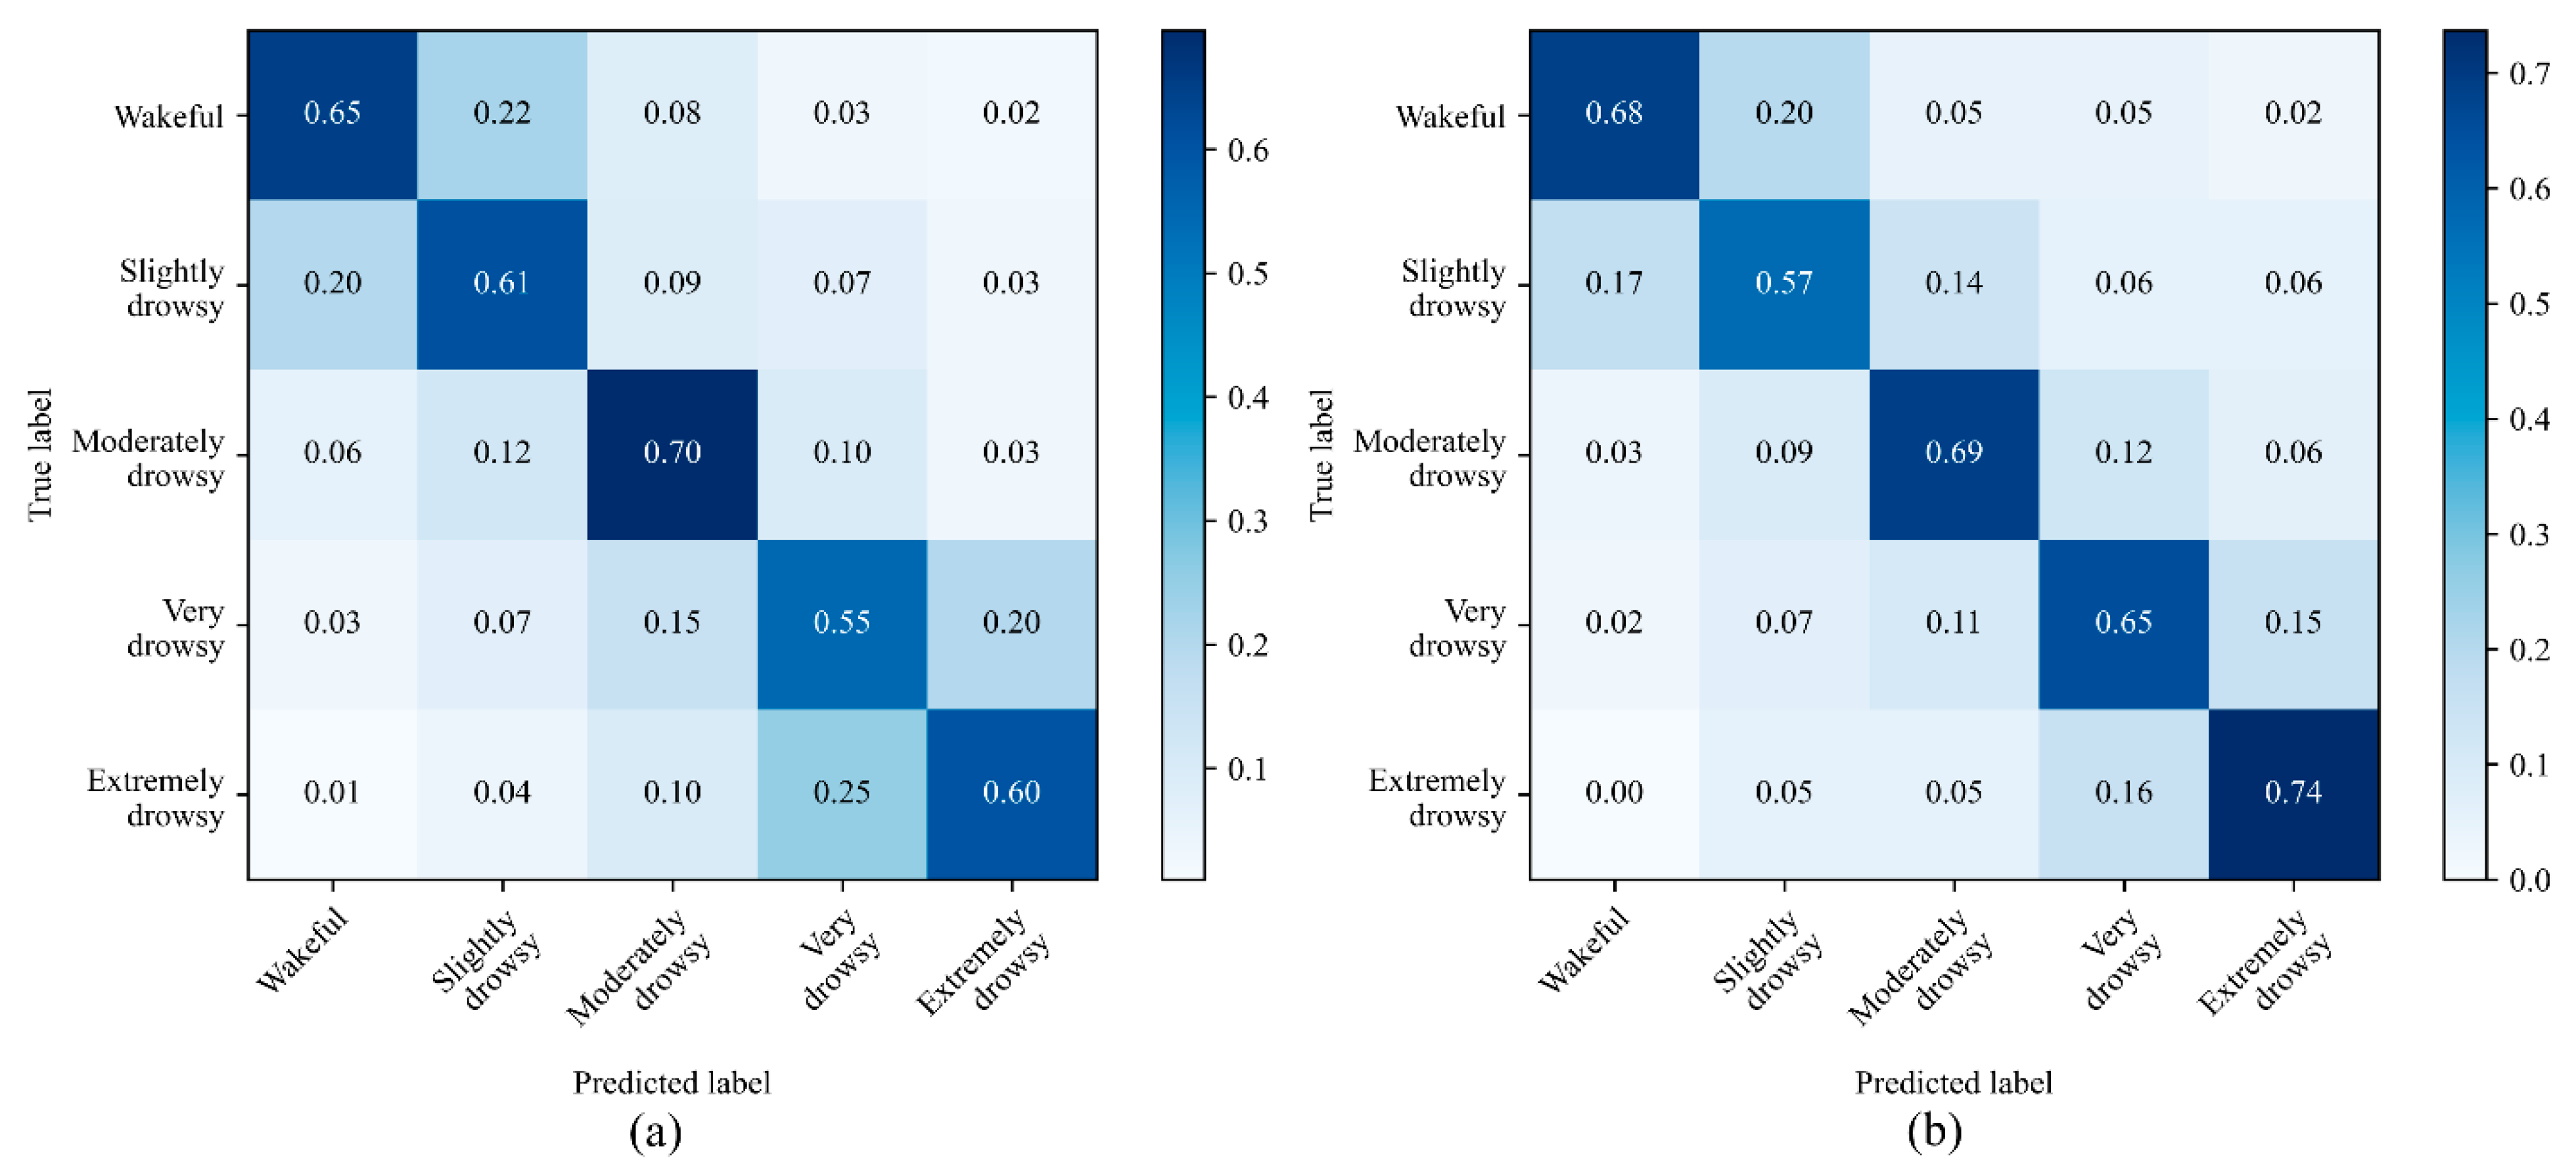
3. Results
4. Discussion
5. Conclusions
Author Contributions
Funding
Institutional Review Board Statement
Informed Consent Statement
Data Availability Statement
Conflicts of Interest
Appendix A
- Not Drowsy: A driver who is not drowsy while driving will exhibit behaviors such that the appearance of alertness will be present. For example, normal facial tone, normal fast eye blinks, and short ordinary glances may be observed. Occasional body movements and gestures may occur [47].
- Slightly Drowsy: A driver who is slightly drowsy while driving may not look as sharp or alert as a driver who is not drowsy. Glances may be a little longer and eye blinks may not be as fast. Nevertheless, the driver is still sufficiently alert to be able to drive [47].
- Moderately Drowsy: As a driver becomes moderately drowsy, various behaviors may be exhibited. These behaviors, called mannerisms, may include rubbing the face or eyes, scratching, facial contortions, and moving restlessly in the seat, among others. These actions can be thought of as countermeasures to drowsiness. They occur during the intermediate stages of drowsiness. Not all individuals exhibit mannerisms during intermediate stages. Some individuals appear more subdued, they may have slower closures, their facial tone may decrease, they may have a glassy-eyed appearance, and they may stare at a fixed position [47].
- Very Drowsy: As a driver becomes very drowsy, eyelid closures of 2 to 3 s or longer usually occur. This is often accompanied by a rolling upward or sideways movement of the eyes themselves. The individual may also appear not to be focusing the eyes properly or may exhibit a cross-eyed (lack of proper vergence) look. Facial tone will probably have decreased. Very drowsy drivers may also exhibit a lack of apparent activity, and there may be large isolated (or punctuating) movements, such as providing a large correction to steering or reorienting the head from a leaning or tilted position [47].
- Extremely Drowsy: Drivers who are extremely drowsy are falling asleep and usually exhibit prolonged eyelid closures (4 s or more) and similar prolonged periods of lack of activity. There may be large punctuated movements as they transition in and out of intervals of dozing [47].

| None | Minor | Moderate | Extreme | ||
|---|---|---|---|---|---|
| Eyes/Eyebrows | Rubbing/scratching | ||||
| Blank/fixed stare | |||||
| Squinting | |||||
| Excessive/hard blinking | |||||
| Slow closure | |||||
| Unfocused rolling | |||||
| Glassy/glazed | |||||
| Raise/open wide | |||||
| Lower/scowl | |||||
| Body | Slumping/slouching/leaning | ||||
| Sighing | |||||
| Stretching | |||||
| Bodyrolling/slack muscle tone | |||||
| Body position change (restlessness) | |||||
| Mouth | Yawning | ||||
| Biting/licking lips | |||||
| Tongue motion | |||||
| Face | Rubbing/holding | ||||
| Facial contortions | |||||
| Slack muscle tone | |||||
| Neck/Head | Hair: scratching/straightening | ||||
| Rubbing/holding | |||||
| Head learning (back or side, unsupported) | |||||
| Head position change | |||||
| Head nodding/drooping | |||||
References
- Higgins, J.S.; Michael, J.; Austin, R.; Åkerstedt, T.; Van Dongen, H.P.A.; Watson, N.; Czeisler, C.; Pack, M.A.I.; Rosekind, M.R. Asleep at the wheel: A national compendium of efforts to eliminate drowsy driving. Sleep 2017, 40, zsx001. [Google Scholar] [CrossRef] [PubMed]
- Jarosch, O.; Kuhnt, M.; Paradies, S.; Bengler, K. It’s out of our hands now! Effects of non-driving related tasks during highly automated driving on drivers’ fatigue. In Proceedings of the Ninth International Driving Symposium on Human Factors in Driver Assessment, Training and Vehicle Design, Manchester Village, VT, USA, 26–29 June 2017; pp. 319–325. [Google Scholar] [CrossRef]
- Naujoks, F.; Höfling, S.; Purucker, C.; Zeeb, K. From partial and high automation to manual driving: Relationship between non-driving related tasks, drowsiness and take-over performance. Accid. Anal. Prev. 2018, 121, 28–42. [Google Scholar] [CrossRef] [PubMed]
- Sahayadhas, A.; Sundaraj, K.; Murugappan, M. Detecting driver drowsiness based on sensors: A review. Sensors 2012, 12, 16937–16953. [Google Scholar] [CrossRef] [PubMed]
- Balandong, R.P.; Ahmad, R.F.; Saad, M.N.M.; Malik, A.S. A review on EEG-based automatic sleepiness detection systems for driver. IEEE Access 2018, 6, 22908–22919. [Google Scholar] [CrossRef]
- Chowdhury, A.; Shankaran, R.; Kavakli, M.; Haque, M. Sensor applications and physiological features in drivers’ drowsiness detection: A review. IEEE Sens. J. 2018, 18, 3055–3067. [Google Scholar] [CrossRef]
- Jung, S.; Shin, H.; Chung, W. Driver fatigue and drowsiness monitoring system with embedded electrocardiogram sensor on steering wheel. IET Intell. Transp. Syst. 2014, 8, 43–50. [Google Scholar] [CrossRef]
- Bednár, T.; Babušiak, B. Measurement of capacitive coupled ECG from the car seat. Transp. Res. Procedia 2019, 40, 1260–1265. [Google Scholar] [CrossRef]
- Rachim, V.P.; Chung, W.-Y. Wearable Noncontact Armband for Mobile ECG Monitoring System. IEEE Trans. Biomed. Circuits Syst. 2016, 10, 1112–1118. [Google Scholar] [CrossRef]
- Yang, C.; Wang, X.; Mao, S. Respiration Monitoring With RFID in Driving Environments. IEEE J. Sel. Areas Commun. 2021, 39, 500–512. [Google Scholar] [CrossRef]
- Yang, F.; He, Z.; Guo, S.; Fu, Y.; Li, L.; Lu, J.; Jiang, K. Non-contact driver respiration rate detection technology based on suppression of multipath interference with directional antenna. Information 2020, 11, 192. [Google Scholar] [CrossRef]
- Solaz, J.; Laparra-Hernández, J.; Bande, D.; Rodríguez, N.; Veleff, S.; Gerpe, J.; Medina, E. Drowsiness detection based on the analysis of breathing rate obtained from real-time image recognition. Transp. Res. Procedia 2016, 14, 3867–3876. [Google Scholar] [CrossRef]
- Kiashari, S.E.H.; Nahvi, A.; Homayounfard, A.; Bakhoda, H. Monitoring the variation in driver respiration rate from wakefulness to drowsiness: A non-intrusive method for drowsiness detection using thermal imaging. J. Sleep Sci. 2018, 3, 1–9. [Google Scholar]
- Kiashari, S.E.H.; Nahvi, A.; Bakhoda, H.; Homayounfard, A.; Tashakori, M. Evaluation of driver drowsiness using respiration analysis by thermal imaging on a driving simulator. Multimed. Tools Appl. 2020, 79, 17793–17815. [Google Scholar] [CrossRef]
- Heine, T.; Lenis, G.; Reichensperger, P.; Beran, T.; Doessel, O.; Deml, B. Electrocardiographic features for the measurement of drivers’ mental workload. Appl. Ergon. 2017, 61, 31–43. [Google Scholar] [CrossRef] [PubMed]
- Wang, X.; Guo, Y.; Ban, J.; Xu, Q.; Bai, C.; Liu, S. Driver emotion recognition of multiple-ECG feature fusion based on BP network and D–S evidence. IET Intell. Transp. Syst. 2020, 14, 815–824. [Google Scholar] [CrossRef]
- Keshan, N.; Parimi, P.V.; Bichindaritz, I. Machine learning for stress detection from ECG signals in automobile drivers. In Proceedings of the 2015 IEEE International Conference on Big Data (Big Data), Santa Clara, CA, USA, 29 October–1 November 2015; pp. 2661–2669. [Google Scholar] [CrossRef]
- Chui, K.T.; Tsang, K.F.; Chi, H.R.; Ling, B.W.K.; Wu, C.K. An accurate ECG-based transportation safety drowsiness detection scheme. IEEE Trans. Ind. Inform. 2016, 12, 1438–1452. [Google Scholar] [CrossRef]
- Vicente, J.; Laguna, P.; Bartra, A.; Bailón, R. Drowsiness detection using heart rate variability. Med. Biol. Eng. Comput. 2016, 54, 927–937. [Google Scholar] [CrossRef]
- Patel, M.; Lal, S.; Kavanagh, D.; Rossiter, P. Applying neural network analysis on heart rate variability data to assess driver fatigue. Expert Syst. Appl. 2010, 38, 7235–7242. [Google Scholar] [CrossRef]
- Huang, S.; Li, J.; Zhang, P.; Zhang, W. Detection of mental fatigue state with wearable ECG devices. Int. J. Med. Inform. 2018, 119, 39–46. [Google Scholar] [CrossRef]
- Persson, A.; Jonasson, H.; Fredriksson, I.; Wiklund, U.; Ahlstrom, C. Heart rate variability for classification of alert versus sleep deprived drivers in real road driving conditions. IEEE Trans. Intell. Transp. Syst. 2020, 22, 3316–3325. [Google Scholar] [CrossRef]
- Li, G.; Chung, W.-Y. Detection of driver drowsiness using wavelet analysis of heart rate variability and a support vector machine classifier. Sensors 2013, 13, 16494–16511. [Google Scholar] [CrossRef] [PubMed]
- Babaeian, M.; Francis, K.A.; Dajani, K.; Mozumdar, M. Real-time driver drowsiness detection using wavelet transform and ensemble logistic regression. Int. J. Intell. Transp. Syst. Res. 2019, 17, 212–222. [Google Scholar] [CrossRef]
- Al-Libawy, H.; Al-Ataby, A.; Al-Nuaimy, W.; Al-Taee, M.A. HRV-based operator fatigue analysis and classification using wearable sensors. In Proceedings of the 13th International Multi-Conference on Systems, Signals and Devices (SSD), Leipzig, Germany, 21–24 March 2016; pp. 268–273. [Google Scholar] [CrossRef]
- Rodríguez-Ibáñez, N.; García-González, M.A.; Fernández-Chimeno, M.; de Rosario, H.; Ramos-Castro, J. Synchrosqueezing index for detecting drowsiness based on the respiratory effort signal. In Proceedings of the XIII Mediterranean Conference on Medical and Biological Engineering and Computing, Seville, Spain, 25–28 September 2013; pp. 965–968. [Google Scholar] [CrossRef]
- Warwick, B.; Symons, N.; Chen, X.; Xiong, K. Detecting driver drowsiness using wireless wearables. In Proceedings of the 2015 IEEE 12th International Conference on Mobile Ad Hoc and Sensor Systems, Dallas, TX, USA, 19–22 October 2015; pp. 585–588. [Google Scholar] [CrossRef]
- Guede-Fernandez, F.; Fernandez-Chimeno, M.; Ramos-Castro, J.; Garcia-Gonzalez, M.A. Driver drowsiness detection based on respiratory signal analysis. IEEE Access 2019, 7, 81826–81838. [Google Scholar] [CrossRef]
- Yuda, E.; Yoshida, Y.; Hayano, J. Smart shirt respiratory monitoring to detect car driver drowsiness. Int. J. Affect. Eng. 2021, 20, 57–62. [Google Scholar] [CrossRef]
- Tateno, S.; Guan, X.; Cao, R.; Qu, Z. Development of drowsiness detection system based on respiration changes using heart rate monitoring. In Proceedings of the 57th Annual Conference of the Society of Instrument and Control Engineers of Japan (SICE), Nara, Japan, 11–14 September 2018; pp. 1664–1669. [Google Scholar] [CrossRef]
- Kim, J.; Shin, M. Utilizing HRV-derived respiration measures for driver drowsiness detection. Electronics 2019, 8, 669. [Google Scholar] [CrossRef] [Green Version]
- Lee, B.G.; Lee, B.L.; Chung, W.-Y. Mobile healthcare for automatic driving sleep-onset detection using wavelet-based EEG and respiration signals. Sensors 2014, 14, 17915–17936. [Google Scholar] [CrossRef]
- Wang, D.; Shen, P.; Wang, T.; Xiao, Z. Fatigue detection of vehicular driver through skin conductance, pulse oximetry and respiration: A random forest classifier. In Proceedings of the 9th IEEE International Conference on Communication Software and Networks, ICCSN 2017, Guangzhou, China, 6–8 May 2017; pp. 1162–1166. [Google Scholar] [CrossRef]
- Tashakori, M.; Nahvi, A.; Shahiidian, A.; Kiashari, S.E.H.; Bakhoda, H. Estimation of driver drowsiness using blood perfusion analysis of facial thermal images in a driving simulator. J. Sleep Sci. 2018, 3, 45–52. [Google Scholar]
- Tashakori, M.; Nahvi, A.; Kiashari, S.E.H. Driver drowsiness detection using facial thermal imaging in a driving simulator. Proc. Inst. Mech. Eng. Part H J. Eng. Med. 2021, 236, 43–55. [Google Scholar] [CrossRef]
- Leng, L.B.; Giin, L.B.; Chung, W.-Y. Wearable driver drowsiness detection system based on biomedical and motion sensors. In Proceedings of the 2015 IEEE SENSORS, Busan, Korea, 1–4 November 2015. [Google Scholar] [CrossRef]
- Mahmoodi, M.; Nahvi, A. Driver drowsiness detection based on classification of surface electromyography features in a driving simulator. Proc. Inst. Mech. Eng. Part H J. Eng. Med. 2019, 233, 395–406. [Google Scholar] [CrossRef]
- Hu, J.; Min, J. Automated detection of driver fatigue based on EEG signals using gradient boosting decision tree model. Cogn. Neurodyn. 2018, 12, 431–440. [Google Scholar] [CrossRef]
- Zhu, X.; Zheng, W.-L.; Lu, B.-L.; Chen, X.; Chen, S.; Wang, C. EOG-based drowsiness detection using convolutional neural networks. In Proceedings of the 2014 International Joint Conference on Neural Networks (IJCNN), Beijing, China, 6–11 July 2014; pp. 128–134. [Google Scholar] [CrossRef]
- Saleh, K.; Hossny, M.; Nahavandi, S. Driving behavior classification based on sensor data fusion using LSTM recurrent neural networks. In Proceedings of the 2017 IEEE 20th International Conference on Intelligent Transportation Systems (ITSC), Yokohama, Japan, 16–19 October 2017; pp. 1–6. [Google Scholar] [CrossRef]
- Zhao, L.; Wang, Z.; Wang, X.; Liu, Q. Driver drowsiness detection using facial dynamic fusion information and a DBN. IET Intell. Transp. Syst. 2018, 12, 127–133. [Google Scholar] [CrossRef]
- Jiao, Y.; Deng, Y.; Luo, Y.; Lu, B.-L. Driver sleepiness detection from EEG and EOG signals using GAN and LSTM networks. Neurocomputing 2020, 408, 100–111. [Google Scholar] [CrossRef]
- Guo, J.-M.; Markoni, H. Driver drowsiness detection using hybrid convolutional neural network and long short-term memory. Multimedia Tools Appl. 2019, 78, 29059–29087. [Google Scholar] [CrossRef]
- Arefnezhad, S.; Samiee, S.; Eichberger, A.; Frühwirth, M.; Kaufmann, C.; Klotz, E. Applying deep neural networks for multi-level classification of driver drowsiness using Vehicle-based measures. Expert Syst. Appl. 2020, 162, 113778. [Google Scholar] [CrossRef]
- Åkerstedt, T.; Gillberg, M. Subjective and objective sleepiness in the active individual. Int. J. Neurosci. 1990, 52, 29–37. [Google Scholar] [CrossRef]
- Hoddes, E.; Zarcone, V.; Smythe, H.; Phillips, R.; Dement, W.C. Quantification of sleepiness: A new approach. Psychophysiology 1973, 10, 431–436. [Google Scholar] [CrossRef]
- Wiegand, D.M.; McClafferty, J.; McDonald, S.E.; Hanowski, R.J. Development and Evaluation of a Naturalistic Observer Rating of Drowsiness Protocol; Virginia Tech: Blacksburg, VA, USA, 2009. [Google Scholar]
- Grubbs, F.E. Procedures for detecting outlying observations in samples. Technometrics 1969, 11, 227. [Google Scholar] [CrossRef]
- Pan, J.; Tompkins, W.J. A Real-Time QRS Detection Algorithm. IEEE Trans. Biomed. Eng. 1985, 32, 230–236. [Google Scholar] [CrossRef]
- Kemper, K.J.; Hamilton, C.; Atkinson, M. Heart rate variability: Impact of differences in outlier identification and management strategies on common measures in three clinical populations. Pediatr. Res. 2007, 62, 337–342. [Google Scholar] [CrossRef]
- Zhang, K.; Zhang, L.; Liu, Q.; Zhang, D.; Yang, M.-H. Fast tracking via spatio-temporal context learning. In Proceedings of the European Conference on Computer Vision, Zurich, Switzerland, 6–7 September 2014; Springer: Cham, Switzerland; pp. 127–141. [Google Scholar] [CrossRef]
- Daubechies, I.; Lu, J.; Wu, H.-T. Synchrosqueezed wavelet transforms: An empirical mode decomposition-like tool. Appl. Comput. Harmon. Anal. 2011, 30, 243–261. [Google Scholar] [CrossRef]
- Hultman, M.; Johansson, I.; Lindqvist, F.; Ahlström, C. Driver sleepiness detection with deep neural networks using electrophysiological data. Physiol. Meas. 2021, 42, 034001. [Google Scholar] [CrossRef] [PubMed]
- Jeong, J.-H.; Yu, B.-W.; Lee, D.-H.; Lee, S.-W. Classification of Drowsiness Levels Based on a Deep Spatio-Temporal Convolutional Bidirectional LSTM Network Using Electroencephalography Signals. Brain Sci. 2019, 9, 348. [Google Scholar] [CrossRef] [PubMed]
- Korkalainen, H.; Aakko, J.; Duce, B.; Kainulainen, S.; Leino, A.; Nikkonen, S.; Afara, I.O.; Myllymaa, S.; Töyräs, J.; Leppänen, T. Deep learning enables sleep staging from photoplethysmogram for patients with suspected sleep apnea. Sleep 2020, 43, zsaa098. [Google Scholar] [CrossRef]
- Korkalainen, H.; Leppanen, T.; Aakko, J.; Nikkonen, S.; Kainulainen, S.; Leino, A.; Duce, B.; Afara, I.O.; Myllymaa, S.; Toyras, J. Accurate Deep Learning-Based Sleep Staging in a Clinical Population with Suspected Obstructive Sleep Apnea. IEEE J. Biomed. Heal. Inform. 2020, 24, 2073–2081. [Google Scholar] [CrossRef] [PubMed]
- Oh, S.; Lee, J.-Y.; Kim, D.K. The design of CNN architectures for optimal six basic emotion classification using multiple physiological signals. Sensors 2020, 20, 866. [Google Scholar] [CrossRef]
- Barua, S.; Ahmed, M.U.; Ahlström, C.; Begum, S. Automatic driver sleepiness detection using EEG, EOG and contextual information. Expert Syst. Appl. 2019, 115, 121–135. [Google Scholar] [CrossRef]
- Arefnezhad, S.; Eichberger, A.; Frühwirth, M.; Kaufmann, C.; Moser, M.; Koglbauer, I.V. Driver monitoring of automated vehicles by classification of driver drowsiness using a deep convolutional neural network trained by scalograms of ECG signals. Energies 2022, 15, 480. [Google Scholar] [CrossRef]
- Lemkaddem, A.; Delgado-Gonzalo, R.; Türetken, E.; Dasen, S.; Moser, V.; Gressum, C.; Solà, J.; Ferrario, D.; Verjus, C. Multi-modal driver drowsiness detection: A feasibility study. In Proceedings of the 2018 IEEE EMBS International Conference on Biomedical & Health Informatics (BHI), Las Vegas, NV, USA, 4–7 March 2018; pp. 9–12. [Google Scholar] [CrossRef]
- Reddy, B.; Kim, Y.-H.; Yun, S.; Seo, C.; Jang, J. Real-time driver drowsiness detection for embedded system using model compression of deep neural networks. In Proceedings of the 2017 IEEE Conference on Computer Vision and Pattern Recognition Workshops (CVPRW), Honolulu, HI, USA, 21–26 July 2017; pp. 438–445. [Google Scholar] [CrossRef]
- Chen, S.; Wang, Z.; Chen, W. Driver drowsiness estimation based on factorized bilinear feature fusion and a long-short-term recurrent convolutional network. Information 2020, 12, 3. [Google Scholar] [CrossRef]


| Hyperparameter | Search Space | Model 1 (CNN) | Model 2 (CNN-LSTM) |
|---|---|---|---|
| Number of filters in the first CNN layer | 64, 128, 256 | 64 | 64 |
| Filter length of the first CNN layer | 3–10 | 5 | 5 |
| Number of cells in the first LSTM layer | 64, 128, 256 | - | 256 |
| Batch size | 32, 64, 128 | 64 | 32 |
| Learning rate | 0.001–0.00001 | 0.0001 | 0.0001 |
| Model Name | Input Signal | Accuracy (%) | Sensitivity (%) | Specificity (%) | Precision (%) |
|---|---|---|---|---|---|
| CNN | HRV | 55 | 58 | 59 | 56 |
| HRV-PSD | 63 | 61 | 61 | 59 | |
| RR | 66 | 62 | 61 | 65 | |
| HRV + HRV-PSD | 65 | 63 | 60 | 62 | |
| HRV + RR | 72 | 67 | 71 | 70 | |
| HRV-PSD + RR | 68 | 64 | 65 | 65 | |
| All inputs | 84 | 80 | 88 | 80 | |
| CNN-LSTM | HRV | 72 | 65 | 71 | 61 |
| HRV-PSD | 73 | 65 | 72 | 64 | |
| RR | 81 | 76 | 83 | 74 | |
| HRV + HRV-PSD | 78 | 71 | 81 | 70 | |
| HRV + RR | 82 | 77 | 84 | 80 | |
| HRV-PSD + RR | 77 | 71 | 79 | 70 | |
| All inputs | 91 | 87 | 92 | 87 |
| Model Name | Input Signal | Accuracy (%) | Sensitivity (%) | Specificity (%) | Precision (%) |
|---|---|---|---|---|---|
| CNN | HRV | 51 | 50 | 48 | 51 |
| HRV-PSD | 52 | 53 | 54 | 52 | |
| RR | 55 | 59 | 56 | 52 | |
| HRV + HRV-PSD | 57 | 56 | 56 | 52 | |
| HRV + RR | 59 | 60 | 61 | 56 | |
| HRV-PSD + RR | 57 | 59 | 52 | 56 | |
| All inputs | 64 | 62 | 67 | 62 | |
| CNN-LSTM | HRV | 54 | 50 | 51 | 50 |
| HRV-PSD | 58 | 56 | 63 | 54 | |
| RR | 60 | 60 | 65 | 63 | |
| HRV + HRV-PSD | 61 | 60 | 61 | 59 | |
| HRV + RR | 63 | 62 | 62 | 63 | |
| HRV-PSD + RR | 60 | 55 | 62 | 53 | |
| All inputs | 67 | 67 | 70 | 66 |
| Study | Method | Physiological Signal | Variable | Accuracy |
|---|---|---|---|---|
| Barua et al., 2018 [58] | Support vector machine | EEG and EOG | EEG-PSD, blink duration, and contextual analysis | 79% (3-level) |
| Lemkaddem et al., 2018 [60] | Support vector machine | PPG | HRV and PERCLOS | 89% (3-level) |
| Persson et al., 2020 [22] | Random forest classifier | ECG | HRV | 64% (3-level) |
| Arefnezhad et al., 2022 [59] | CNN | ECG | Scalogram of ECG | 79% (3-level) |
| Hultman et al., 2021 [53] | CNN-LSTM | ECG and EOG | Pre-processed ECG and EOG signals | 46% (5-level) |
| Jeon et al., 2019 [54] | Deep spatiotemporal convolutional bidirectional LSTM network (DSTCLN) | EEG | Pre-processed EEG signal | 69% (5-level) |
| This paper | CNN-LSTM | ECG and respiration | HRV, HRV-PSD, and respiration rate | 91% (3-level) 67% (5-level) |
Publisher’s Note: MDPI stays neutral with regard to jurisdictional claims in published maps and institutional affiliations. |
© 2022 by the authors. Licensee MDPI, Basel, Switzerland. This article is an open access article distributed under the terms and conditions of the Creative Commons Attribution (CC BY) license (https://creativecommons.org/licenses/by/4.0/).
Share and Cite
Ebrahimian, S.; Nahvi, A.; Tashakori, M.; Salmanzadeh, H.; Mohseni, O.; Leppänen, T. Multi-Level Classification of Driver Drowsiness by Simultaneous Analysis of ECG and Respiration Signals Using Deep Neural Networks. Int. J. Environ. Res. Public Health 2022, 19, 10736. https://doi.org/10.3390/ijerph191710736
Ebrahimian S, Nahvi A, Tashakori M, Salmanzadeh H, Mohseni O, Leppänen T. Multi-Level Classification of Driver Drowsiness by Simultaneous Analysis of ECG and Respiration Signals Using Deep Neural Networks. International Journal of Environmental Research and Public Health. 2022; 19(17):10736. https://doi.org/10.3390/ijerph191710736
Chicago/Turabian StyleEbrahimian, Serajeddin, Ali Nahvi, Masoumeh Tashakori, Hamed Salmanzadeh, Omid Mohseni, and Timo Leppänen. 2022. "Multi-Level Classification of Driver Drowsiness by Simultaneous Analysis of ECG and Respiration Signals Using Deep Neural Networks" International Journal of Environmental Research and Public Health 19, no. 17: 10736. https://doi.org/10.3390/ijerph191710736