
Area-Level Determinants in Colorectal Cancer Spatial Clustering Studies: A Systematic Review


 , ,
, ,
Abstract
:1. Introduction
2. Materials and Methods
2.1. Formulation of the Research Question
2.2. Systematic Searching Strategies
2.3. Identification
2.4. Screening
2.5. Eligibility
2.6. Quality Appraisal
2.7. Data Abstraction and Analysis
3. Results
3.1. Type of Spatial Analysis
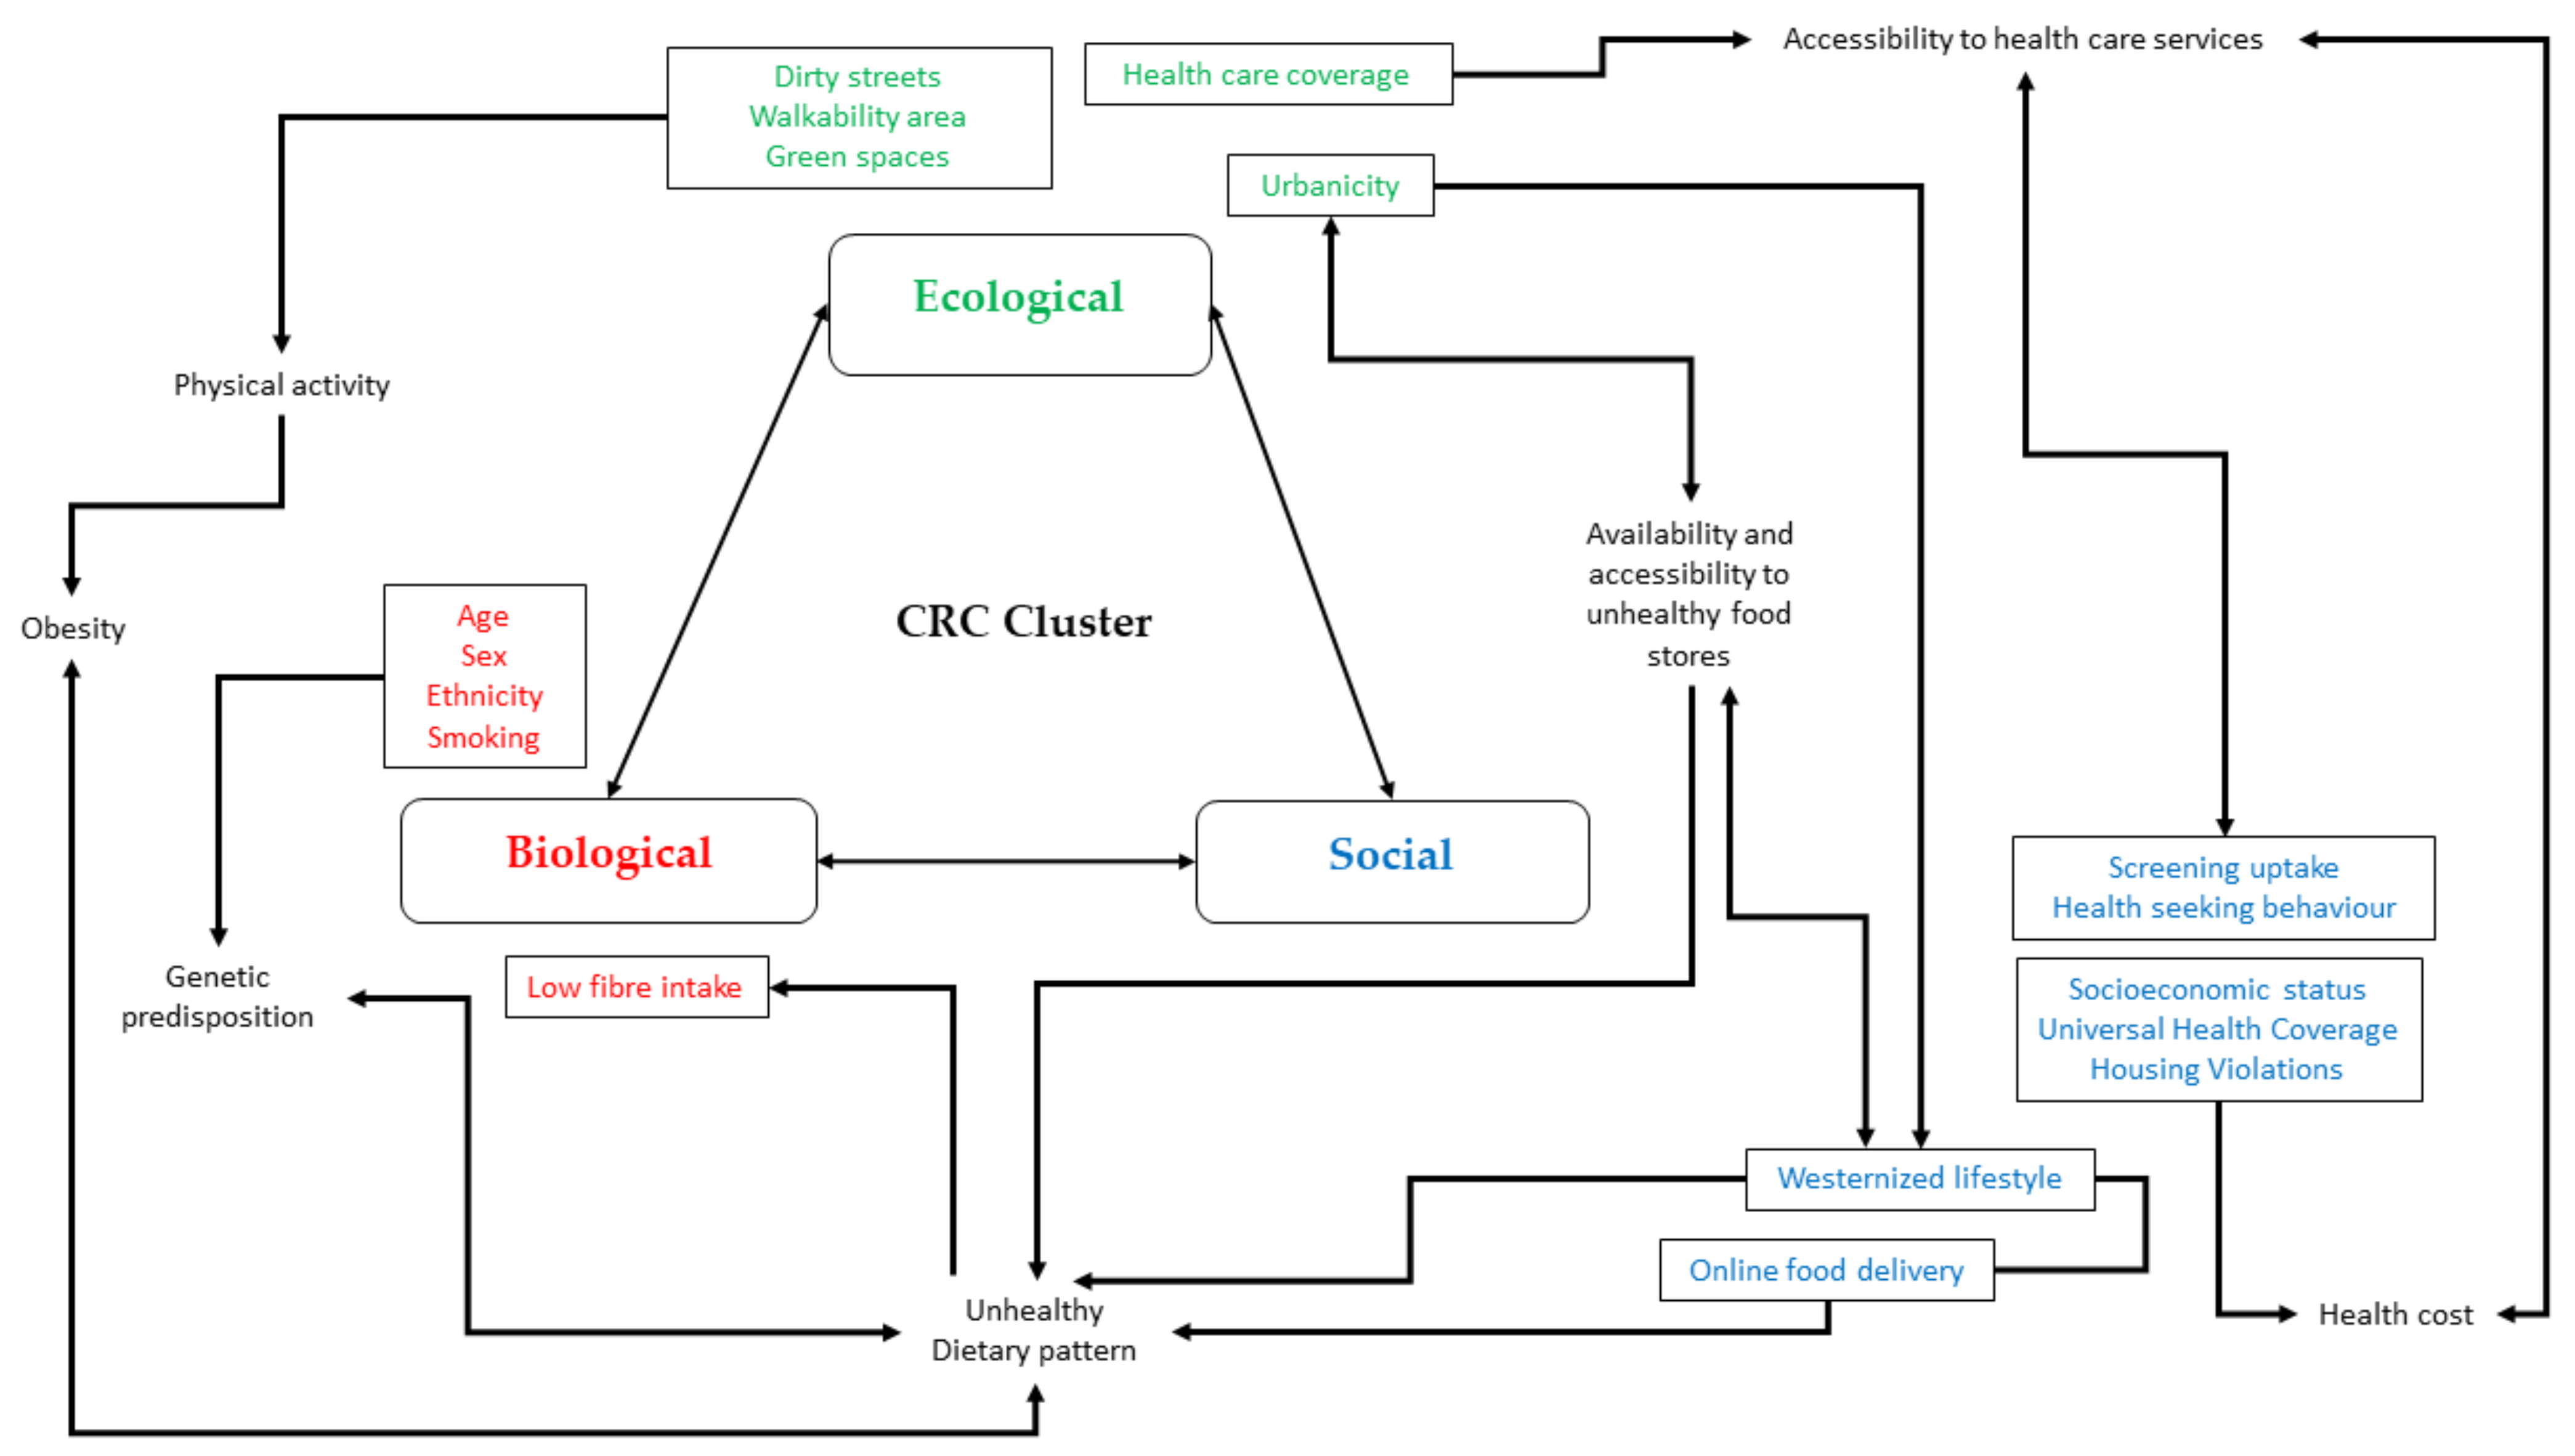
3.2. Factors Associated with CRC Cluster
4. Discussion
4.1. Strength
4.2. Limitation
5. Conclusions
Author Contributions
Funding
Institutional Review Board Statement
Informed Consent Statement
Data Availability Statement
Acknowledgments
Conflicts of Interest
References
- James, S.L.; Lucchesi, L.R.; Bisignano, C.; Castle, C.D.; Dingels, Z.V.; Fox, J.T.; Hamilton, E.B.; Liu, Z.; McCracken, D.; Nixon, M.R.; et al. Morbidity and mortality from road injuries: Results from the Global Burden of Disease Study 2017. Inj. Prev. 2019, 26, i46–i56. [Google Scholar] [CrossRef]
- Siegel, R.L.; Torre, L.A.; Soerjomataram, I.; Hayes, R.B.; Bray, F.; Weber, T.K.; Jemal, A. Global patterns and trends in colorectal cancer incidence in young adults. Gut 2019, 68, 2179–2185. [Google Scholar] [CrossRef] [Green Version]
- Rawla, P.; Sunkara, T.; Barsouk, A. Epidemiology of colorectal cancer: Incidence, mortality, survival, and risk factors. Prz. Gastroenterol. 2019, 14, 89–103. [Google Scholar] [CrossRef]
- Ibrahim, N.R.W.; Chan, H.K.; Soelar, S.A.; Azmi, A.N.; Said, R.M.; Hassan, M.R.A. Incidence, clinico-demographic profiles and survival rates of colorectal cancer in Northern Malaysia: Comparing patients above and below 50 years of age. Asian Pac. J. Cancer Prev. 2020, 21, 1057–1061. [Google Scholar] [CrossRef] [PubMed]
- Rogers, C.R.; Moore, J.X.; Qeadan, F.; Gu, L.Y.; Huntington, M.S.; Holowatyj, A.N. Examining factors underlying geographic disparities in early-onset colorectal cancer survival among men in the United States. Am. J. Cancer Res. 2020, 10, 1592–1607. [Google Scholar] [PubMed]
- Aungkulanon, S.; Tangcharoensathien, V.; Shibuya, K.; Bundhamcharoen, K.; Chongsuvivatwong, V. Area-level socioeconomic deprivation and mortality differentials in Thailand: Results from principal component analysis and cluster analysis. Int. J. Equity Health 2017, 16, 117. [Google Scholar] [CrossRef] [Green Version]
- Chazelas, E.; Srour, B.; Desmetz, E.; Kesse-Guyot, E.; Julia, C.; Deschamps, V.; Druesne-Pecollo, N.; Galan, P.; Hercberg, S.; Latino-Martel, P.; et al. Sugary drink consumption and risk of cancer: Results from NutriNet-Santé prospective cohort. BMJ 2019, 366, I2408. [Google Scholar] [CrossRef] [PubMed] [Green Version]
- Domingo, J.L.; Nadal, M. Carcinogenicity of consumption of red meat and processed meat: A review of scientific news since the IARC decision. Food Chem. Toxicol. 2017, 105, 256–261. [Google Scholar] [CrossRef] [PubMed]
- Tyrrell, J.; Wood, A.R.; Ames, R.M.; Yaghootkar, H.; Beaumont, R.N.; Jones, S.E.; Tuke, M.A.; Ruth, K.S.; Freathy, R.M.; Smith, G.D.; et al. Gene-obesogenic environment interactions in the UK Biobank study. Int. J. Epidemiol. 2017, 46, 559–575. [Google Scholar] [CrossRef] [Green Version]
- Murphy, N.; Moreno, V.; Hughes, D.V.; Vodicka, L.; Vodicka, P.; Aglago, E.K.; Gunter, M.J.; Jenab, M. Lifestyle and dietary environmental factors in colorectal cancer susceptibility. Mol. Aspects Med. 2019, 69, 2–9. [Google Scholar] [CrossRef]
- Torres, A.Z.; Phelan-Emrick, D.; Castillo-Salgado, C. Evaluating Neighborhood Correlates and Geospatial Distribution of Breast, Cervical, and Colorectal Cancer Incidence. Front. Oncol. 2018, 8, 1–10. [Google Scholar] [CrossRef] [PubMed]
- Andrilla, C.H.A.; Moore, T.E.; Man Wong, K.; Evans, D.V. Investigating the Impact of Geographic Location on Colorectal Cancer Stage at Diagnosis: A National Study of the SEER Cancer Registry. J. Rural Health 2020, 36, 316–325. [Google Scholar] [CrossRef] [PubMed]
- Wong, M.C.; Ding, H.; Wang, J.; Chan, P.S.; Huang, J. Prevalence and risk factors of colorectal cancer in Asia. Intest. Res. 2019, 17, 317–329. [Google Scholar] [CrossRef] [PubMed] [Green Version]
- Shvetsov, Y.B.; Shariff-Marco, S.; Yang, J.; Conroy, S.M.; Canchola, A.J.; Albright, C.L.; Park, S.; Monroe, K.R.; Marchand, L.L.; Gomez, S.L.; et al. Association of change in the neighborhood obesogenic environment with colorectal cancer risk: The Multiethnic Cohort Study. SSM—Popul. Health 2020, 10, 100532. [Google Scholar] [CrossRef]
- Keum, N.N.; Giovannucci, E. Global burden of colorectal cancer: Emerging trends, risk factors and prevention strategies. Nat. Rev. Gastroenterol. Hepatol. 2019, 16, 713–732. [Google Scholar] [CrossRef]
- Dekker, E.; Tanis, P.J.; Vleugels, J.L.A.; Kasi, P.M.; Wallace, M.B. Colorectal cancer. Lancet 2019, 394, 1467–1480. [Google Scholar] [CrossRef]
- Stracci, F.; Gili, A.; Naldini, G.; Gianfredi, V.; Malaspina, M.; Passamonti, B.; Bianconi, F. Geospatial analysis of the influence of family doctor on colorectal cancer screening adherence. PLoS ONE 2019, 14, e0222396. [Google Scholar] [CrossRef]
- Glover, M.; Mansoor, E.; Panhwar, M.; Parasa, S.; Cooper, G.S. Epidemiology of Colorectal Cancer in Average Risk Adults 20–39 Years of Age: A Population-Based National Study. Dig. Dis. Sci. 2019, 64, 3602–3609. [Google Scholar] [CrossRef]
- Ling, O.H.L.; Mohamed Musthafa, S.N.A.; Hamzah, M.S.; Marzukhi, M.A.; Mabahwi, N.A. Health and Physical Activity in Urban Neighbourhoods. Case Study: Shah Alam City, Selangor, Malaysia. Built Environ. J. 2020, 17, 11. [Google Scholar] [CrossRef]
- Mahendra, A.; Polsky, J.Y.; Robitaille, É.; Lefebvre, M.; McBrien, T.; Minaker, L.M. Geographic retail food environment measures for use in public health. Health Promot. Chronic Dis. Prev. Can. 2017, 37, 357–362. [Google Scholar] [CrossRef] [Green Version]
- Quintero, J.; Pulido, N.R.; Logan, J.; Ant, T.; Bruce, J.; Carrasquilla, G. Effectiveness of an intervention for Aedes aegypti control scaled-up under an intersectoral approach in a Colombian city hyperendemic for dengue virus. PLoS ONE 2020, 15, e0230486. [Google Scholar] [CrossRef]
- Ulijaszek, S.; McLennan, A.; Graff, H. Interactions: Lessons from Obesity. In A Companion to the Anthropology of Environmental Health; John Wiley & Sons: Hoboken, NJ, USA, 2016; p. 85. [Google Scholar]
- Rushton, G.; Peleg, I.; Banerjee, A.; Smith, G.; West, M. Analyzing geographic patterns of disease incidence: Rates of late-stage colorectal cancer in Iowa. J. Med. Syst. 2004, 28, 223–236. [Google Scholar] [CrossRef]
- Geoffrey, M.J.; Dunrie, A.G. Local clustering in breast, lung and colorectal cancer in Long Island, New York. Int. J. Health Geogr. 2003, 2, 1–12. [Google Scholar]
- National Cancer Institute: Cancer Clusters. 2018. Available online: https://www.cancer.gov/about-cancer/causes-prevention/risk/substances/cancer-clusters-fact-sheet (accessed on 20 July 2021).
- He, R.; Zhu, B.; Liu, J.; Zhang, N.; Zhang, W.H.; Mao, Y. Women’s cancers in China: A spatio-temporal epidemiology analysis. BMC Women’s Health 2021, 21, 116. [Google Scholar] [CrossRef]
- Cho, J.; You, S.C.; Lee, S.; Park, D.; Park, B.; Hripcsak, G.; Park, R.W. Application of epidemiological geographic information system: An open-source spatial analysis tool based on the OMOP common data model. Int. J. Environ. Res. Public Health 2020, 17, 7824. [Google Scholar] [CrossRef]
- Page, M.; McKenzie, J.; Bossuyt, P.; Boutron, I.; Hoffmann, T.; Mulrow, C. The PRISMA 2020 statement: An updated guideline for reporting systematic reviews. BMJ 2021, 372, n71. [Google Scholar] [CrossRef]
- Downes, M.J.; Brennan, M.L.; Williams, H.C.; Dean, R.S. Development of a critical appraisal tool to assess the quality of cross-sectional studies (AXIS). BMJ Open 2016, 6, 1–7. [Google Scholar] [CrossRef] [PubMed] [Green Version]
- Lockwood, C.; Munn, Z.; Porritt, K. Qualitative research synthesis: Methodological guidance for systematic reviewers utilizing meta-aggregation. JBI Evid. Implement. 2015, 13, 179–187. [Google Scholar] [CrossRef] [PubMed]
- Higgins, J.P.; Thomas, J.; Chandler, J.; Cumpston, M.; Li, T.; Page, M.J.; Welch, V.A. Cochrane Handbook for Systematic Reviews of Interventions; John Wiley & Sons: Hoboken, NJ, USA, 2019. [Google Scholar]
- Liu, Z.; Zhang, K.; Du, X.L. Risks of developing breast and colorectal cancer in association with incomes and geographic locations in Texas: A retrospective cohort study. BMC Cancer 2016, 16, 294. [Google Scholar] [CrossRef] [Green Version]
- Pourhoseingholi, M.A.; Nahafimehr, H.; Kavousi, A.; Pasharavesh, L.; Khanabadi, B. The spatial distribution of colorectal cancer relative risk in Iran: A nationwide spatial study. Gastroenterol. Hepatol. Bed Bench 2020, 13, S40–S46. [Google Scholar] [PubMed]
- Halimi, L.; Bagheri, N.; Hoseini, B.; Hashtarkhani, S. Spatial Analysis of Colorectal Cancer Incidence in Hamadan Province, Iran: A Retrospective Cross-Sectional Study. Appl. Spat. Anal. Policy 2020, 13, 293–303. [Google Scholar] [CrossRef]
- Roquette, R.; Painho, M.; Nunes, B. Geographical patterns of the incidence and mortality of colorectal cancer in mainland Portugal municipalities (2007–2011). BMC Cancer 2019, 19, 512. [Google Scholar] [CrossRef]
- Mansori, K.; Solaymani-Dodaran, M.; Mosavi-Jarrahi, A.; Motlagh, A.G.; Salehi, M.; Delavari, A.; Hosseini, A.; Asadi-Lari, M. Determination of effective factors on geographic distribution of the incidence of colorectal cancer in Tehran using geographically weighted Poisson regression model. Med. J. Islam. Repub. Iran 2019, 33, 23. [Google Scholar] [CrossRef] [PubMed]
- Pakzad, R.; Moudi, A.; Pournamdar, Z.; Pakzad, I.; Mohammadian-Hafshejani, A.; Momenimovahed, Z.; Salehiniya, H.; Towhidi, F.; Makhsosi, B.R. Spatial analysis of colorectal cancer in Iran. Asian Pac. J. Cancer Prev. 2016, 17, 53–57. [Google Scholar] [CrossRef] [PubMed] [Green Version]
- Mansori, K.; Solaymani-Dodaran, M.; Mosavi-Jarrah, A.; Motlagh, A.G.; Salehi, M.; Delavari, A.; Asadi-Lari, M. Spatial inequalities in the incidence of colorectal cancer and associated factors in the neighborhoods of Tehran, Iran: Bayesian spatial models. J. Prev. Med. Public Health 2018, 51, 33–40. [Google Scholar] [CrossRef] [Green Version]
- Goshayeshi, L.; Purahmadi, A.; Ghayour-Mobarhan, M.; Hashtarkhani, S.; Karimian, S.; Dastjerdi, R.S.; Eghbali, B.; Seyfi, E.; Kiani, B. Colorectal cancer risk factors in North-Eastern Iran: A retrospective cross-sectional study based on geographical information systems, spatial autocorrelation and regression analysis. Geospat. Health 2019, 14, 219–228. [Google Scholar] [CrossRef] [PubMed]
- Braun, V.; Clarke, V. Using thematic analysis in psychology. Qual. Res. Psychol. 2006, 3, 77–101. [Google Scholar] [CrossRef] [Green Version]
- Singh, H.; Nugent, Z.; Decker, K.; Demers, A.; Samaddar, J.; Torabi, M. Geographic variation and factors associated with colorectal cancer incidence in Manitoba. Can. J. Public Health 2017, 108, e558–e564. [Google Scholar] [CrossRef] [Green Version]
- Kuo, T.M.; Meyer, A.M.; Baggett, C.D.; Olshan, A.F. Examining determinants of geographic variation in colorectal cancer mortality in North Carolina: A spatial analysis approach. Cancer Epidemiol. 2019, 59, 8–14. [Google Scholar] [CrossRef]
- Goungounga, J.A.; Gaudart, J.; Colonna, M.; Giorgi, R. Impact of socioeconomic inequalities on geographic disparities in cancer incidence: Comparison of methods for spatial disease mapping. BMC Med. Res. Methodol. 2016, 16, 136. [Google Scholar] [CrossRef] [Green Version]
- Jacquez, G. Spatial Cluster Analysis. In The Handbook of Geographic Information Science; Blackwell Publishing: Hoboken, NJ, USA, 2008; pp. 395–416. [Google Scholar]
- Congdon, P. Variations in obesity rates between US counties: Impacts of activity access, food environments, and settlement patterns. Int. J. Environ. Res. Public Health 2017, 14, 1023. [Google Scholar] [CrossRef] [Green Version]
- Blangiardo, M.; Boulieri, A.; Diggle, P.; Piel, F.B.; Shaddick, G.; Elliott, P. Advances in spatiotemporal models for non-communicable disease surveillance. Int. J. Epidemiol. 2020, 49, I26–I37. [Google Scholar] [CrossRef]
- Centers for Disease Control and Prevention. Investigating Suspected Cancer Clusters and Responding to Community Concerns: Guidelines from CDC and the Council of State and Territorial Epidemiologists; Morbidity and Mortality Weekly Report 62(RR08); Centers for Disease Control and Prevention: Atlanta, GA, USA, 2013; pp. 1–14.
- Roquette, R.; Painho, M.; Nunes, B. Spatial epidemiology of cancer: A review of data sources, methods and risk factors. Geospat. Health 2017, 12, 2000–2010. [Google Scholar] [CrossRef] [Green Version]
- Nethery, R.C.; Yang, Y.; Brown, A.J.; Dominici, F. A causal inference framework for cancer cluster investigations using publicly available data. J. R. Stat. Soc. Ser. A Stat. Soc. 2020, 183, 1253–1272. [Google Scholar] [CrossRef]
- Amin, R.W.; Fritsch, B.A.; Retzloff, J.E. Spatial Clusters of Breast Cancer Mortality and Incidence in the Contiguous USA: 2000–2014. J. Gen. Intern. Med. 2019, 34, 412–419. [Google Scholar] [CrossRef] [Green Version]
- Tian, Y.; Li, J.; Zhou, T.; Tong, D.; Chi, S.; Kong, X.; Ding, K.; Li, J. Spatially varying effects of predictors for the survival prediction of nonmetastatic colorectal Cancer. BMC Cancer 2018, 18, 1084. [Google Scholar] [CrossRef]
- Amin, R.W.; Rivera, B. A spatial study of oral & pharynx cancer mortality and incidence in the U.S.A.: 2000–2015. Sci. Total Environ. 2020, 713, 136688. [Google Scholar] [PubMed]
- Tillé, Y.; Dickson, M.M.; Espa, G.; Giuliani, D. Measuring the spatial balance of a sample: A new measure based on Moran’s I index. Spat. Stat. 2018, 23, 182–192. [Google Scholar] [CrossRef] [Green Version]
- Gibson, D.C.; Prochaska, J.D.; Yu, X.; Kaul, S. An examination between census tract unhealthy food availability and colorectal cancer incidence. Cancer Epidemiol. 2020, 67, 101761. [Google Scholar] [CrossRef] [PubMed]
- Hossain, F.; Danos, D.; Prakash, O.; Gilliland, A.; Ferguson, T.F.; Simonsen, N.; Leonardi, C.; Yu, Q.; Wu, X.C.; Miele, L.; et al. Neighborhood social determinants of triple negative breast cancer. Front. Public Health 2019, 7, 1–8. [Google Scholar] [CrossRef] [PubMed]
- Fujita, M.; Sato, Y.; Nagashima, K.; Takahashi, S.; Hata, A. Impact of geographic accessibility on utilization of the annual health check-ups by income level in Japan: A multilevel analysis. PLoS ONE 2017, 12, e0177091. [Google Scholar] [CrossRef] [Green Version]
- Mueller, W.; Wilkinson, P.; Milner, J.; Vardoulakis, S.; Steinle, S.; Parkka, J.; Parmes, E.; Cluitmans, L.; Kuijpers, E.; Pronk, A.; et al. Neighbourhood and path-based greenspace in three European countries: Associations with objective physical activity. BMC Public Health 2021, 21, 282. [Google Scholar] [CrossRef] [PubMed]
- Wende, M.E.; Stowe, E.W.; Eberth, J.M.; McLain, A.C.; Liese, A.D.; Breneman, C.B.; Josey, M.J.; Hughey, S.M.; Kaczynski, A.T. Spatial clustering patterns and regional variations for food and physical activity environments across the United States. Int. J. Environ. Health Res. 2020, 00, 1–15. [Google Scholar] [CrossRef] [PubMed]
- Janssen, H.G.; Davies, H.G.; Richardson, L.D.; Stevenson, L. Determinants of takeaway and fast-food consumption: A narrative review. Nutr. Res. Rev. 2018, 31, 16–34. [Google Scholar] [CrossRef]
- Wray, A.J.D.; Minaker, L.M. Is cancer prevention influenced by the built environment? A multidisciplinary scoping review. Cancer 2019, 125, 3299–3311. [Google Scholar] [CrossRef]
- Mabry, R.M.; Al Siyabi, H.; Kannan, M.; Al Siyabi, A. Physical activity and the built environment: Perceptions of policy-makers in Oman. Health Promot. Int. 2020, 35, 762–770. [Google Scholar] [CrossRef]
- Caperon, L.; Arjyal, A.; Puja, K.C.; Kuikel, J.; Newell, J.; Peters, R.; Prestwich, A.; King, R. Developing a socio-ecological model of dietary behaviour for people living with diabetes or high blood glucose levels in urban Nepal: A qualitative investigation. PLoS ONE 2019, 14, e0214142. [Google Scholar] [CrossRef]
- Yuen, J.W.; Chang, K.K.; Wong, F.K.; Wong, F.Y.; Siu, J.Y.; Ho, H.C.; Wong, M.S.; Ho, J.; Chan, K.L.; Yang, L. Influence of urban green space and facility accessibility on exercise and healthy diet in Hong Kong. Int. J. Environ. Res. Public Health 2019, 16, 1514. [Google Scholar] [CrossRef] [Green Version]
- Zhang, Y.C.; Zhao, H.; Chen, C.; Ali, M.A. COX-2 gene rs689466 polymorphism is associated with increased risk of colorectal cancer among Caucasians: A meta-Analysis. World J. Surg. Oncol. 2020, 18, 1–9. [Google Scholar] [CrossRef] [PubMed]
- Gausman, V.; Dornblaser, D.; Anand, S.; Hayes, R.B.; O’Connell, K.; Du, M.; Liang, P.S. Risk Factors Associated with Early-Onset Colorectal Cancer. Clin. Gastroenterol. Hepatol. 2020, 18, 2752–2759. [Google Scholar] [CrossRef] [PubMed]
- Zhan, F.B.; Morshed, N.; Kluz, N.; Candelaria, B.; Baykal-Caglar, E.; Khurshid, A.; Pignone, M.P. Spatial Insights for Understanding Colorectal Cancer Screening in Disproportionately Affected Populations, Central Texas, 2019. Prev. Chronic Dis. 2021, 18, 1–7. [Google Scholar] [CrossRef] [PubMed]
- Carethers, J.M.; Doubeni, C.A. Causes of Socioeconomic Disparities in Colorectal Cancer and Intervention Framework and Strategies. Gastroenterology 2020, 158, 354–367. [Google Scholar] [CrossRef]
- Danos, D.M.; Ferguson, T.F.; Simonsen, N.R.; Leonardi, C.; Yu, Q.; Wu, X.C.; Scribner, R.A. Neighborhood disadvantage and racial disparities in colorectal cancer incidence: A population-based study in Louisiana. Ann. Epidemiol. 2018, 28, 316–321. [Google Scholar] [CrossRef] [PubMed]
- Ni, K.; O’Connell, K.; Anand, S.; Yakoubovitch, S.C.; Kwon, S.C.; De Latour, R.A.; Wallach, A.B.; Sherman, S.E.; Du, M.; Liang, P.S. Low colorectal cancer screening uptake and persistent disparities in an underserved urban population. Cancer Prev. Res. 2020, 13, 395–402. [Google Scholar] [CrossRef] [PubMed]
- Maimaiti, M.; Ma, X.; Zhao, X.; Jia, M.; Li, J.; Yang, M.; Ru, Y.; Yang, F.; Wang, N.; Zhu, S. Multiplicity and complexity of food environment in China: Full-scale field census of food outlets in a typical district. Eur. J. Clin. Nutr. 2020, 74, 397–408. [Google Scholar] [CrossRef] [PubMed]
- Pan, T.; Liu, J.; Xu, S.; Yu, Q.; Wang, H.; Sun, H.; Wu, J.; Zhu, Y.; Zhou, J.; Zhu, Y. ANKRD22, a novel tumor microenvironment-induced mitochondrial protein promotes metabolic reprogramming of colorectal cancer cells. Theranostics 2020, 10, 516–536. [Google Scholar] [CrossRef]
- Qi, L.; Zhang, Y.; Zhang, W.; Wang, Y.; Han, Y.; Ding, Y. The inhibition of colorectal cancer growth by the natural product macrocarpal I. Free Radic. Biol. Med. 2021, 162, 383–391. [Google Scholar] [CrossRef]


| Database | Search String |
|---|---|
| Scopus | TITLE-ABS-KEY ((“colorectal cancer” OR “colorectal neoplasm * 1” OR “colorectal tumor *” OR “colorectal carcinoma” OR “large bowel cancer”) AND (“cluster analysis” OR “spatial analysis” OR “geographical information system” OR “geographic distribution” OR “incidence distribution” OR “demography”)) AND (“risk factor *” OR “cancer risk” OR “determinant *”)) |
| Web of Science | TS = ((“colorectal cancer” OR “colorectal neoplasm *” OR “colorectal tumor *” OR “colorectal carcinoma” OR “large bowel cancer”) AND (“cluster analysis” OR “spatial analysis” OR “geographical information system” OR “geographic distribution” OR “incidence distribution” OR “demography”)) AND (“risk factor *” OR “cancer risk” OR “determinant *”)) |
| PubMed | ((“colorectal cancer” OR “colorectal neoplasm *” OR “colorectal tumor *” OR “colorectal carcinoma” OR “large bowel cancer”) AND (“cluster analysis” OR “spatial analysis” OR “geographical information system” OR “geographic distribution” OR “incidence distribution” OR “demography”)) AND (“risk factor *” OR “cancer risk” OR “determinant *”)) |
| EBSCOHost | ((“colorectal cancer” OR “colorectal neoplasm *” OR “colorectal tumor *” OR “colorectal carcinoma” OR “large bowel cancer”) AND (“cluster analysis” OR “spatial analysis” OR “geographical information system” OR “geographic distribution” OR “incidence distribution” OR “demography”)) AND (“risk factor *” OR “cancer risk” OR “determinant *”)) |
| Articles | Introduction | Methods | |||||||||
|---|---|---|---|---|---|---|---|---|---|---|---|
| Author (Year), Country | Were the aims/objectives of the study clear? | Was the study design appropriate for the stated aim(s)? | Was the sample size justified? | Was the target/reference population clearly defined? | Was the sample frame taken from an appropriate population base so that it closely represented the target/reference population under investigation? | Was the selection process likely to select subjects/participants that were representative of the target/reference population under investigation? | Were measures undertaken to address and categorise non-responders? | Were the risk factor and outcome variables measured appropriate to the aims of the study? | Were the risk factor and outcome variables measured correctly using instruments/measurements that had been trialled, piloted, or published previously? | Is it clear what was used to determine statistical significance and/or precision estimates? | Were the methods (including statistical methods) sufficiently described to enable them to be repeated? |
| Liu et al. (2016),United States | Y | Y | Y | Y | Y | Y | Y | Y | Y | Y | Y |
| Mansori et al. (2018), Iran | Y | y | y | y | y | y | CT | Y | Y | Y | Y |
| Mansori et al. (2019), Iran | Y | Y | Y | Y | Y | Y | CT | Y | Y | Y | Y |
| Pakzad et al. (2016), Iran | Y | Y | Y | Y | Y | Y | CT | Y | Y | Y | Y |
| Pourhoseingholi et al. (2020), Iran | Y | Y | Y | Y | Y | Y | Y | Y | Y | Y | Y |
| Goungounga et al. (2016), France | Y | Y | Y | Y | Y | Y | CT | Y | Y | Y | Y |
| Roquette et al. (2019), Portugal | Y | Y | Y | Y | Y | Y | CT | Y | Y | Y | Y |
| Torres et al. (2018), United States | Y | Y | Y | Y | Y | Y | CT | Y | Y | Y | Y |
| Halimi et al. (2019), Iran | Y | Y | Y | Y | Y | Y | Y | Y | Y | Y | Y |
| Harminder et al. (2017), Canada | Y | Y | Y | Y | Y | Y | CT | Y | Y | Y | Y |
| Kuo et al. (2019), United States | Y | Y | CT | Y | Y | Y | CT | Y | Y | Y | Y |
| Goshayeshi et al. (2019), Iran | Y | Y | Y | Y | Y | Y | CT | Y | Y | Y | Y |
| Articles | Results | Discussion | Other | ||||||||
| Were the basic data adequately described? | Does the response rate raise concerns about non-response bias? | If appropriate, was information about non-responders described? | Were the results internally consistent? | Were the results for the analyses described in the methods, presented? | Were the authors’ discussions and conclusions justified by the results? | Were the limitations of the study discussed? | Were there any funding sources or conflicts of interest that may affect the authors’ interpretation of the results? | Was ethical approval or consent of participants attained? | Total Recorded “Yes” | ||
| Liu et al. (2016), United States | Y | N | N | CT | Y | Y | Y | N | Y | 16 | |
| Mansori et al. (2018), Iran | Y | CT | CT | CT | Y | Y | Y | N | CT | 14 | |
| Mansori et al. (2019), Iran | Y | CT | CT | CT | Y | Y | Y | N | CT | 15 | |
| Pakzad et al. (2016), Iran | Y | N | CT | Y | Y | Y | Y | CT | CT | 15 | |
| Pourhoseingholi et al. (2020), Iran | Y | N | CT | Y | Y | Y | Y | N | CT | 16 | |
| Goungounga et al. (2016), France | Y | N | CT | Y | Y | Y | Y | N | Y | 16 | |
| Roquette et al. (2019), Portugal | N | N | CT | Y | Y | Y | Y | N | Y | 15 | |
| Torres et al. (2018), United States | Y | N | N | Y | Y | Y | Y | N | Y | 16 | |
| Halimi et al. (2019), Iran | Y | N | N | CT | Y | Y | Y | N | Y | 16 | |
| Harminder et al. (2017), Canada | Y | N | N | CT | Y | Y | Y | N | Y | 15 | |
| Kuo et al. (2019), United States | Y | N | CT | Y | Y | Y | Y | N | Y | 15 | |
| Goshayeshi et al. (2019), Iran | Y | N | CT | Y | Y | Y | Y | N | CT | 16 | |
| No. | Author (Year), Country | Objective | Study Design | Sample | Statistical Test | Findings | Factors Associated | Determinants | Limitation |
|---|---|---|---|---|---|---|---|---|---|
| 1 | Liu et al. (2016), United States | To determine the association between median household income and the risk of developing colorectal cancer in Texas | Retrospective cohort | 155,534 men and women with colorectal cancer in 1995–2011 | Getis-Ord G, Poisson regression model (ArcGIS v10.1) | Higher median household income, measured from the third to the highest income quintile ranging between $38,040 and $80,876, was associated with decreased risk of colorectal cancer in Texas. The Hispanics showed higher incidence rate of CRC compared to the Non-Hispanic Whites and Blacks at all time period, with slight decrease trend across higher median household income. | County median household income level (Median household incomes in 254 counties classified into five quintiles) Ethnicity (Non-Hispanic Whites, Non-Hispanic Blacks, Hispanics) | Social Biology | Income variable was the median household income measured at county level, thus potential ecological fallacy. Median household income alone may not be a good proxy for SES. Lack of accuracy in population estimates may led to biased calculation for CRC incidence |
| 2 | Mansori et al. (2018), Iran | To determine the factors associated with the spatial distribution of the CRC incidence in the neighborhoods of Tehran, Iran | Ecological | 2815 new cases of CRC from 2008 to 2011 | The Moran Index, BYM model (using OpenBUGS version 3.2.3, ArcGIS 10.3, GeoDa) | There was spatial autocorrelation at the level of the neighborhoods. Significant association was observed between women head of household, living in a rental house, no daily milk consumption in the household and higher household health expenditures against higher risk of CRC respectively. | Socioeconomic variables (SES): unemployed people aged 15 years and above, educated women (university level of education) aged 17 years old and above, women head of household, households without a car, those living in a rental house, households with income below the poverty line, people without insurance coverage. Risk factors: Households without daily fruit consumption, households without daily milk consumption, overweight people aged 15 years and above, smoking households. Health costs: Household health expenditures, expenditures on diagnoses, expenditures on medicine, expenditures on hospitals, expenditures on medical visits | Social Biology | Ecological fallacy. Edge effect, referring to border neighborhoods affected by size of adjacent regions. Misclassification in geocoding due to incomplete postal addresses. |
| 3 | Mansori et al. (2019), Iran | To determine effective factors on geographic distribution of the CRC incidence in Iran | Ecological | 2815 new cases of CRC from 2008 to 2011 | Geographically Weighted Poisson Regression Model (using GWR 4, Stata 14, ArcGIS 10.3) | The spatial variability was observed with more frequent utilization of health services as indicated by the household health expenditures (Median Incidence Risk Ratios (IRR): 1.39), the cost of diagnosis of the disease (Median IRR: 1.03), the cost of household medicine (Median IRR: 1.05), the cost of hospital admission (Median IRR: 1.09) and the cost of medical visits (Median IRR: 1.27) | Socioeconomic variables (SES) include employment status, education Daily fruit consumption, daily milk consumption, overweight, smoking Health costs variables | Social Biology | Ecological fallacy. Unclear addresses for geocoding. Covariates of age, older than 50 years and overweight |
| 4 | Pakzad et al. (2016), Iran | To investigate the spatial distribution of colorectal cancer in Iran | Ecological | 6210 cases of CRC in 2009 | Getis-Ord-Gi* (spatial statistics) | Higher incidence of CRC among men (11.31 per thousand people) than women (10.89 per thousand people) in the northern and central provinces of Iran. | Sex | Biology | Incomplete data registration. Lack of full report Poor data classification |
| 5 | Pourhoseingholi et al. (2020), Iran | To determine the distribution of CRC risk in a map with socioeconomic risk factors adjustment | Cross-sectional | 21,543 CRC cases between 2005 and 2008 | Generalized Linear Model (using WINBUGS program, ArcGIS v10) | Hotspot areas of CRC cluster identified for men were in the North and Western regions (mean SIR 1.92) while the Central provinces reported higher rate for women (mean SIR 1.85). Unemployment rate and mean household income had minimal impacts on CRC cluster. | Unemployment rate (mean ± SD: 11.64% ± 3.18%), Mean household income (mean ± SD: 66.46 Rials ± 12.04 Rials) | Social | Incomplete and lack of up-to-date data on population. |
| 6 | Goungounga et al. (2016), France | To compare empirically different cluster detection methods to find spatial clusters of cancer cases | Cross-sectional | 3084 CRC cases between 1998 and 2007 | Moran’s I, the empirical Bayes index (EBI) and Potthoff-Whittinghill test (using SpODT, SaTScan an HBSM) | The socioeconomic inequalities did not affect the spatial variations of CRC incidence | Socioeconomic disadvantage as proxy by the calculation of Townsend index of deprivation. The index considers the proportion of unemployed people in the workforce, proportion of households without car, proportion of households renting and the proportion of overcrowded households. Increase in the Townsend index indicates an increase in the deprivation level of the inhabitants. | Social | Power of spatial cluster detection methods increases with the event rate |
| 7 | Roquette et al. (2019), Portugal | To describe and discuss the geographical patterns of CRC incidence and mortality in Portugal municipalities | cross sectional | 37,543 CRC cases between 2007 and 2011 | Global Moran’s Index and Local Moran’s Index (LISA), geographically weighted regression (GWR) (using ArcGIS) | The CRC incidence was relatively higher in the Norte region to women than men. Meanwhile, areas in the coastal Centro, the LVT and the Alentejo region showed markedly higher CRC cases among men than to women. | Sex | Biology | Limited data availability on other risk factors |
| 8 | Torres et al. (2018), United States | To evaluate the geographic distributions of colorectal cancer incidence among female residents in Baltimore City, Maryland and the neighborhood characteristics associated with those distributions | retrospective cohort | 1120 female CRC patients between 2000 and 2010 | Spatial clusters identified using Getis-Ord-Gi* statistic and local Moran’s I, global ordinary least square regression model (Using STATA, ArcGIS) | Cluster spot for CRC was identified in two out of 55 Community Statistical Area (CSA) studied. The findings noted that every one percent increase in African-American residents resulted in CRC incidence increasing by 0.031 times per 1000 female residents. The CRC cluster spot experienced less crime with majority residents between the ages of 50 and 74 years old. | The 2012 Baltimore Neighborhood Indicators Alliance Vital Signs report was referred for the neighborhood characteristics. The indicators include females aged 50 to 74 years, percentage of African-American, female-headed households, percentage of households earning less than $25,000, percentage of vacant residential properties, housing violations, number of crime incidents per 1000 residents, count of emergency call for domestic violence, teen birth, employment rates, dirty streets, tree coverage and neighborhood associations. | Social Ecology | Social determinants limited by the residential environment. No information on the length of residency on their addresses. |
| 9 | Halimi et al. (2019), Iran | To explore the spatial pattern of CRC incidence in Hamadan province, Iran | Cross-sectional | 805 CRC cases during 2007 to 2014 | Local Moran’s I (MS Excel, Arc GIS 10.5) | High-high clusters of CRC incidence identified in Mohajeran and Lalejin areas. Majority of the CRC incidence were among men (54%) and those in the age group between 65 and 85 years. | Sex, Age | Biology | Lack of accuracy for registries. Census population data is used |
| 10 | Singh et al. (2017), Canada | To determine the variation of CRC incidence by average household income in area of residence | Cross-sectional | 19,484 CRC cases between 1985 and 2012 | Bayesian Poisson regression models (Using WinBUGS software, ArcGIS v10.3) | There were few small geographic areas in the southwest rural Manitoba with persistent high CRC incidence | Sex, Age, Mean annual household income, proportion of recent immigrants (since 1961 to 2001), rate of visible minority status and unemployment status. | Biology Social | Ecological analysis, hence result should be interpreted in the context of area of residence |
| 11 | Kuo et al. (2019), United States | To address spatial autocorrelation between CRC and county-level determinants | Cross sectional | 2003 to 2013 | Local Indicators of Spatial Association (LISA), Moran’s I (Using ArcMap, SAS, GeoDaSpace software) | The location of high-high clusters identified in the north-eastern counties | Age, Adults with BMI ≥ 30 kg/m2 (Obesity), Current smoker adults who smoked at least 100 cigarettes in lifetime, Socioeconomic Status deprivation composed of education level, employment rate, income level, family and social support. Ethnicity studied include non-Hispanic Black, Hispanic, Native American and Asian. Percentage of population aged less than 65 years without health insurance. Urbanicity classified into urban, large town and rural counties. | Biology Social Ecology | Result may not generalize to other geographic areas. Lack of person-level and tumor level data |
| 12 | Goshayeshi et al. (2019), Iran | To identify potential spatial factors contributing to its geographical distribution | Cross sectional | 1089 CRC cases between 2016 and 2017 | Local Moran’s I, Ordinary Least Square Regression (Using MS Excel, ArcGIS v10.6) | CRC clusters identified in Rezashahr, Sarafrazan and Nofel-Loshato areas. The neighborhood of CRC hotspots areas was associated with high proportion of population with 50 years and above, obesity (Body Mass Index ≥30 kg/m2), daily fibre intake (≤25 g). | Age, Body Mass Index (BMI), daily consumption of red meat (gram), daily consumption of fibre (gram) | Biology | Study did not consider processed meats. Patients who had shifted were not included. Inability to geocode Persian addresses affect the accuracy |
| CRC Determinants | Studies |
|---|---|
| Ecology | |
| Health care coverage | Kuo et al. 2019 |
| Urbanicity | Kuo et al. 2019 |
| Dirty streets | Torres et al. 2018 |
| Tree coverage | Torres et al. 2018 |
| Biology | |
| Age | Roquette et al. 2019; Halimi et al. 2019; Singh et al. 2017; Kuo et al. 2019; Goshayeshi et al. 2019 |
| Sex | Pakzad et al. 2016; Roquette et al. 2019; Halimi et al. 2019; Singh et al. 2017 |
| Ethnicity | Liu et al. 2016; Kuo et al. 2019 |
| Overweight and Obesity | Mansori et al. 2018; Mansori et al. 2019; Kuo et al. 2019; Goshayeshi et al. 2019 |
| Daily consumption of fruit | Mansori et al. 2018; Goshayeshi et al. 2019 |
| Daily consumption of milk | Mansori et al. 2018; Mansori et al. 2019 |
| Social | |
| Smoking | Mansori et al. 2018; Mansori et al. 2019; Kuo et al. 2019 |
| Median household income level | Liu et al. 2016; Pourhoseingholi et al. 2020; Goungounga et al. 2016; Torres et al. 2018; Singh et al. 2017 |
| Health costs | Mansori et al. 2018; Mansori et al. 2019 |
| Employment status | Mansori et al. 2019; Pourhoseingholi et al. 2020; Goungounga et al. 2016; Torres et al. 2018; Kuo et al. 2019 |
| Housing violations, domestic violence | Torres et al. 2018 |
Publisher’s Note: MDPI stays neutral with regard to jurisdictional claims in published maps and institutional affiliations. |
© 2021 by the authors. Licensee MDPI, Basel, Switzerland. This article is an open access article distributed under the terms and conditions of the Creative Commons Attribution (CC BY) license (https://creativecommons.org/licenses/by/4.0/).
Share and Cite
Soffian, S.S.S.; Nawi, A.M.; Hod, R.; Chan, H.-K.; Hassan, M.R.A. Area-Level Determinants in Colorectal Cancer Spatial Clustering Studies: A Systematic Review. Int. J. Environ. Res. Public Health 2021, 18, 10486. https://doi.org/10.3390/ijerph181910486
Soffian SSS, Nawi AM, Hod R, Chan H-K, Hassan MRA. Area-Level Determinants in Colorectal Cancer Spatial Clustering Studies: A Systematic Review. International Journal of Environmental Research and Public Health. 2021; 18(19):10486. https://doi.org/10.3390/ijerph181910486
Chicago/Turabian StyleSoffian, Sharifah Saffinas Syed, Azmawati Mohammed Nawi, Rozita Hod, Huan-Keat Chan, and Muhammad Radzi Abu Hassan. 2021. "Area-Level Determinants in Colorectal Cancer Spatial Clustering Studies: A Systematic Review" International Journal of Environmental Research and Public Health 18, no. 19: 10486. https://doi.org/10.3390/ijerph181910486