
Wearable Inertial Measurement Unit to Accelerometer-Based Training Monotony and Strain during a Soccer Season: A within-Group Study for Starters and Non-Starters

 ,
,  ,
,  ,
,  ,
,  and
and 
Abstract
:1. Introduction
2. Materials and Methods
2.1. Participants
2.2. Experimental Approach to the Problem
2.3. External Monitoring Measures
2.4. Data Collection by Wearable Inertial Measurement Unit
2.5. Statistical Analysis
3. Results
4. Discussion
5. Conclusions
Author Contributions
Funding
Institutional Review Board Statement
Informed Consent Statement
Data Availability Statement
Acknowledgments
Conflicts of Interest
References
- Jaspers, A.; Brink, M.S.; Probst, S.G.M.; Frencken, W.G.P.; Helsen, W.F. Relationships Between Training Load Indicators and Training Outcomes in Professional Soccer. Sports Med. 2017, 47, 533–544. [Google Scholar] [CrossRef]
- Oliveira, R.; Brito, J.P.; Loureiro, N.; Padinha, V.; Nobari, H.; Mendes, B. Will Next Match Location Influence External and Internal Training Load of a Top-Class Elite Professional European Soccer Team? Int. J. Environ. Res. Public Health 2021, 18, 5229. [Google Scholar] [CrossRef]
- Halson, S.L. Monitoring Training Load to Understand Fatigue in Athletes. Sports Med. 2014, 44, S139–S147. [Google Scholar] [CrossRef] [Green Version]
- Bourdon, P.C.; Cardinale, M.; Murray, A.; Gastin, P.; Kellmann, M.; Varley, M.C.; Gabbett, T.J.; Coutts, A.J.; Burgess, D.J.; Gregson, W.; et al. Monitoring Athlete Training Loads: Consensus Statement. Int. J. Sport Physiol. Perform. 2017, 12, 161–170. [Google Scholar] [CrossRef]
- Foster, C. Monitoring training in athletes with reference to overtraining syndrome. Med. Sci. Sports Exerc. 1998, 30, 1164–1168. [Google Scholar] [CrossRef]
- Comyns, T.; Flanagan, E.P. Applications of the Session Rating of Perceived Exertion System in Professional Rugby Union. Strength Cond. J. 2013, 35, 78–85. [Google Scholar] [CrossRef] [Green Version]
- Delecroix, B.; Mccall, A.; Dawson, B.; Berthoin, S.; Dupont, G. Workload monotony, strain and non-contact injury incidence in professional football players. Sci. Med. Footb. 2019, 3, 105–108. [Google Scholar] [CrossRef]
- Meeusen, R.; Duclos, M.; Foster, C.; Fry, A.; Gleeson, M.; Nieman, D.; Raglin, J.; Rietjens, G.; Steinacker, J.; Urhausen, A. Prevention, diagnosis and treatment of the overtraining syndrome: Joint consensus statement of the European College of Sport Science (ECSS) and the American College of Sports Medicine (ACSM). Eur. J. Sport Sci. 2013, 13, 1–24. [Google Scholar] [CrossRef] [Green Version]
- Clemente, F.M.; Clark, C.; Castillo, D.; Sarmento, H.; Nikolaidis, P.T.; Rosemann, T.; Knechtle, B. Variations of training load, monotony, and strain and dose-response relationships with maximal aerobic speed, maximal oxygen uptake, and isokinetic strength in professional soccer players. PLoS ONE 2019, 14, e0225522. [Google Scholar] [CrossRef] [PubMed] [Green Version]
- Curtis, R.M.; Huggins, R.A.; Benjamin, C.L.; Sekiguchi, Y.; Arent, S.M.; Armwald, B.C.; Pullara, J.M.; West, C.A.; Casa, D.J. Seasonal Accumulated Workloads in Collegiate Men’s Soccer: A Comparison of Starters and Reserves. J. Strength Cond. Res. 2019. [Google Scholar] [CrossRef] [PubMed]
- Fessi, M.S.; Nouira, S.; Dellal, A.; Owen, A.; Elloumi, M.; Moalla, W. Changes of the psychophysical state and feeling of wellness of professional soccer players during pre-season and in-season periods. Res. Sports Med. 2016, 24, 375–386. [Google Scholar] [CrossRef]
- Morales, J.; Roman, V.; Yanezi, A.; Solana-Tramuntl, M.; Alamo, J.; Figuls, A. Physiological and Psychological Changes at the End of the Soccer Season in Elite Female Athletes. J. Hum. Kinet. 2019, 66, 99–109. [Google Scholar] [CrossRef] [PubMed] [Green Version]
- Nobari, H.; Oliveira, R.; Clemente, F.M.; Adsuar, J.C.; Perez-Gomez, J.; Carlos-Vivas, J.; Brito, J.P. Comparisons of Accelerometer Variables Training Monotony and Strain of Starters and Non-Starters: A Full-Season Study in Professional Soccer Players. Int. J. Environ. Res. Public Health 2020, 17, 6547. [Google Scholar] [CrossRef]
- Kraemer, W.J.; French, D.N.; Paxton, N.J.; Hakkinen, K.; Volek, J.S.; Sebastianelli, W.J.; Putukian, M.; Newton, R.U.; Rubin, M.R.; Gomez, A.L.; et al. Changes in exercise performance and hormonal concentrations over a big ten soccer season in starters and nonstarters. J. Strength Cond. Res. 2004, 18, 121–128. [Google Scholar] [PubMed]
- Silva, J.R.; Magalhaes, J.F.; Ascensao, A.A.; Oliveira, E.M.; Seabra, A.F.; Rebelo, A.N. Individual Match Playing Time during the Season Affects Fitness-Related Parameters of Male Professional Soccer Players. J. Strength Cond. Res. 2011, 25, 2729–2739. [Google Scholar] [CrossRef] [PubMed] [Green Version]
- Oliveira, R.; Palucci Vieira, L.H.; Martins, A.; Brito, J.P.; Nalha, M.; Mendes, B.; Clemente, F.M. In-Season Internal and External Workload Variations between Starters and Non-Starters-A Case Study of a Top Elite European Soccer Team. Medicina 2021, 57, 645. [Google Scholar] [CrossRef]
- Nobari, H.; Castillo, D.; Clemente, F.M.; Carlos-Vivas, J.; Pérez-Gómez, J. Acute, chronic and acute/chronic ratio between starters and non-starters professional soccer players across a competitive season. Proc. Inst. Mech. Eng. Part P J. Sports Eng. Technol. 2021. [Google Scholar] [CrossRef]
- Los Arcos, A.; Mendez-Villanueva, A.; Martinez-Santos, R. In-season training periodization of professional soccer players. Biol. Sport 2017, 34, 149–155. [Google Scholar] [CrossRef]
- Nobari, H.; Praca, G.M.; Clemente, F.M.; Perez-Gomez, J.; Vivas, J.C.; Ahmadi, M. Comparisons of new body load and metabolic power average workload indices between starters and non-starters: A full-season study in professional soccer players. Proc. Inst. Mech. Eng. Part P J. Sports Eng. Technol. 2021, 235, 105–113. [Google Scholar] [CrossRef]
- Williams, J.; Tessaro, E. Validity and reliability of a 15 Hz GPS Device for court-based sports movements. Sport Perform. Sci. Rep. 2018, 29, 1–4. [Google Scholar]
- Scott, B.R.; Lockie, R.G.; Knight, T.J.; Clark, A.C.; Janse de Jonge, X.A. A comparison of methods to quantify the in-season training load of professional soccer players. Int. J. Sports Physiol. Perform. 2013, 8, 195–202. [Google Scholar] [CrossRef] [PubMed] [Green Version]
- Nobari, H.; Khalili, S.M.; Oliveira, R.; Castillo-Rodríguez, A.; Pérez-Gómez, J.; Ardigò, L.P. Comparison of Official and Friendly Matches through Acceleration, Deceleration and Metabolic Power Measures: A Full-Season Study in Professional Soccer Players. Int. J. Environ. Res. Public Health 2021, 18, 5980. [Google Scholar] [CrossRef]
- Akenhead, R.; French, D.; Thompson, K.G.; Hayes, P.R. The acceleration dependent validity and reliability of 10 Hz GPS. J. Sci. Med. Sport 2014, 17, 562–566. [Google Scholar] [CrossRef] [PubMed]
- Nobari, H.; Tubagi Polito, L.F.; Clemente, F.M.; Pérez-Gómez, J.; Ahmadi, M.; Garcia-Gordillo, M.; Silva, A.F.; Adsuar, J.C. Relationships Between Training Workload Parameters with Variations in Anaerobic Power and Change of Direction Status in Elite Youth Soccer Players. Int. J. Environ. Res. Public Health 2020, 17, 7934. [Google Scholar] [CrossRef] [PubMed]
- Nobari, H.; Alves, A.R.; Clemente, F.M.; Pérez-Gómez, J.; Clark, C.C.T.; Granacher, U.; Zouhal, H. Associations Between Variations in Accumulated Workload and Physiological Variables in Young Male Soccer Players Over the Course of a Season. Front. Physiol. 2021, 12, 638180. [Google Scholar] [CrossRef]
- Nobari, H.; Barjaste, A.; Haghighi, H.; Clemente, F.M.; Carlos-Vivas, J.; Perez-Gomez, J. Quantification of training and match load in elite youth soccer players: A full-season study. J. Sports Med. Phys. Fit. 2021. [Google Scholar] [CrossRef]
- Nobari, H.; Aquino, R.; Clemente, F.M.; Khalafi, M.; Adsuar, J.C.; Pérez-Gómez, J. Description of acute and chronic load, training monotony and strain over a season and its relationships with well-being status: A study in elite under-16 soccer players. Physiol. Behav. 2020, 225, 113117. [Google Scholar] [CrossRef] [PubMed]
- Nobari, H.; Vahabidelshad, R.; Pérez-Gómez, J.; Ardigò, L.P. Variations of Training Workload in Micro- and Meso-Cycles Based on Position in Elite Young Soccer Players: A Competition Season Study. Front. Physiol. 2021, 12, 668145. [Google Scholar] [CrossRef]
- Hopkins, W.G.; Marshall, S.W.; Batterham, A.M.; Hanin, J. Progressive Statistics for Studies in Sports Medicine and Exercise Science. Med. Sci. Sports Exerc. 2009, 41, 3–12. [Google Scholar] [CrossRef] [PubMed] [Green Version]
- Clemente, F.M.; Silva, R.; Ramirez-Campillo, R.; Afonso, J.; Mendes, B.; Chen, Y.S. Accelerometry-based variables in professional soccer players: Comparisons between periods of the season and playing positions. Biol. Sport 2020, 37, 389–403. [Google Scholar] [CrossRef]
- Jeong, T.S.; Reilly, T.; Morton, J.; Bae, S.W.; Drust, B. Quantification of the physiological loading of one week of “pre-season” and one week of “in-season” training in professional soccer players. J. Sports Sci. 2011, 29, 1161–1166. [Google Scholar] [CrossRef]
- Rabelo, F.N.; Pasquarelli, B.N.; Goncalves, B.; Matzenbacher, F.; Campos, F.A.D.; Sampaio, J.; Nakamura, F.Y. Monitoring the Intended and Perceived Training Load of a Professional Futsal Team over 45 Weeks: A Case Study. J. Strength Cond. Res. 2016, 30, 134–140. [Google Scholar] [CrossRef] [PubMed]
- Fessi, M.S.; Zarrouk, N.; Di Salvo, V.; Filetti, C.; Barker, A.R.; Moalla, W. Effects of tapering on physical match activities in professional soccer players. J. Sports Sci. 2016, 34, 2189–2194. [Google Scholar] [CrossRef] [PubMed]


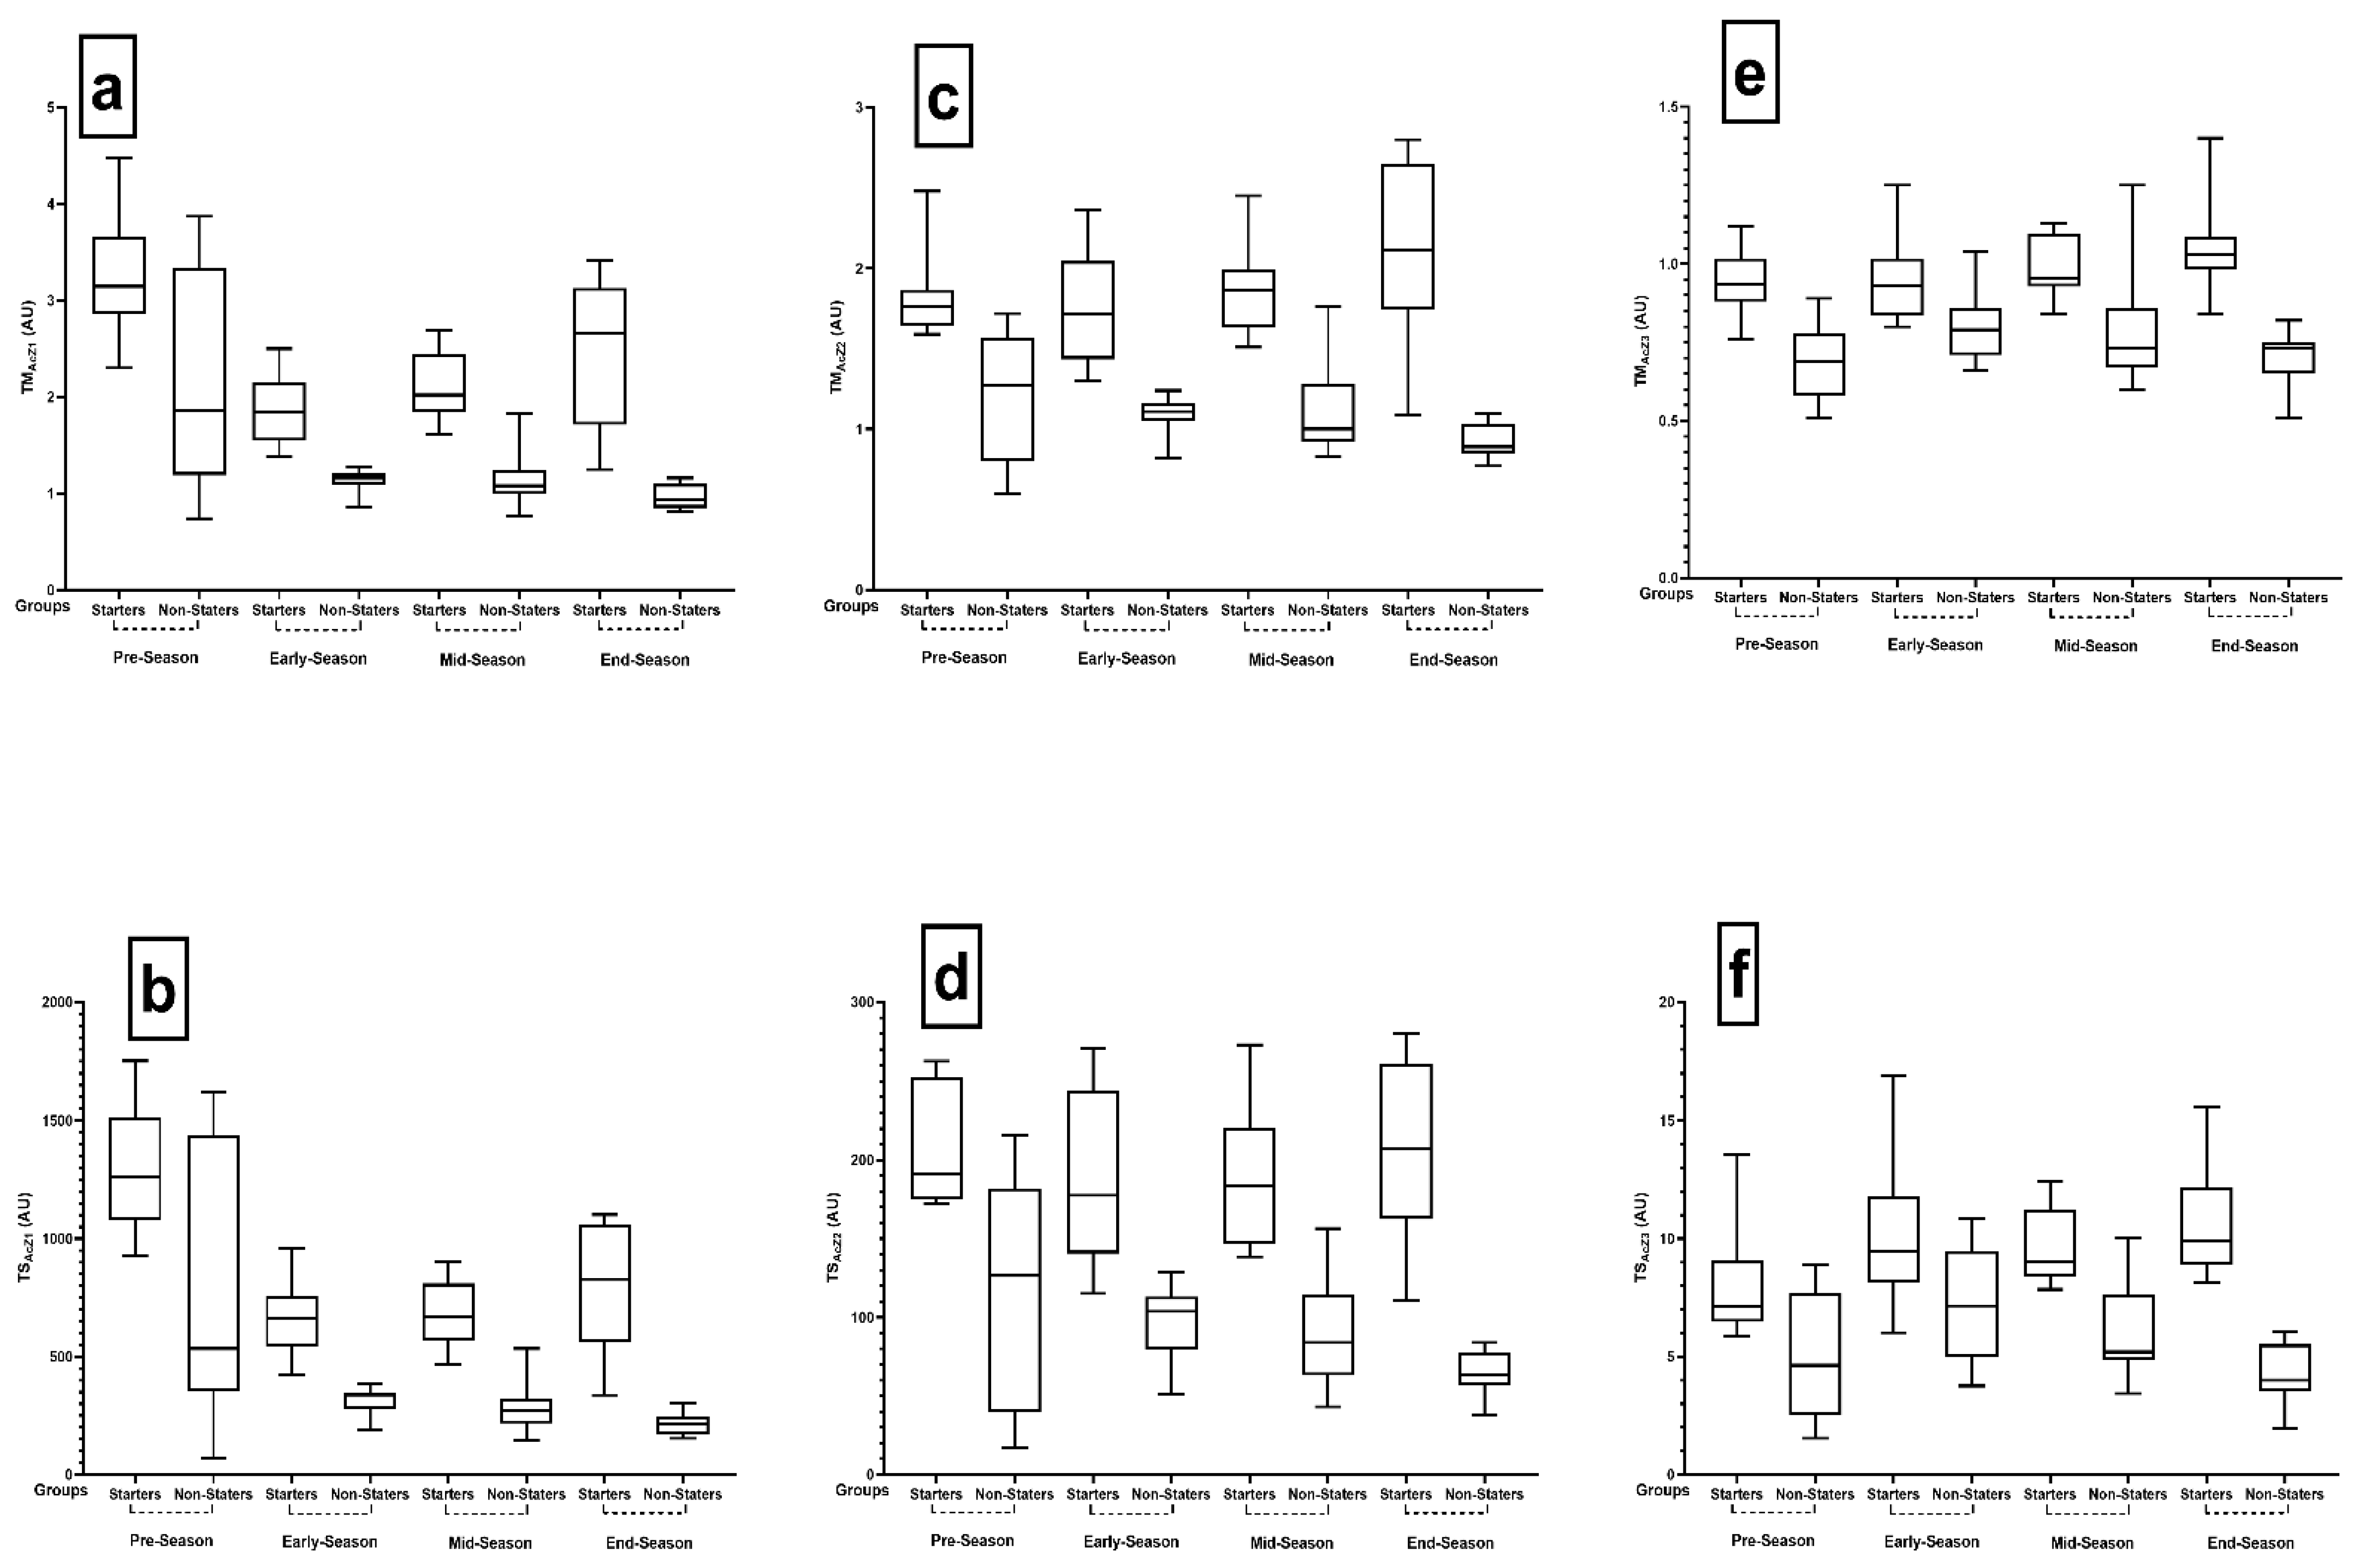
| Variables | Period | Mean (SD) | COMPARATIVE | Groups | p | Hedge’s g (95% CI) |
|---|---|---|---|---|---|---|
| TMAcZ1 (AU) | Pre-season | Starters: 3.25 ± 0.62 Non-starters: 2.18 ± 1.14 | PreS vs. EarS | Starters | 0.002 | 2.60 [1.41 to 3.79] |
| Non-starters | 0.016 | 1.24 [0.33 to 2.16] | ||||
| PreS vs. MidS | Starters | 0.010 | 2.13 [1.03 to 3.23] | |||
| Early-season | Starters: 1.87 ± 0.36 Non-starters: 1.13 ± 0.13 | Non-starters | 0.016 | 1.19 [0.28 to 2.10] | ||
| PreS vs. EndS | Starters | 0.320 | 1.04 [0.11 to 1.98] | |||
| Non-starters | 0.020 | 1.42 [0.49 to 2.36] | ||||
| Mid-season | Starters: 2.12 ± 0.37 Non-starters: 1.15 ± 0.27 | EarS vs. MidS | Starters | 0.143 | −0.64 [−1.54 to 0.26] | |
| Non-starters | >0.999 | −0.10 [−0.94 to 0.74] | ||||
| EarS vs. EndS | Starters | 0.003 | −0.95 [−1.88 to −0.03] | |||
| End-season | Starters: 2.48 ± 0.79 Non-starters: 0.98 ± 0.13 | Non-starters | >0.999 | 1.15 [0.25 to 2.05] | ||
| MidS vs. EndS | Starters | 0.021 | –0.57 [–1.46 to 0.33] | |||
| Non-starters | 0.679 | 0.78 [–0.09 to 1.65] | ||||
| TSAcZ1 (AU) | Pre-season | Starters: 1288.97 ± 265.15 Non-starters: 765.44 ± 547.51 | PreS vs. EarS | Starters | 0.002 | 2.76 [1.54 to 3.98] |
| Non-starters | 0.022 | 1.13 [0.23 to 2.03] | ||||
| PreS vs. MidS | Starters | 0.003 | 2.68 [1.47 to 3.88] | |||
| Early-season | Starters: 659.98 ± 158.04 Non-starters: 306.50 ± 63.24 | Non-starters | 0.013 | 1.18 [0.27 to 2.09] | ||
| PreS vs. EndS | Starters | 0.039 | 1.74 [0.71 to 2.76] | |||
| Non-starters | 0.013 | 1.36 [0.43 to 2.29] | ||||
| Mid-season | Starters: 683.62 ± 153.10 Non-starters: 282.55 ± 101.83 | EarS vs. MidS | Starters | >0.999 | –0.15 [–1.02 to 0.73] | |
| Non-starters | >0.999 | 0.27 [−0.57 to 1.11] | ||||
| EarS vs. EndS | Starters | 0.114 | −0.56 [−1.45 to 0.33] | |||
| End-season | Starters: 793.44 ± 281.32 Non-starters: 216.63 ± 47.49 | Non-starters | 0.515 | 1.55 [0.59 to 2.50] | ||
| MidS vs. EndS | Starters | 0.047 | −0.46 [−1.35 to 0.42] | |||
| Non-starters | 0.463 | 0.80 [−0.47 to 1.67] |
| Variables | Period | Mean (SD) | COMPARATIVE | Groups | p | Hedge’s g (95% CI) |
|---|---|---|---|---|---|---|
| TMAcZ2 (AU) | Pre-season | Starters: 1.82 ± 0.26 Non-starters: 1.19 ± 0.39 | PreS vs. EarS | Starters | >0.999 | 0.18 [−0.70 to 1.06] |
| Non-starters | >0.999 | 0.36 [−0.48 to 1.20] | ||||
| PreS vs. MidS | Starters | >0.999 | −0.20 [−1.08 to 0.68] | |||
| Early-season | Starters: 1.76 ± 0.36 Non-starters: 1.09 ± 0.12 | Non-starters | >0.999 | 0.24 [−0.59 to 1.08] | ||
| PreS vs. EndS | Starters | 0.365 | −0.63 [−1.53 to 0.27] | |||
| Non-starters | 0.387 | 0.90 [0.02 to 1.77] | ||||
| Mid-season | Starters: 1.87 ± 0.27 Non-starters: 1.11 ± 0.27 | EarS vs. MidS | Starters | 0.980 | −0.34 [−1.22 to 0.54] | |
| Non-starters | >0.999 | −0.11 [−0.94 to 0.73] | ||||
| EarS vs. EndS | Starters | 0.013 | −0.70 [−1.61 to 0.20] | |||
| End-season | Starters: 2.10 ± 0.55 Non-starters: 0.93 ± 0.10 | Non-starters | 0.630 | 1.32 [0.40 to 2.24] | ||
| MidS vs. EndS | Starters | 0.174 | −0.51 [−1.40 to 0.39] | |||
| Non-starters | 0.389 | 0.85 [−0.03 to 1.72] | ||||
| TSAcZ2 (AU) | Pre-season | Starters: 209.71 ± 38.04 Non-starters: 112.24 ± 71.12 | PreS vs. EarS | Starters | >0.999 | 0.45 [−0.44 to 1.33] |
| Non-starters | >0.999 | 0.26 [−0.58 to 1.10] | ||||
| PreS vs. MidS | Starters | >0.999 | 0.51 [−0.38 to 1.40] | |||
| Early-season | Starters: 187.65 ± 55.12 Non-starters: 97.81 ± 23.62 | Non-starters | 0.704 | 0.44 [−0.40 to 1.28] | ||
| PreS vs. EndS | Starters | >0.999 | 0.04 [−0.83 to 0.92] | |||
| Non-starters | 0.114 | 0.89 [0.02 to 1.77] | ||||
| Mid-season | Starters: 188.62 ± 41.45 Non-starters: 87.19 ± 31.90 | EarS vs. MidS | Starters | >0.999 | −0.02 [−0.90 to 0.86] | |
| Non-starters | >0.999 | 0.36 [−0.48 to 1.21] | ||||
| EarS vs. EndS | Starters | 0.870 | −0.35 [−1.23 to 0.54] | |||
| End-season | Starters: 207.53 ± 54.59 Non-starters: 64.75 ± 12.88 | Non-starters | 0.094 | 1.67 [0.70 to 2.64] | ||
| MidS vs. EndS | Starters | 0.227 | −0.37 [−1.26 to 0.51] | |||
| Non-starters | 0.072 | 0.89 [0.01 to 1.76] |
| Variables | Period | Mean (SD) | COMPARATIVE | Group | p | Hedge’s g (95% CI) |
|---|---|---|---|---|---|---|
| TMAcZ3 (AU) | Pre-season | Starters: 0.94 ± 0.10 Non-starters: 0.70 ± 0.13 | PreS vs. EarS | Starters | >0.999 | −0.05 [−0.93 to 0.83] |
| Non-starters | 0.161 | −0.84 [−1.74 to 0.03] | ||||
| PreS vs. MidS | Starters | >0.999 | −0.39 [−1.28 to 0.49] | |||
| Early-season | Starters: 0.95 ± 0.14 Non-starters: 0.80 ± 0.11 | Non-starters | 0.678 | −0.51 [−1.36 to 0.34] | ||
| PreS vs. EndS | Starters | 0.083 | −0.83 [−1.74 to 0.08] | |||
| Non-starters | >0.999 | −0.03 [−0.87 to 0.80] | ||||
| Mid-season | Starters: 0.98 ± 0.09 Non-starters: 0.78 ± 0.18 | EarS vs. MidS | Starters | >0.999 | −0.27 [−1.15 to 0.61] | |
| Non-starters | >0.999 | 0.13 [−0.70 to 0.97] | ||||
| EarS vs. EndS | Starters | 0.258 | −0.68 [−1.58 to 0.22] | |||
| End-season | Starters: 1.05 ± 0.14 Non-starters: 0.70 ± 0.09 | Non-starters | 0.241 | 0.96 [0.08 to 1.84] | ||
| MidS vs. EndS | Starters | >0.999 | −0.53 [−1.42 to 0.36] | |||
| Non-starters | 0.767 | 0.53 [−0.32 to 1.38] | ||||
| TSAcZ3 (AU) | Pre-season | Starters: 8.09 ± 2.40 Non-starters: 4.86 ± 2.59 | PreS vs. EarS | Starters | 0.158 | −0.71 [−1.96 to 0.19] |
| Non-starters | 0.056 | −0.93 [−1.81 to −0.05] | ||||
| PreS vs. MidS | Starters | 0.221 | −0.73 [−1.63 to 0.18] | |||
| Early-season | Starters: 10.17 ± 3.14 Non-starters: 7.24 ± 2.31 | Non-starters | 0.432 | −0.50 [−1.38 to 0.35] | ||
| PreS vs. EndS | Starters | 0.008 | −1.02 [−1.95 to −0.09] | |||
| Non-starters | >0.999 | 0.24 [−0.60 to 1.08] | ||||
| Mid-season | Starters: 9.65 ± 1.60 Non-starters: 6.12 ± 2.25 | EarS vs. MidS | Starters | >0.999 | 0.20 −0.68 to 1.08] | |
| Non-starters | 0.857 | 0.47 [−0.37 to 1.32] | ||||
| EarS vs. EndS | Starters | >0.999 | −0.15 [−1.03 to 0.72] | |||
| End-season | Starters: 10.61 ± 2.31 Non-starters: 4.35 ± 1.23 | Non-starters | 0.011 | 1.50 [0.56 to 2.45] | ||
| MidS vs. EndS | Starters | >0.999 | −0.46 [−1.35 to 0.43] | |||
| Non-starters | 0.118 | 0.93 [0.05 to 1.82] |
| Variables | Period | Mean (SD) | COMPARATIVE | Groups | p | Hedge’s g (95% CI) |
|---|---|---|---|---|---|---|
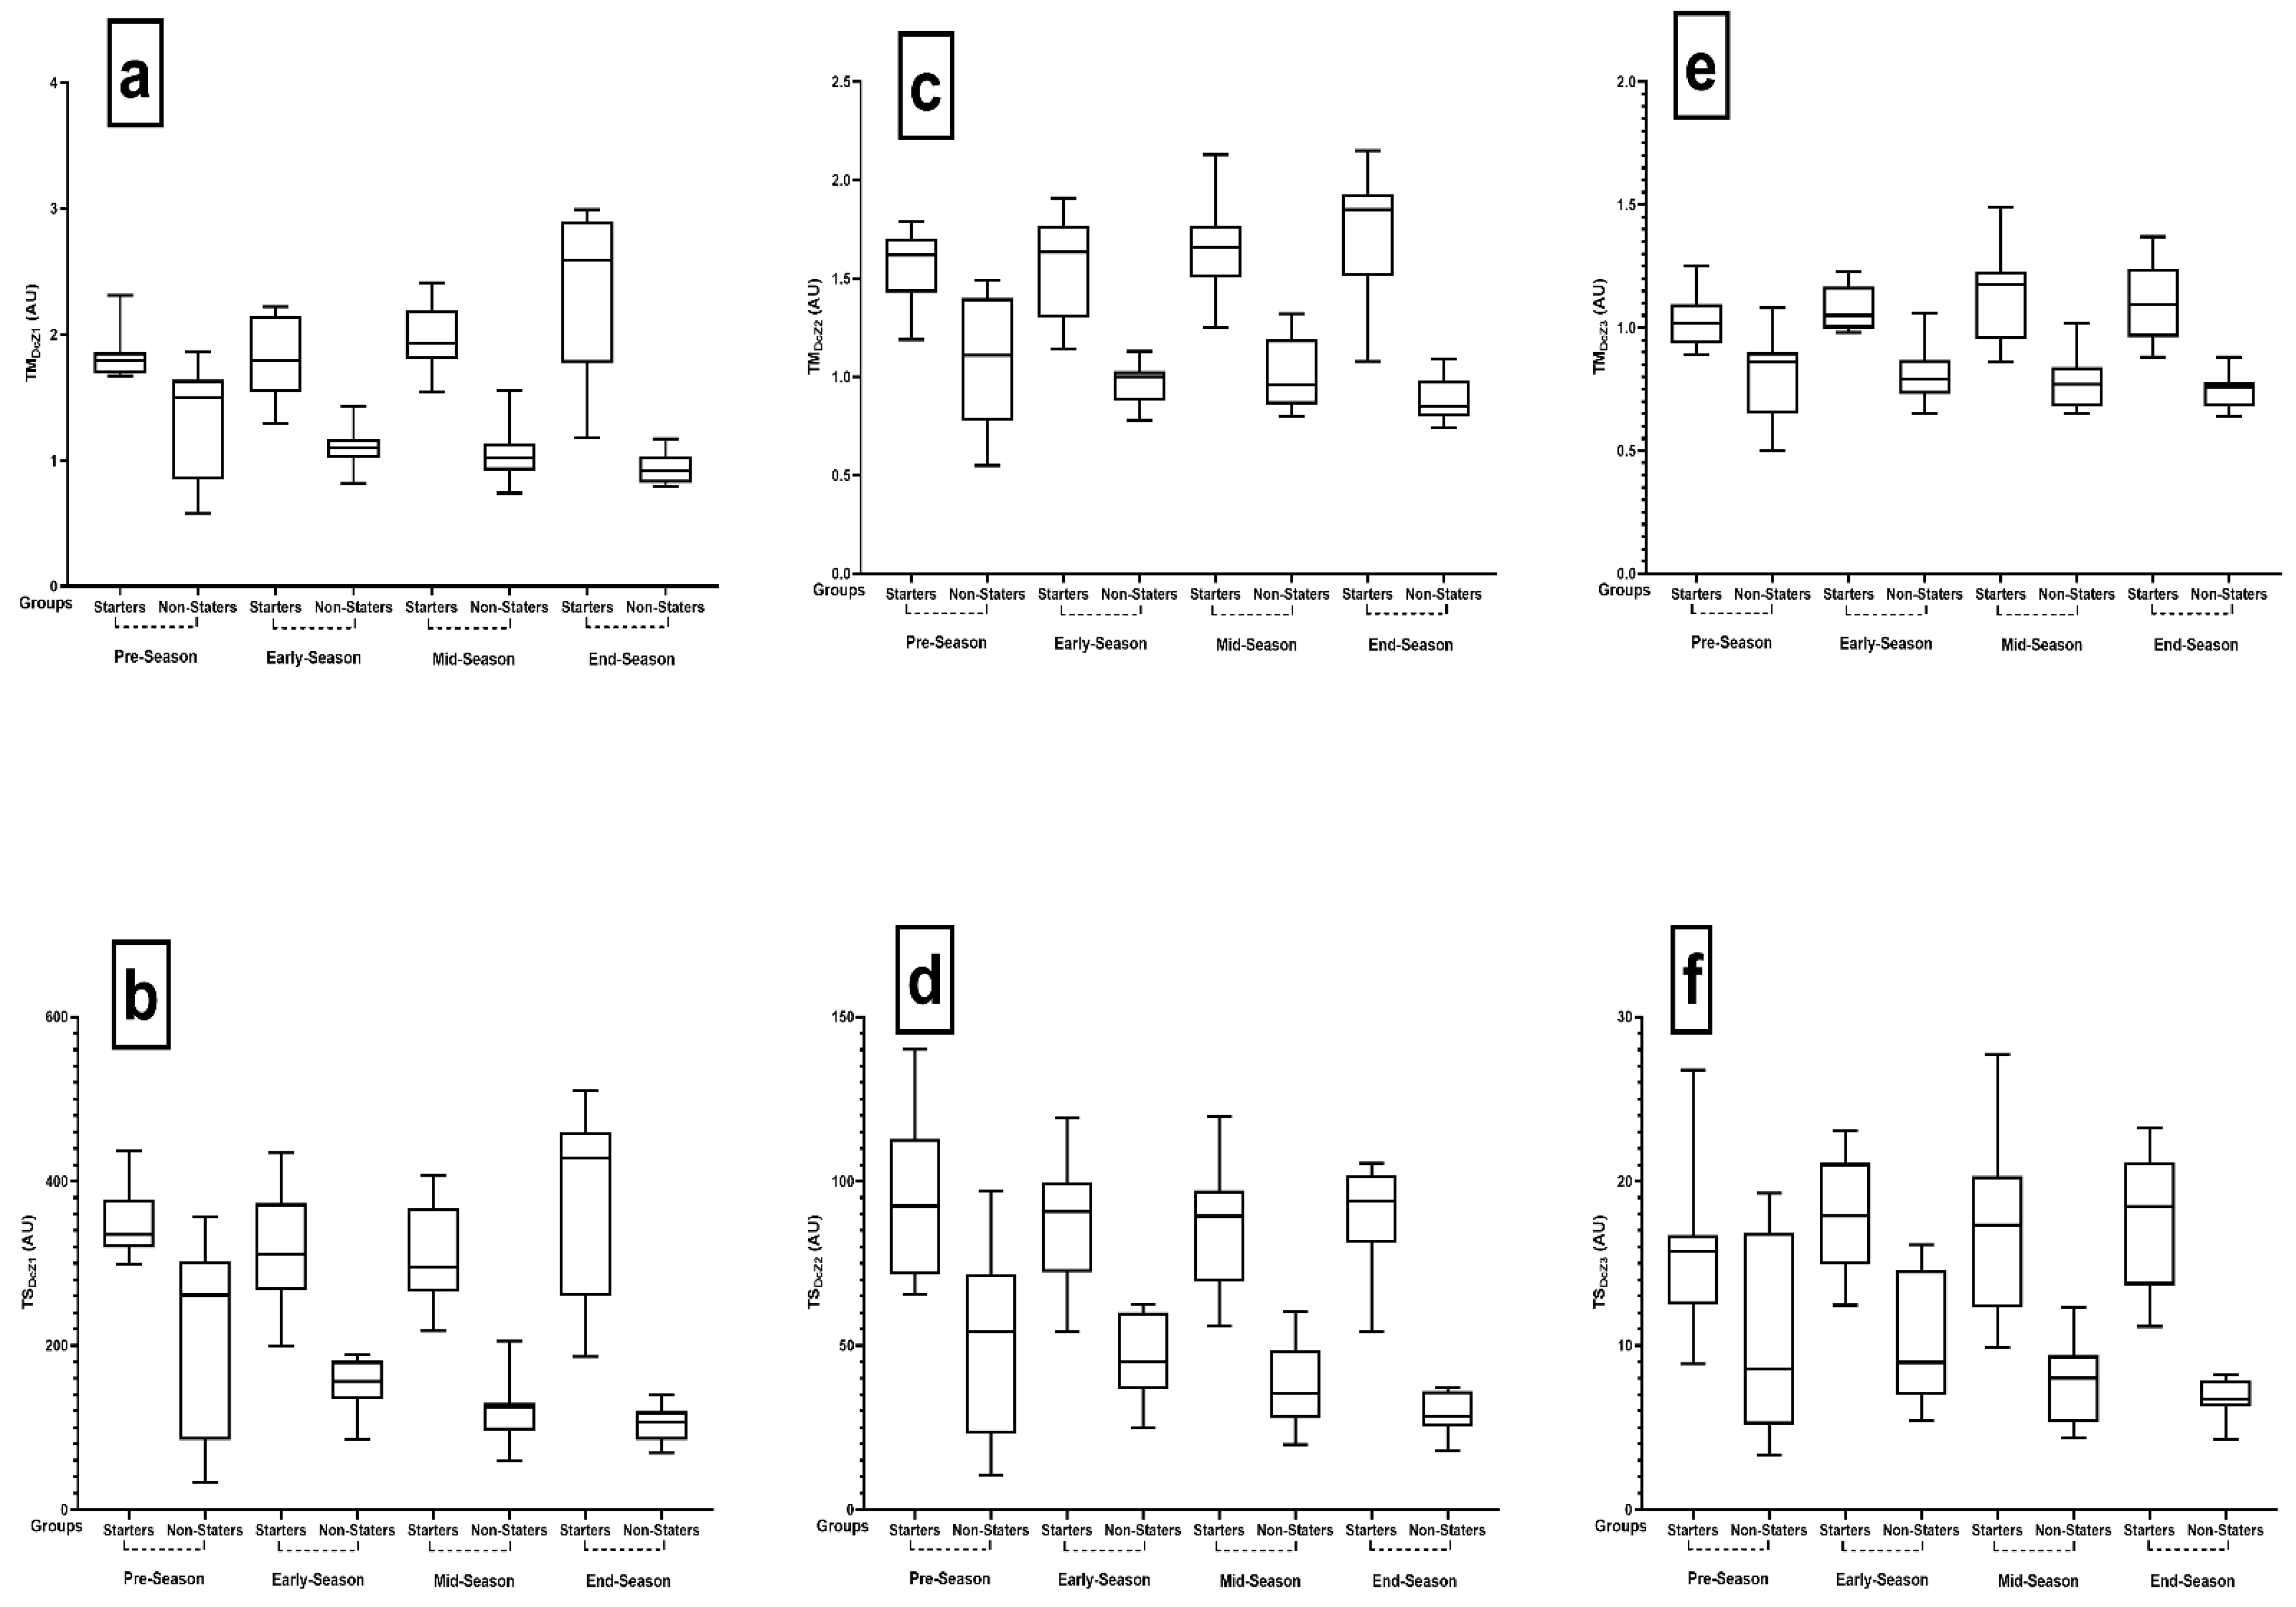
| TMDcZ1 (AU) | Pre-season | Starters: 1.82 ± 0.19 Non-starters: 1.31 ± 0.44 | PreS vs. EarS | Starters | >0.999 | 0.07 [−0.81 to 0.95] |
| Non-starters | 0.626 | 0.64 [−0.22 to 1.50] | ||||
| PreS vs. MidS | Starters | >0.999 | −0.65 [−1.55 to 0.25] | |||
| Early-season | Starters: 1.80 ± 0.33 Non-starters: 1.09 ± 0.16 | Non-starters | 0.176 | 0.68 [−0.18 to 1.54] | ||
| PreS vs. EndS | Starters | 0.045 | −0.99 [−1.98 to −0.06] | |||
| Non-starters | 0.202 | 1.10 [0.21 to 2.00] | ||||
| Mid-season | Starters: 1.98 ± 0.27 Non-starters: 1.06 ± 0.22 | EarS vs. MidS | Starters | 0.161 | −0.57 [−1.46 to 0.33] | |
| Non-starters | >0.999 | 0.14 [–0.70 to 0.97] | ||||
| EarS vs. EndS | Starters | 0.001 | −0.96 [−1.88 to −0.03] | |||
| End-season | Starters: 2.33 ± 0.67 Non-starters: 0.94 ± 0.12 | Non-starters | 0.966 | 1.03 [0.14 to 1.92] | ||
| MidS vs. EndS | Starters | 0.042 | −0.66 [−1.56 to 0.26] | |||
| Non-starters | >0.999 | 0.67 [−0.19 to 1.53] | ||||
| TSDcZ1 (AU) | Pre-season | Starters: 349.37 ± 42.58 Non-starters: 208.15 ± 116.22 | PreS vs. EarS | Starters | >0.999 | 0.54 [−0.35 to 1.43] |
| Non-starters | 0.415 | 0.64 [−0.22 to 1.49] | ||||
| PreS vs. MidS | Starters | >0.999 | 0.69 [−0.21 to 1.60] | |||
| Early-season | Starters: 315.25 ± 74.37 Non-starters: 151.32 ± 35.13 | Non-starters | 0.030 | 0.95 [0.07 to 1.83] | ||
| PreS vs. EndS | Starters | >0.999 | −0.26 [−1.15 to 0.62] | |||
| Non-starters | 0.023 | 1.21 [0.30 to 2.12] | ||||
| Mid-season | Starters: 310.75 ± 62.22 Non-starters: 122.72 ± 38.47 | EarS vs. MidS | Starters | >0.999 | 0.06 [−0.81 to 0.94] | |
| Non-starters | 0.591 | 0.75 [−0.12 to 1.61] | ||||
| EarS vs. EndS | Starters | 0.059 | −0.57 [−1.47 to 0.32] | |||
| End-season | Starters: 373.32 ± 114.88 Non-starters: 103.09 ± 22.17 | Non-starters | 0.132 | 1.58 [0.62 to 2.54] | ||
| MidS vs. EndS | Starters | 0.018 | −0.65 [−1.54 to 0.25] | |||
| Non-starters | >0.999 | 0.60 [−0.25 to 1.46] |
| Variables | Period | Mean (SD) | COMPARATIVE | Groups | p | Hedge’s g (95% CI) |
|---|---|---|---|---|---|---|
| TMDcZ2 (AU) | Pre-season | Starters: 1.56 ± 0.19 Non-starters: 1.07 ± 0.32 | PreS vs. EarS | Starters | <0.999 | 0.03 [−0.85 to 0.91] |
| Non-starters | <0.999 | 0.40 [–0.44 to 1.24] | ||||
| PreS vs. MidS | Starters | <0.999 | –0.38 [–1.26 to 0.50] | |||
| Early-season | Starters: 1.56 ± 0.26 Non-starters: 0.97 ± 0.11 | Non-starters | <0.999 | 0.22 [–0.62 to 1.05] | ||
| PreS vs. EndS | Starters | 0.467 | –0.60 [–1.50 to 0.30] | |||
| Non-starters | 0.238 | 0.77 [–0.09 to 1.64] | ||||
| Mid-season | Starters: 1.65 ± 0.24 Non-starters: 1.01 ± 0.17 | EarS vs. MidS | Starters | 0.725 | –0.35 [–1.24 to 0.53] | |
| Non-starters | <0.999 | –0.27 [–1.11 to 0.57] | ||||
| EarS vs. EndS | Starters | 0.093 | –0.57 [–1.46 to 0.33] | |||
| End-season | Starters: 1.73 ± 0.33 Non-starters: 0.88 ± 0.12 | Non-starters | 0.942 | 0.78 [−0.08 to 1.65] | ||
| MidS vs. EndS | Starters | <0.999 | −0.28 [−1.16 to 0.60] | |||
| Non-starters | 0.561 | 0.87 [−0.001 to 1.75] | ||||
| TSDcZ2 (AU) | Pre-season | Starters: 94.91 ± 24.53 Non-starters: 50.88 ± 29.47 | PreS vs. EarS | Starters | <0.999 | 0.32 [−0.56 to 1.21] |
| Non-starters | <0.999 | 0.24 [−0.60 to 1.08] | ||||
| PreS vs. MidS | Starters | <0.999 | 0.39 [−0.50 to 1.27] | |||
| Early-season | Starters: 87.25 ± 20.56 Non-starters: 45.25 ± 13.33 | Non-starters | 0.795 | 0.53 [−0.32 to 1.38] | ||
| PreS vs. EndS | Starters | <0.999 | 0.26 [−0.62 to 1.14] | |||
| Non-starters | 0.055 | 0.99 [0.10 to 1.87] | ||||
| Mid-season | Starters: 86.08 ± 18.99 Non-starters: 38.33 ± 12.96 | EarS vs. MidS | Starters | <0.999 | 0.06 [−0.82 to 0.93] | |
| Non-starters | 0.655 | 0.51 [−0.34 to 1.36] | ||||
| EarS vs. EndS | Starters | <0.999 | −0.10 [−0.97 to 0.78] | |||
| End-season | Starters: 89.15 ± 17.18 Non-starters: 28.96 ± 6.29 | Non-starters | 0.019 | 1.50 [0.56 to 2.45] | ||
| MidS vs. EndS | Starters | <0.999 | −0.16 [−1.04 to 0.72] | |||
| Non-starters | 0.332 | 0.88 [0.01 to 1.76] |
| Variables | Period | Mean (SD) | COMPARATIVE | Group | p | Hedge’s g (95% CI) |
|---|---|---|---|---|---|---|
| TMDcZ3 (AU) | Pre-season | Starters: 1.03 ± 0.11 Non-starters: 0.80 ± 0.18 | PreS vs. EarS | Starters | <0.999 | −0.42 [−1.30 to 0.47] |
| Non-starters | <0.999 | −0.04 [−0.88 to 0.80] | ||||
| PreS vs. MidS | Starters | 0.357 | −0.69 [−1.59 to 0.21] | |||
| Early-season | Starters: 1.08 ± 0.09 Non-starters: 0.81 ± 0.12 | Non-starters | <0.999 | 0.13 [−0.70 to 0.97] | ||
| PreS vs. EndS | Starters | 0.652 | −0.56 [−1.45 to 0.34] | |||
| Non-starters | <0.999 | 0.41 [−0.44 to 1.25] | ||||
| Mid-season | Starters: 1.14 ± 0.19 Non-starters: 0.78 ± 0.11 | EarS vs. MidS | Starters | 0.960 | −0.43 [−1.32 to 0.45] | |
| Non-starters | <0.999 | 0.23 [−0.61 to 1.06] | ||||
| EarS vs. EndS | Starters | <0.999 | −0.26 [−1.14 to 0.62] | |||
| End-season | Starters: 1.11 ± 0.16 Non-starters: 0.74 ± 0.07 | Non-starters | 0.726 | 0.64 [−0.22 to 1.50] | ||
| MidS vs. EndS | Starters | <0.999 | 0.18 [−0.70 to 1.05] | |||
| Non-starters | <0.999 | 0.38 [−0.47 to 1.22] | ||||
| TSDcZ3 (AU) | Pre-season | Starters: 15.76 ± 4.63 Non-starters: 10.77 ± 5.99 | PreS vs. EarS | Starters | <0.999 | −0.50 [−1.39 to 0.39] |
| Non-starters | <0.999 | 0.03 [−0.81 to 0.86] | ||||
| PreS vs. MidS | Starters | <0.999 | −0.31 [−1.19 to 0.57] | |||
| Early-season | Starters: 17.88 ± 3.47 Non-starters: 10.64 ± 4.03 | Non-starters | 0.917 | 0.58 [−0.27 to 1.44] | ||
| PreS vs. EndS | Starters | <0.999 | −0.35 [−1.23 to 0.53] | |||
| Non-starters | 0.180 | 0.89 [0.01 to 1.76] | ||||
| Mid-season | Starters: 17.36 ± 5.33 Non-starters: 7.98 ± 2.54 | EarS vs. MidS | Starters | <0.999 | 0.11 [−0.77 to 0.99] | |
| Non-starters | 0.562 | 0.76 [−0.11 to 1.62] | ||||
| EarS vs. EndS | Starters | <0.999 | 0.12 [−0.75 to 1.00] | |||
| End-season | Starters: 17.38 ± 4.22 Non-starters: 6.77 ± 1.30 | Non-starters | 0.026 | 1.24 [0.33 to 2.15] | ||
| MidS vs. EndS | Starters | <0.999 | −0.004 [−0.88 to 0.87] | |||
| Non-starters | <0.999 | 0.58 [−0.28 to 1.43] |
Publisher’s Note: MDPI stays neutral with regard to jurisdictional claims in published maps and institutional affiliations. |
© 2021 by the authors. Licensee MDPI, Basel, Switzerland. This article is an open access article distributed under the terms and conditions of the Creative Commons Attribution (CC BY) license (https://creativecommons.org/licenses/by/4.0/).
Share and Cite
Nobari, H.; Sögüt, M.; Oliveira, R.; Pérez-Gómez, J.; Suzuki, K.; Zouhal, H. Wearable Inertial Measurement Unit to Accelerometer-Based Training Monotony and Strain during a Soccer Season: A within-Group Study for Starters and Non-Starters. Int. J. Environ. Res. Public Health 2021, 18, 8007. https://doi.org/10.3390/ijerph18158007
Nobari H, Sögüt M, Oliveira R, Pérez-Gómez J, Suzuki K, Zouhal H. Wearable Inertial Measurement Unit to Accelerometer-Based Training Monotony and Strain during a Soccer Season: A within-Group Study for Starters and Non-Starters. International Journal of Environmental Research and Public Health. 2021; 18(15):8007. https://doi.org/10.3390/ijerph18158007
Chicago/Turabian StyleNobari, Hadi, Mustafa Sögüt, Rafael Oliveira, Jorge Pérez-Gómez, Katsuhiko Suzuki, and Hassane Zouhal. 2021. "Wearable Inertial Measurement Unit to Accelerometer-Based Training Monotony and Strain during a Soccer Season: A within-Group Study for Starters and Non-Starters" International Journal of Environmental Research and Public Health 18, no. 15: 8007. https://doi.org/10.3390/ijerph18158007