
Regional Features of Long-Term Exposure to PM2.5 Air Quality over Asia under SSP Scenarios Based on CMIP6 Models

 , , , , , , , , , , ,
Abstract
:1. Introduction
2. Data and Methodology
2.1. Simulation Data from CMIP6 Archive
2.2. Satellite Data
2.3. Methodology
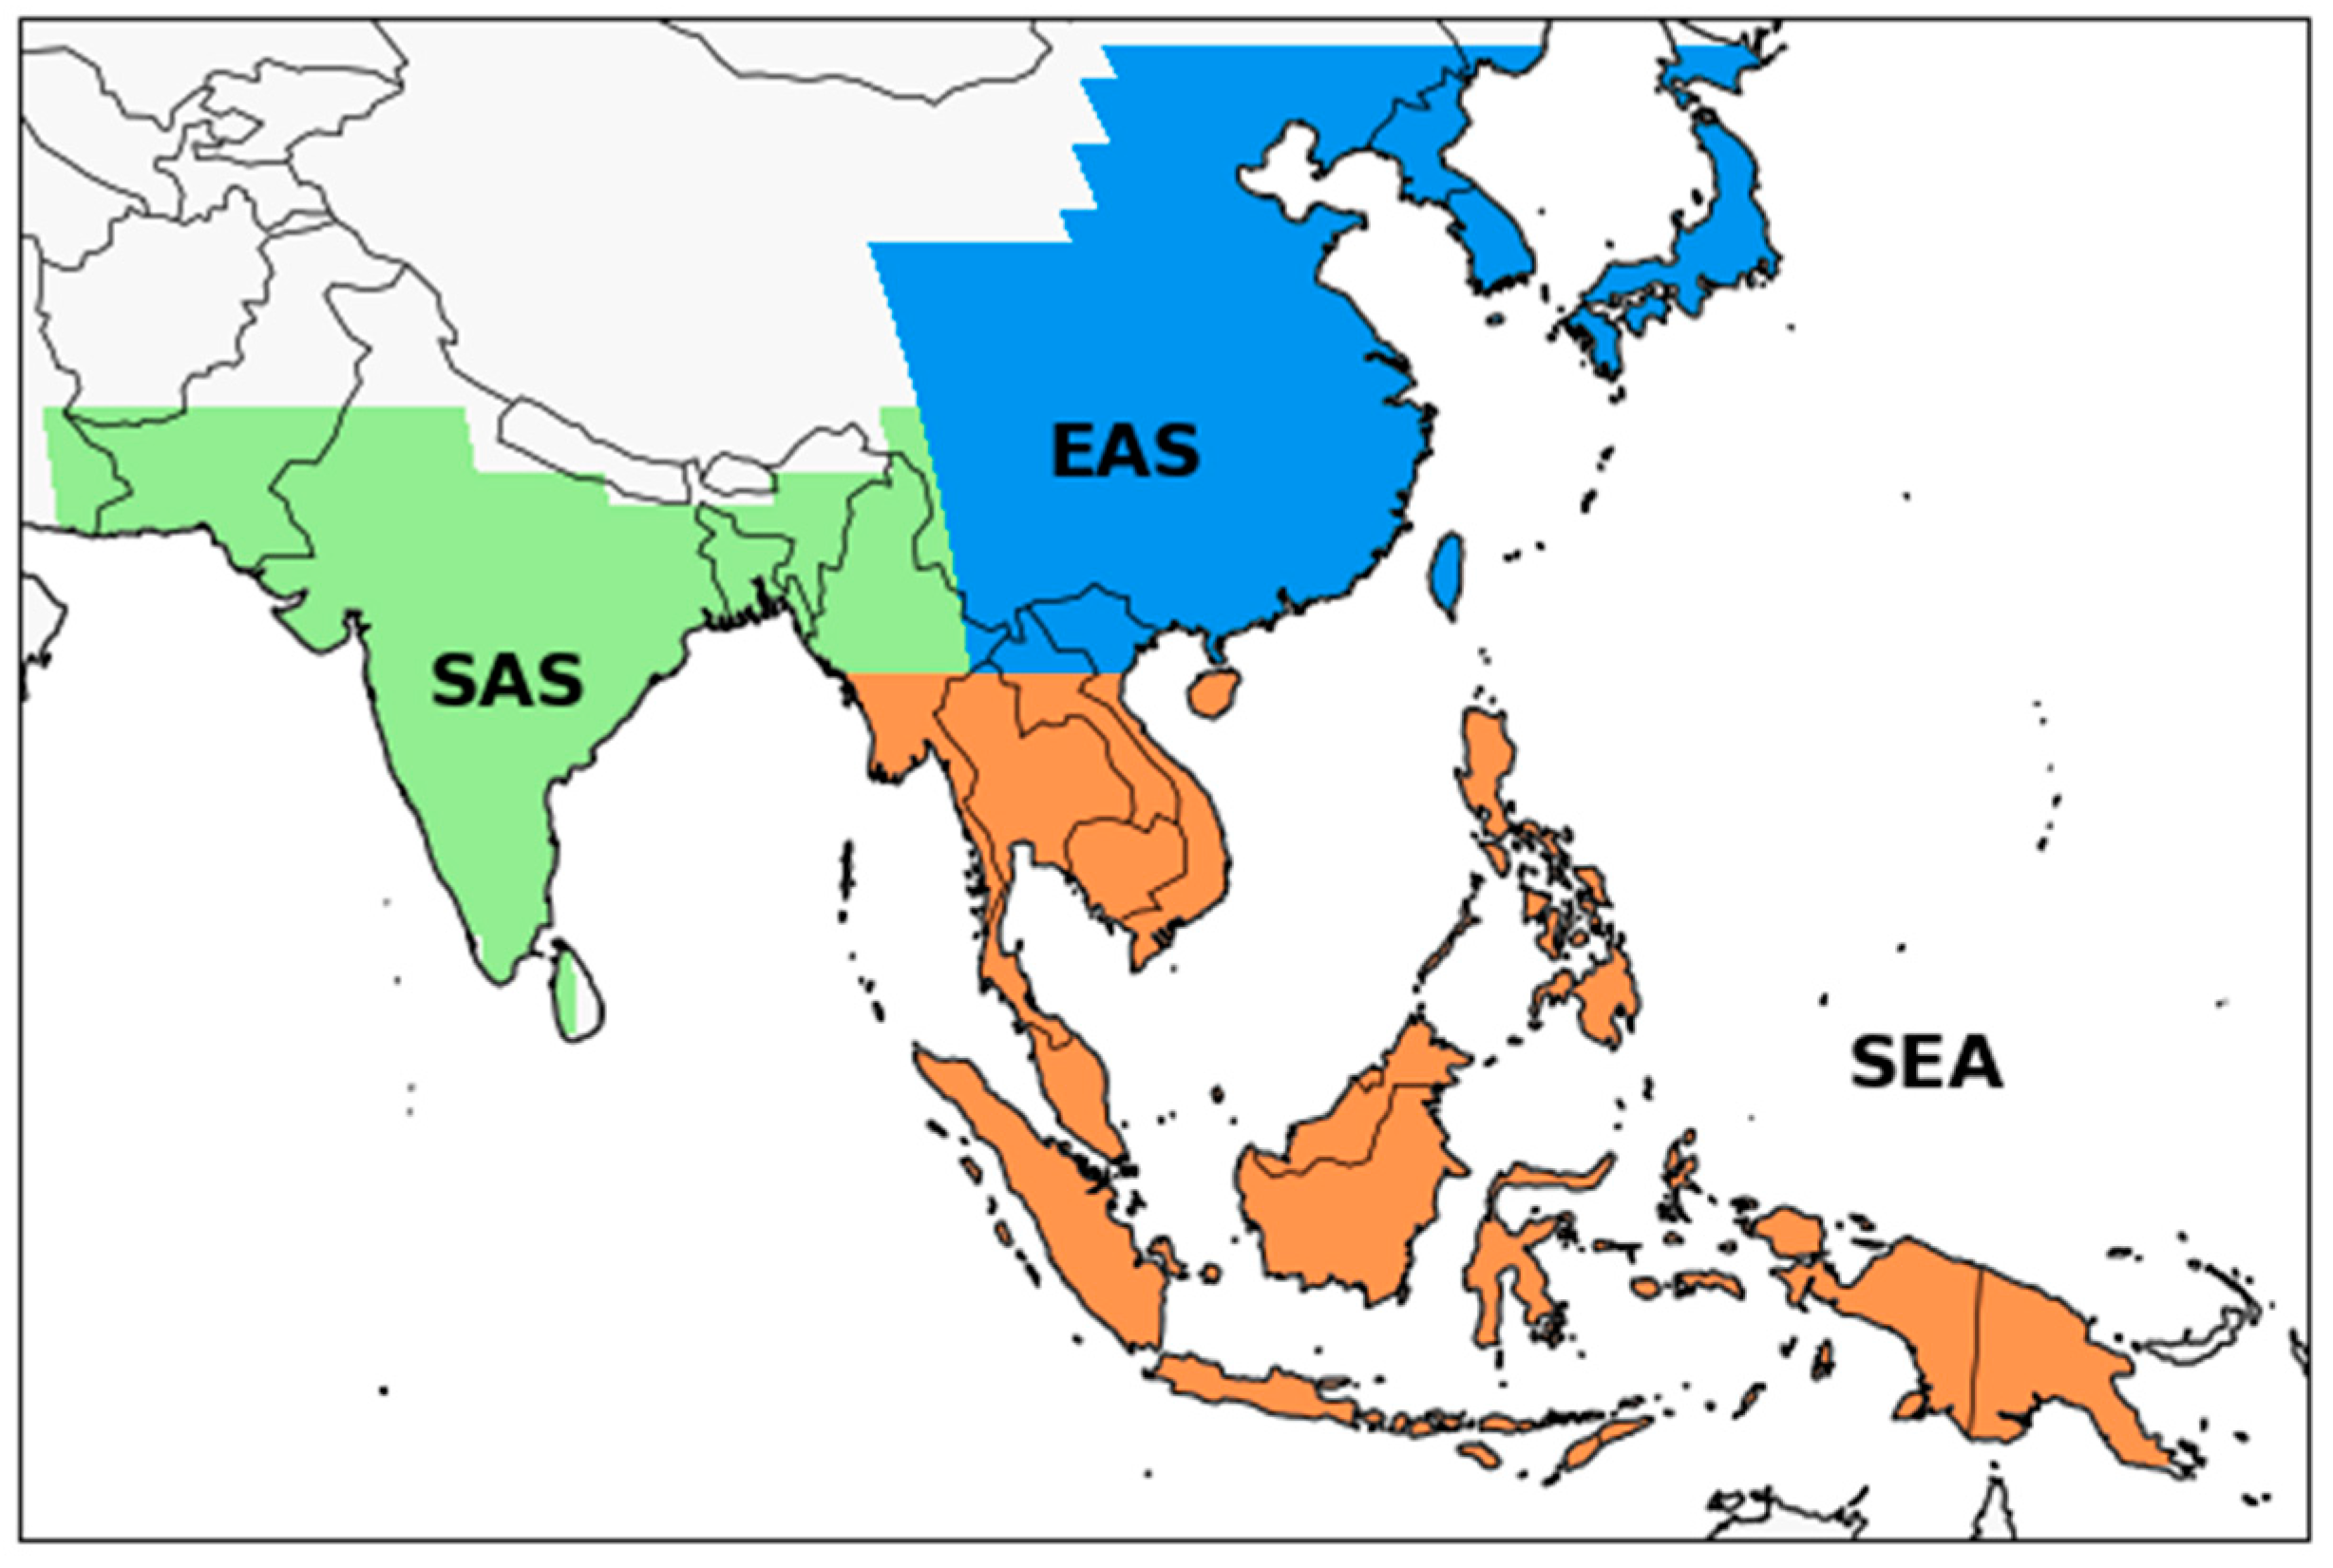
3. Results
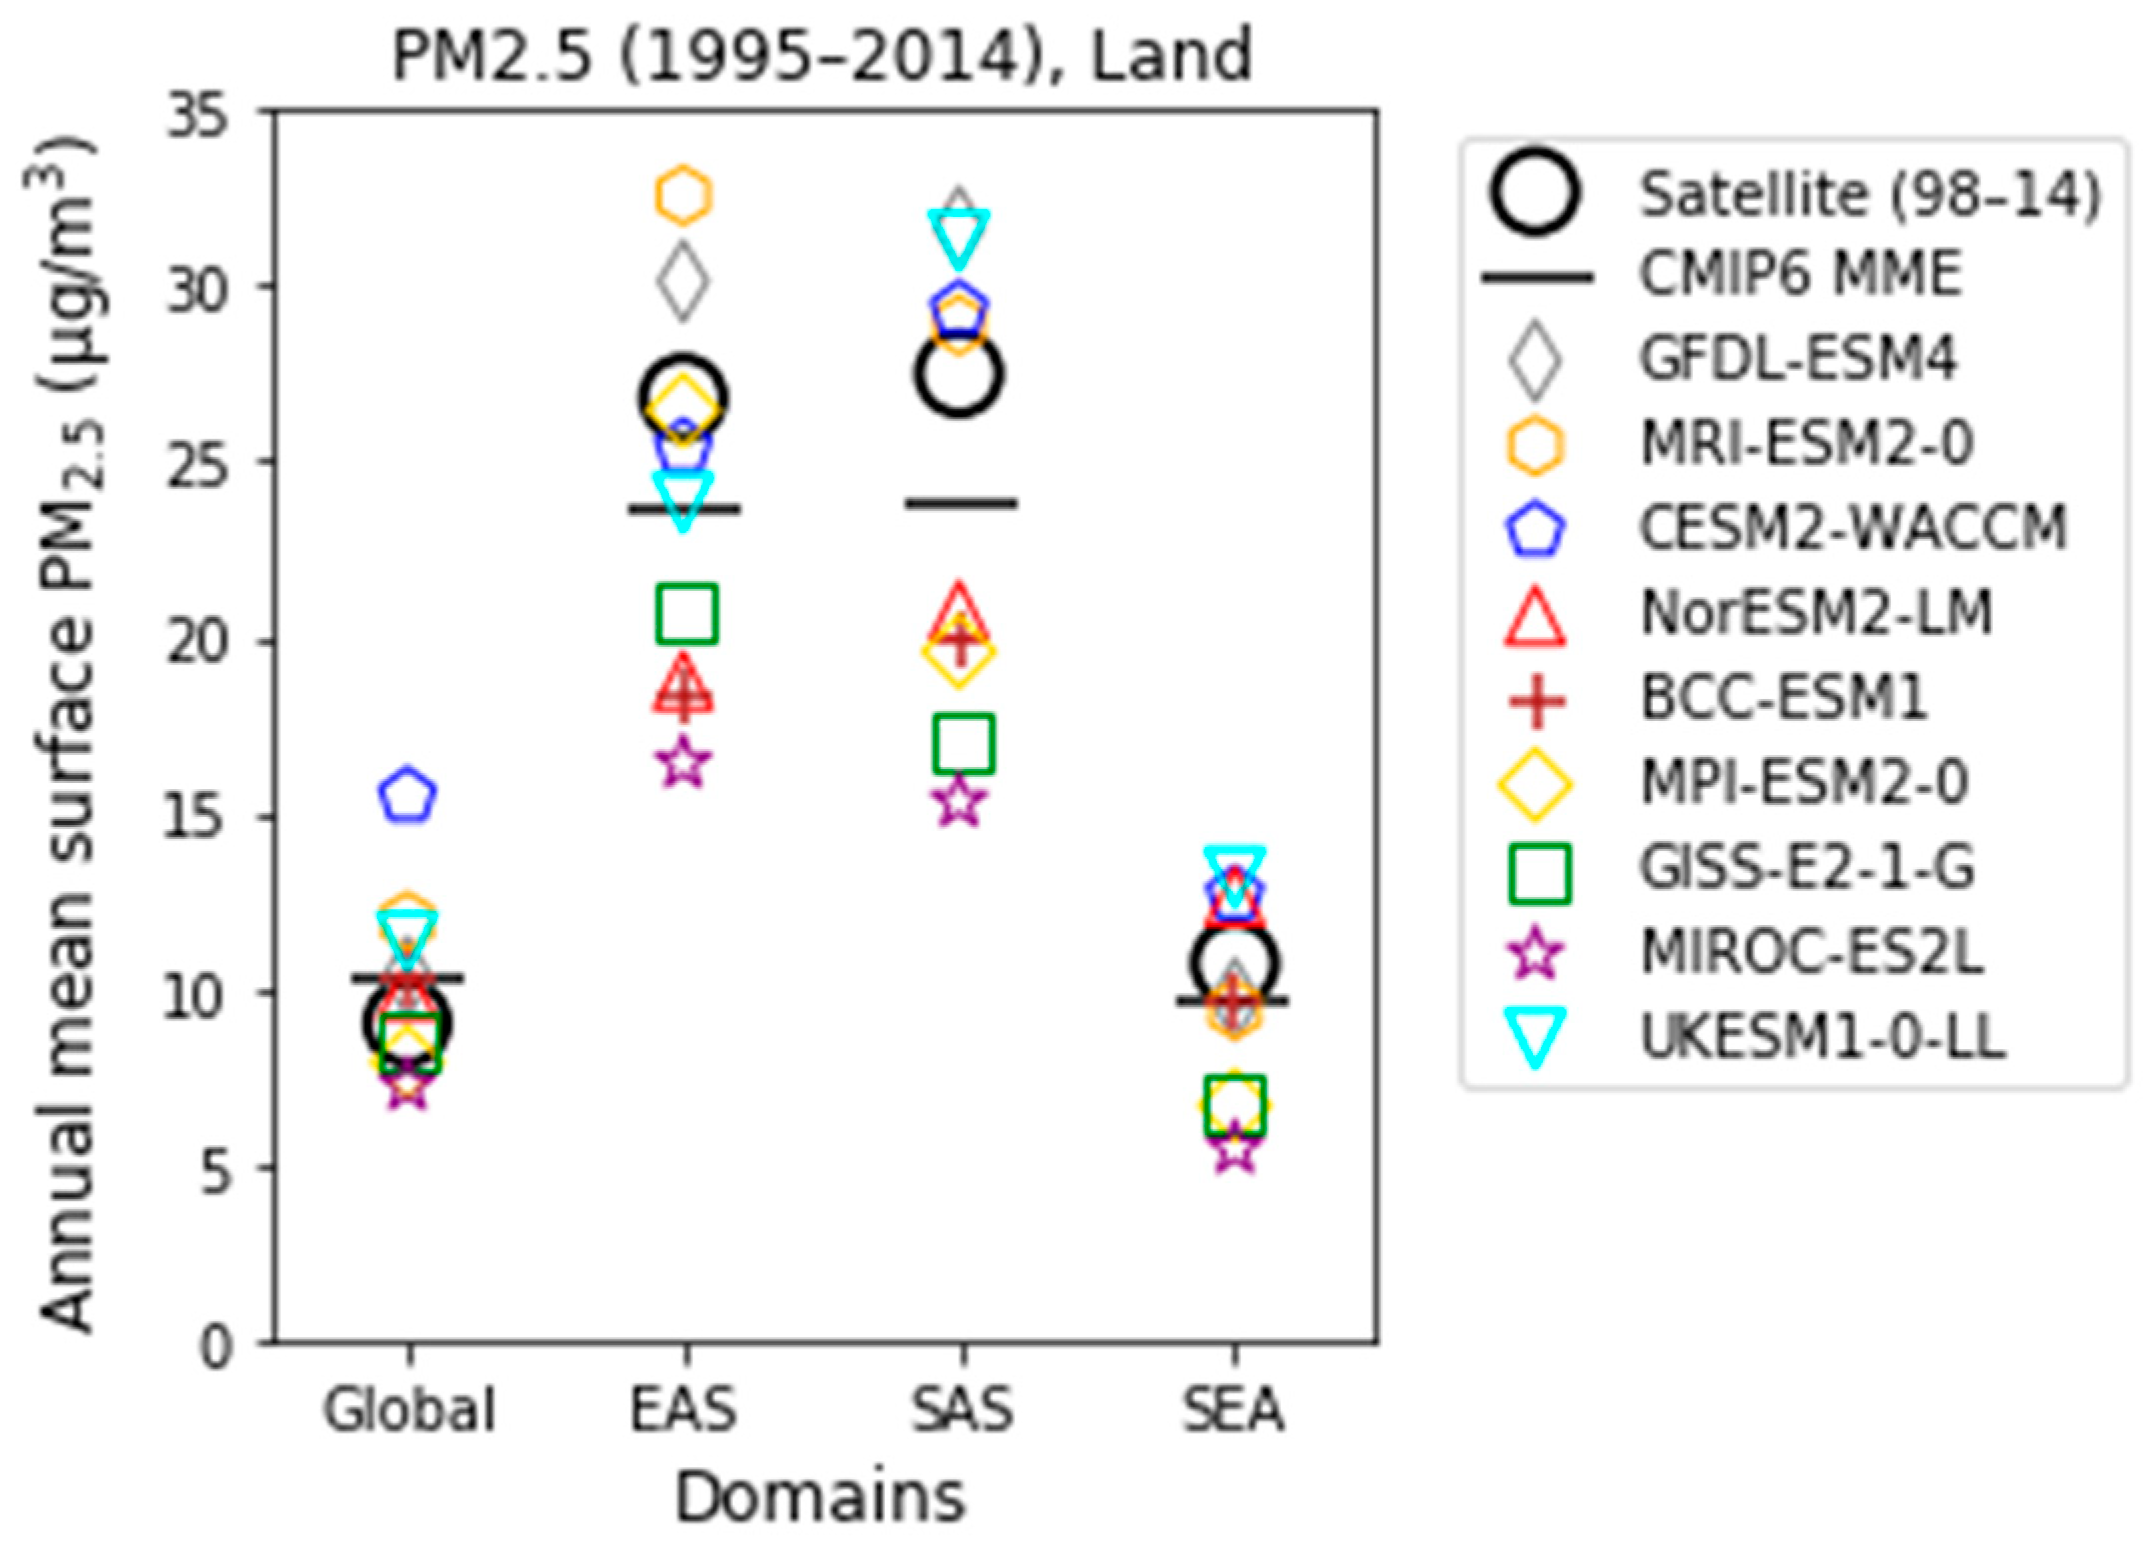
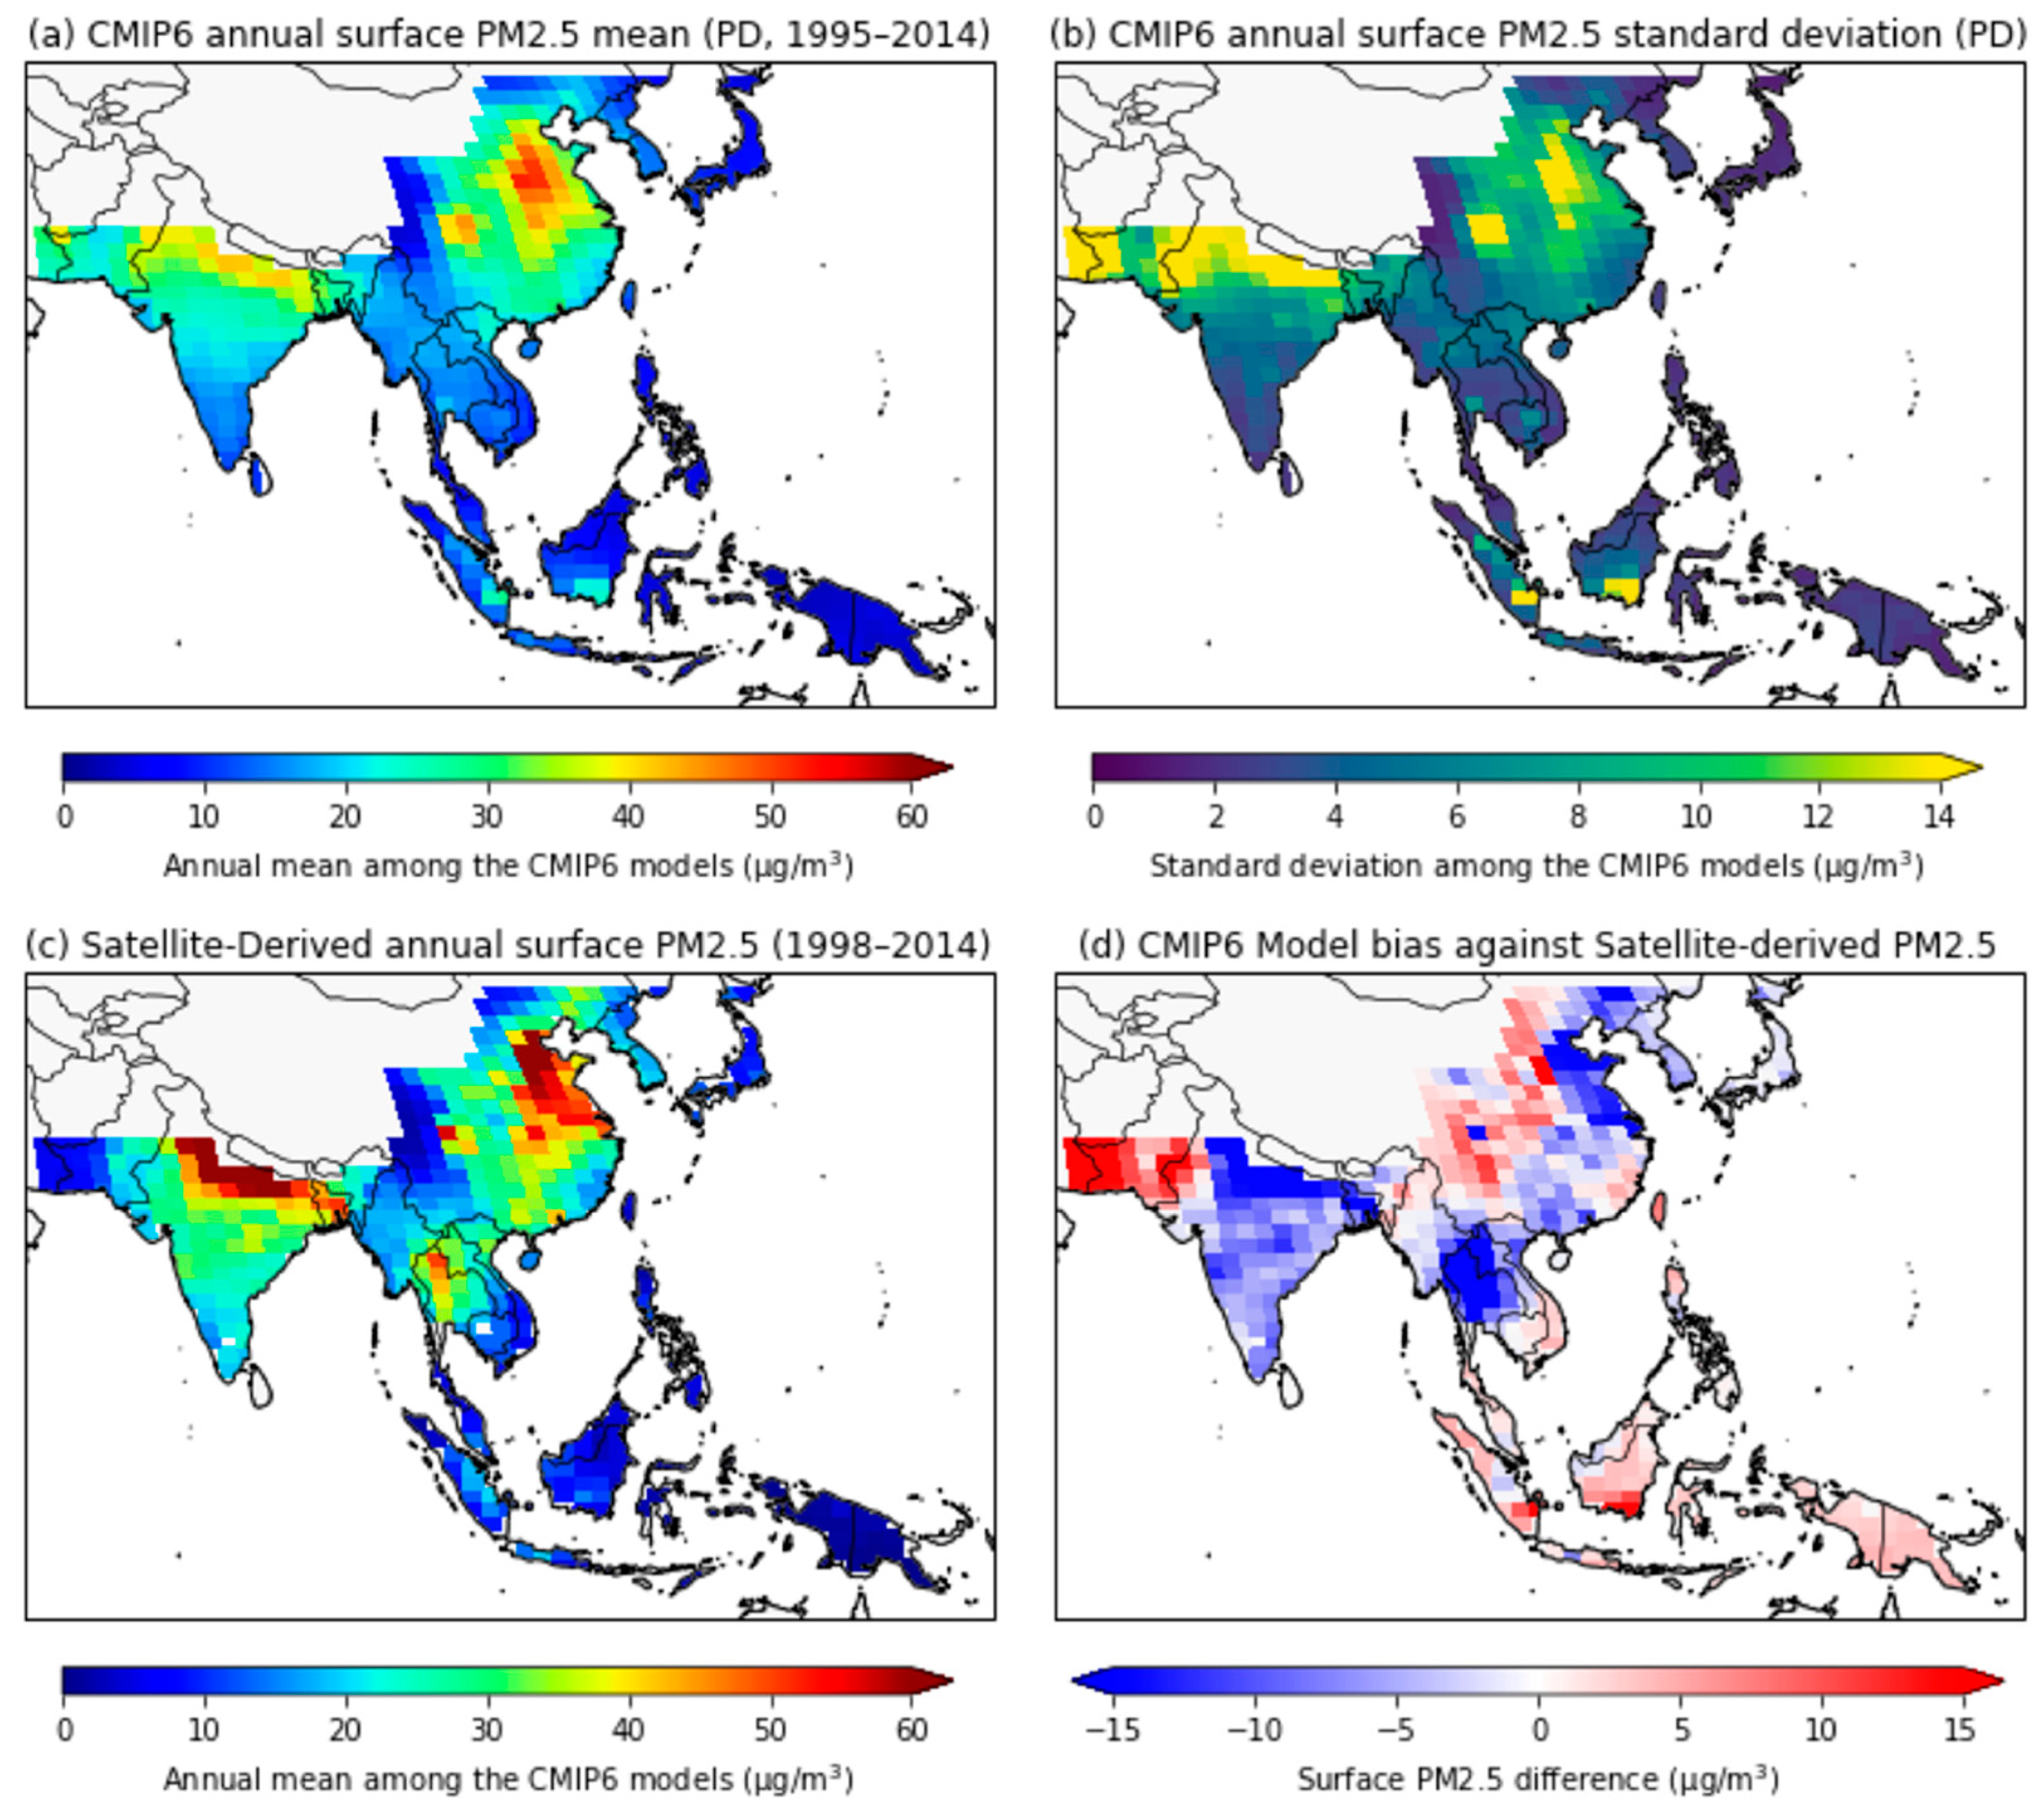
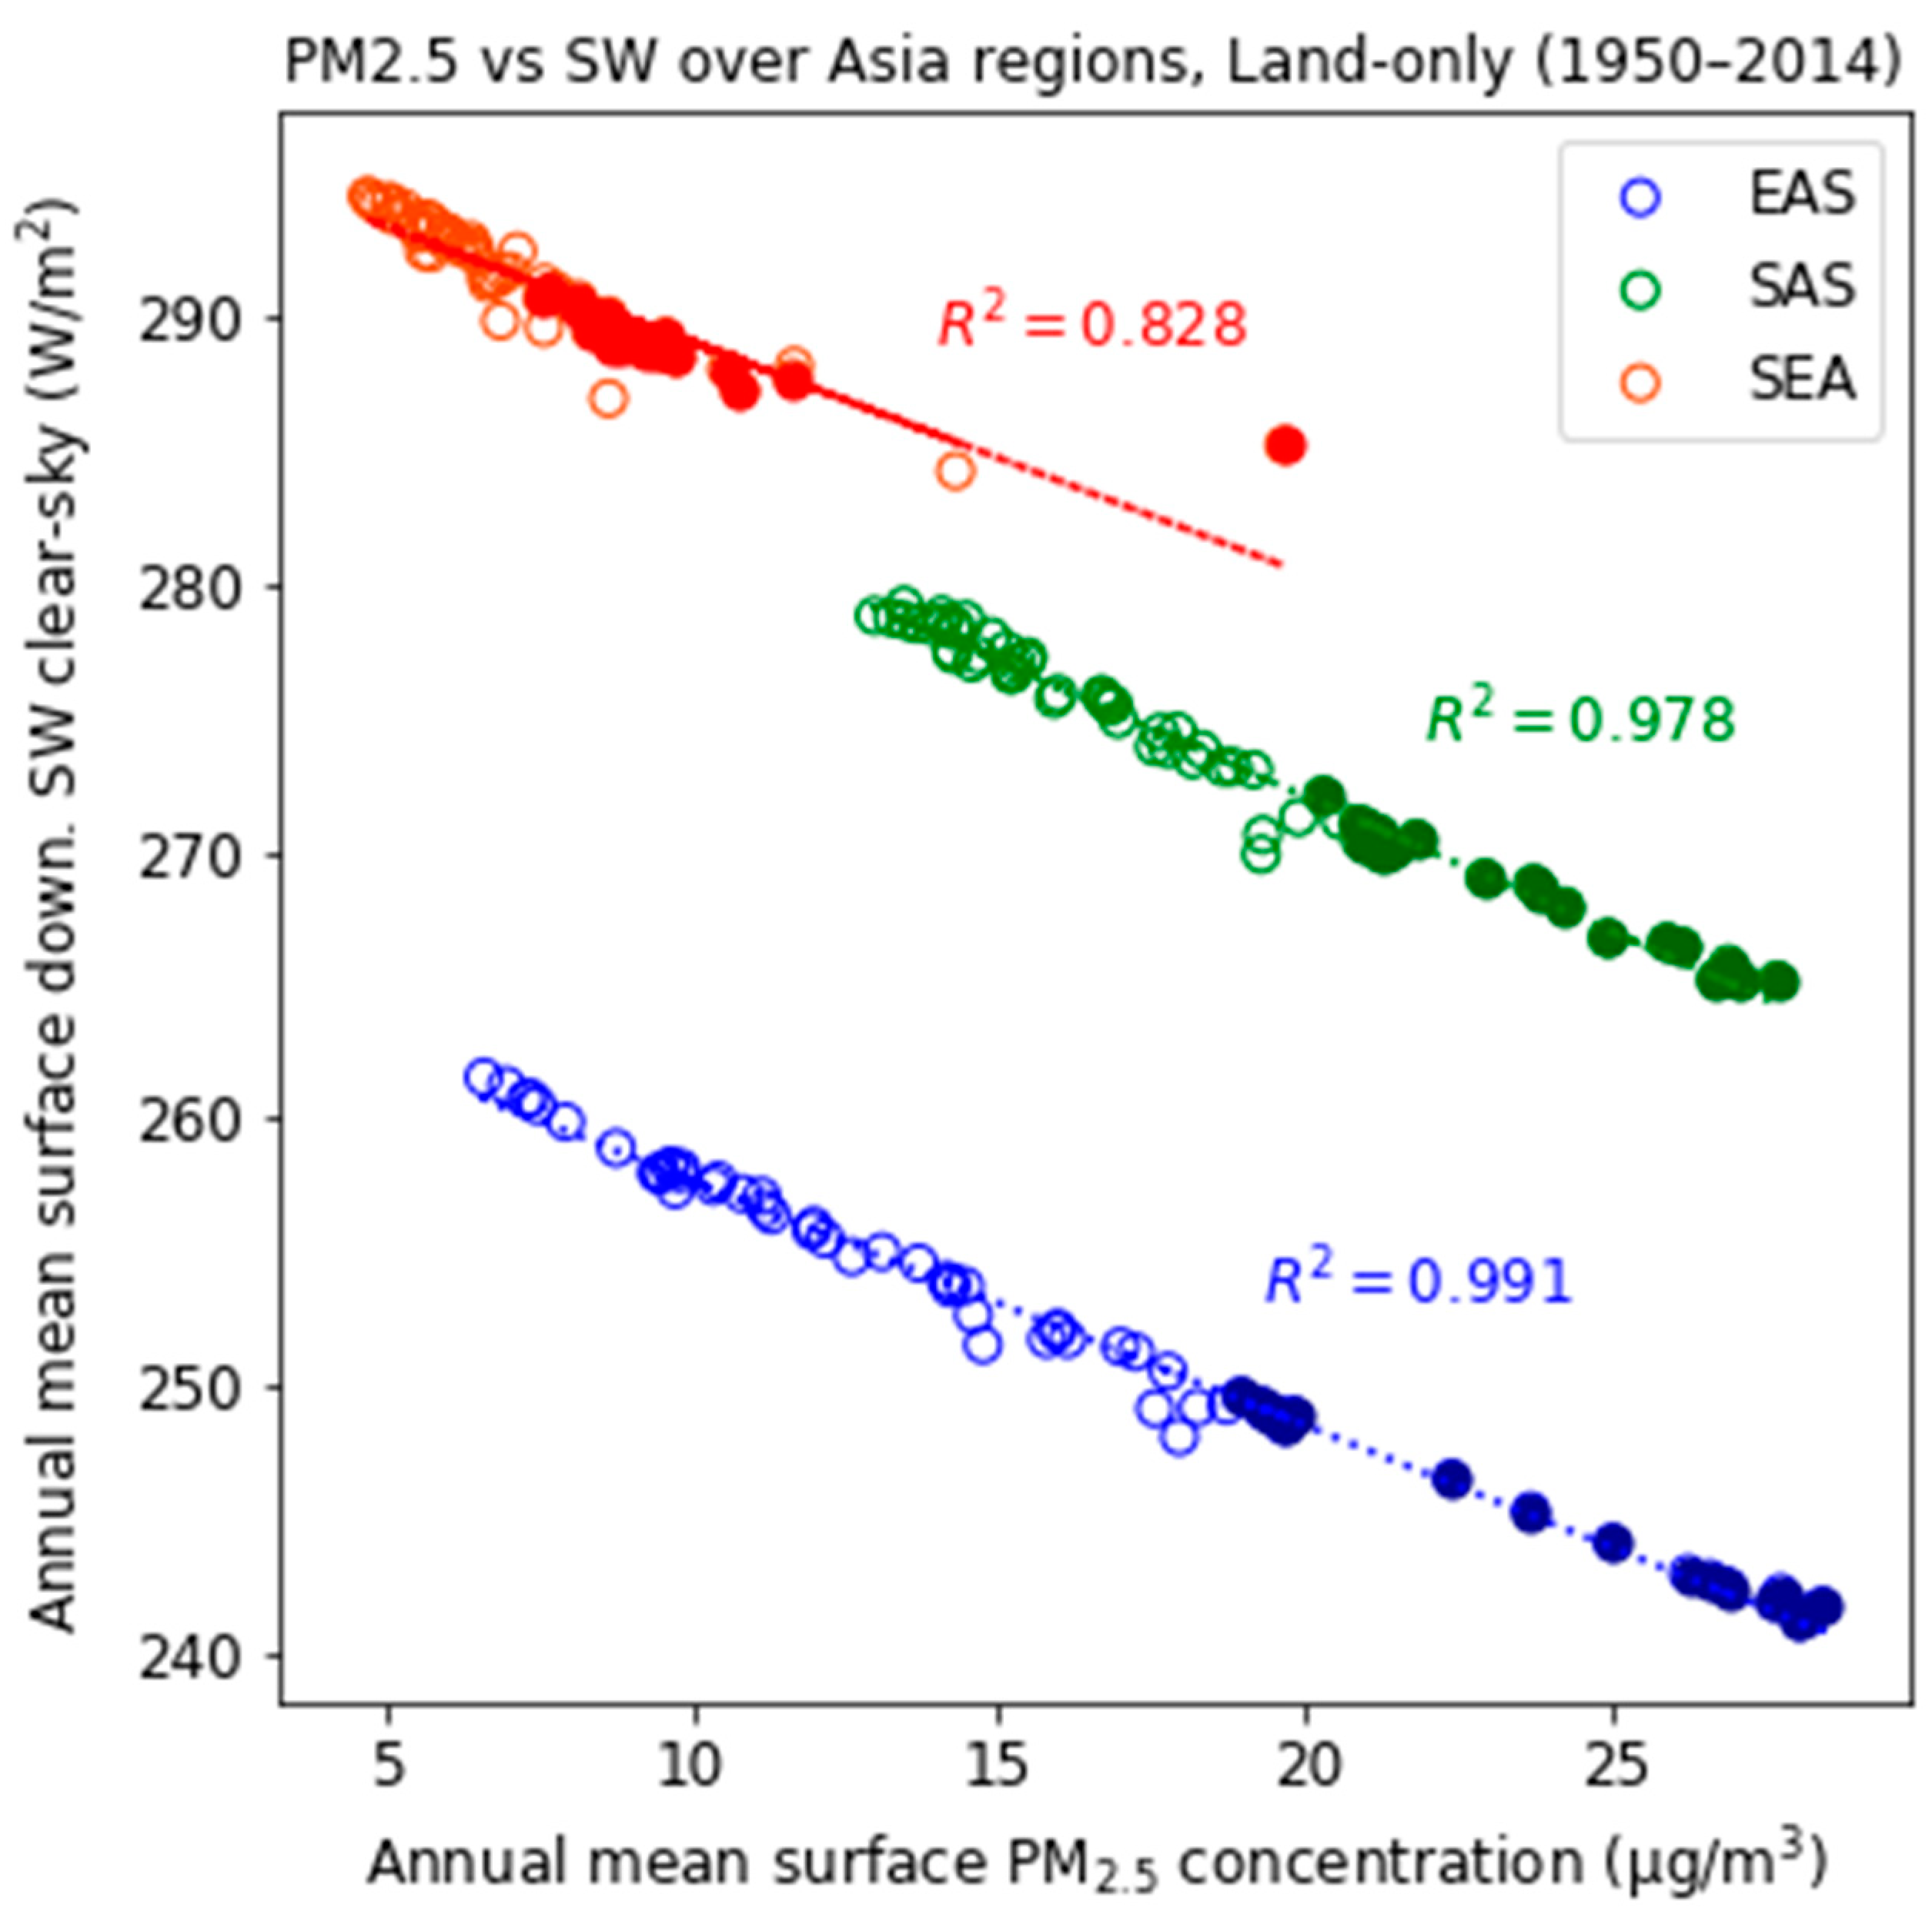
3.1. Evaluating the Estimated PM2.5 from CMIP6 Models in the Present–Day Period
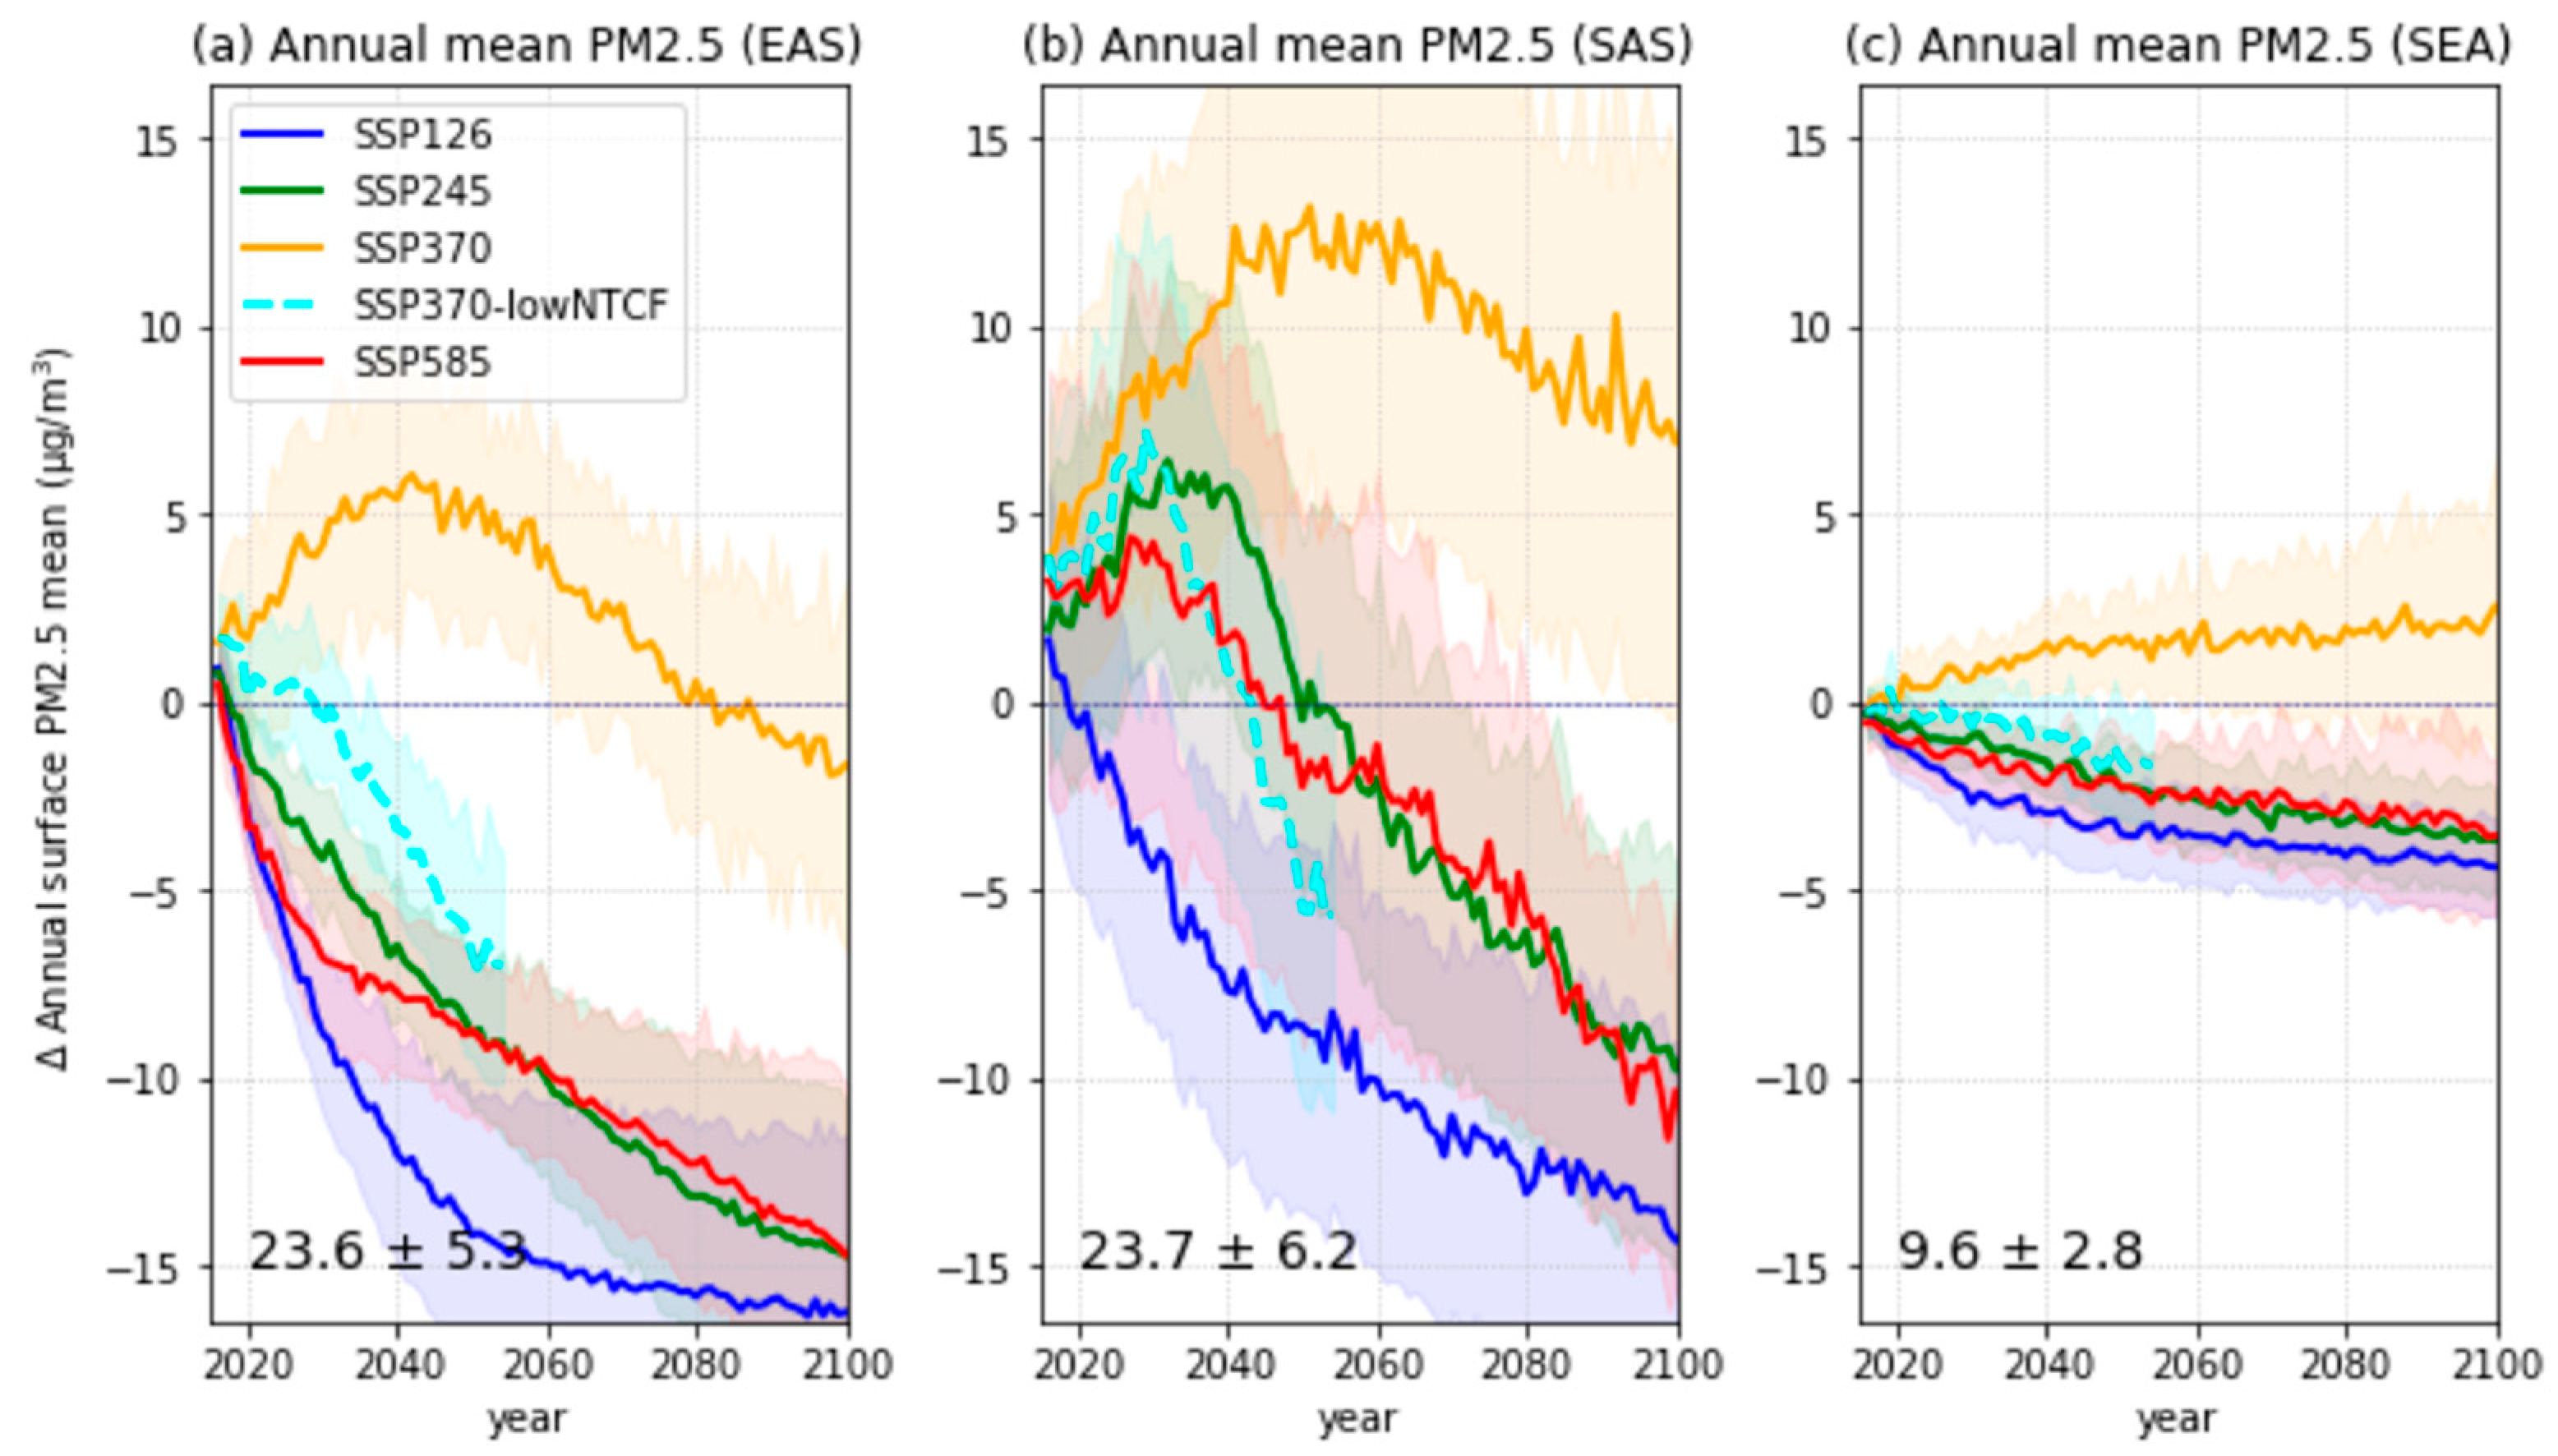
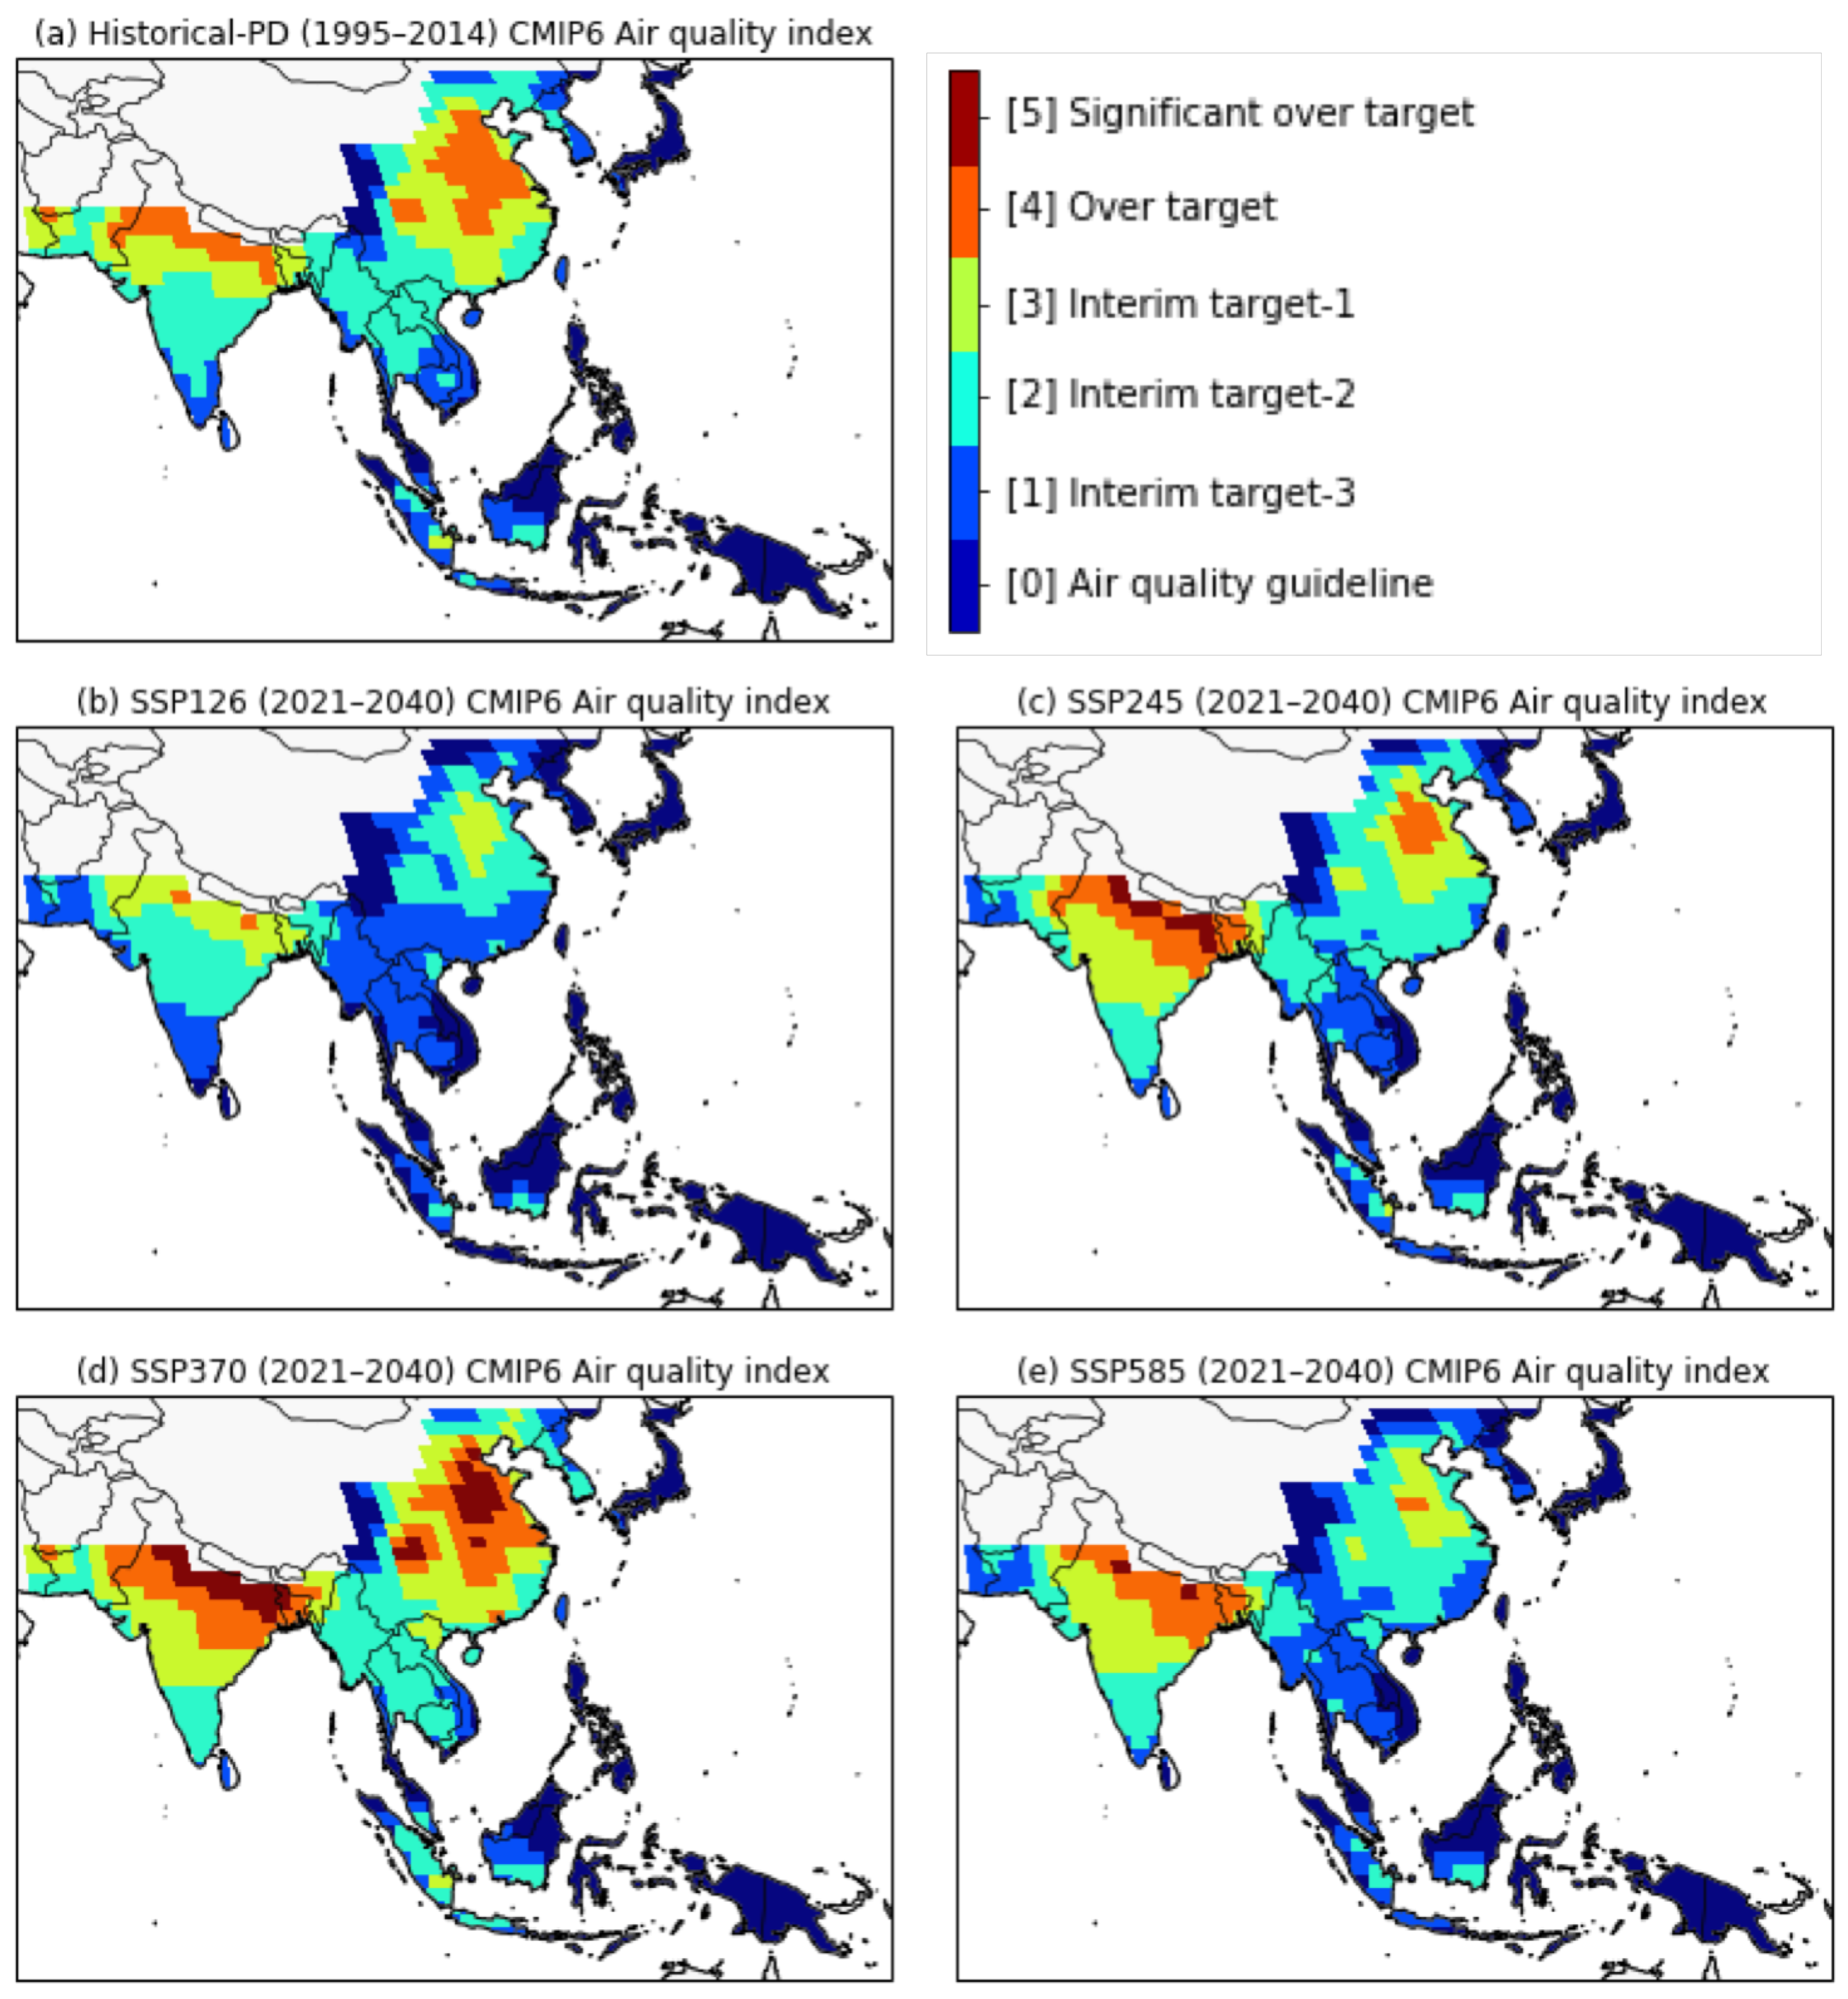
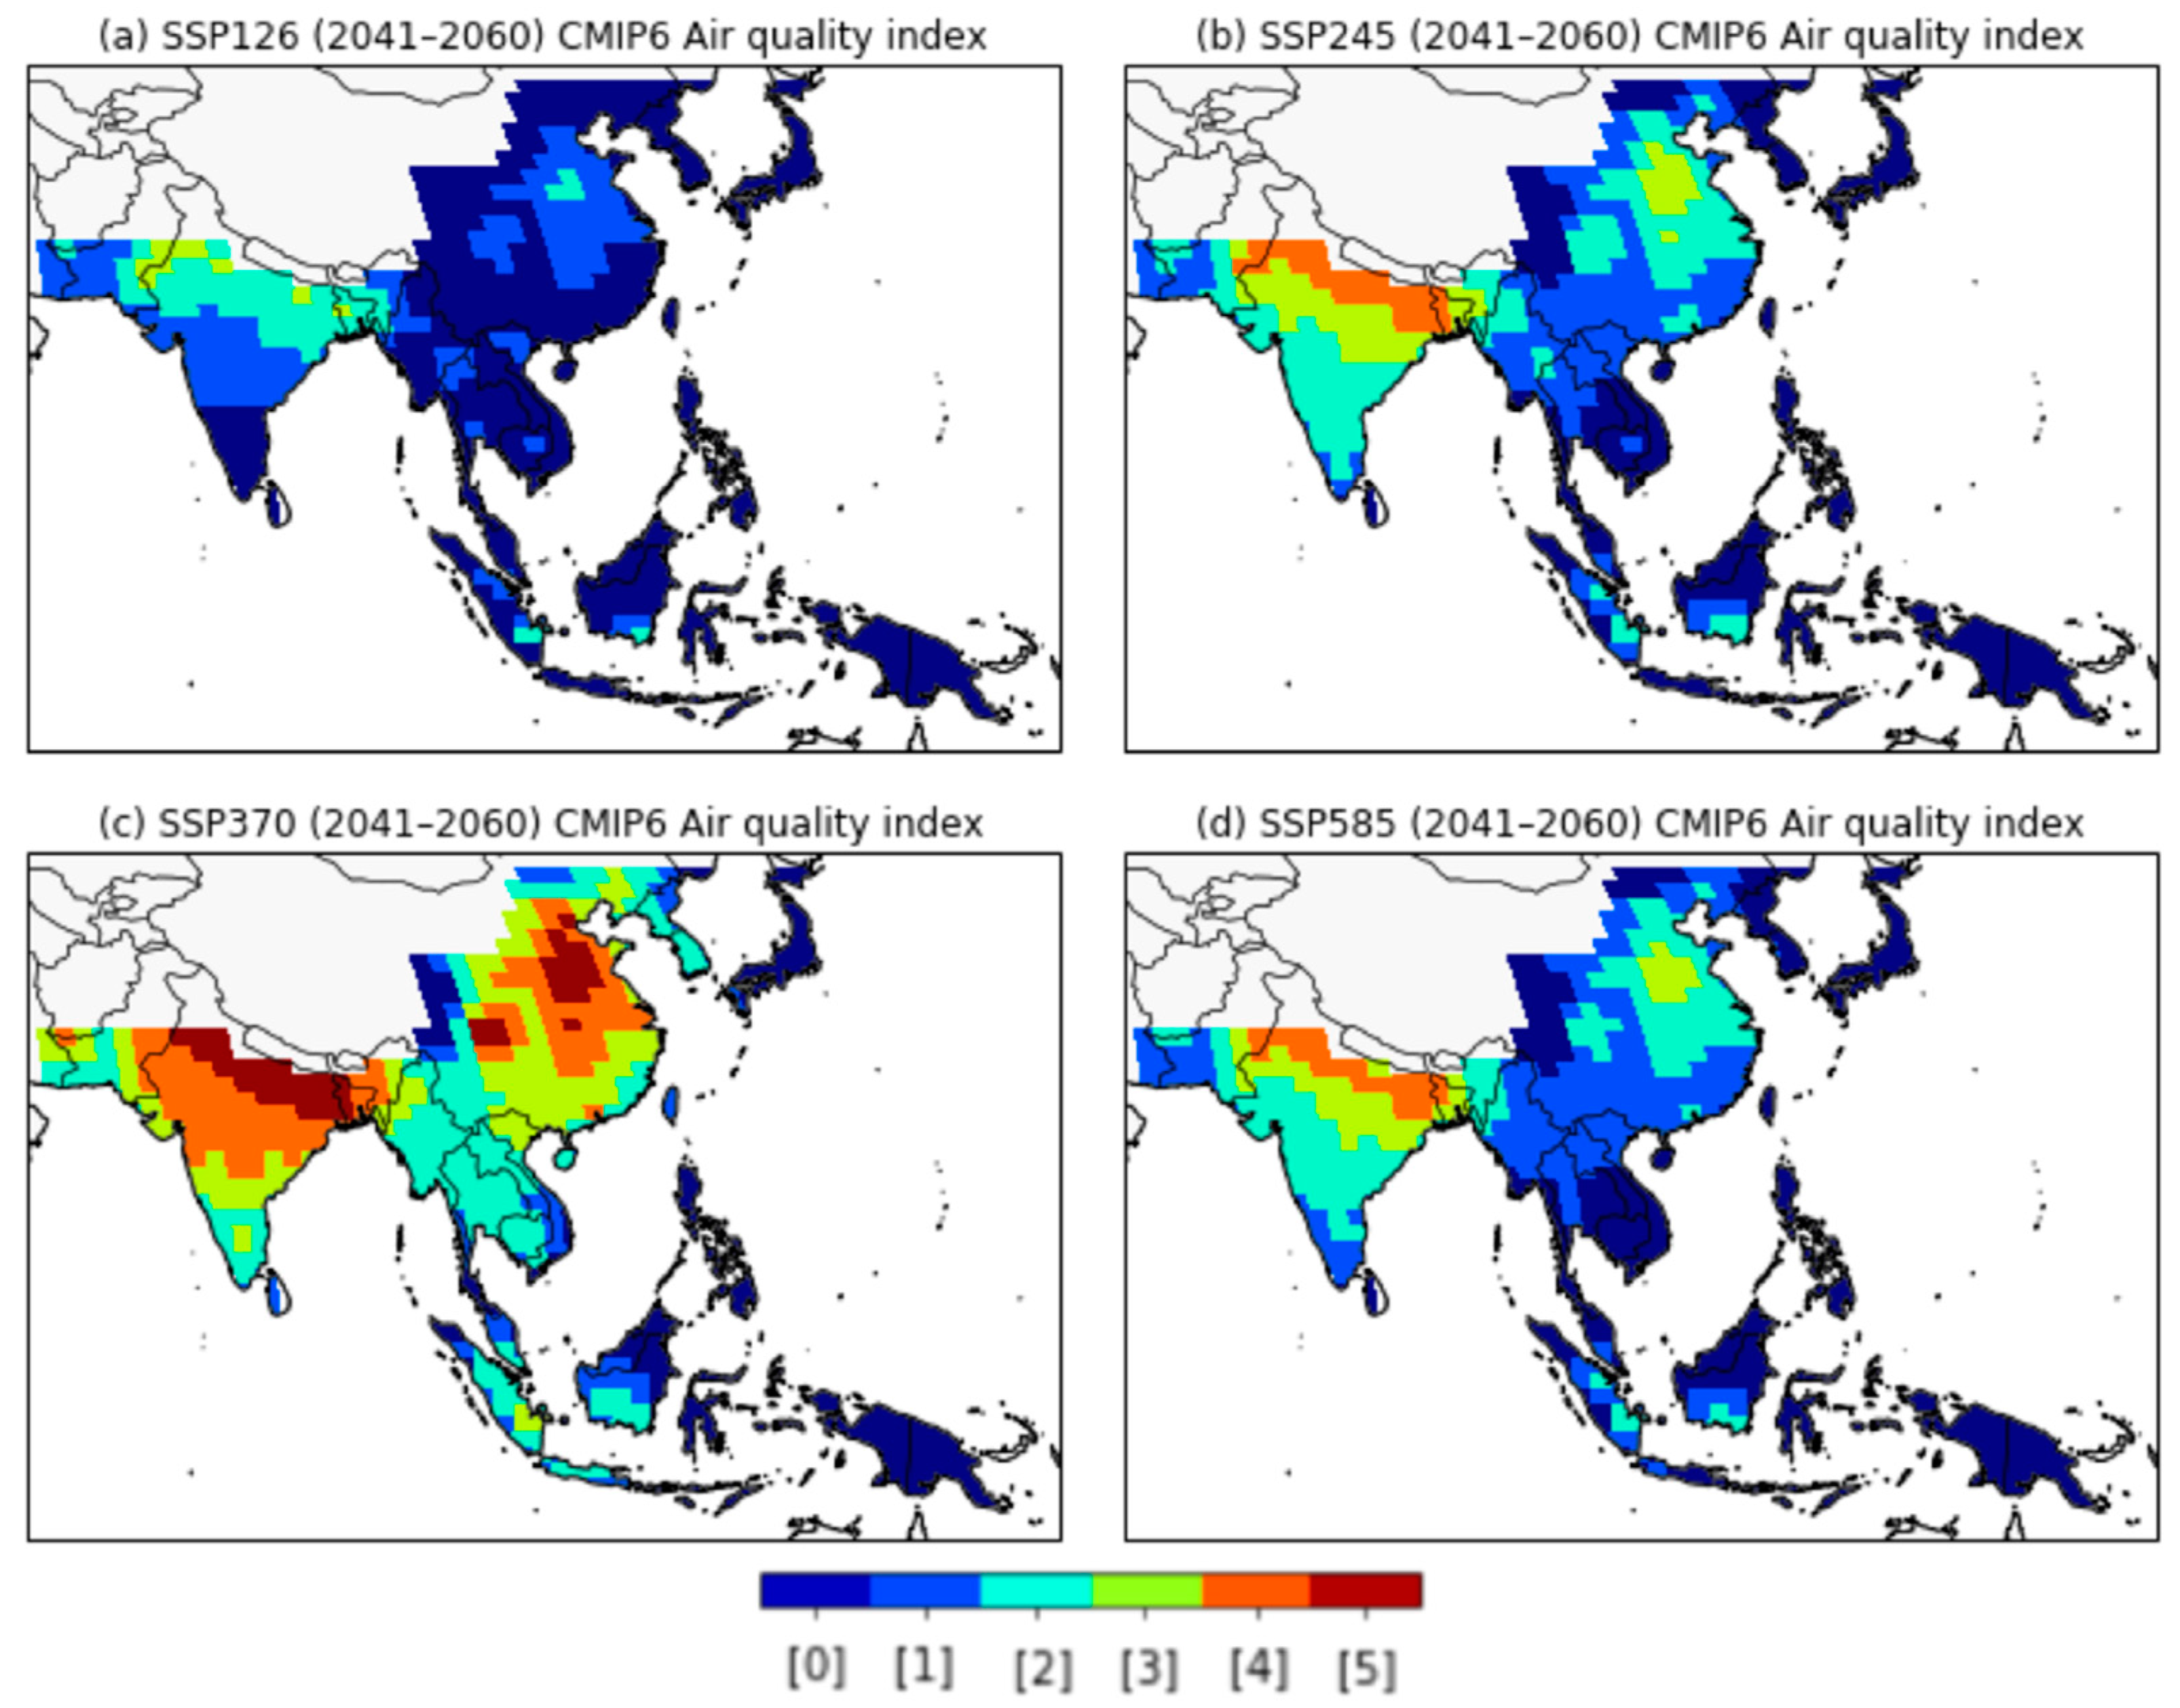
3.2. Future Changes in Simulated PM2.5 Concentrations and the Air-Quality Index
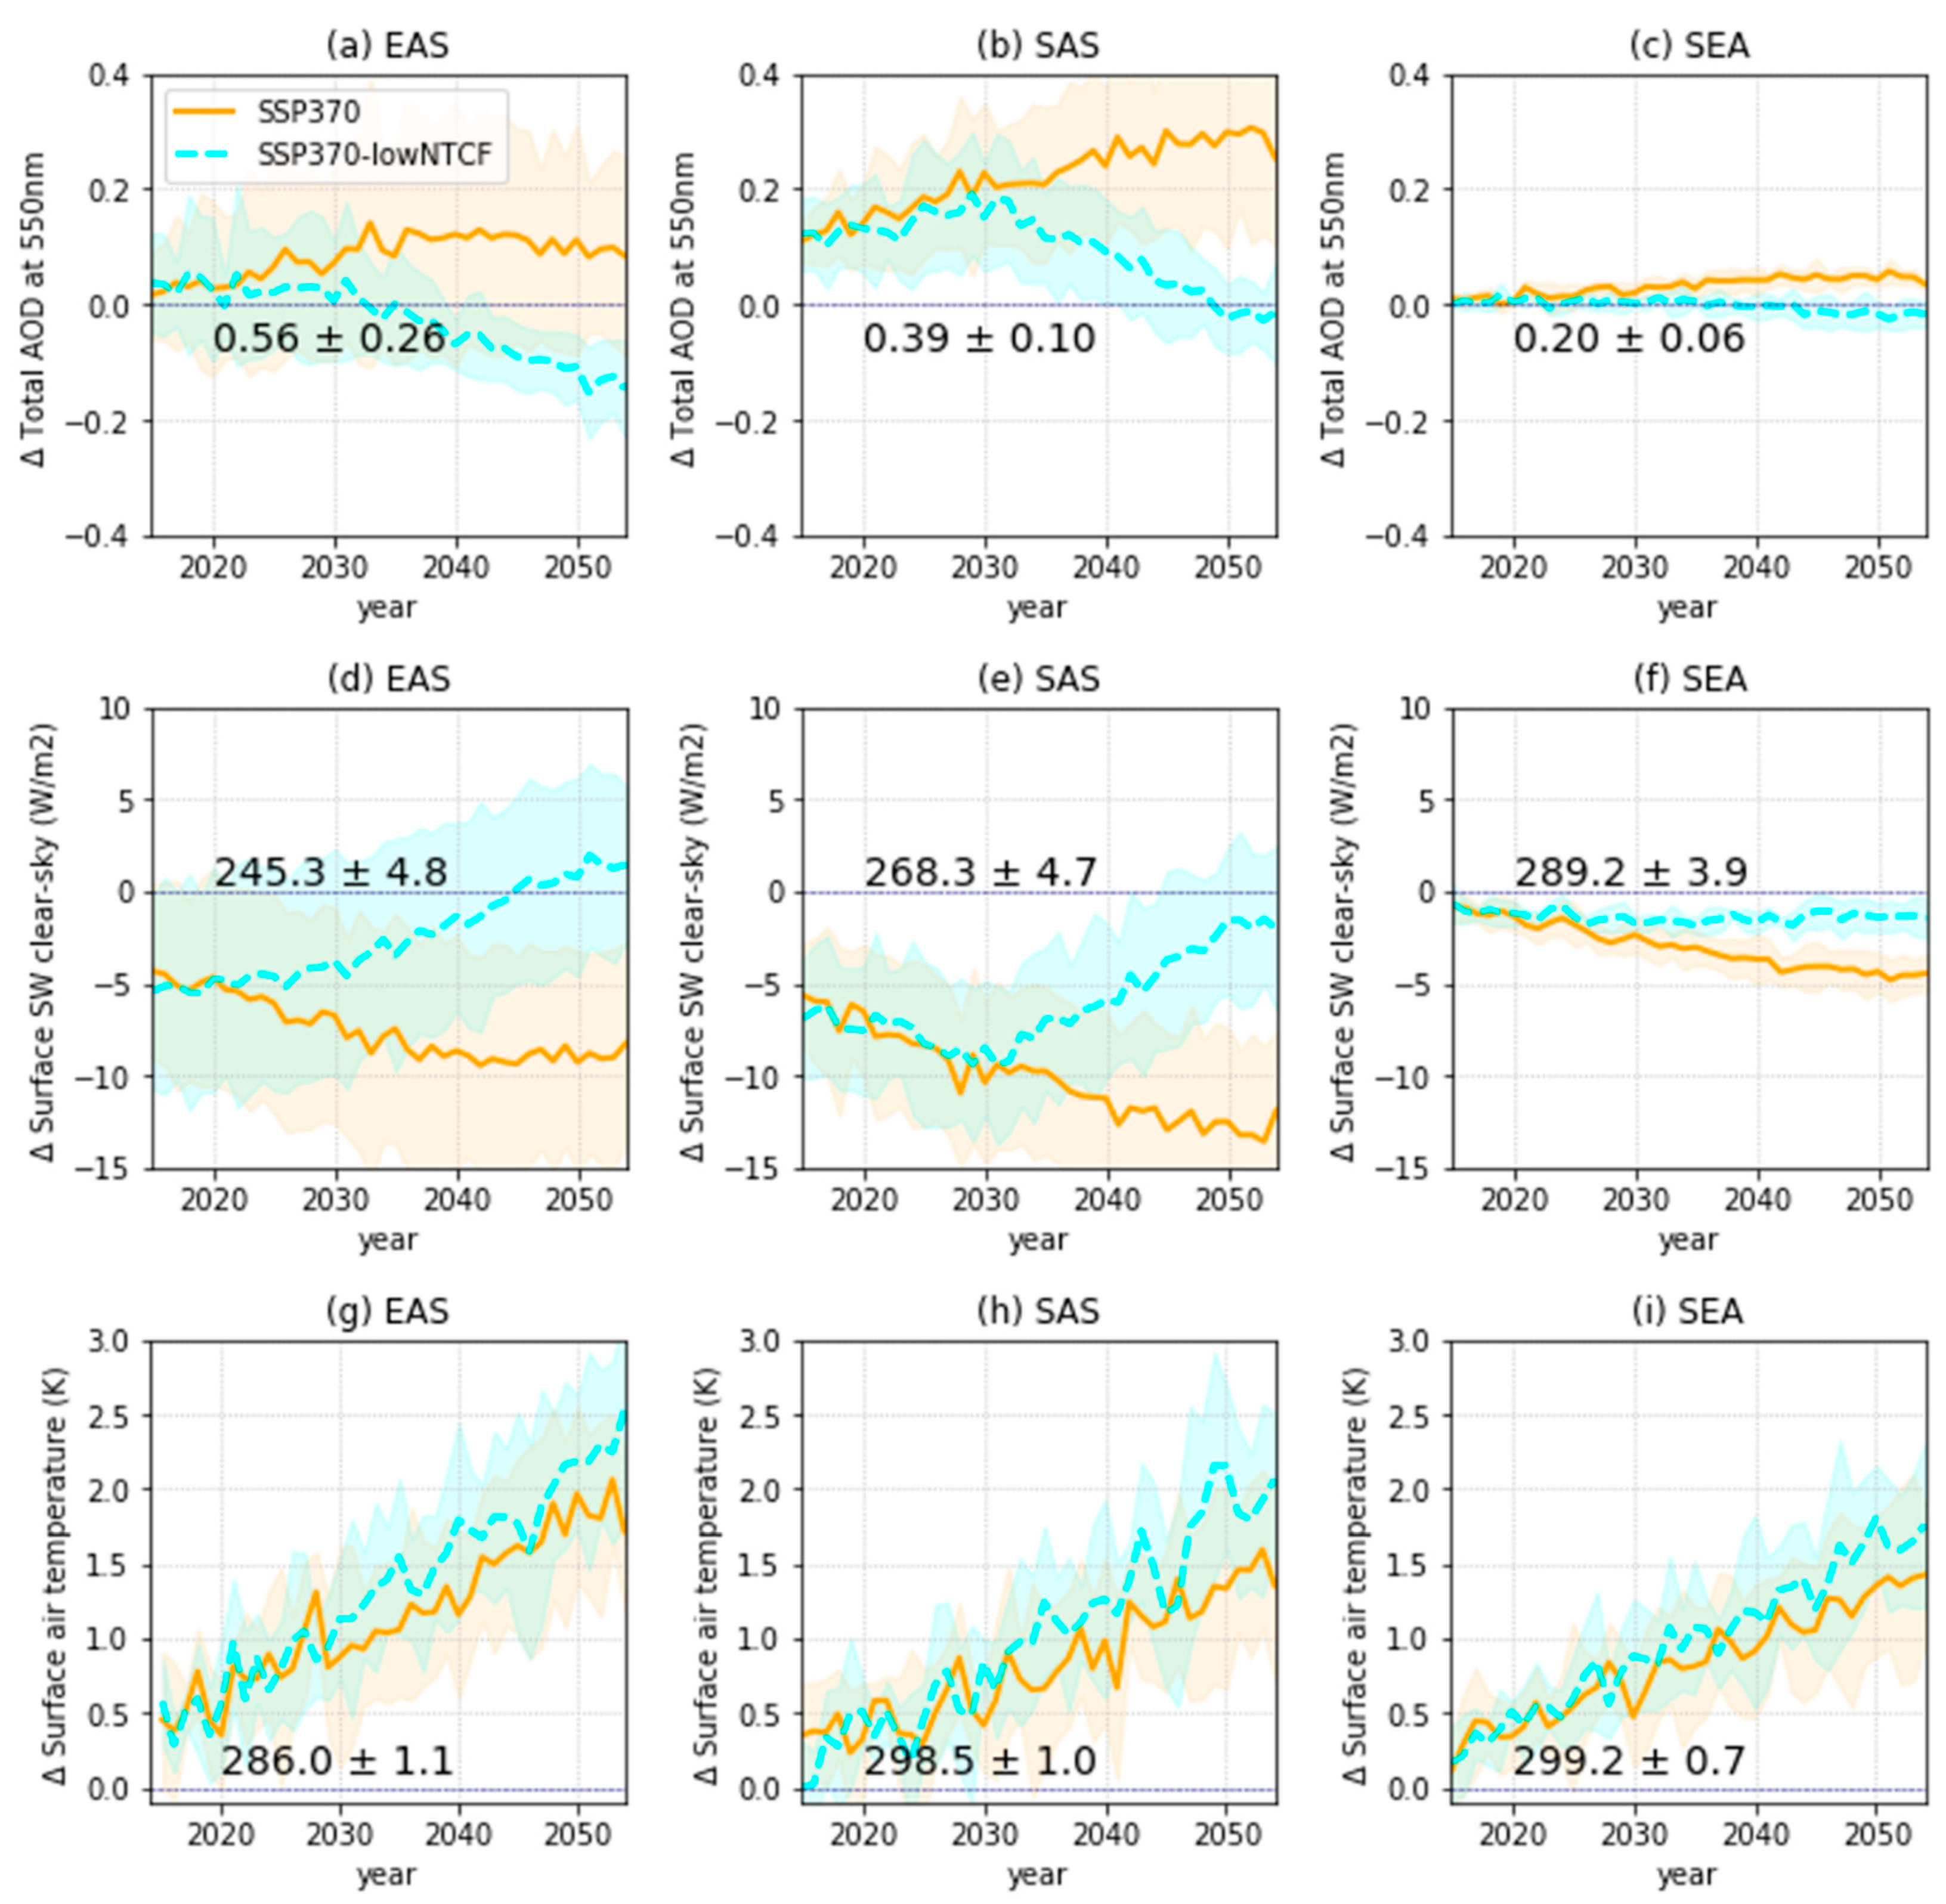
3.3. Regional Response to Future Air Pollution Mitigation
4. Conclusions
Supplementary Materials
Author Contributions
Funding
Institutional Review Board Statement
Informed Consent Statement
Data Availability Statement
Conflicts of Interest
References
- WHO. Burden of Disease from Ambient and Household Air Pollution. 2016. Available online: https://who.int/phe/health_topics/outdoorair/databases/en/ (accessed on 2 August 2020).
- WHO. Ambient Air Pollution: A Global Assessment of Exposure and Burden of Disease. 2016. Available online: https://who.int/publications/air-pollution-global-asessment/en/ (accessed on 2 August 2020).
- Kuehn, B.M. WHO: More than 7 million air pollution deaths each year. JAMA 2014, 311, 1486. [Google Scholar] [CrossRef] [PubMed]
- OECD. The Economic Consequences of Outdoor Air Pollution; OECD Publishing: Paris, France, 2016. [Google Scholar]
- IPCC. Climate Change 2014: Anthropogenic and Natural Radiative Forcing. In Contribution of Working Group I to the Fifth Assessment Report of the Intergovernmental Panel on Climate Change; Cambridge University Press: Cambridge, UK; New York, NY, USA, 2014; pp. 659–740. [Google Scholar]
- Kim, J.; Gu, Y.; Liou, K.N.; Park, R.; Song, C. Direct and semi-direct radiative effects of anthropogenic aerosols in the western United States: Seasonal and geographical variations according to regional climate characteristics. Clim. Chang. 2012, 111, 859–877. [Google Scholar] [CrossRef]
- Seo, J.; Shim, S.; Kwon, S.-H.; Boo, K.-O.; Byun, Y.-H.; O’Connor, F.; Johnson, B.; Dalvi, M.; Folberth, G.; Teixeira, J.; et al. The impacts of aerosol emissions on historical climate in UKESM1. Atmosphere 2020, 11, 1095. [Google Scholar] [CrossRef]
- Boucher, O.; Randall, P.; Artaxo, P.; Bretherton, C.; Feingold, G.; Forster, P.; Kerminen, V.-M.; Kondo, Y.; Liao, H.; Lohmann, U.; et al. Clouds and Aerosols. In Climate Change 2013: The Physical Sciences Basis. Contribution of Working Group I to the Fifth Assessment Report of the Intergovernmental Panel on Climate Change; Cambridge University Press: Cambridge, UK, 2013. [Google Scholar]
- Smith, C.J.; Kramer, R.J.; Myhre, G.; Alterskjaer, K.; Collins, W.; Sima, A.; Boucher, O.; Dufresne, J.-L.; Nabat, P.; Michou, M.; et al. Effective radiative forcing and adjustments in CMIP6 models. Atmos. Chem. Phys. 2020, 20, 9591–9618. [Google Scholar] [CrossRef]
- O’Connor, F.M.; Abraham, N.L.; Dalvi, M.; Folberth, G.A.; Griffiths, P.T.; Hardacre, C.; Johnson, B.T.; Kahana, R.; Keeble, J.; Kim, B.; et al. Assessment of pre-industrial to present-day anthropogenic climate forcing in UKESM1. Atmos. Chem. Phys. 2021, 21, 1211–1243. [Google Scholar] [CrossRef]
- Ramanathan, V.; Crutzen, P.J.; Kiehl, J.T.; Rosenfeld, D. Aerosols, climate, and the hydrological cycle. Science 2001, 294, 2119–2124. [Google Scholar] [CrossRef] [PubMed] [Green Version]
- Smith, S.J.; Aardenne, J.; Klimont, Z.; Andres, R.J.; Volke, A.; Arias, S.D. Anthropogenic sulfur dioxide emission: 1850–2005. Atmos. Chem. Phys. 2011, 11, 1101–1116. [Google Scholar] [CrossRef] [Green Version]
- Shim, S.; Kim, J.; Yum, S.S.; Lee, H.; Boo, K.-O.; Byun, Y.-H. Effects of anthropogenic and natural forcing on the summer temperature variations in East Asia during the 20th century. Atmosphere 2019, 10, 690. [Google Scholar] [CrossRef] [Green Version]
- Hong, S.Y.; Lee, J.J.; Lee, J.Y.; Kim, Y.P. Comparison of the fine particle concentrations in Seoul and other foreign mega-cities. Par. Aerosol Res. 2008, 4, 1–7. [Google Scholar]
- Han, S.H.; Kim, Y.P. Long-term trends of the concentrations of mass and chemical composition in PM2.5 over Seoul. J. Korean Soc. Atmos. Environ. 2015, 31, 143–156. [Google Scholar] [CrossRef] [Green Version]
- Kim, Y.-M. Premature deaths attributable to exposure to ambient fine particulate matter in the republic of Korea: Implication for future environmental health. J. Korean Med. Sci. 2018, 33, e243. [Google Scholar] [CrossRef]
- Kim, J.-H.; Oh, I.-H.; Park, J.-H.; Cheong, H.-K. Premature deaths attributable to long-term exposure to ambient fine particulate matter in the Republic of Korea. J. Korean Med. Sci. 2018, 33, e251. [Google Scholar] [CrossRef] [PubMed]
- Wang, Q.; Wang, J.; Zhou, J.; Ban, J.; Li, T. Estimation of PM2.5-associatied disease burden in China in 2020 and 2030 using population and air quality scenarios: A modelling study. Lancet Planet Heath 2019, 3, 71–80. [Google Scholar] [CrossRef] [Green Version]
- Hwang, I.C. Health effects of aging and fine particle matter. Seoul Inst. Policy Rep. 2019, 287, 20. [Google Scholar]
- Park, S.; Allen, R.J.; Lim, C.H. A likely increase in fine particulate matter and premature mortality under future climate change. Air Qual. Atmos. Health 2020, 13, 143–151. [Google Scholar] [CrossRef] [Green Version]
- Silva, R.A.; West, J.J.; Lamarque, J.F.; Shindell, D.T.; Collins, W.J.; Faluvegi, G.; Folberth, G.A.; Horowitz, L.W.; Nagashima, T.; Naik, V.; et al. Future global mortality from changes in air pollution attributable to climate change. Nat. Clim. Chang. 2017, 7, 647–651. [Google Scholar] [CrossRef] [Green Version]
- Lee, S.; Ho, C.-H.; Lee, Y.G.; Choi, H.-J.; Song, C.-K. Influence of transboundary air pollutants from China on the high-PM10 episode in Seoul, Korea for the period October 16-20. Atmos. Environ. 2013, 77, 430–439. [Google Scholar] [CrossRef]
- Park, S.-S.; Jung, S.-A.; Gong, B.-J.; Cho, S.-Y.; Lee, S.-J. Characteristics of PM2.5 haze episodes revealed by highly time-resolved measurements at an air pollution monitoring supersite in Korea. Aerosol Air Qual. Res. 2013, 13, 957–976. [Google Scholar] [CrossRef]
- Koo, Y.-S.; Choi, D.-R.; Kwon, H.-Y.; Jang, Y.-K.; Han, J.-S. Improvement of PM10 prediction in East Asia using inverse modeling. Atmos. Environ. 2015, 106, 318–328. [Google Scholar] [CrossRef]
- Colette, A.; Bessagnet, B.; Vautard, R.; Szopa, S.; Rao, S.; Schucht, S.; Klimont, Z.; Menut, L.; Clain, G.; Meleux, F.; et al. European atmosphere in 2050, a regional air quality and climate perspective under CMIP5 scenarios. Atmos. Chem. Phys. 2013, 13, 7451–7471. [Google Scholar] [CrossRef] [Green Version]
- Fiore, A.M.; Naik, V.; Spracklen, D.V.; Steiner, A.; Unger, N.; Prather, M.; Bergmann, D.; Cameron-Smith, P.J.; Cionni, I.; Collins, W.J.; et al. Global air quality and climate. Chem. Soc. Rev. 2012, 41, 6663–6683. [Google Scholar] [CrossRef] [Green Version]
- Tai, A.P.K.; Mickley, L.J.; Jacob, D.J. Impact of 2000–2050 climate change on fine particulate matter (PM2.5) air quality inferred from a multi-model analysis of meteorological modes. Atmos. Chem. Phys. 2012, 12, 11329–11337. [Google Scholar] [CrossRef] [Green Version]
- Chowdhury, S.; Dey, S.; Smith, K.R. Ambient PM2.5 exposures and expected premature mortality to 2100 in India under climate change scenarios. Nat. Commun. 2018, 9, 318. [Google Scholar] [CrossRef] [Green Version]
- Eyring, V.; Bony, S.; Meehl, G.A.; Senior, C.A.; Stevens, B.; Stouffer, R.J.; Taylor, K.E. Overview of the Coupled Model Intercomparison Project Phase 6 (CMIP6) experimental design and organization. Geosci. Model Dev. 2016, 9, 1937–1958. [Google Scholar] [CrossRef] [Green Version]
- Collins, W.J.; Lamarque, J.-F.; Schulz, M.; Boucher, O.; Eyring, V.; Hegglin, M.I.; Maycock, A.; Myhre, G.; Prather, M.; Shindell, D.; et al. AerChemMIP: Quantifying the effects of chemistry and aerosols in CMIP6. Geosci. Model Dev. 2017, 10, 585–607. [Google Scholar] [CrossRef] [Green Version]
- Allen, R.J.; Turnock, S.; Nabat, P.; Neubauer, D.; Lohmann, U.; Olivie, D.; Oshima, N.; Michou, M.; Wu, T.; Zhang, J.; et al. Climate and air quality impacts due to mitigation of non-methane near-term climate forcers. Atmos. Chem. Phys. 2020, 20, 9641–9663. [Google Scholar] [CrossRef]
- Griffiths, P.T.; Murray, L.T.; Zeng, G.; Archibald, A.T.; Emmons, L.K.; Galbally, I.; Hassler, B.; Horowitz, L.W.; Keeble, J.; Liu, J.; et al. Tropospheric ozone in CMIP6 simulations. Amos. Chem. Phys. 2020. in review. [Google Scholar] [CrossRef] [Green Version]
- Turnock, S.T.; Allen, R.J.; Andrews, M.; Bauer, S.E.; Deushi, M.; Emmons, L.; Good, P.; Horowitz, L.; John, J.G.; Michou, M.; et al. Historical and future changes in air pollutants from CMIP6 models. Atmos. Chem. Phys. 2020, 20, 14547–14579. [Google Scholar] [CrossRef]
- Allen, R.J.; Horowitz, L.W.; Naik, V.; Oshima, N.; O’Connor, F.M.; Turnock, S.; Shim, S.; Le Sager, P.; van Noije, T.; Tsigaridis, K.; et al. Significant climate benefits from near-term climate forcer mitigation in spite of aerosol reductions. Environ. Res. Lett. 2021, 16, 034010. [Google Scholar] [CrossRef]
- Shim, S.; Seo, J.; Kwon, S.-H.; Lee, J.-H.; Sung, H.-M.; Boo, K.-O.; Byun, Y.-H.; Lim, Y.-J.; Kim, Y.-H. Impact of future air quality in East Asia under SSP scenarios. Atmosphere 2020, 30, 439–454. [Google Scholar] [CrossRef]
- Li, Z.; Lau, W.K.-M.; Ramanathan, V.; Wu, G.; Ding, Y.; Manoj, M.G.; Liu, J.; Qian, Y.; Li, J.; Zhou, T.; et al. Aerosol and monsoon climate interactions over Asia. Rev. Geophys. 2016, 54, 866–929. [Google Scholar] [CrossRef]
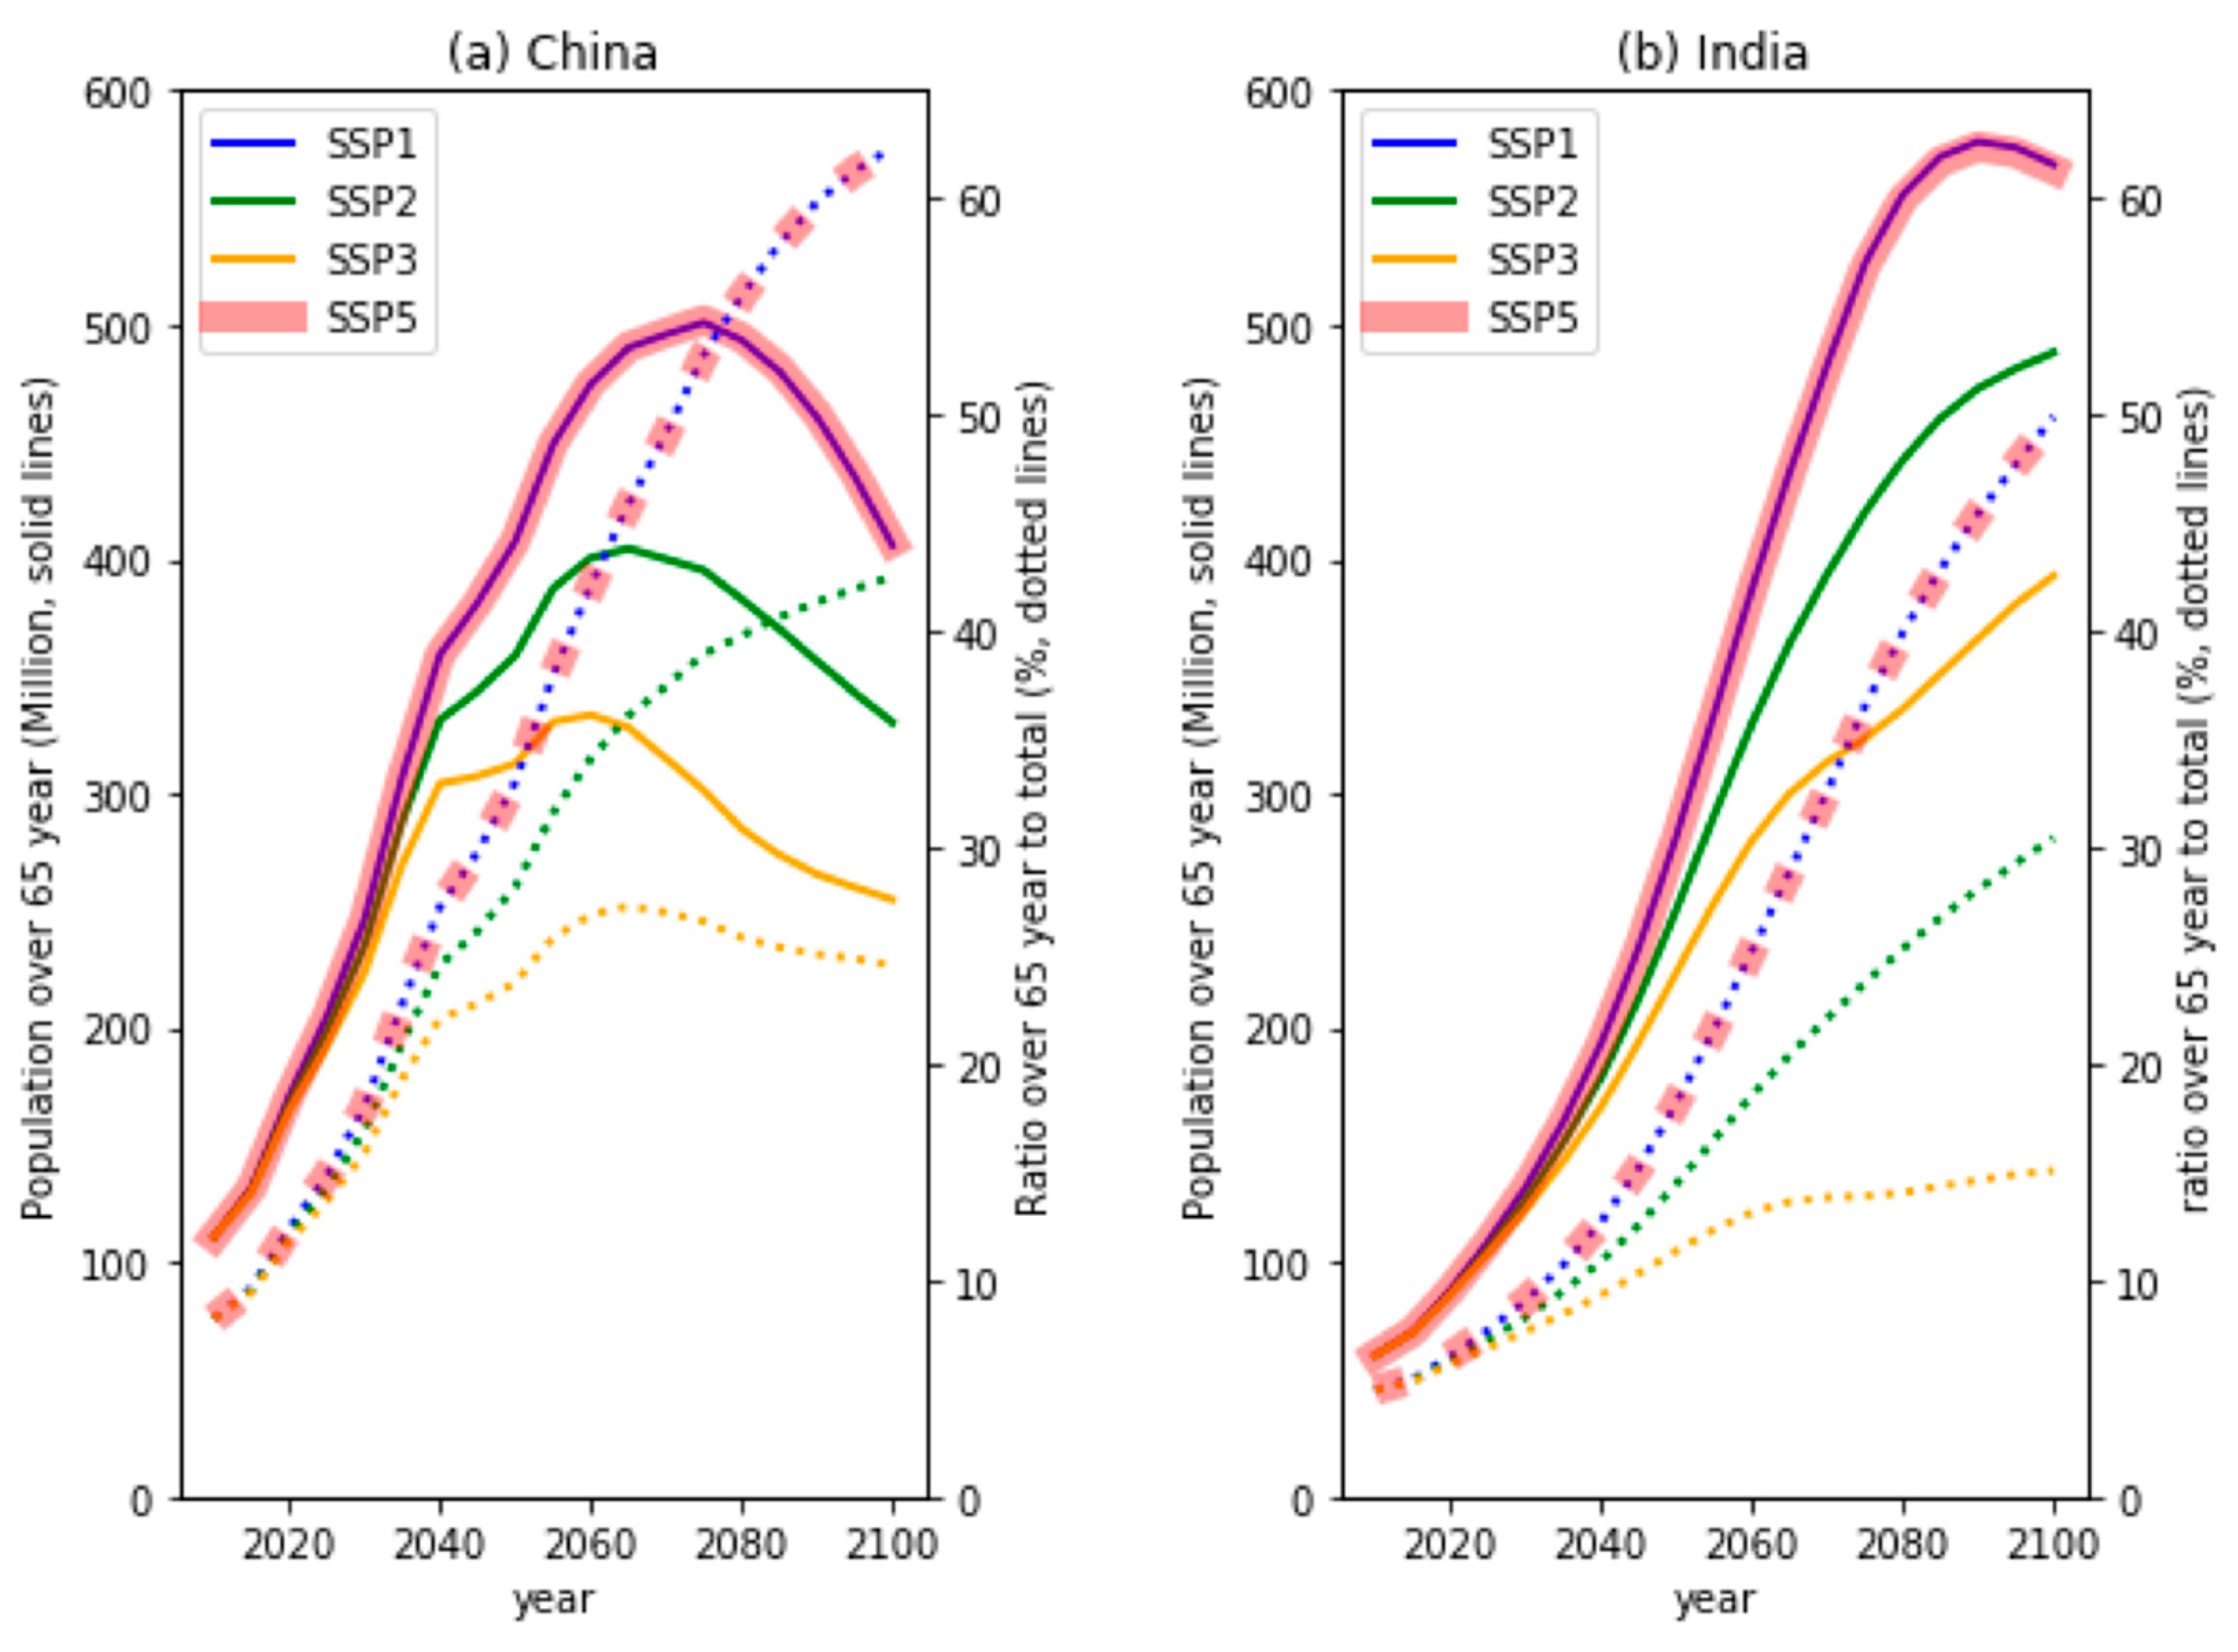
- O’Neill, B.C.; Kriegler, E.; Riahi, K.; Ebi, K.L.; Hallegatte, S.; Carter, T.R.; Mathur, R.; Vuuren, D.P. A new scenario framework for climate change research: The concept of shared socioeconomic pathways. Clim. Chang. 2014, 122, 387–400. [Google Scholar] [CrossRef] [Green Version]
- Dellink, R.; Chateau, J.; Lanzi, E.; Magne, B. Long-term economic growth projections in the Shared Socioeconomic Pathways. Glob. Environ. Chang. 2015, 42, 200–214. [Google Scholar] [CrossRef]
- KC, S.; Lutz, W. The human core of the shared socioeconomic pathways: Population scenarios by age, sex and level of education for all countries to 2100. Glob. Environ. Chang. 2017, 42, 181–192. [Google Scholar] [CrossRef] [Green Version]
- Gidden, M.J.; Riahi, K.; Smith, S.J.; Fujimori, S.; Luderer, G.; Kriegler, E.; Vuuren, D.P.; Berg, M.; Feng, L.; Klein, D.; et al. Global emissions pathways under different socioeconomic scenarios for use in CMIP6: A dataset of harmonized emissions trajectories through the end of the century. Geosci. Model Dev. 2019, 12, 1443–1475. [Google Scholar] [CrossRef] [Green Version]
- O’Neil, B.C.; Tebaldi, C.; Vuuren, D.P.; Eyring, V.; Friedlingstein, P.; Hurtt, G.; Knutti, R.; Kriegler, E.; Lamarque, J.-F.; Lowe, J.; et al. The Scenario Model Intercomparison Project (ScenarioMIP) for CMIP6. Geosci. Model Dev. 2016, 9, 3461–3482. [Google Scholar] [CrossRef] [Green Version]
- Reis, L.A.; Drouet, L.; Dingenen, R.V.; Emmerling, J. Future global air quality indices under different socio-economic and climate assumptions. Sustainability 2018, 10, 3645. [Google Scholar] [CrossRef] [Green Version]
- Rao, S.; Klimont, Z.; Smith, S.J.; Dingenen, R.V.; Dentener, F.; Bouwman, L.; Riahi, K.; Amann, M.; Bodirsky, B.L.; Vuuren, D.P.; et al. Future air pollution in the Shared Socio-economic Pathways. Glob. Environ. Chang. 2017, 42, 346–358. [Google Scholar] [CrossRef]
- Sellar, A.A.; Jones, C.G.; Mulcahy, J.; Tang, Y.; Yool, A.; Wiltshire, A.; O’Connor, F.M.; Stringer, M.; Hill, R.; Palmieri, J.; et al. UKESM1: Description and evaluation of the UK Earth System Model. J. Adv. Model. Earth Syst. 2019, 11, 4513–4558. [Google Scholar] [CrossRef] [Green Version]
- Dunne, J.P.; Horowitz, L.W.; Adcroft, A.J.; Ginoux, P.; Held, I.M.; John, J.G.; Krasting, J.P.; Malyshev, S.; Naik, V.; Paulot, F.; et al. The GFDL Earth System Model version 4.1 (GFDL-ESM4.1): Model description and simulation characteristics. J. Adv. Model. Earth Syst. 2020, 12, e2019MS002014. [Google Scholar] [CrossRef]
- Seland, O.; Bentsen, M.; Olivie, D.; Toniazzo, T.; Gjermundsen, A.; Graff, L.S.; Debernard, J.B.; Gupta, A.K.; He, Y.-C.; Kirkevag, A.; et al. Overview of the Norwegian Earth System Model (NorESM2) and key climate response of CMIP6 DECK, historical, and scenario simulations. Geosci. Model Dev. 2020, 13, 6165–6200. [Google Scholar] [CrossRef]
- Bauer, S.E.; Tsigaridis, K.; Faluvegi, G.; Kelly, M.; Lo, K.K.; Miller, R.L.; Nazarenko, L.; Schmidt, G.A.; Wu, J. Historical (1850–2014) aerosol evolution and role on climate forcing using the GISS ModelE2.1 contribution to CMIP6. J. Adv. Model. Earth Syst. 2020, 12, e2019MS001978. [Google Scholar] [CrossRef]
- Hajima, T.; Watanabe, M.; Yamamoto, A.; Tatebe, H.; Noguchi, M.A.; Abe, M.; Ohgaito, R.; Ito, A.; Yamazaki, D.; Okajima, H.; et al. Development of the MIROC-ES2L Earth system model and the evaluation of biogeochemical processes and feedbacks. Geosci. Model Dev. 2020, 13, 2197–2244. [Google Scholar] [CrossRef]
- Yukimoto, S.; Kawai, H.; Koshiro, T.; Oshima, N.; Yoshida, K.; Urakawa, S.; Tsujino, H.; Deushi, M.; Tanaka, T.; Hosaka, M.; et al. The meteorological research institute Earth system model version 2.0, MRI-ESM2.0: Description and basic evaluation of the physical component. J. Meteorol. Soc. Jpn. 2019, 97, 931–965. [Google Scholar] [CrossRef] [Green Version]
- Emmons, L.K.; Schwantes, R.H.; Orlando, J.J.; Tyndall, G.; Kinnison, D.; Lamarque, J.; Marsh, D.; Mills, M.J.; Tilmes, S.; Bardeen, C.; et al. The Chemistry Mechanism in the Community Earth System Model version 2 (CESM2). J. Adv. Model. Earth Syst. 2020, 12, 1–21. [Google Scholar] [CrossRef] [Green Version]
- Wu, T.; Zhang, F.; Zhang, J.; Jie, W.; Zhang, Y.; Wu, F.; Li, L.; Yan, J.; Liu, X.; Lu, X.; et al. Beijing Climate Center Earth System Model verison 1 (BCC-ESM1): Model description and evaluation of aerosol simulations. Geosci. Model Dev. 2020, 13, 977–1005. [Google Scholar] [CrossRef] [Green Version]
- Tegen, I.; Neubauer, D.; Ferrachat, S.; Drian, C.S.-L.; Bey, I.; Schutgens, N.; Stier, P.; Watson-Parris, D.; Stanelle, T.; Schmidt, H.; et al. The global aerosol-climate model ECHAM6.3-HAM2.3—Part 1: Aerosol evaluation. Geosci. Model Dev. 2019, 12, 1643–1677. [Google Scholar] [CrossRef] [Green Version]
- Iturbide, M.; Gutierrez, J.M.; Alves, L.M.; Bedia, J.; Climadevilla, E.; Cofino, A.S.; Cerezo-Mota, R.; Di Luca, A.; Faria, S.H.; Gorodetskaya, I.; et al. An update of IPCC climate reference regions for subcontinental analysis of climate model data: Definition and aggregated datasets. Earth Syst. Sci. Data Discuss. 2020. submitted for publication. [Google Scholar] [CrossRef]
- Van Donkelaar, A.; Martine, R.V.; Brauer, M.; Hsu, N.C.; Kahn, R.A.; Levy, R.C.; Lyapustin, A.; Sayer, A.M.; Winker, D.M. Global Estimates of Fine Particulate Matter Using a Combined Geophysical-Statistical Method with Information from Satellite. Environ. Sci. Technol. 2016, 50, 3762–3772. [Google Scholar] [CrossRef]
- Van Donkelaar, A.; Martine, R.V.; Brauer, M.; Hsu, N.C.; Kahn, R.A.; Levy, R.C.; Lyapustin, A.; Sayer, A.M.; Winker, D.M. Global Annual PM2.5 Grids from MODIS, MISR and SeaWiFS Aerosol Optical Depth (AOD) with GWR, 1998–2016; NASA Socioeconomic Data and Applications Center (SEDAC): Palisades, NY, USA, 2018. [Google Scholar] [CrossRef]
- Silva, R.A.; West, J.J.; Lamarque, J.F.; Shindell, D.T.; Collins, W.J.; Dalsoren, S.; Faluvegi, G.; Folberth, G.; Horowitz, L.W.; Nagashima, T.; et al. The effect of future ambient air pollution on human premature mortality to 2100 using ouput from the ACCMIP model ensemble. Atmos. Chem. Phys. 2016, 16, 9847–9862. [Google Scholar] [CrossRef] [Green Version]
- WHO (World Health Organization); Occupational and Environmental Health Team. WHO Air Quality Guidelines for Particulate Matter, Ozone, Nitrogen Dioxide and Sulfur Dioxide: Global Update 2005: Summary of Risk Assessment; World Health Organization: Geneva, Switzerland, 2006. [Google Scholar]
- Pope, C.A., III; Krewski, D.; Gapstur, S.M.; Turner, M.C.; Jerrett, M.; Burnett, R.T. Fine particulate air pollution and mortality: Response to Enstrom’s re-analysis of the American Cancer Society Cancer Prevention Study II cohort. Dose Response 2017, 15, 1–5. [Google Scholar] [CrossRef]
- Frieler, K.; Lange, S.; Piontek, F.; Reyer, C.P.O.; Schewe, J.; Warszawski, L.; Zhao, F.; Chini, L.; Denvil, S.; Emanuel, K.; et al. Assessing the impacts of 1.5 °C global warming—simulation protocol of the Inter-Sectoral Impact Model Intercomparison Project (ISIMIP2b). Geosci. Model Dev. 2017, 10, 4321–4345. [Google Scholar] [CrossRef] [Green Version]
- Mitchell, J.F.B.; Johns, T.C.; Gregory, J.M.; Tett, S.F.B. Climate response to increasing levels of greenhouse gases and sulphate aerosols. Nature 1995, 376, 501–504. [Google Scholar] [CrossRef]
- Menon, S.; Hansen, J.; Nazarenko, L.; Luo, Y. Climate effects of black carbon aerosols in China and India. Science 2002, 297, 2250–2253. [Google Scholar] [CrossRef] [PubMed] [Green Version]
- Zheng, Y.; Zhang, Q.; Tong, D.; David, S.J.; Caldeira, K. Climate effects of China’s efforts to improve its air quality. Environ. Res. Lett. 2020, 15, 104052. [Google Scholar] [CrossRef]


| SSP Scenarios | Emission Factors |
|---|---|
| SSP1 and SSP5 | Strong decrease (fastest and widest implementation of air pollution controls) |
| SSP2 | Medium decrease (significant advancement in pollution control, yet less than in SSP1 and SSP5) |
| SSP3 and SSP4 | Weak decrease (slowest deployment of air pollution controls) |
| Model Name | Historical | SSP1–2.6 | SSP2–4.5 | SSP3–7.0 | SSP3–7.0-lowNTCF | SSP5–8.5 |
|---|---|---|---|---|---|---|
| UKESM1-0-LL [44] | ○ | ○ | ○ | ○ | ○ | ○ |
| GFDL-ESM4 [45] | ○ | ○ | ○ | ○ | ○ | ○ |
| NorESM2-LM [46] | ○ | ○ | ○ | ○ | ○ | ○ |
| GISS-E2-1-G [47] | ○ | ○ | ○ | ○ | ○ | ○ |
| MIROC-ES2L [48] | ○ | ○ | ○ | ○ | * | ○ |
| MRI-ESM2-0 [49] | ○ | ○ | * | |||
| CESM2-WACCM [50] | ○ | ○ | ○ | |||
| BCC-ESM1 [51] | ○ | |||||
| MPI-ESM1.2-HAM [52] | ○ | |||||
| Total number of models | 9 | 5 | 5 | 7 | 7 | 5 |
| Experiment | Information |
|---|---|
| Historical (1850–2014) | The historical simulations use forcing due to both the natural causes and human factors over the period 1850 to 2014. These simulations were used to evaluate model performance. |
| SSP1-2.6 (2015–2100) | This scenario represents the low end of the range of plausible future pathways, and depicts the best-case future scenario from a sustainability perspective. |
| SSP2-4.5 (2015–2100) | This scenario represents the medium part of the range of plausible future pathways. |
| SSP3-7.0 (2015–2100) | This scenario represents the medium to high end of plausible future pathways. |
| SSP3-7.0-lowNTCF (2015–2055) | This scenario represents the SSP3-7.0 scenario with the reduced near-term climate forcer (NTCF) emissions, including aerosols. |
| SSP5-8.5 (2015–2100) | This scenario represents the high end of plausible future pathways. SSP5 is the only SSP scenario with emissions high enough to produce the 8.5 Wm−2 level of forcing in the year 2100. |
| Index | PM2.5 (µg/m3) | Basis for the Selected Level [57] | |
|---|---|---|---|
| 5 | Significantly over target (ST) | 53– | Defined as a concentration that exceeds 150% of the interim target-1 level. |
| 4 | Over target (OT) | 35–53 | Defined as a concentration higher than the interim target and less than 150% of the interim target-1 level. |
| 3 | Interim target 1 (IT-1) | 25–35 | Approximately 15% higher long-term mortality risk relative to the air-quality guideline level. |
| 2 | Interim target 2 (IT-2) | 15–25 | These levels lower the risk of premature mortality by approximately 6% relative to the IT-1 level. |
| 1 | Interim target 3 (IT-3) | 10–15 | These levels reduce the mortality risk by approximately 6% relative to the IT-2 level. |
| 0 | Air-Quality Guideline (AQG) | 0–10 | Lower end of the range of significant effects on survival in response to long-term exposure to PM2.5. [58] |
Publisher’s Note: MDPI stays neutral with regard to jurisdictional claims in published maps and institutional affiliations. |
© 2021 by the authors. Licensee MDPI, Basel, Switzerland. This article is an open access article distributed under the terms and conditions of the Creative Commons Attribution (CC BY) license (https://creativecommons.org/licenses/by/4.0/).
Share and Cite
Shim, S.; Sung, H.; Kwon, S.; Kim, J.; Lee, J.; Sun, M.; Song, J.; Ha, J.; Byun, Y.; Kim, Y.; et al. Regional Features of Long-Term Exposure to PM2.5 Air Quality over Asia under SSP Scenarios Based on CMIP6 Models. Int. J. Environ. Res. Public Health 2021, 18, 6817. https://doi.org/10.3390/ijerph18136817
Shim S, Sung H, Kwon S, Kim J, Lee J, Sun M, Song J, Ha J, Byun Y, Kim Y, et al. Regional Features of Long-Term Exposure to PM2.5 Air Quality over Asia under SSP Scenarios Based on CMIP6 Models. International Journal of Environmental Research and Public Health. 2021; 18(13):6817. https://doi.org/10.3390/ijerph18136817
Chicago/Turabian StyleShim, Sungbo, Hyunmin Sung, Sanghoon Kwon, Jisun Kim, Jaehee Lee, Minah Sun, Jaeyoung Song, Jongchul Ha, Younghwa Byun, Yeonhee Kim, and et al. 2021. "Regional Features of Long-Term Exposure to PM2.5 Air Quality over Asia under SSP Scenarios Based on CMIP6 Models" International Journal of Environmental Research and Public Health 18, no. 13: 6817. https://doi.org/10.3390/ijerph18136817