Evaluation of Bed Depth Reduction, Media Change, and Partial Saturation as Combined Strategies to Modify in Vertical Treatment Wetlands

 , ,
, ,  ,
,
Abstract
:1. Introduction
2. Materials and Methods
2.1. Influent
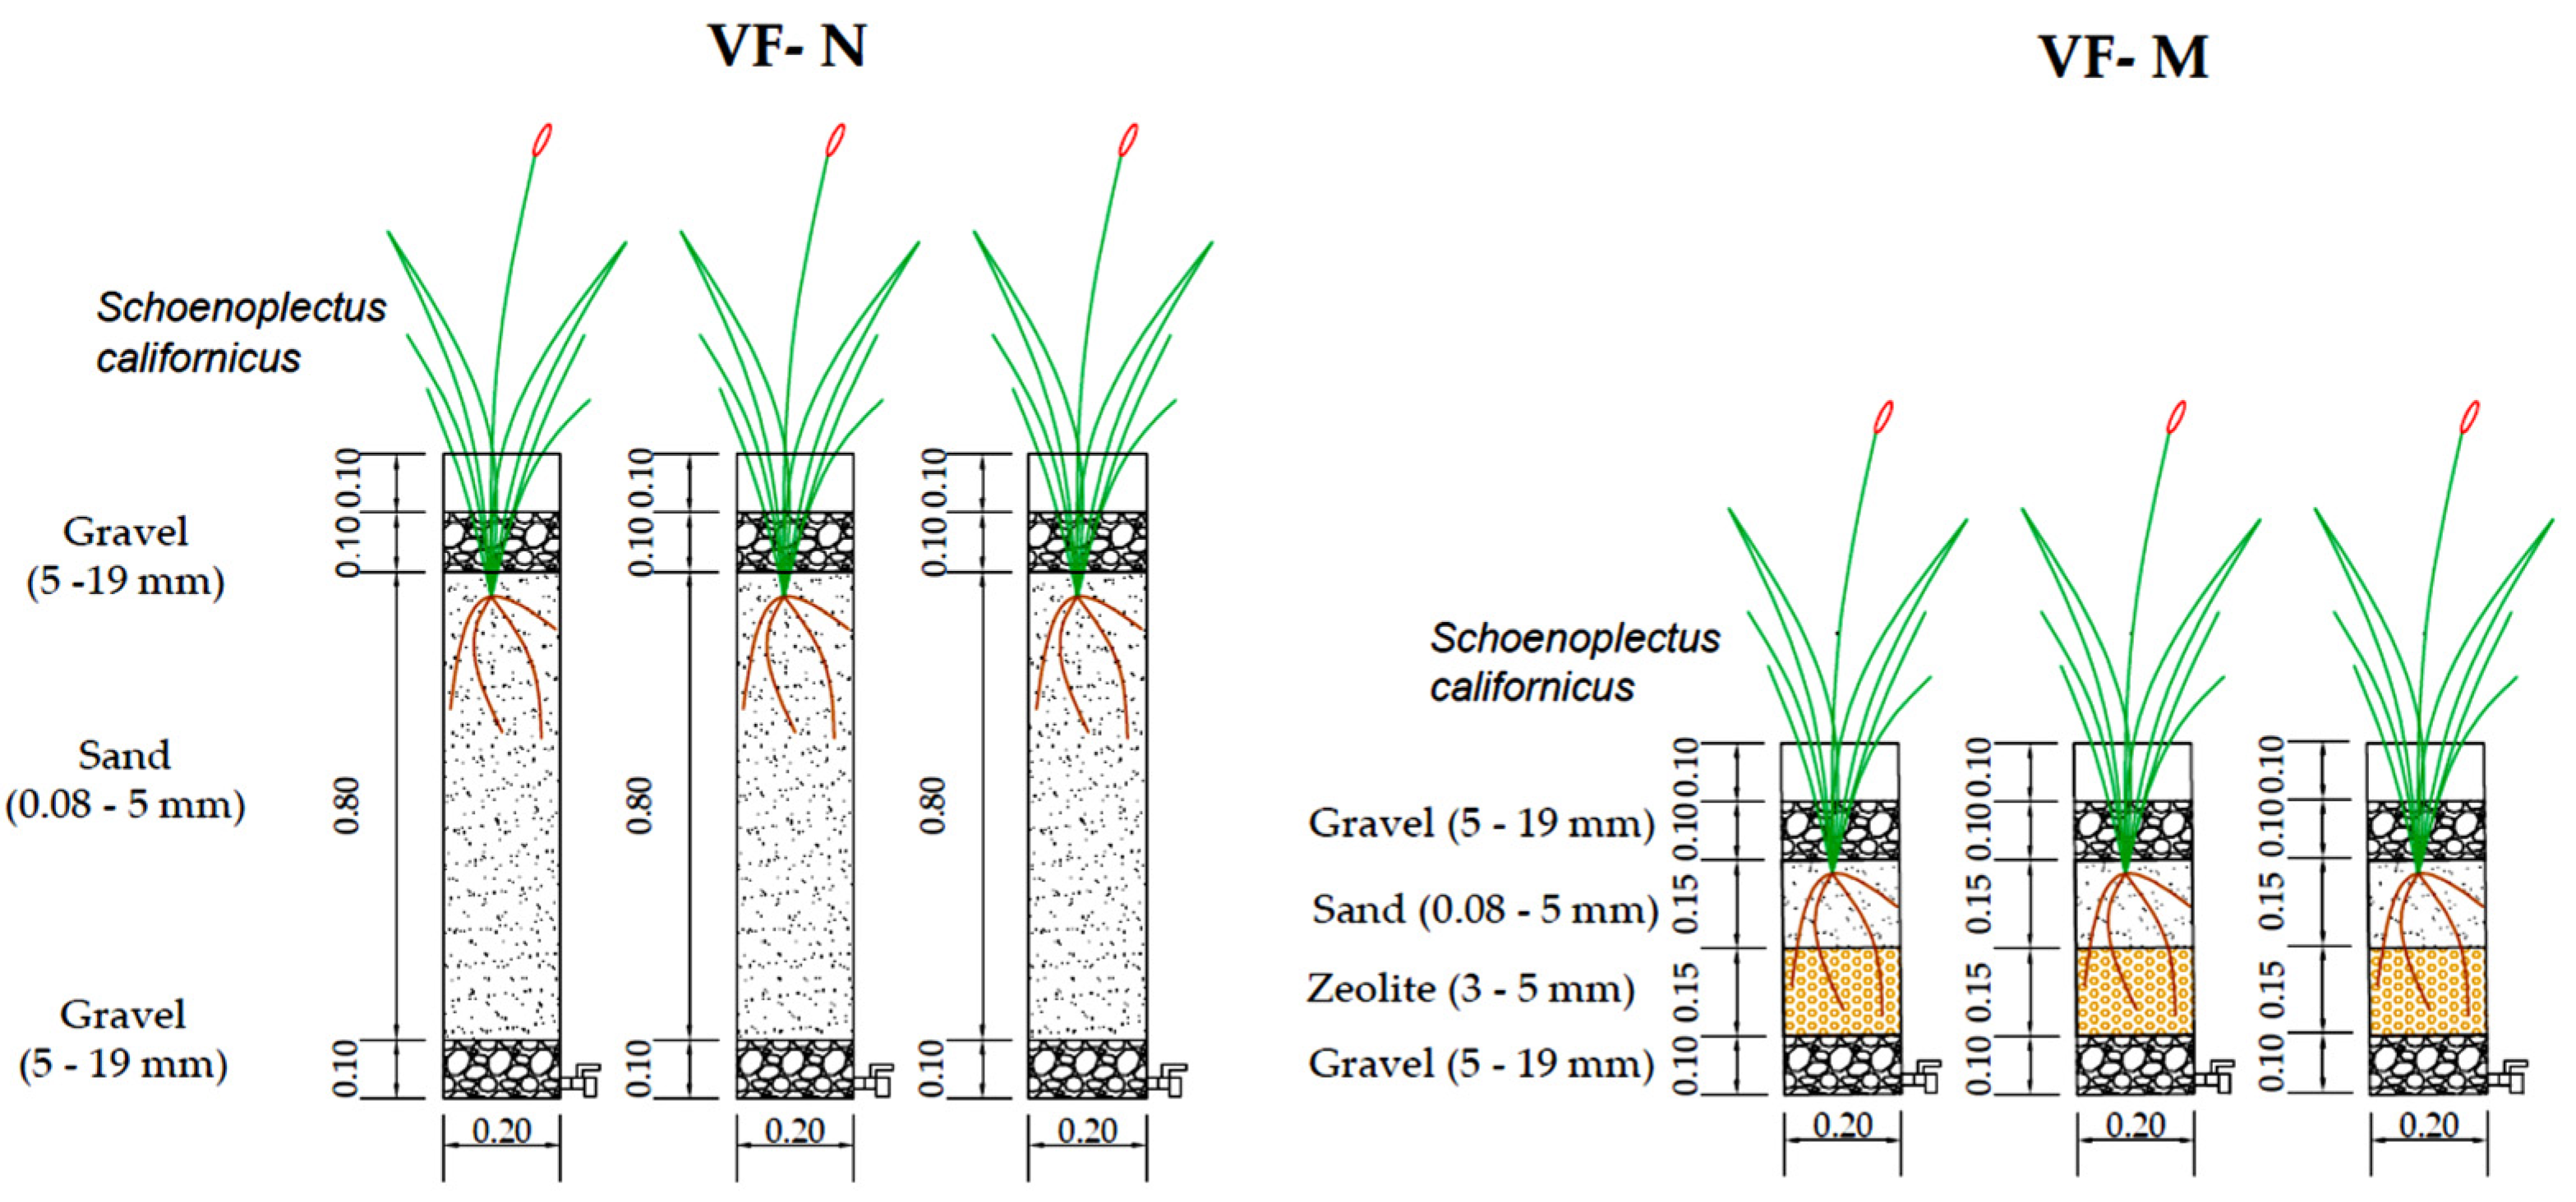
2.2. Experimental Setup
2.3. Operational and Monitoring Strategy
2.4. Analytical Methods
2.5. Statistical Analysis
3. Results and Discussion
3.1. Operational Conditions by Treatment System and Phase
3.2. Removal Efficiencies by Treatment System and Phase
3.2.1. Organic Matter, Solids, Phosphorus, and Nitrogen Removal
3.2.2. Pathogens Removal
3.3. Effect of VSSF TWs Modifications in Plants Development
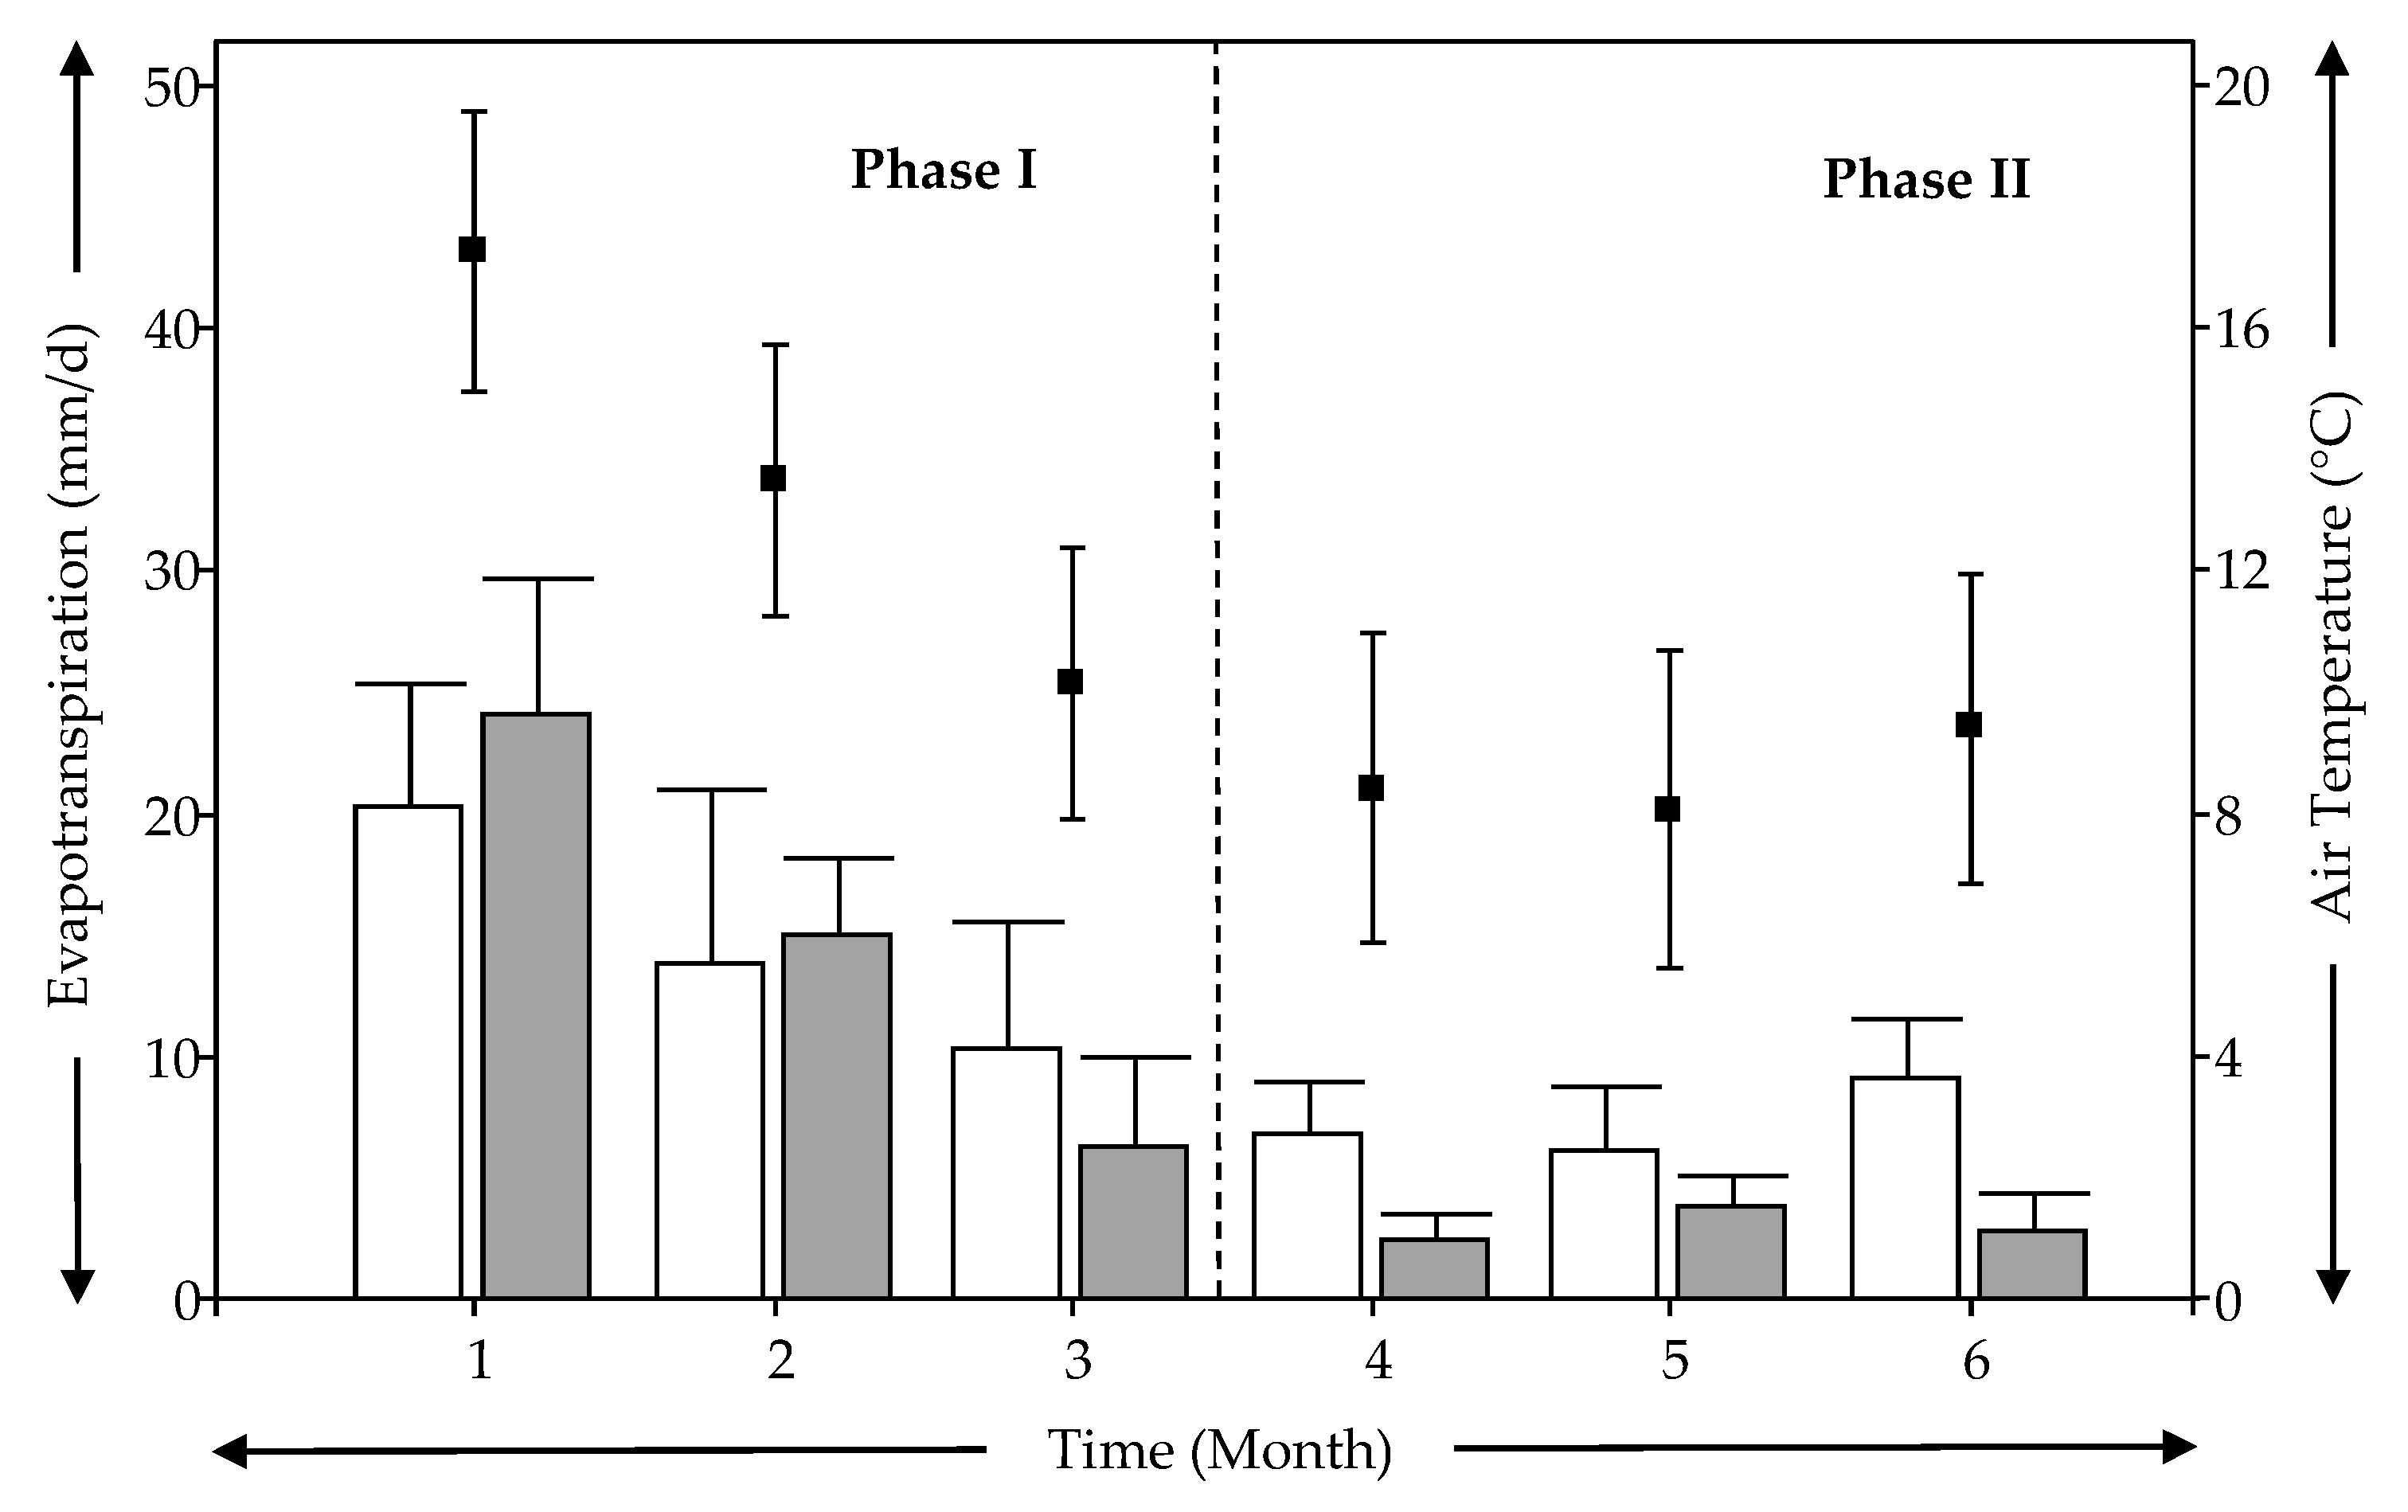
3.4. Behavior of Evapotranspiration and Water Loss in the Treatment Systems
4. Conclusions
Author Contributions
Funding
Institutional Review Board Statement
Informed Consent Statement
Acknowledgments
Conflicts of Interest
References
- Stefanakis, A.; Akratos, C.; Tsihrintzis, V. Vertical Flow Constructed Wetlands: Eco-Engineering Systems for Wastewater and Sludge Treatment, 1st ed.; Elsevier Publishing: Amsterdam, The Netherlands, 2014; 378p. [Google Scholar] [CrossRef]
- Lana, L.; Moraes, D.; Von Sperling, M.; Morato, M.; Vasconcellos, G.; Paraense, M.; Moreira, T. Performance of a Single Stage Vertical Flow Constructed Wetland System Treating Raw Domestic Sewage in Brazil. Water Sci. Technol. 2013, 68, 1599–1606. [Google Scholar] [CrossRef] [PubMed]
- Pandey, M.; Jenssen, P.; Krogstad, T.; Jonasson, S. Comparison of Vertical and Horizontal Flow Planted and Unplanted Subsurface Flow Wetlands Treating Municipal Wastewater. Water Sci. Technol. 2013, 68, 117–123. [Google Scholar] [CrossRef] [PubMed]
- Araya, F.; Vera, I.; Sáez, K.; Vidal, G. Effects of Aeration and Natural Zeolite on Ammonium Removal during the Treatment of Sewage by Mesocosm-Scale Constructed Wetlands. Environ. Technol. 2016, 37, 1811–1820. [Google Scholar] [CrossRef] [PubMed]
- Kleimeier, C.; Liu, H.; Rezanezhad, F.; Lennartz, B. Nitrate attenuation in degraded Peat Soil-Based Constructed Wetlands. Water 2018, 10, 355. [Google Scholar] [CrossRef] [Green Version]
- Wu, S.; Kuschk, P.; Brix, H.; Vymazal, J.; Dong, R. Development of constructed wetlands in performance intensifications for wastewater treatment: A nitrogen and organic matter targeted review. Water Res. 2014, 57, 40–55. [Google Scholar] [CrossRef]
- Saeed, T.; Sun, G. A review on nitrogen and organics removal mechanisms in subsurface flow constructed wetlands: Dependency on environmental parameters, operating conditions and supporting media. J. Environ. Manag. 2012, 112, 429–448. [Google Scholar] [CrossRef]
- Henze, M.; Harremoes, P.; Jansen, J.; Arvin, E. Wastewater Treatment: Biological and Chemical Processes, 3rd ed.; Environmental Science and Engineering/Environmental Engineering Series; Springer: Berlin/Heidelberg, Germany, 2002; ISBN 9783642075902. [Google Scholar]
- Brix, H.; Arias, C. The use of vertical flow constructed wetlands for on-site treatment of domestic wastewater: New Danish guidelines. Ecol. Eng. 2005, 25, 491–500. [Google Scholar] [CrossRef]
- Silveira, D.; Belli Filho, P.; Philippi, L.; Kim, B.; Molle, P. Influence of partial saturation on total nitrogen removal in a single-stage French constructed wetland treating raw domestic wastewater. Ecol. Eng. 2015, 77, 257–264. [Google Scholar] [CrossRef]
- Zurita, F.; Rojas, D.; Carreón-Álvarez, A.; Gutiérrez-Lomelí, M. Wastewater disinfection in three hybrid constructed wetlands. Interciencia 2015, 40, 409–415. [Google Scholar]
- Sánchez, M.; Sulbarán-Rangel, B.; Tejeda, A.; Zurita, F. Evaluation of three lignocellulosic wastes as a source of biodegradable carbon for denitrification in treatment wetlands. Int. J. Environ. Sci. Technol. 2020, 17, 4679–4692. [Google Scholar] [CrossRef]
- Jong, V.; Tang, F. Organic matter and nitrogen removal at planted wetlands treating domestic septage with varying operational strategies. Water Sci. Technol. 2014, 70, 352–360. [Google Scholar] [CrossRef] [PubMed]
- Vera, I.; Araya, F.; Andrés, E.; Sáez, K.; Vidal, G. Enhanced phosphorus removal from sewage in mesocosm-scale constructed wetland using zeolite as medium and artificial aeration. Environ. Technol. 2014, 35, 1639–1649. [Google Scholar] [CrossRef]
- Weedon, C.; Murphy, C.; Sweaney, G. Establishing a design for passive vertical flow constructed wetlands treating small sewage discharges to meet British Standard EN 12566. Environ. Technol. 2017, 38, 220–229. [Google Scholar] [CrossRef]
- Cucarella, V.; Renman, G. Phosphorus Sorption Capacity of Filter Materials Used for On-Site Wastewater Treatment Determined in Batch Experiments—A Comparative Study. J. Environ. Qual. 2009, 38, 381–392. [Google Scholar] [CrossRef] [PubMed]
- Vohla, C.; Kõiv, M.; Bavor, H.; Chazarenc, F.; Mander, Ü. Filter Materials for Phosphorus Removal from Wastewater in Treatment Wetlands—A Review. Ecol. Eng. 2011, 37, 70–89. [Google Scholar] [CrossRef]
- Widiastuti, N.; Wu, H.; Ang, M.; Zhang, D. The Potential Application of Natural Zeolite for Greywater Treatment. Desalination 2008, 218, 271–280. [Google Scholar] [CrossRef]
- Wang, S.; Peng, Y. Natural Zeolites as Effective Adsorbents in Water and Wastewater Treatment. Chem. Eng. J. 2010, 156, 11–24. [Google Scholar] [CrossRef]
- Drizo, A.; Frost, C.; Grace, J.; Smith, K. Physico-Chemical Screening of Phosphate-Removing Substrates for Use in Constructed Wetland Systems. Water Res. 1999, 33, 3595–3602. [Google Scholar] [CrossRef]
- Vera-Puerto, I.; Saravia, M.; Olave, J.; Arias, C.; Alarcon, E.; Valdes, H. Potential Application of Chilean Natural Zeolite as a Support Medium in Treatment Wetlands for Removing Ammonium and Phosphate from Wastewater. Water 2020, 12, 1156. [Google Scholar] [CrossRef] [Green Version]
- Headley, T.; Nivala, J.; Kassa, K.; Olsson, L.; Wallace, S.; Brix, H.; van Afferden, M.; Müller, R. Escherichia coli removal and internal dynamics in subsurface flow ecotechnologies: Effects of design and plants. Ecol. Eng. 2013, 61, 564–574. [Google Scholar] [CrossRef]
- Odinga, C.; Swalaha, F.; Otieno, F.; Ranjith, K.; Bux, F. Investigating the efficiency of constructed wetlands in the removal of heavy metals and enteric pathogens from wastewater. Environ. Technol. Rev. 2013, 2, 1–16. [Google Scholar] [CrossRef]
- Taniguchi, T.; Nakano, K.; Chiba, N.; Nomura, M.; Nishimura, O. Evaluation of extremely shallow vertical subsurface flow constructed wetland for nutrient removal. Water Sci. Technol. 2009, 59, 295–301. [Google Scholar] [CrossRef] [PubMed]
- Vera, I.; Jorquera, C.; López, D.; Vidal, G. Humedales construidos para tratamiento y reúso de aguas servidas en Chile: Reflexiones. Tecnol. Cienc. Agua 2016, 7, 19–35. [Google Scholar]
- Villarroel, C. Asociaciones Comunitarias de Agua Potable Rural en Chile: Diagnóstico y Desafíos; FENAPRU: Santiago, Chile, 2012; 24 p. [Google Scholar]
- Olsson, L. Effect of Design and Dosing Regime on the Treatment Performance of Vertical Flow Constructed Wetlands. Master’s Thesis, Linköping University, Linköping, Sweden, 17 July 2011. Available online: http://urn.kb.se/resolve?urn=urn:nbn:se:liu:diva-69689 (accessed on 31 July 2020).
- Meteorological Office of Chile (MeteoChile). Climatic Services–Data of Weather Stations. Available online: http://www.meteochile.cl/PortalDMC-web/index.xhtml (accessed on 31 July 2020).
- American Public Health Association (APHA); American Water Works Association (AWWA); Water Environment Federation (WEF). Standard methods for the examination of water and wastewater. In American Public Health Association, 23rd ed.; APHA/AWWA/WEF: Washington, DC, USA, 2005; ISBN 9780875532875. [Google Scholar]
- Dichter, G. IDEXX Colilert*-18 and Quanti-Tray* Test Method for the Detection of Fecal Coliforms in Wastewater; IDEXX Summary; IDEXX Laboratories, Inc.: Westbrook, ME, USA, 2011. [Google Scholar]
- Vera, I.; Verdejo, N.; Chávez, W.; Jorquera, C.; Olave, J. Influence of hydraulic retention time and plant species on performance of mesocosm subsurface constructed wetlands during municipal wastewater treatment in super-arid areas. J. Environ. Sci. Heal. Part A 2016, 51, 105–113. [Google Scholar] [CrossRef]
- Shibaeva, T.; Mamaev, A.; Sherudilo, E. Evaluation of a SPAD-502 Plus Chlorophyll Meter to Estimate Chlorophyll Content in Leaves with Interveinal Chlorosis. Russ. J. Plant Physiol. 2020, 67, 690–696. [Google Scholar] [CrossRef]
- Süß, A.; Danner, M.; Obster, C.; Locherer, M.; Hank, T.; Richter, K. Measuring Leaf Chlorophyll Content with the Konica Minolta SPAD-502Plus–Theory, Measurement, Problems, Interpretation. In EnMAP Field Guides Technical Report; GFZ Data Services: Potsdam, Germany, 2015. [Google Scholar] [CrossRef]
- Sadzawka, A.; Carrasco, M.; Demanet, R.; Flores, H.; Grez, R.; Mora, M.; Neaman, A. Métodos de análisis de tejidos vegetales. Ser. Actas INIA 2007, 40, 140. [Google Scholar]
- Di Rienzo, J.; Casanoves, F.; Balzarini, M.; Gonzalez, L.; Tablada, M.; Robledo, C. InfoStat [Programa de Cómputo]; Universidad Nacional de Córdoba: Córdoba, Argentina, 2017. [Google Scholar]
- Perdana, M.; Sutanto, H.; Prihatmo, G. Vertical Subsurface Flow (VSSF) constructed wetland for domestic wastewater treatment. IOP Conf. Ser. Earth Environ. Sci. 2018, 148, 1–9. [Google Scholar] [CrossRef]
- Burgos, V.; Araya, F.; Reyes-Contreras, C.; Vera, I.; Vidal, G. Performance of ornamental plants in mesocosm subsurface constructed wetlands under different organic sewage loading. Ecol. Eng. 2017, 99, 246–255. [Google Scholar] [CrossRef]
- Andrés, E.; Araya, F.; Vera, I.; Pozo, G.; Vidal, G. Phosphate removal using zeolite in treatment wetlands under different oxidation-reduction potentials. Ecol. Eng. 2018, 117, 18–27. [Google Scholar] [CrossRef]
- Heyda, M. A Practical Guide to Conductivity Measurement. MBH Engineering Systems 2006, 107. Available online: http://www.mbhes.com/conductivity_measurement.htm (accessed on 25 September 2020).
- Tsihrintzis, V. The use of Vertical Flow Constructed Wetlands in Wastewater Treatment. Water Resour. Manag. 2017, 31, 3245–3270. [Google Scholar] [CrossRef]
- Wang, Y.; Yang, J.; Xu, H.; Liu, C.; Shen, Z.; Hu, K. Preparation of Ceramsite Based on Waterworks Sludge and Its Application as Matrix in Constructed Wetlands. Int. J. Environ. Res. Public Health 2019, 16, 2637. [Google Scholar] [CrossRef] [Green Version]
- Vymazal, J. Removal of nutrients in various types of constructed wetlands. Sci. Total Environ. 2007, 380, 48–65. [Google Scholar] [CrossRef] [PubMed]
- Rojas, K.; Vera, I.; Vidal, G. Influencia de la estación y de las especies Phragmites australis y Schoenoplectus californicus en la eliminación de materia orgánica y nutrientes contenidos en aguas servidas durante la operación de puesta en marcha de humedales construidos de flujo horiz. Rev. Fac. Ing. Univ. Antioq. 2013, 69, 289–299. [Google Scholar]
- Bohórquez, E.; Paredes, D.; Arias, C. Vertical flow-constructed wetlands for domestic wastewater treatment under tropical conditions: Effect of different design and operational parameters. Environ. Technol. 2017, 38, 199–208. [Google Scholar] [CrossRef]
- Decezaro, S.; Wolff, D.; Pelissari, C.; Ramírez, R.; Formentini, T.; Goerck, J.; Rodrigues, L.; Sezerino, P. Influence of hydraulic loading rate and recirculation on oxygen transfer in a vertical flow constructed wetland. Sci. Total Environ. 2019, 668, 988–995. [Google Scholar] [CrossRef]
- Millot, Y.; Troesch, S.; Esser, D.; Molle, P.; Morvannou, A.; Gourdon, R.; Rousseau, D. Effects of design and operational parameters on ammonium removal by single-stage French vertical flow filters treating raw domestic wastewater. Ecol. Eng. 2016, 97, 516–523. [Google Scholar] [CrossRef] [Green Version]
- Arias, C.; Kilian, R.; Brix, H. Test og Udvikling af Beplantede Filteranlæg Som Miljøeffektiv Renseteknologi i det Åbne Land; Miljøministeriet, Naturstyrelsen: Aarhus, Denmark, 2013; Volume 1, pp. 1–83. [Google Scholar]
- Oliveira, M.; Pelissari, C.; Rousso, B.; Sezerino, P. Influence of bottom saturation level of the bed media in vertical flow constructed wetlands applied to wastewater treatment. Rev. AIDIS Ing. Cienc. Ambient. Investig. Desarro. Práct. 2016, 9, 303–316. [Google Scholar] [CrossRef]
- Pelissari, C.; Ávila, C.; Trein, C.; García, J.; de Armas, R.; Sezerino, P. Nitrogen transforming bacteria within a full-scale partially saturated vertical subsurface flow constructed wetland treating urban wastewater. Sci. Total Environ. 2017, 574, 390–399. [Google Scholar] [CrossRef] [Green Version]
- Arias, C.; Cabello, A.; Brix, H.; Johansen, N. Removal of indicator bacteria from municipal wastewater in an experimental two-stage vertical flow constructed wetland system. Water Sci. Technol. 2003, 48, 35–41. [Google Scholar] [CrossRef] [PubMed]
- Lavrnić, S.; Zapater-Pereyra, M.; Mancini, M. Water Scarcity and Wastewater Reuse Standards in Southern Europe: Focus on Agriculture. Water Air Soil Pollut. 2017, 228, 2–12. [Google Scholar] [CrossRef]
- Wu, H.; Zhang, J.; Hao, H.; Guo, W.; Hu, Z.; Liang, S.; Fan, J. A review on the sustainability of constructed wetlands for wastewater treatment: Design and operation. Bioresour. Technol. 2015, 175, 594–601. [Google Scholar] [CrossRef]
- Wang, H.; Xu, J.; Sheng, L. Purification mechanism of sewage from constructed wetlands with zeolite substrates: A review. J. Clean. Prod. 2020, 258, 120760. [Google Scholar] [CrossRef]
- Torrens, A.; Molle, P.; Boutin, C.; Salgot, M. Removal of bacterial and viral indicator in vertical flow constructed wetlands and intermittent sand filters. Desalination 2009, 246, 169–178. [Google Scholar] [CrossRef]
- Ezzat, S.; Moustafa, M. Treating wastewater under zero waste principle using wetland mesocosms. Front. Environ. Sci. Eng. 2021, 15, 59. [Google Scholar] [CrossRef]
- Hidalgo-Cordero, J.F.; García-Navarro, J. Totora (Schoenoplectus californicus (C.A. Mey.) Soják) and its potential as a construction material. Ind. Crops Prod. 2018, 112, 467–480. [Google Scholar] [CrossRef]
- Alarcón, M.; Zurita, F.; Lara-Borrero, J.; Vidal, G. Humedales de Tratamiento: Alternativa de Saneamiento de Aguas Residuales Aplicable en América Latina; Pontificia Universidad Javeriana: Bogotá, Columbia, 2018. [Google Scholar] [CrossRef]
- Adhikari, A.; Acharya, K.; Shanahan, S.; Zhou, X. Removal of nutrients and metals by constructed and naturally created wetlands in the Las Vegas Valley, Nevada. Environ. Monit. Assess. 2011, 180, 97–113. [Google Scholar] [CrossRef]
- López, D.; Sepúlveda, M.; Vidal, G. Phragmites australis and Schoenoplectus californicus in constructed wetlands: Development and nutrient uptake. J. Soil Sci. Plant Nutr. 2016, 16, 763–777. [Google Scholar] [CrossRef] [Green Version]
- Pedescoll, A.; Sidrach-Cardona, R.; Sánchez, J.C.; Bécares, E. Evapotranspiration affecting redox conditions in horizontal constructed wetlands under Mediterranean climate: Influence of plant species. Ecol. Eng. 2013, 58, 335–343. [Google Scholar] [CrossRef]
- Filho, F.; Sobrinho, T.; Steffen, J.; Arias, C.; Paulo, P. Hydraulic and hydrological aspects of an evapotranspiration-constructed wetland combined system for household greywater treatment. J. Environ. Sci. Health Part A 2018, 53, 493–500. [Google Scholar] [CrossRef]

 ), Phase II (
  ); VF –Modified: Phase I (
  ), Phase II (
  ).
), Phase II ( ); VF –Modified: Phase I ( ), Phase II ( ).
).
), Phase II ( ); VF –Modified: Phase I ( ), Phase II ( ).
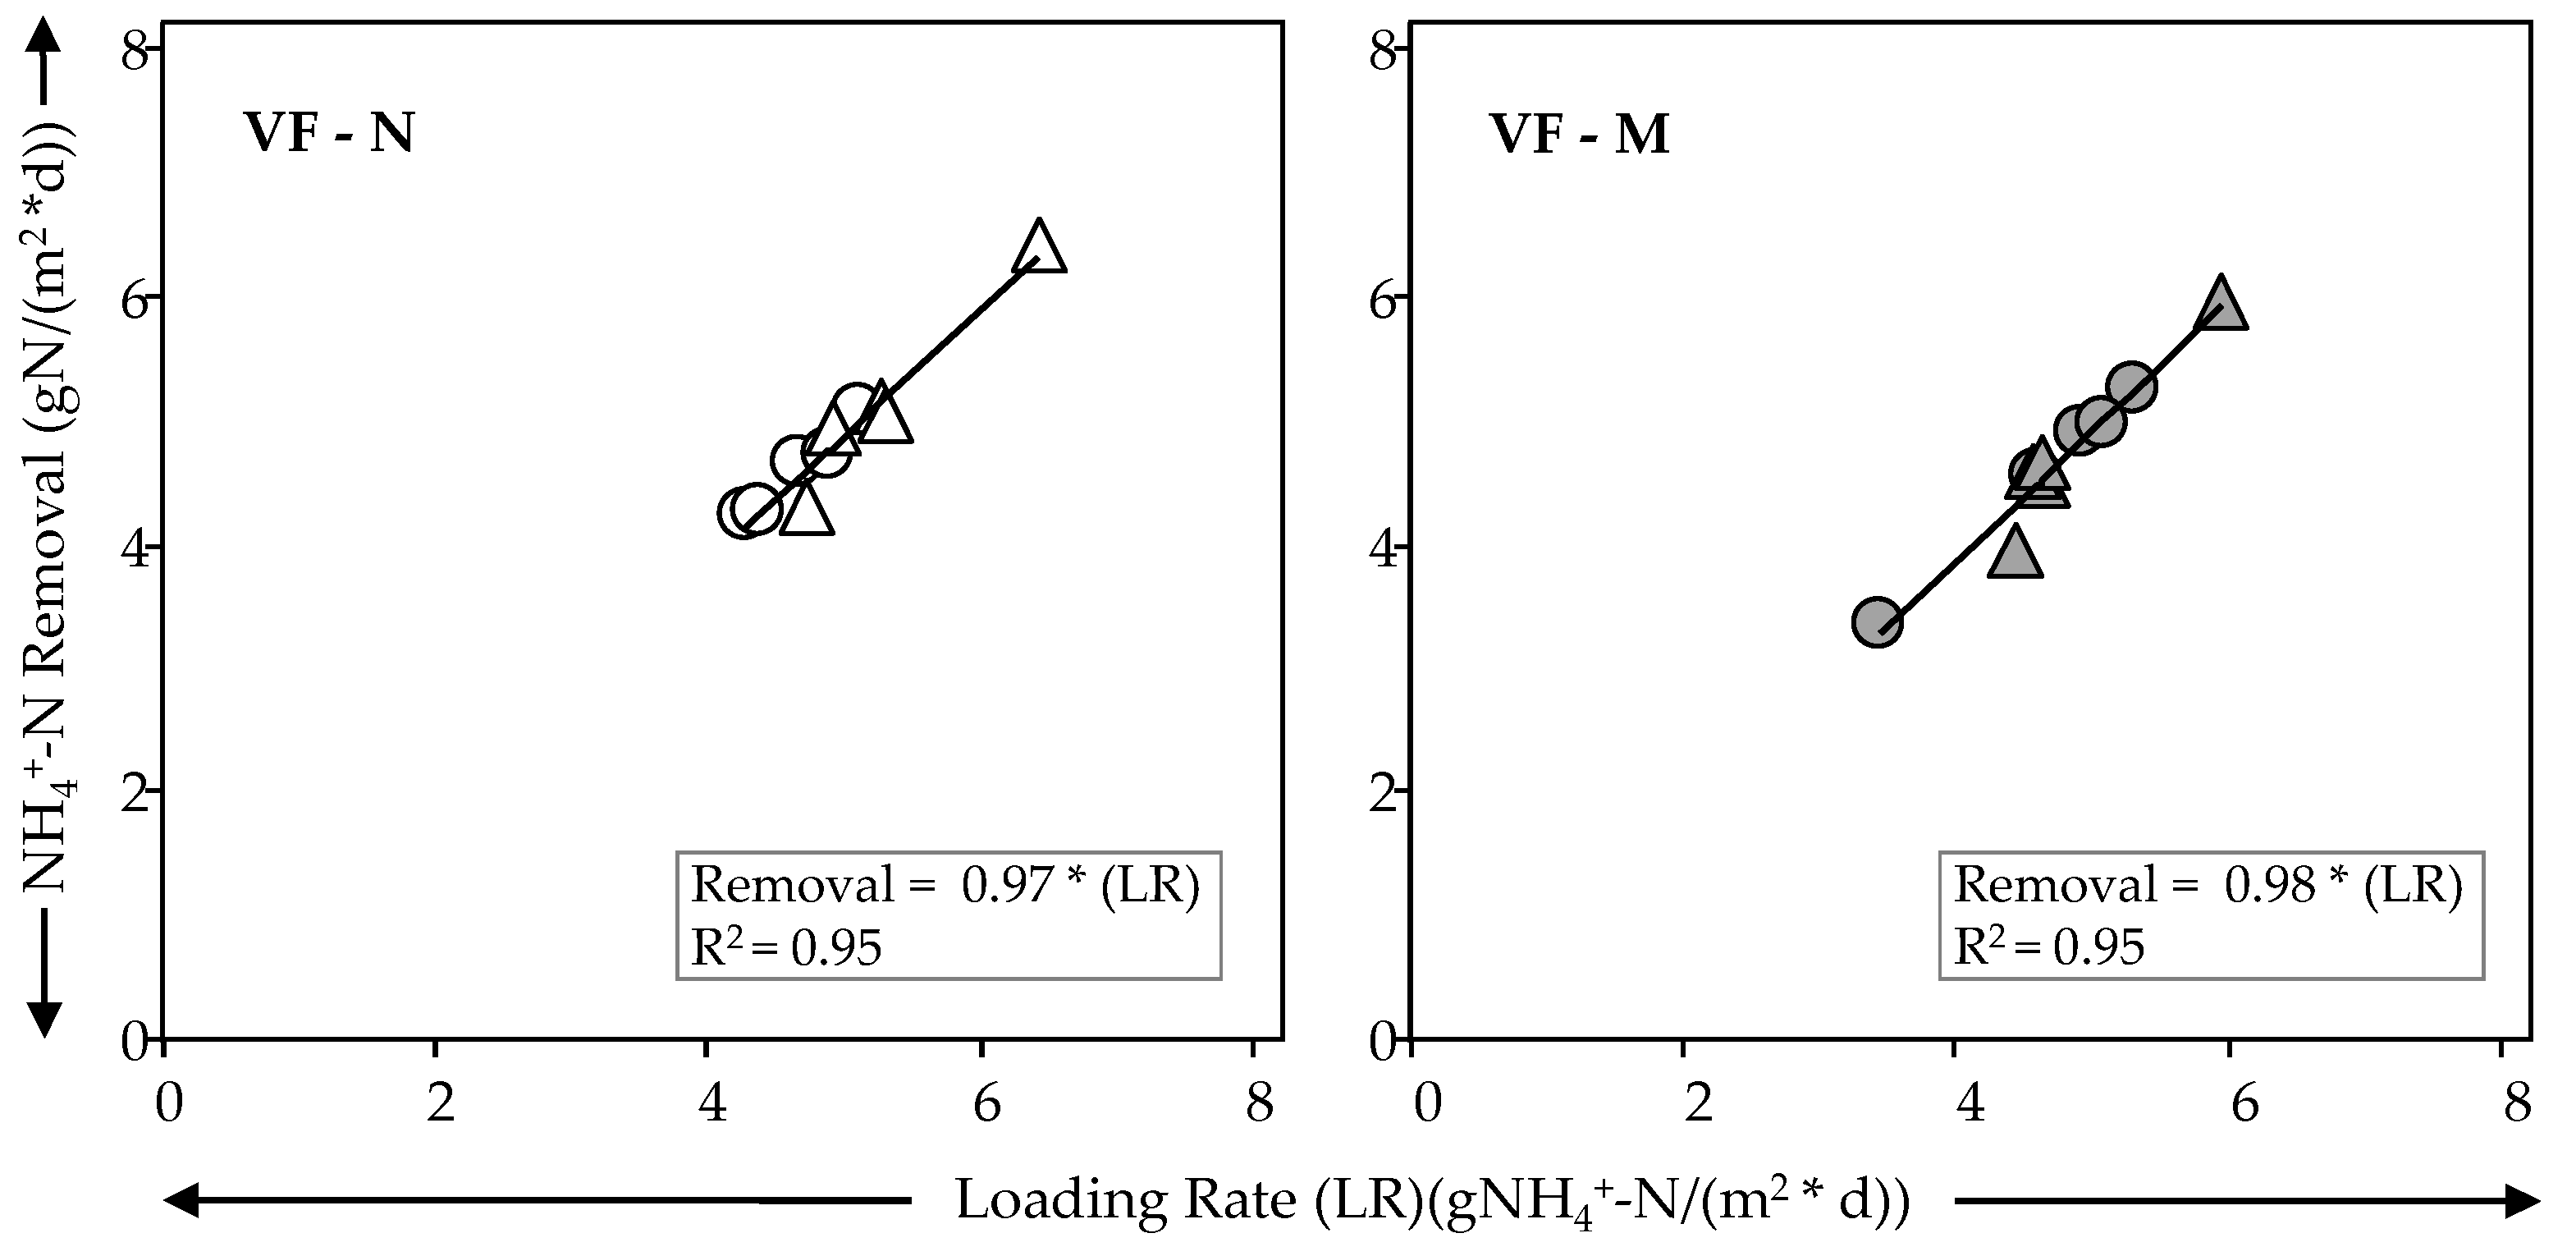
 ) VF- N, (
  ) VF-M.
) VF- N, ( ) VF-M.
) VF-M.
) VF- N, ( ) VF-M.
 ) VF- N, (
  ) VF-M.
) VF- N, ( ) VF-M.
) VF-M.
) VF- N, ( ) VF-M.
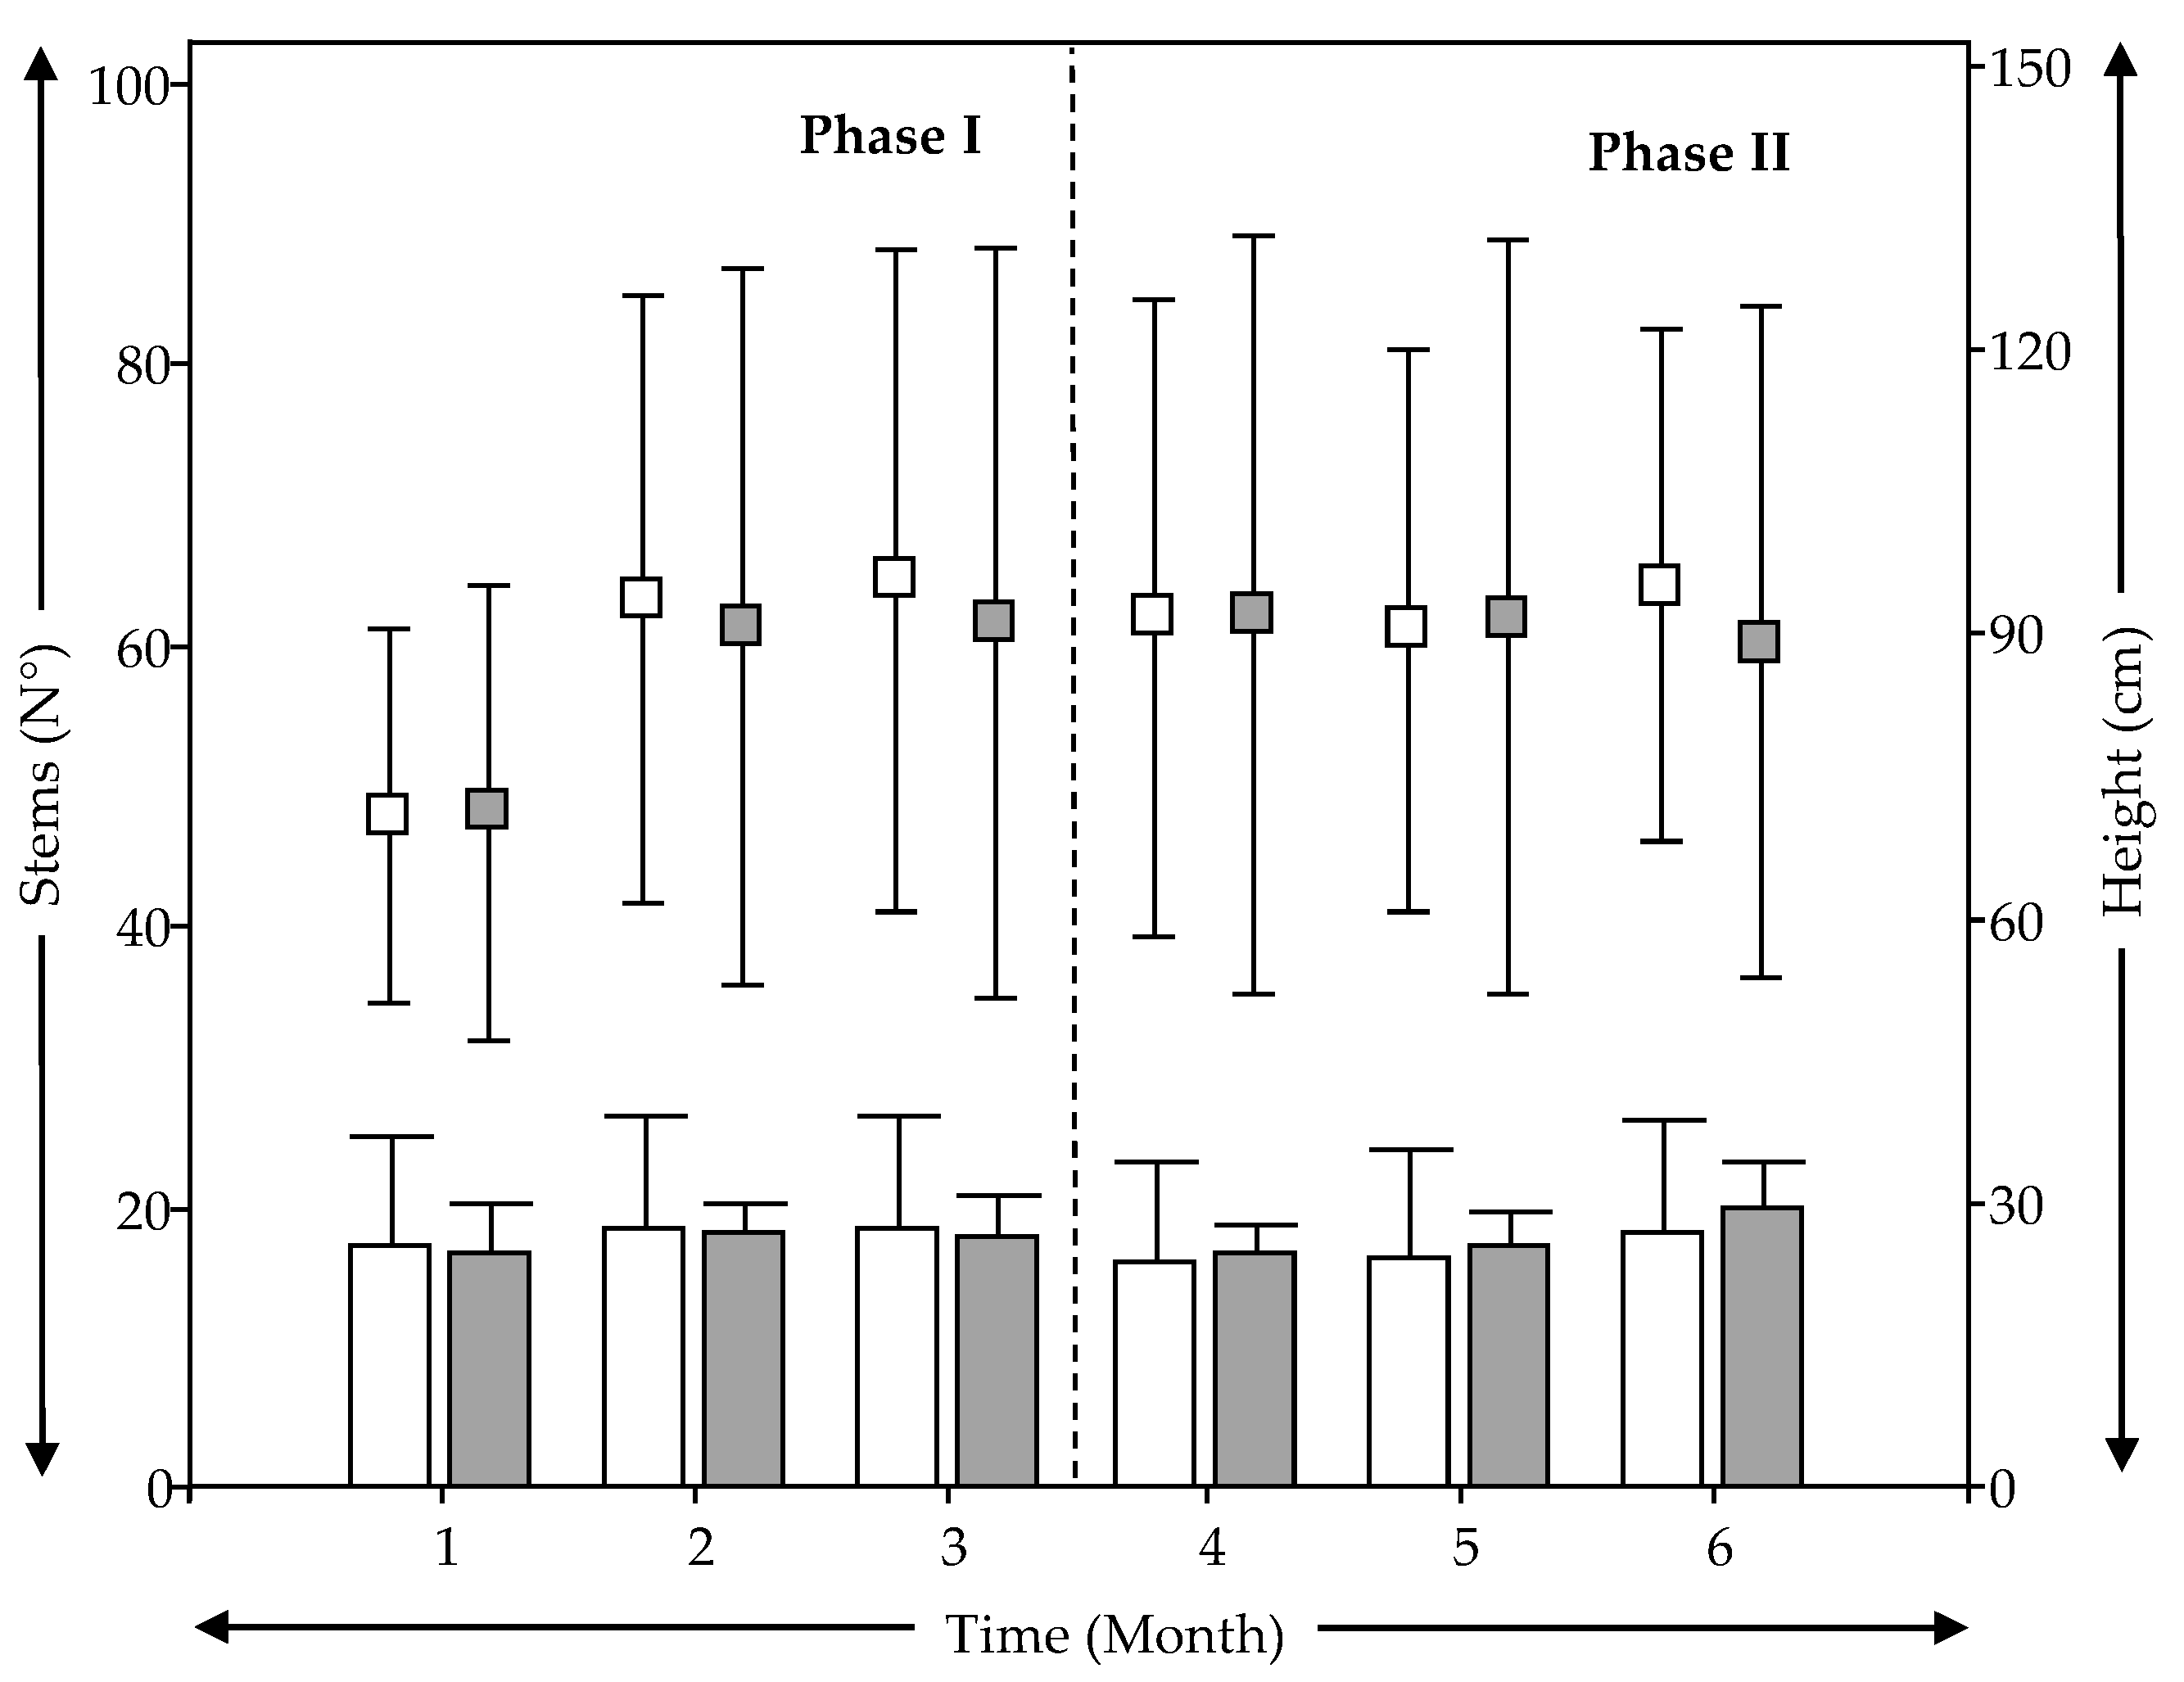
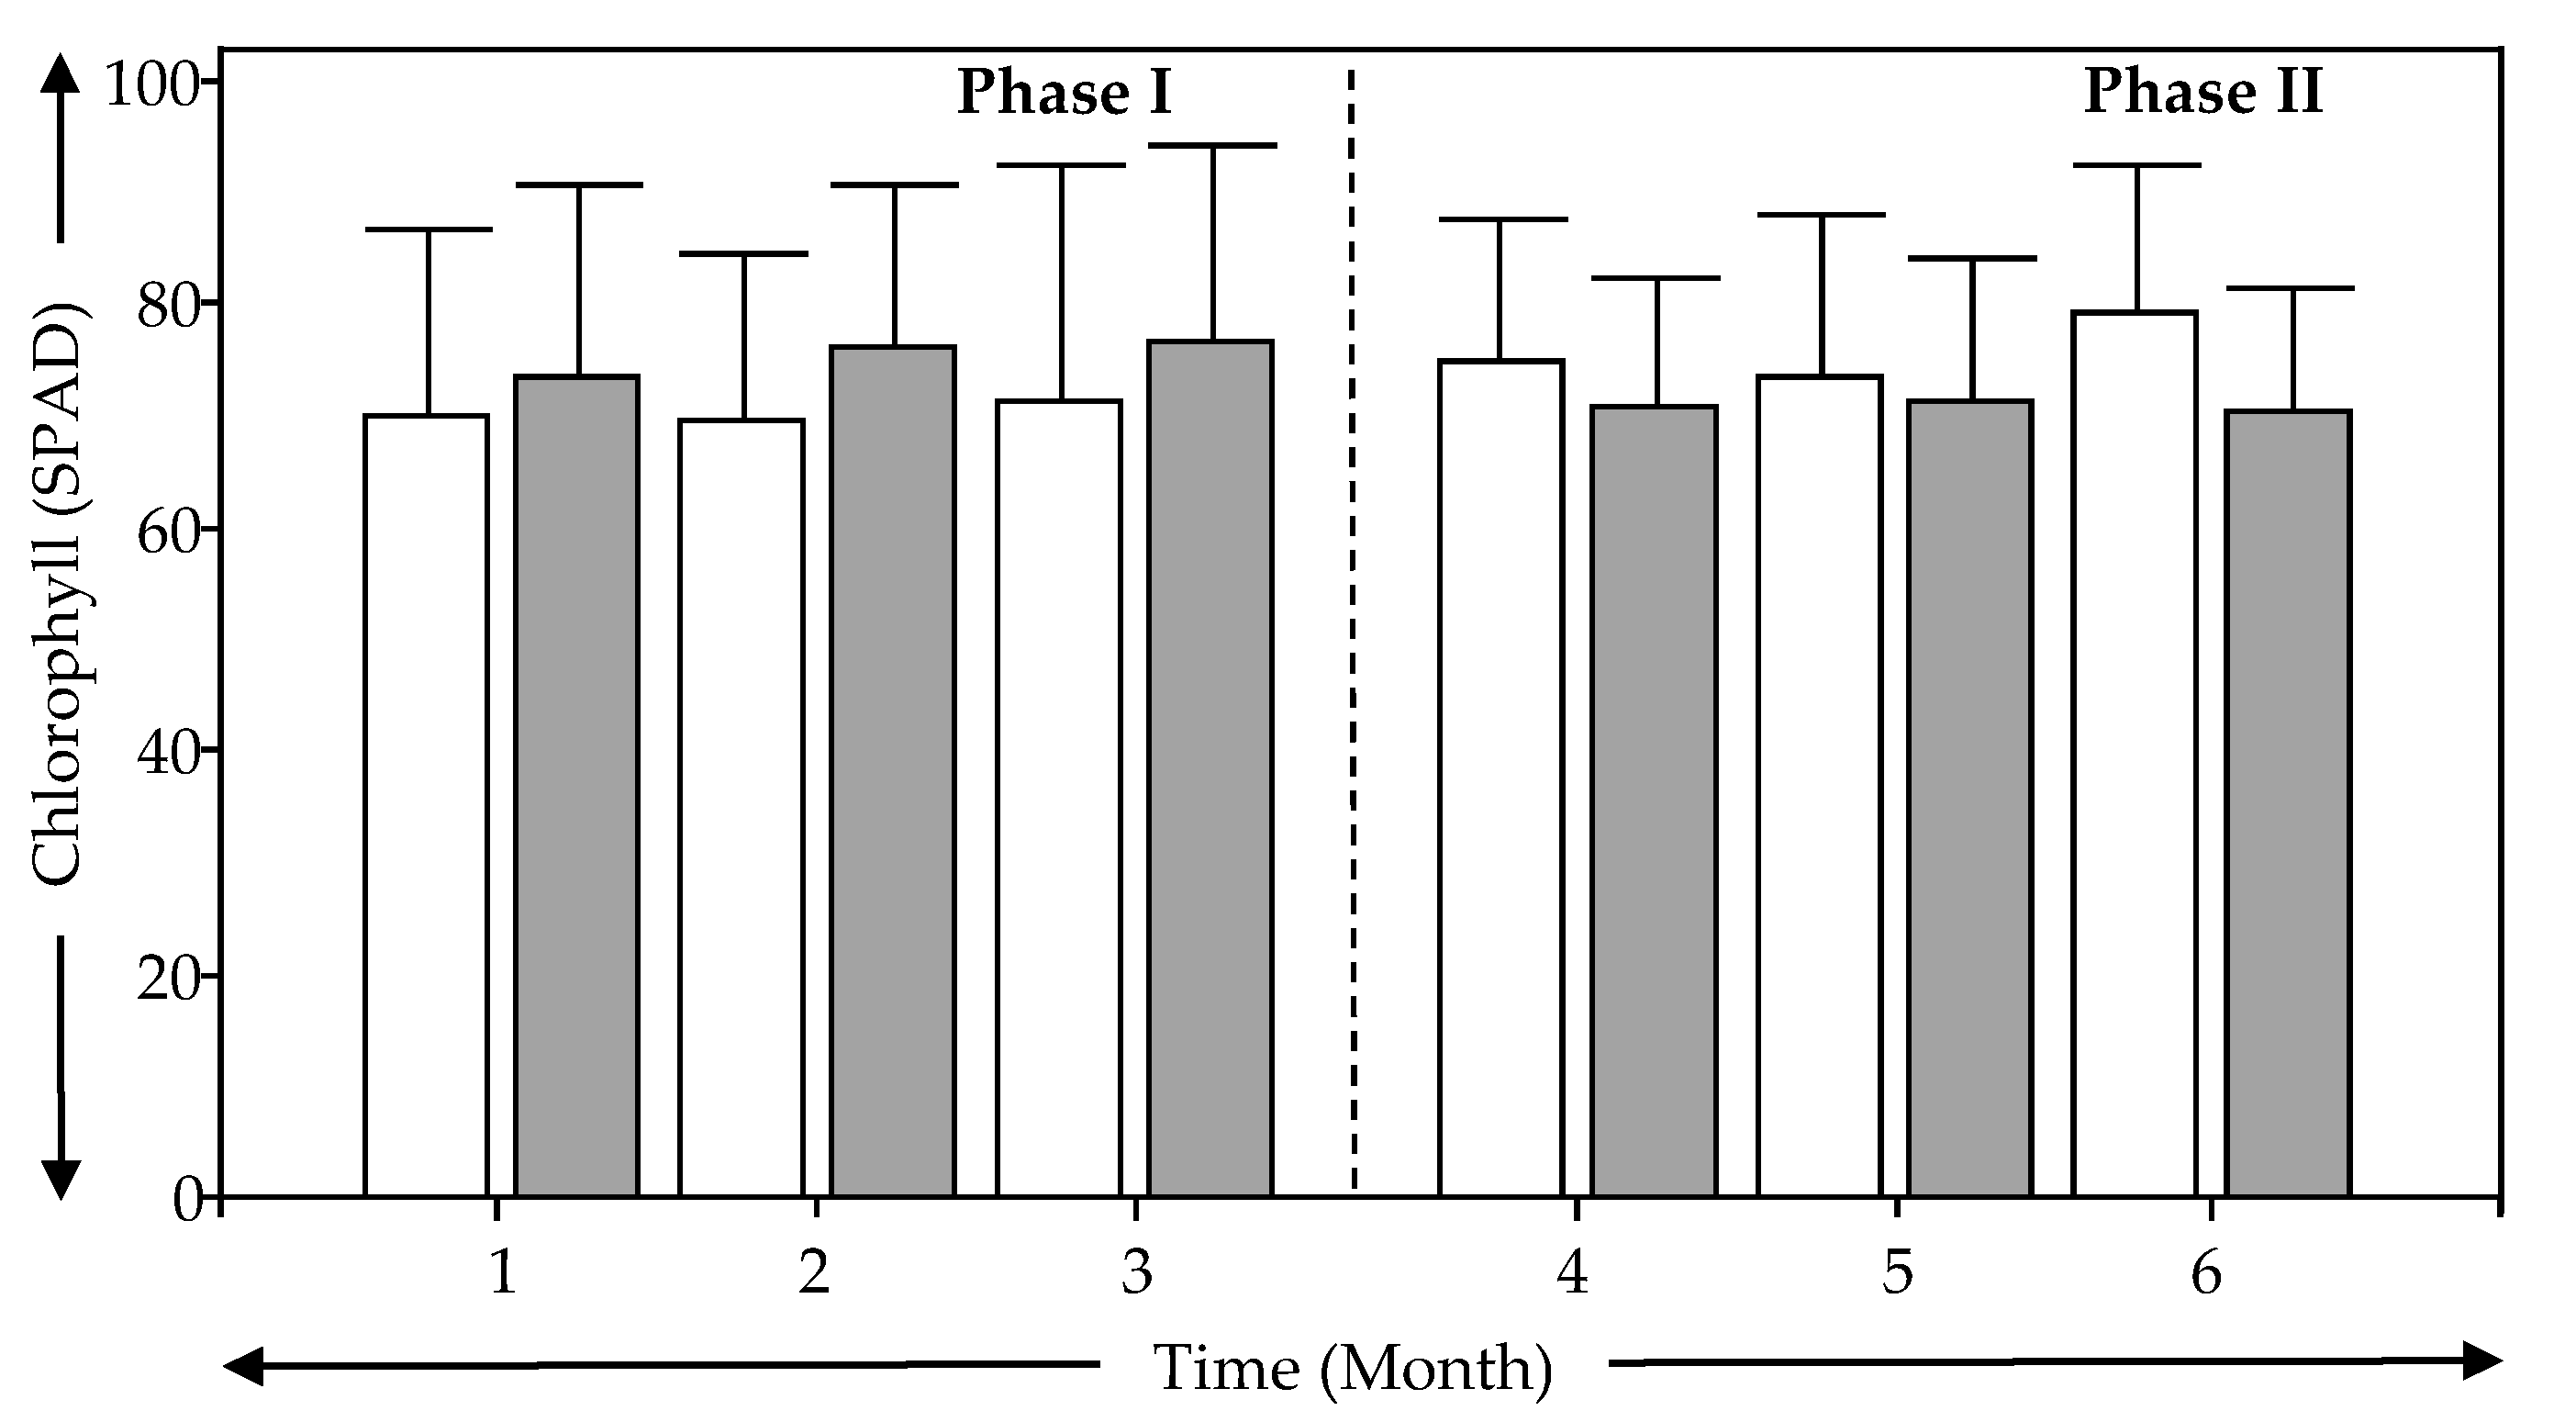
 ) VF-N, (
  ) VF-M.
) VF-N, ( ) VF-M.
) VF-M.
) VF-N, ( ) VF-M.

| Water Quality Parameter | Unit | Average ± Standard Deviation | Minimum | Maximum |
|---|---|---|---|---|
| T | °C | 13.8 ± 4.5 | 8.8 | 24.5 |
| pH | 7.8 ± 0.2 | 7.3 | 8.1 | |
| EC | µs/cm | 978 ± 87 | 866.0 | 1125.0 |
| COD | mg/L | 186.0 ± 62.0 | 125.0 | 325.0 |
| TSS | mg/L | 205.0 ± 228.3 | 30.5 | 658.3 |
| NH4+-N | mg/L | 43.0 ± 5.0 | 37.3 | 53.4 |
| NO3−-N | mg/L | 0.8 ± 0.5 | 0.2 | 1.6 |
| TN | mg/L | 50.0 ± 19.7 | 37.6 | 102.4 |
| PO4−3-P | mg/L | 9.3 ± 3.5 | 5.2 | 15.7 |
| Total Coliforms | Log10(MPN/100 mL) | 6.5 ± 0.6 | 5.0 | 7.0 |
| E. coli | Log10(MPN/100 mL) | 6.0 ± 0.5 | 5.0 | 6.6 |
| Parameter | Unit | VF-N | VF-M | ||
|---|---|---|---|---|---|
| Phase I * | Phase II * | Phase I * | Phase II ** | ||
| pH | 7.4 ± 0.2 | 6.9 ± 0.3 | 7.5 ± 0.4 | 7.0 ± 0.1 | |
| T | °C | 16.4 ± 4.5 | 10.8 ± 1.6 | 16.7 ± 4.3 | 10.6 ± 1.5 |
| ORP | mV | +154.3 ± 69.9 | +195.2 ± 71.4 | +139.2 ± 73.5 | +160.8 ± 107.0 |
| EC | µs/cm | 806.3 ± 105.2 | 772.2 ± 305.6 | 852.5 ± 94.2 | 805.3 ± 82.2 |
| Parameter | Effluent Concentrations (mg/L) and Removal Efficiencies (%) | |||
|---|---|---|---|---|
| VF-N | VF-M | |||
| Phase I * | Phase II * | Phase I * | Phase II ** | |
| COD | 24.4 + 10.4 (83.9 ± 7.7) | 68.5 ± 46.5 (65.1 ± 21.1) | 45.8 ± 17.1 (73.6 ± 10.7) | 74.5 ± 28.4 (60.9 ± 14.5) |
| TSS | 1.7 ± 1.1 (97.1 ± 3.6) | 2.4 ± 2.3 (98.2 ± 1.0) | 5.4 ± 3.4 (94.1 ± 6.5) | 6.5 ± 3.7 (93.5 ± 3.6) |
| PO4−3-P | 2.2 ± 1.3 (80.6 ± 9.6) | 3.3 ± 0.8 (51.4 ± 20.2) | 4.1 ± 1.2 (61.8 ± 7.0) | 4.6 ± 1.3 (33.3 ± 22.3) |
| NH4+-N | 0.6 ± 0.4 (98.6 ± 0.9) | 3.5 ± 4.3 (96.2 ± 2.8) | 0.6 ± 0.4 (98.6 ± 0.9) | 2.3 ± 2.7 (96.9 ± 3.8) |
| NO3−-N | 37.2 ±13.3 | 46.8 ± 16.5 | 27.1 ± 8.8 | 19.5 ± 17.9 |
| TN | 43.5 ± 31.1 (23.9 ± 30.0) | 36.8 ± 9.7 (19.1 ± 33.1) | 37.1 ± 25.2 (35.3 ± 13.9) | 15.5 ± 13.6 (63.3 ± 33.1) |
| Wetland Type | Phase | Total Coliforms | E. coli | ||||
|---|---|---|---|---|---|---|---|
| Log. Units Removed | Data ≤ 1.0 × 10³ MPN/100 mL (%) | Min–Max | Log. Units Removed | Data ≤ 1.0 × 10³ MPN/100 mL (%) | Min–Max | ||
| VF-N | I * | 3.3 | 90.0 | 2.0 × 10²–1.2 × 10⁴ | 3.0 | 100.0 | 1.0 × 10³ |
| II * | 3.0 | 40.0 | 1.0 × 10³–2.2 × 10⁵ | 2.4 | 80.0 | 1.0 × 10³–2.3 × 10⁵ | |
| VF-M | I * | 1.7 | 10.0 | 1.0 × 10³–3.7 × 10⁵ | 1.9 | 18.2 | 1.0 × 10³–1.8 × 10⁵ |
| II ** | 1.4 | 0.0 | 4.6 × 10⁴–>2.4 × 10⁶ | 1.1 | 0.0 | 1.2 × 10⁴–>2.4 × 10⁶ | |
| Wetland Type | Plant Tissue | Biomass (kgDW/m2 * Year) | Nutrient Content (%) | |
|---|---|---|---|---|
| N | P | |||
| VF-N | Leaf | 4.54 ± 0.05 * | 1.69 ± 0.09 | 0.24 ± 0.03 |
| Root | 7.06 ± 0.07 ** | 1.45 ± 0.07 | 0.22 ± 0.02 | |
| VF-M | Leaf | 6.22 ± 0.07 * | 1.62 ± 0.08 | 0.24 ± 0.02 |
| Root | 5.20 ± 0.05 ** | 1.63 ± 0.08 | 0.25 ± 0.03 | |
| Phase | Month | Water Loss (%) | |
|---|---|---|---|
| VF-N | VF-M | ||
| I | 1 | 13.6 ± 3.0 * | 16.2 ± 3.2 * |
| 2 | 9.8 ± 5.3 * | 10.5 ± 2.4 * | |
| 3 | 7.3 ± 3.8 * | 4.4 ± 2.6 * | |
| Average | 10.2 ± 4.7 | 10.4 ± 5.4 | |
| II | 4 | 5.1 ± 1.8 * | 1.9 ± 1.0 ** |
| 5 | 4.4 ± 1.9 * | 2.7 ± 0.9 ** | |
| 6 | 6.5 ± 1.7 * | 2.1 ± 1.1 ** | |
| Average | 5.3 ± 1.9 | 2.3 ± 1.0 ** | |
Publisher’s Note: MDPI stays neutral with regard to jurisdictional claims in published maps and institutional affiliations. |
© 2021 by the authors. Licensee MDPI, Basel, Switzerland. This article is an open access article distributed under the terms and conditions of the Creative Commons Attribution (CC BY) license (https://creativecommons.org/licenses/by/4.0/).
Share and Cite
Vera-Puerto, I.; Valdés, H.; Correa, C.; Perez, V.; Gomez, R.; Alarcon, E.; Arias, C. Evaluation of Bed Depth Reduction, Media Change, and Partial Saturation as Combined Strategies to Modify in Vertical Treatment Wetlands. Int. J. Environ. Res. Public Health 2021, 18, 4842. https://doi.org/10.3390/ijerph18094842
Vera-Puerto I, Valdés H, Correa C, Perez V, Gomez R, Alarcon E, Arias C. Evaluation of Bed Depth Reduction, Media Change, and Partial Saturation as Combined Strategies to Modify in Vertical Treatment Wetlands. International Journal of Environmental Research and Public Health. 2021; 18(9):4842. https://doi.org/10.3390/ijerph18094842
Chicago/Turabian StyleVera-Puerto, Ismael, Hugo Valdés, Christian Correa, Valeria Perez, Roberto Gomez, Erica Alarcon, and Carlos Arias. 2021. "Evaluation of Bed Depth Reduction, Media Change, and Partial Saturation as Combined Strategies to Modify in Vertical Treatment Wetlands" International Journal of Environmental Research and Public Health 18, no. 9: 4842. https://doi.org/10.3390/ijerph18094842