
Muscle Tone and Body Weight Predict Uphill Race Time in Amateur Trail Runners

 , , ,
, , , 
Abstract
:1. Introduction
2. Materials and Methods
2.1. Participants
2.2. Procedure
2.3. Measurements
2.4. Statistical Analysis
3. Results
4. Discussion
5. Conclusions
Author Contributions
Funding
Institutional Review Board Statement
Informed Consent Statement
Data Availability Statement
Acknowledgments
Conflicts of Interest
References
- Balducci, P.; Clémençon, M.; Trama, R.; Blache, Y.; Hautier, C. Performance Factors in a Mountain Ultramarathon. Int. J. Sports Med. 2017, 38, 819–826. [Google Scholar] [CrossRef] [PubMed]
- Vernillo, G.; Savoldelli, A.; Skafidas, S.; Zignoli, A.; La Torre, A.; Pellegrini, B.; Giardini, G.; Trabucchi, P.; Millet, G.P.; Schena, F. An Extreme Mountain Ultra-Marathon Decreases the Cost of Uphill Walking and Running. Front. Physiol. 2016, 7. [Google Scholar] [CrossRef] [Green Version]
- Vernillo, G.; Savoldelli, A.; Zignoli, A.; Skafidas, S.; Fornasiero, A.; La Torre, A.; Bortolan, L.; Pellegrini, B.; Schena, F. Energy cost and kinematics of level, uphill and downhill running: Fatigue-induced changes after a mountain ultramarathon. J. Sports Sci. 2015, 33, 1998–2005. [Google Scholar] [CrossRef]
- Millet, G.Y.; Tomazin, K.; Verges, S.; Vincent, C.; Bonnefoy, R.; Boisson, R.-C.; Gergelé, L.; Féasson, L.; Martin, V. Neuromuscular Consequences of an Extreme Mountain Ultra-Marathon. Tarnopolsky M, editor. PLoS ONE 2011, 6, e17059. [Google Scholar] [CrossRef] [Green Version]
- International Skyrunning Federation Rules. Available online: http://www.skyrunning.com (accessed on 6 February 2021).
- Roberts, T.J.; Belliveau, R.A. Sources of mechanical power for uphill running in humans. J Exp. Biol. 2005, 208, 1963–1970. [Google Scholar] [CrossRef] [Green Version]
- Snyder, K.L.; Kram, R.; Gottschall, J.S. The role of elastic energy storage and recovery in downhill and uphill running. J. Exp. Biol. 2012, 215, 2283–2287. [Google Scholar] [CrossRef] [PubMed] [Green Version]
- Margaria, R.; Cerretelli, P.; Aghemo, P.; Sassi, G. Energy cost of running. J Appl. Physiol. 1963, 18, 367–370. [Google Scholar] [CrossRef]
- Minetti, A.E.; Ardigò, L.P.; Saibene, F. Mechanical determinants of the minimum energy cost of gradient running in humans. J. Exp. Biol. 1994, 195, 211–225. [Google Scholar]
- Balducci, P.; Clémençon, M.; Morel, B.; Quiniou, G.; Saboul, D.; Hautier, C.A. Comparison of level and graded treadmill tests to evaluate endurance mountain runners. J. Sports Sci. Med. 2016, 15, 239–246. [Google Scholar]
- Barandun, U.; Knechtle, B.; Knechtle, P.; Klipstein, A.; Rüst, C.A.; Rosemann, T.; Lepers, R.; Knechtle, P. Running speed during training and percent body fat predict race time in recreational male marathoners. J. Sports Med. 2012, 3, 51–58. [Google Scholar]
- Whittle, M.W. Generation and attenuation of transient impulsive forces beneath the foot: A review. Gait Posture. 1999, 10, 264–275. [Google Scholar] [CrossRef]
- Heise, G.D.; Martin, P.E. “Leg spring” characteristics and the aerobic demand of running. Med. Sci. Sports Exerc. 1998, 30, 750–754. [Google Scholar] [CrossRef]
- Sheerin, K.R.; Reid, D.; Besier, T.F. The measurement of tibial acceleration in runners: A review of the factors that can affect tibial acceleration during running and evidence-based guidelines for its use. Gait Posture 2019, 67, 12–24. [Google Scholar] [CrossRef] [PubMed]
- Valiant, G.A. Transmission and attenuation of heel-strike accelerations. In Biomech. Distance Run; Human Kinetics Books: Champaign, IL, USA, 1990; pp. 225–248. [Google Scholar]
- Wundersitz, D.W.T.; Gastin, P.B.; Richter, C.; Robertson, S.J.; Netto, K.J. Validity of a trunk-mounted accelerometer to assess peak accelerations during walking, jogging and running. Eur. J. Sport Sci. 2015, 15, 382–390. [Google Scholar] [CrossRef] [PubMed]
- Shorten, M.R.; Winslow, D.S. Spectral analysis of impact shock during running. J. Appl. Biomech. 1992, 8, 288–304. [Google Scholar] [CrossRef]
- Dickinson, J.A.; Cook, S.D.; Leinhardt, T.M. The measurement of shock waves following heel strike while running. J. Biomech. 1985, 18, 415–422. [Google Scholar] [CrossRef]
- Zadpoor, A.; ANikooyan, A. The effects of lower-extremity muscle fatigue on the vertical ground reaction force: A meta-analysis. P I MECH ENG H. 2012, 226, 579–588. [Google Scholar] [CrossRef]
- Christina, K.; White, S.; McCrory, J. The effects of dorsiflexor fatigue on kinetic measures during running. In Proceedings of the NACOB’98: The Third North American Congress on Biomechanics, Canadian Society for Biomechanics, Waterloo, ON, Canada, 14–18 August 1998; pp. 311–312. [Google Scholar]
- Brüggemann, G.-P.; Arndt, A.; Kersting, U.; Knicker, A. Influence of fatigue on impact forces and rear foot motion during running. In Proceedings of the XVth congress of the International Society of Biomechanics, Jyväskylä, Finland, 2–6 July 1995; pp. 132–133. [Google Scholar]
- Nicol, C.; Komi, P.; Marconnet, P. Fatigue effects of marathon running on neuromuscular performance. Scand J. Med. Sci. Sports 2007, 1, 10–17. [Google Scholar] [CrossRef]
- Komi, P.V.; Gollhofer, A.; Schmidtbleicher, D.; Frick, U. Interaction between man and shoe in running: Considerations for a more comprehensive measurement approach. Int. J. Sports Med. 1987, 8, 196–202. [Google Scholar] [CrossRef]
- James, C.R.; Scheuermann, B.W.; Smith, M.P. Effects of two neuromuscular fatigue protocols on landing performance. J. Electromyogr. Kinesiol. 2010, 20, 667–675. [Google Scholar] [CrossRef]
- Verbitsky, O.; Mizrahi, J.; Voloshin, A.; Treiger, J.; Isakov, E. Shock transmission and fatigue in human running. J. Appl. Biomech. 1998, 14, 300–311. [Google Scholar] [CrossRef] [PubMed] [Green Version]
- Mizrahi, J.; Voloshin, A.; Russek, D.; Verbitsky, O.; Isakov, E. The influence of fatigue on EMG and impact acceleration in running. BAM 1997, 7, 111–118. [Google Scholar]
- Crowell, H.P.; Davis, I.S. Gait retraining to reduce lower extremity loading in runners. Clin. Biomech. 2011, 26, 78–83. [Google Scholar] [CrossRef] [PubMed] [Green Version]
- Hermens, H.J.; Freriks, B.; Disselhorst-Klug, C.; Rau, G. Development of recommendations for SEMG sensors and sensor placement procedures. J. ElectromyogrKinesiol. 2000, 10, 361–374. [Google Scholar] [CrossRef]
- Pruyn, E.C.; Watsford, M.; Murphy, A. The relationship between lower-body stiffness and dynamic performance. Appl. Physiol. Nutr. Metab. 2014, 39, 1144–1150. [Google Scholar] [CrossRef]
- Bizzini, M.; Mannion, A.F. Reliability of a new, hand-held device for assessing skeletal muscle stiffness. Clin. Biomech. 2003, 18, 459–461. [Google Scholar] [CrossRef]
- Boey, H.; Aeles, J.; Schütte, K.; Vanwanseele, B. The effect of three surface conditions, speed and running experience on vertical acceleration of the tibia during running. Sports Biomech. 2017, 16, 166–176. [Google Scholar] [CrossRef] [PubMed]
- Park, E.; Cho, M.; Ki, C.-S. Correct use of repeated measures analysis of variance. Korean J. Lab. Med. 2009, 29, 1–9. [Google Scholar] [CrossRef]
- Zghal, F.; Colson, S.S.; Blain, G.; Behm, D.G.; Granacher, U.; Chaouachi, A. Combined resistance and plyometric training is more effective than plyometric training alone for improving physical fitness of pubertal soccer players. Front Physiol. 2019, 10, 1026. [Google Scholar] [CrossRef] [Green Version]
- Hammami, M.; Hermassi, S.; Gaamouri, N.; Aloui, G.; Comfort, P.; Shephard, R.J.; Chelly, M.S. Field tests of performance and their relationship to age and anthropometric parameters in adolescent handball players. Front Physiol. 2019, 10, 1124. [Google Scholar] [CrossRef] [Green Version]
- Rüst, C.A.; Knechtle, B.; Knechtle, P.; Barandun, U.; Lepers, R.; Rosemann, T. Predictor variables for a half marathon race time in recreational male runners. J. Sports Med. 2011, 2, 113–119. [Google Scholar]
- Lieberman, D.E.; Raichlen, D.A.; Pontzer, H.; Bramble, D.M.; Cutright-Smith, E. The human gluteus maximus and its role in running. J. Exp. Biol. 2006, 209, 2143–2155. [Google Scholar] [CrossRef] [PubMed] [Green Version]
- Saunders, P.U.; Pyne, D.B.; Telford, R.D.; Hawley, J.A. Factors affecting running economy in trained distance runners. Sports Med. 2004, 34, 465–485. [Google Scholar] [CrossRef]
- Pate, R.R.; Macera, C.A.; Bailey, S.P.; Bartoli, W.P.; Powell, K.E. Physiological, anthropometric, and training correlates of running economy. Med. Sci. Sports Exerc. 1992, 24, 1128–1133. [Google Scholar] [CrossRef]
- Knechtle, B.; Knechtle, P.; Rosemann, T. Race Performance in Male Mountain Ultra-Marathoners: Anthropometry or Training? Percept Mot. Skills 2010, 110, 721–735. [Google Scholar] [CrossRef]
- Tanda, G.; Knechtle, B. Marathon performance in relation to body fat percentage and training indices in recreational male runners. J. Sports Med. 2013, 4, 141–149. [Google Scholar]
- Hetland, M.L.; Haarbo, J.; Christiansen, C. Regional body composition determined by dual-energy x-ray absorptiometry. Relation to Training, Sex Hormones, and serum lipids in male long-distance runners. Scand. J. Med Sci. Spor. 1998, 8, 102–108. [Google Scholar] [CrossRef] [PubMed]


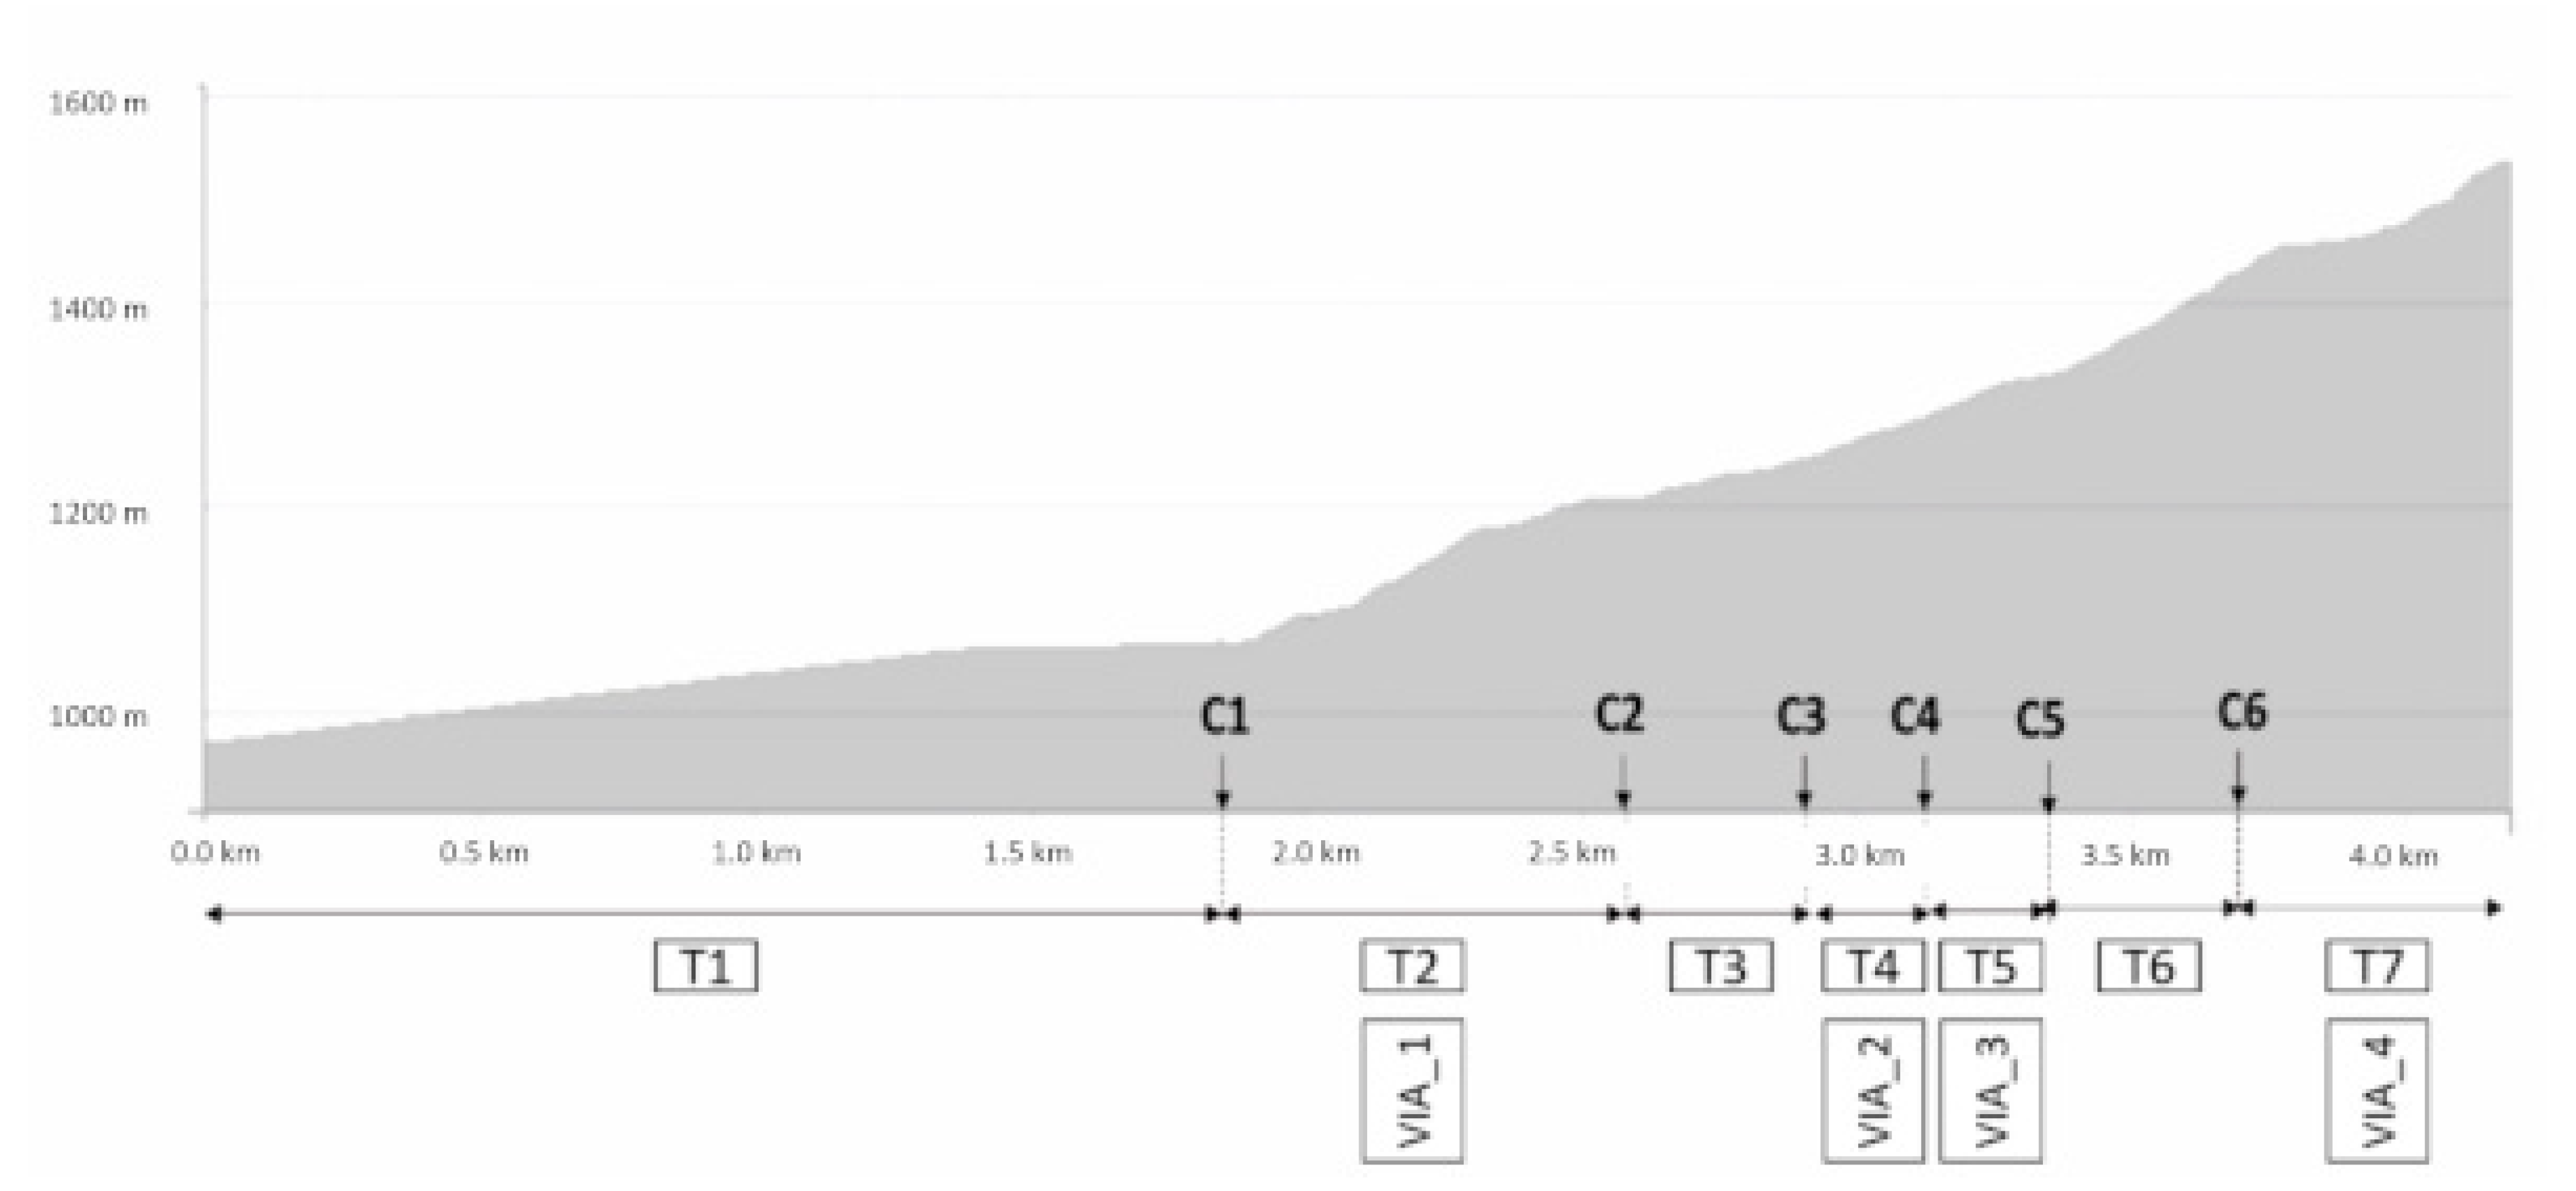
| T1 | T2 | T3 | T4 | T5 | T6 | T7 | |
|---|---|---|---|---|---|---|---|
| Distance (m) | 1800 | 800 | 250 | 200 | 220 | 390 | 380 |
| Slope (%) | 11 | 22 | 11 | 20 | 21 | 34 | 23 |
| Terrain | Track | Canyon | Path | Path | Path | Path | Track/path |
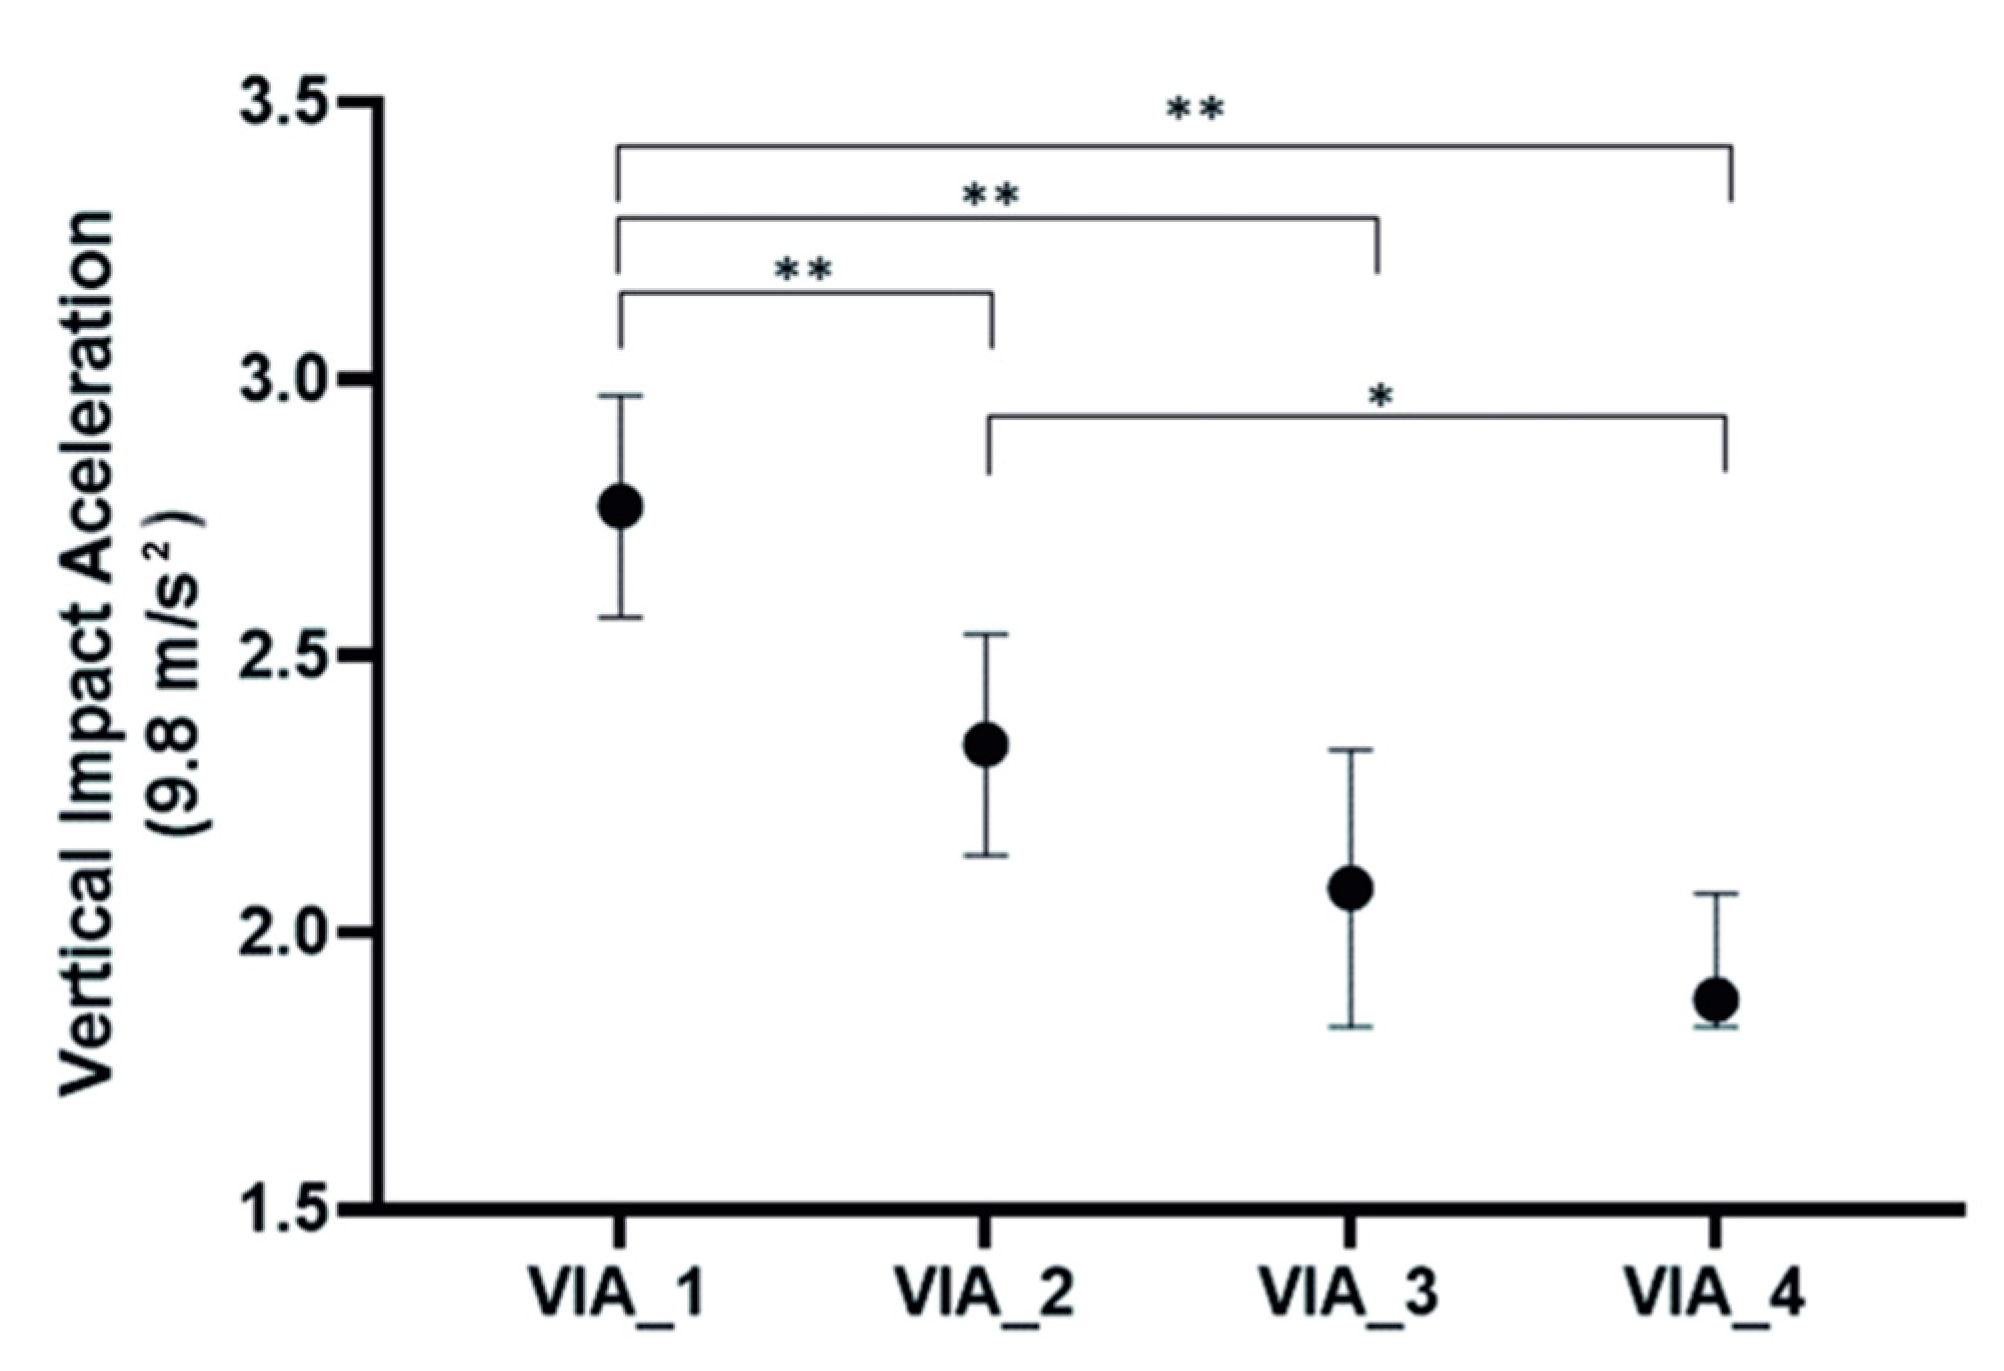
| N = 13 | Mean | SD | LCIL 95% | UCIL 95% | p |
|---|---|---|---|---|---|
| MS (m/s) | 1.81 | 0.30 | 1.63 | 1.98 | 0.168 |
| Weight (kg) | 68.85 | 4.79 | 65.95 | 71.74 | 0.140 |
| Finishing Time(min) | 37.2 | 6.20 | 33.45 | 40.95 | 0.168 |
| VIA_1 (9.8 m/s2) | 2.77 | 0.34 | 2.57 | 2.97 | 0.570 |
| VIA_2 (9.8 m/s2) | 2.34 | 0.34 | 2.14 | 2.54 | 0.299 |
| VIA_3 (9.8 m/s2) | 2.08 | 0.41 | 1.83 | 2.33 | 0.099 |
| VIA_4 (9.8 m/s2) | 1.88 | 0.32 | 1.69 | 2.07 | 0.099 |
| VT (Hz) | 14.80 | 1.71 | 13.77 | 15.84 | 0.787 |
| GT (Hz) | 15.65 | 1.01 | 15.04 | 16.26 | 0.945 |
| VS (N/m2) | 284.87 | 28.42 | 267.69 | 302.04 | 0.267 |
| GS (N/m2) | 280.38 | 15.09 | 271.26 | 289.50 | 0.211 |
| Weight | VIA_1 | VIA_2 | VIA_3 | VIA_4 | GT | VT | GS | VS | |
|---|---|---|---|---|---|---|---|---|---|
| MS | −0.619 * | 0.169 | 0.198 | 0.200 | 0.041 | 0.739 ** | 0.006 | 0.483 | 0.231 |
| Weight | −0.288 | −0.485 | −0.370 | −0.484 | −0.279 | 0.063 | −0.030 | −0.095 | |
| VIA_1 | 0.423 | −0.114 | 0.256 | 0.031 | 0.035 | −0.201 | 0.162 | ||
| VIA_2 | 0.113 | 0.113 | 0.106 | 0.460 | −0.354 | 0.365 | |||
| VIA_3 | 0.544 | 0.233 | 0.082 | 0.248 | −0.010 | ||||
| VIA_4 | −0.117 | −0.432 | 0.021 | −0.450 | |||||
| GT | 0.265 | 0.792 ** | 0.356 | ||||||
| VT | −0.008 | 0.829 ** | |||||||
| GS | 0.104 |
Publisher’s Note: MDPI stays neutral with regard to jurisdictional claims in published maps and institutional affiliations. |
© 2021 by the authors. Licensee MDPI, Basel, Switzerland. This article is an open access article distributed under the terms and conditions of the Creative Commons Attribution (CC BY) license (http://creativecommons.org/licenses/by/4.0/).
Share and Cite
Berzosa, C.; Gutierrez, H.; Bascuas, P.J.; Arbones, I.; Bataller-Cervero, A.V. Muscle Tone and Body Weight Predict Uphill Race Time in Amateur Trail Runners. Int. J. Environ. Res. Public Health 2021, 18, 2040. https://doi.org/10.3390/ijerph18042040
Berzosa C, Gutierrez H, Bascuas PJ, Arbones I, Bataller-Cervero AV. Muscle Tone and Body Weight Predict Uphill Race Time in Amateur Trail Runners. International Journal of Environmental Research and Public Health. 2021; 18(4):2040. https://doi.org/10.3390/ijerph18042040
Chicago/Turabian StyleBerzosa, César, Héctor Gutierrez, Pablo Jesús Bascuas, Irela Arbones, and Ana Vanessa Bataller-Cervero. 2021. "Muscle Tone and Body Weight Predict Uphill Race Time in Amateur Trail Runners" International Journal of Environmental Research and Public Health 18, no. 4: 2040. https://doi.org/10.3390/ijerph18042040