Human West Nile Meningo-Encephalitis in a Highly Endemic Country: A Complex Epidemiological Analysis on Biotic and Abiotic Risk Factors

 , ,
, ,
Abstract
:1. Introduction
2. Materials and Methods
2.1. Data Source
2.2. Statistical Analysis
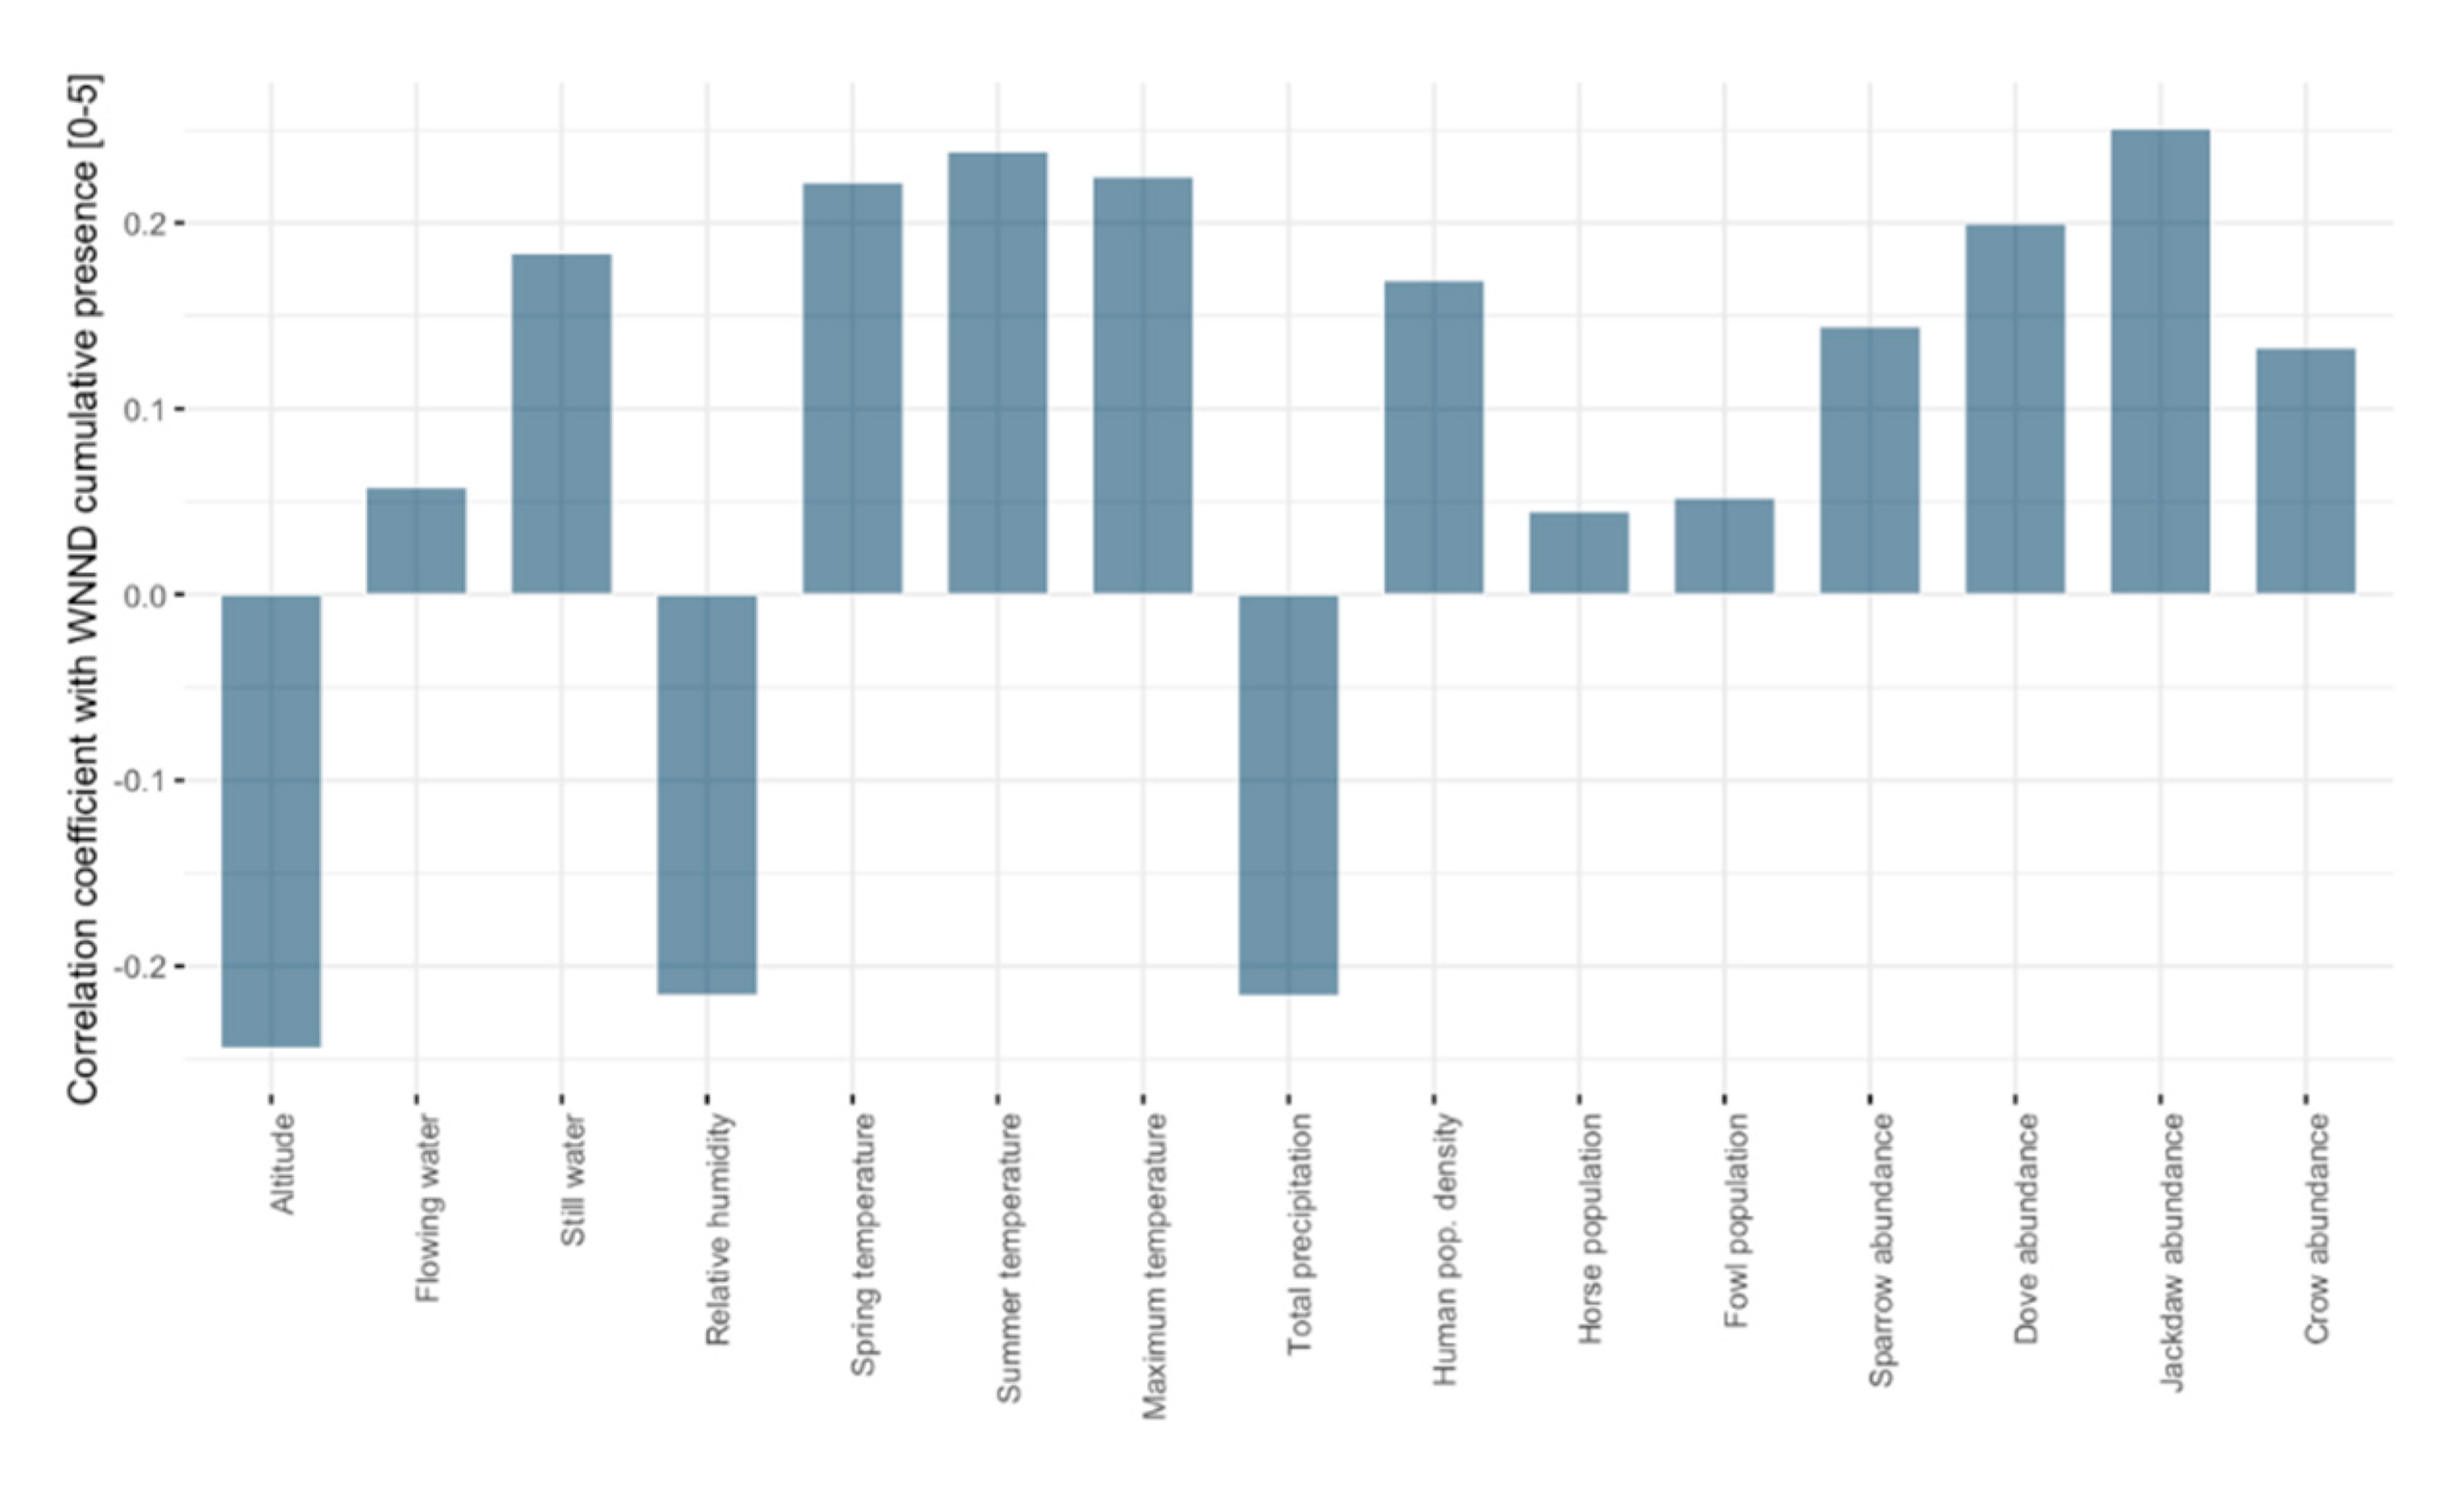
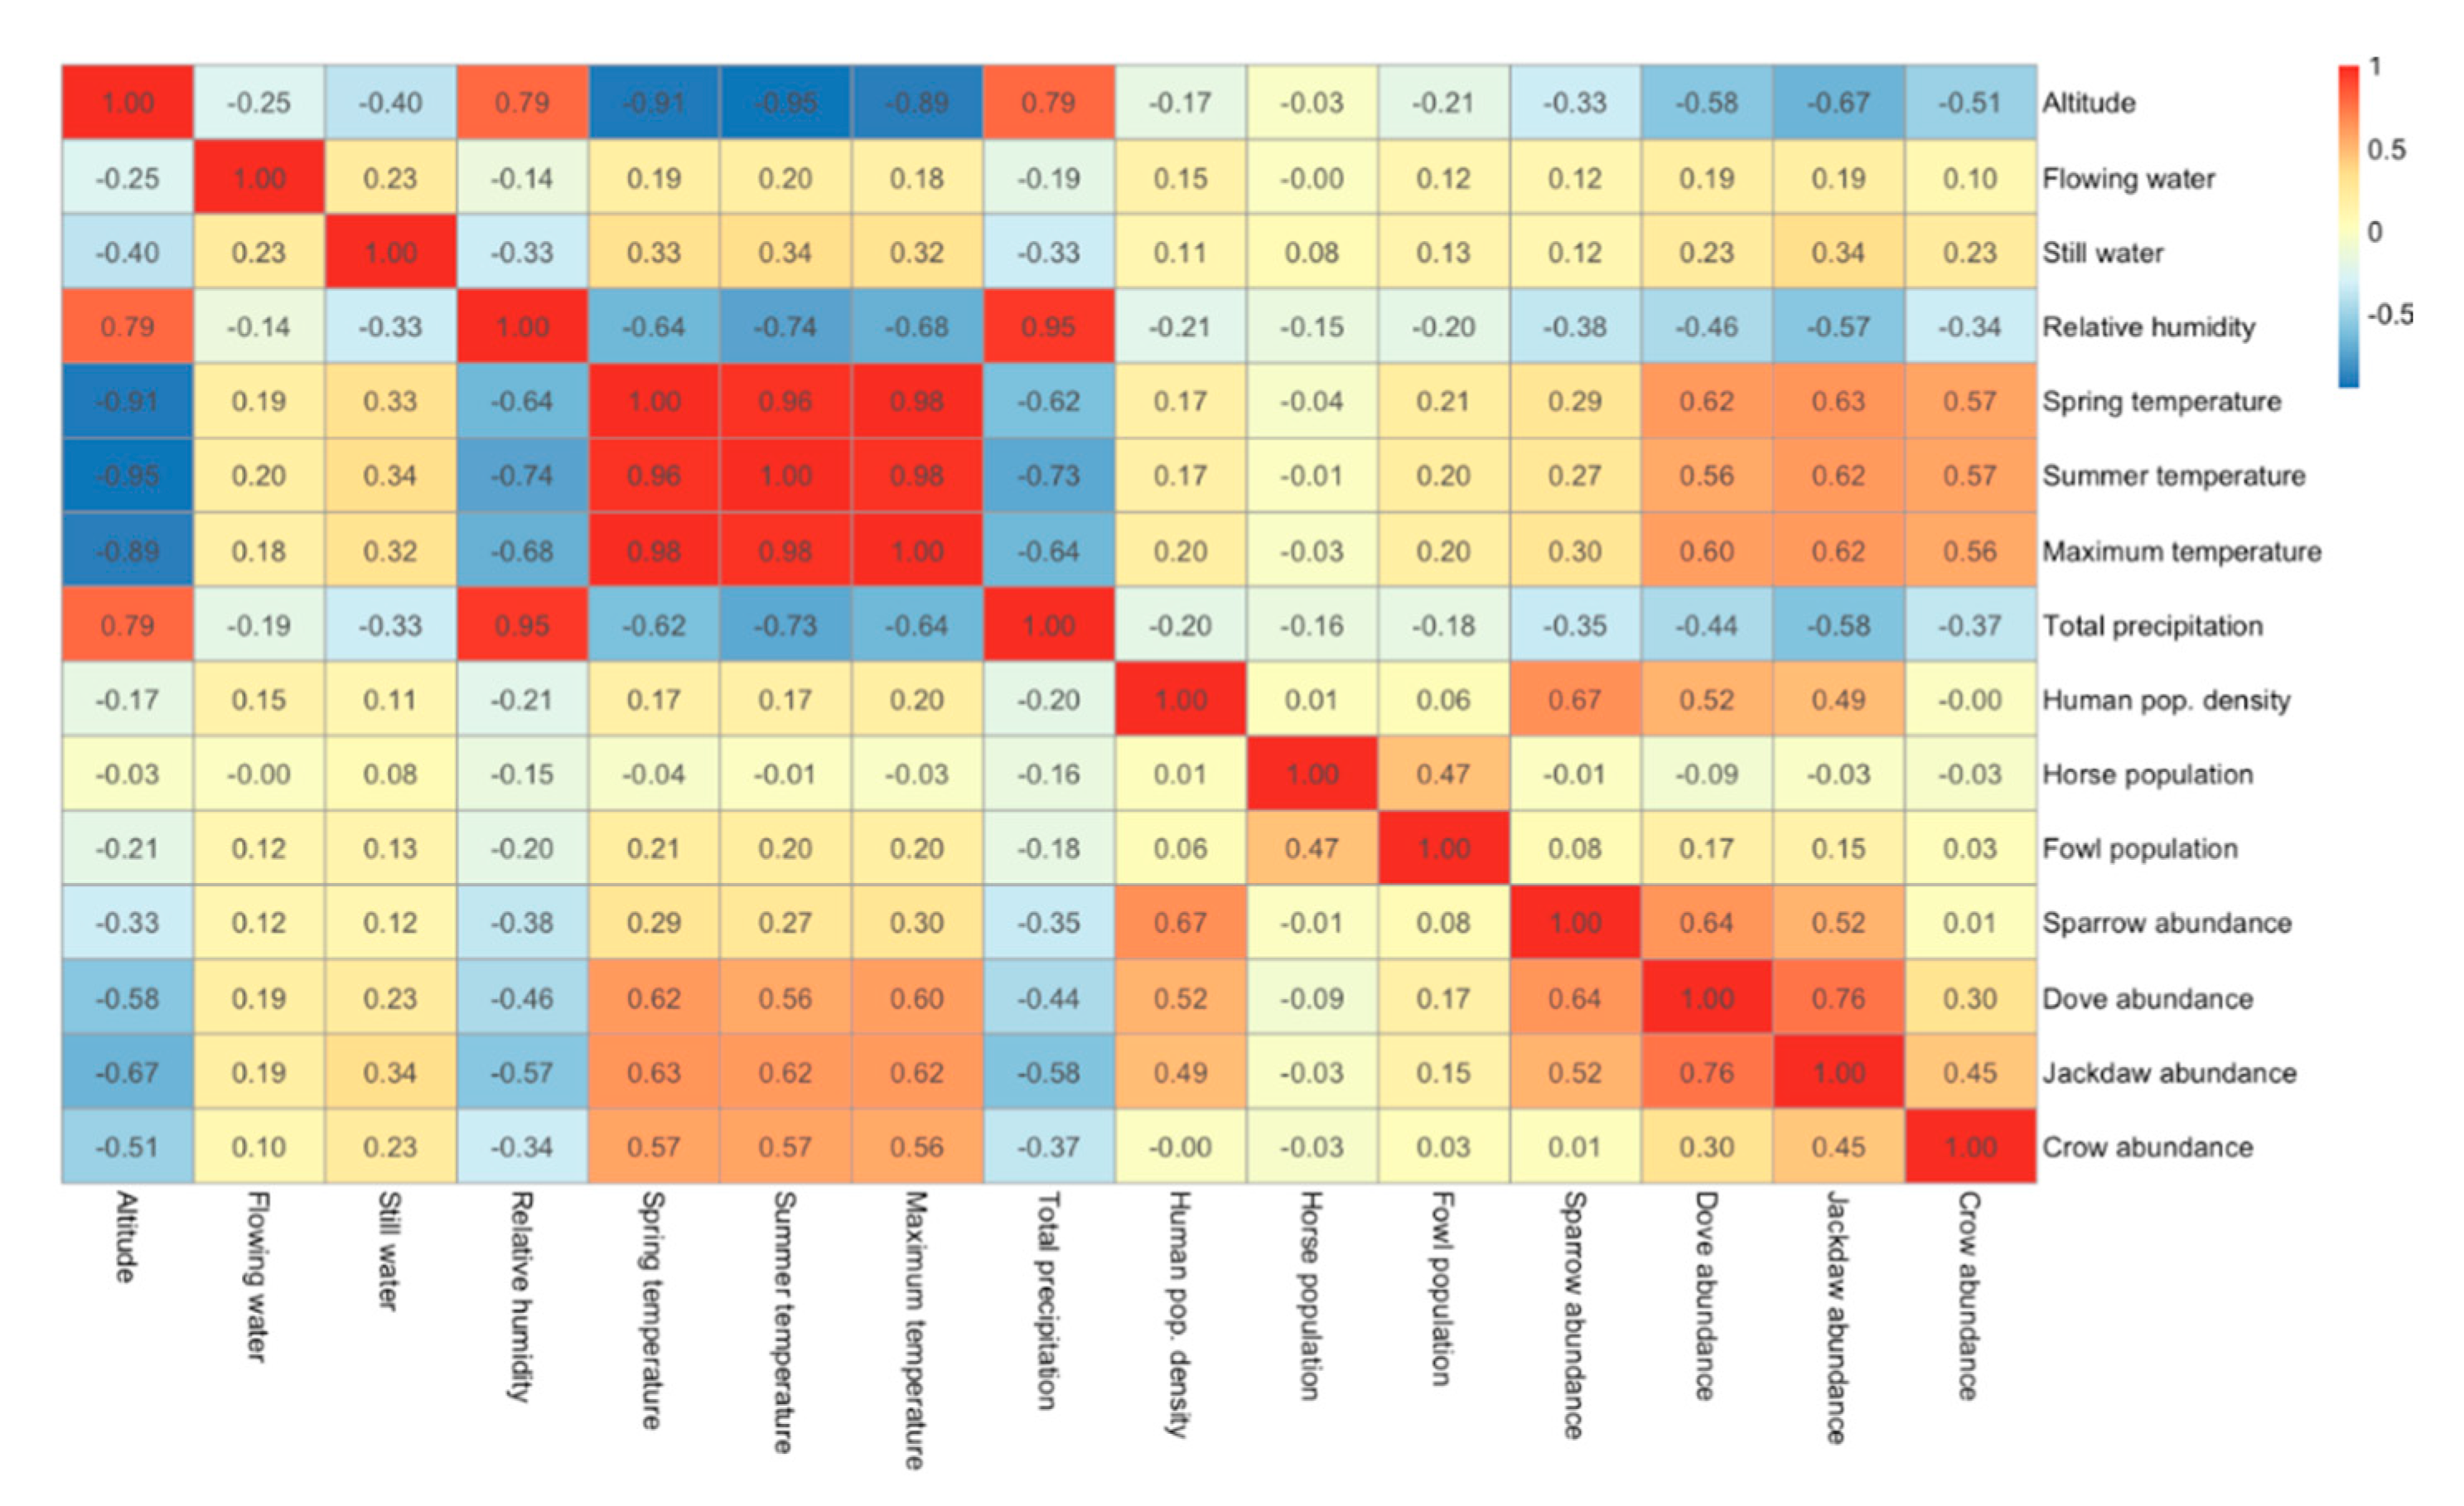
2.2.1. Correlation
2.2.2. Directional Distribution
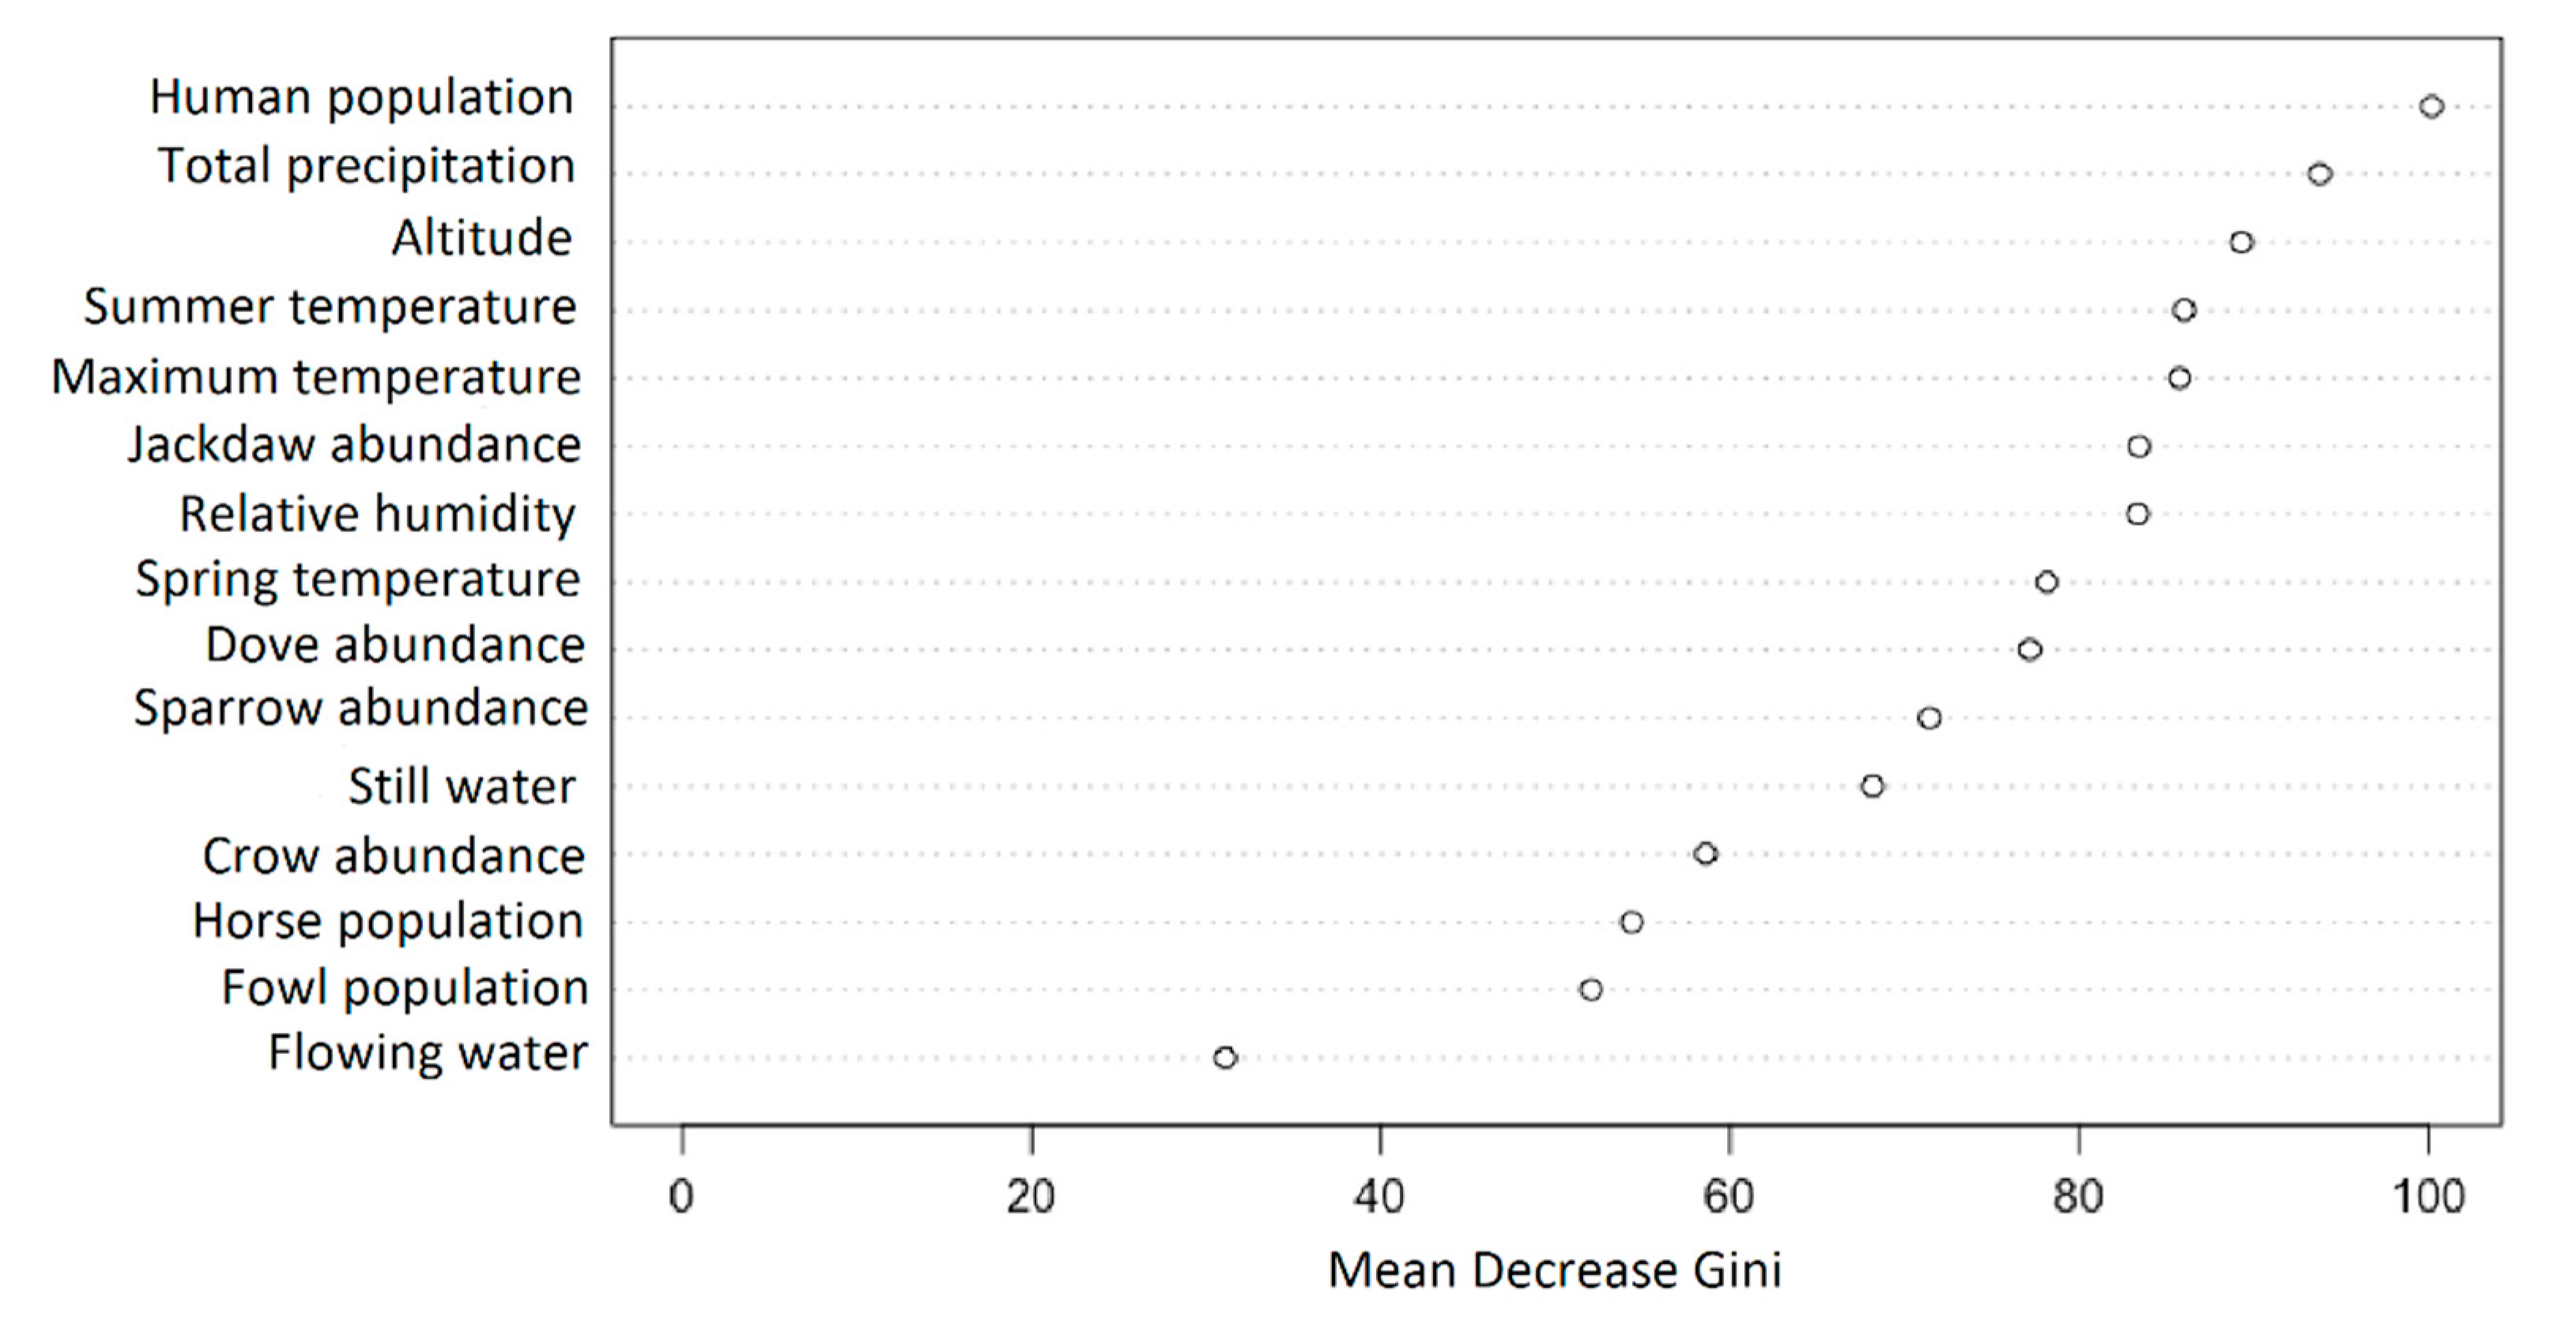
2.2.3. Random Forest
2.2.4. Model Validation
3. Results
4. Discussion
5. Conclusions
Supplementary Materials
Author Contributions
Funding
Conflicts of Interest
References
- Lustig, Y.; Sofer, D.; Bucris, E.D.; Mendelson, E. Surveillance and Diagnosis of West Nile Virus in the Face of Flavivirus Cross-Reactivity. Front. Microbiol. 2018, 9, 2421. [Google Scholar] [CrossRef] [PubMed]
- Chevalier, V.; Tran, A.; Durand, B. Predictive Modeling of West Nile Virus Transmission Risk in the Mediterranean Basin: How Far from Landing? IJERPH 2013, 11, 67–90. [Google Scholar] [CrossRef] [PubMed] [Green Version]
- Hubálek, Z.; Halouzka, J. West Nile Fever–A Reemerging Mosquito-Borne Viral Disease in Europe. Emerg. Infect. Dis. 1999, 5, 643–650. [Google Scholar] [CrossRef] [PubMed]
- Petersen, L.R.; Brault, A.C.; Nasci, R.S. West Nile Virus: Review of the Literature. JAMA 2013, 310, 308. [Google Scholar] [CrossRef] [PubMed]
- Tran, A.; Sudre, B.; Paz, S.; Rossi, M.; Desbrosse, A.; Chevalier, V.; Semenza, J.C. Environmental predictors of West Nile fever risk in Europe. Int. J. Health Geogr. 2014, 13, 26. [Google Scholar] [CrossRef] [PubMed] [Green Version]
- Smithburn, K.C.; Hughes, T.P.; Burke, A.W.; Paul, J.H. A Neurotropic Virus Isolated from the Blood of a Native of Uganda 1. Am. J. Trop. Med. Hyg. 1940, S1–S20, 471–492. [Google Scholar] [CrossRef]
- Melnick, J.L.; Paul, J.R.; Riordan, J.T.; Barnett, V.H.; Goldblum, N.; Zabin, E. Isolation from Human Sera in Egypt of a Virus Apparently Identical to West Nile Virus. Exp. Biol. Med. 1951, 77, 661–665. [Google Scholar] [CrossRef] [PubMed]
- Work, T.H.; Hurlbut, H.S.; Taylor, R.M. Isolation of West Nile Virus from Hooded Crow and Rock Pigeon in the Nile Delta. Exp. Biol. Med. 1953, 84, 719–722. [Google Scholar] [CrossRef] [PubMed]
- Hannoun, C.; Panthier, R.; Mouchet, J.; Eouzan, J.P. Isolement en France du virus West-Nile à partir de malades et du vecteur Culex modestus Ficalbi. Comptes Rendus Hebd. Seances Acad. Sci. 1964, 259, 4170. [Google Scholar]
- Chumakov, M.P.; Belyaeva, A.P.; Butenko, A.M. Isolation and study of an original virus from Hyalomma plumbeum ticks and from the blood of a febrile patient in the Astrakhan region. Materialy XI Nauchnoi Sessii Instituta Poliomielita i Virusnykh Encefalitov 1964, 5–7. [Google Scholar]
- Camp, J.V.; Nowotny, N. The knowns and unknowns of West Nile virus in Europe: What did we learn from the 2018 outbreak? Expert Rev. Anti-Infect. Ther. 2020, 18, 145–154. [Google Scholar] [CrossRef]
- Tsai, T.; Popovici, F.; Cernescu, C.; Campbell, G.; Nedelcu, N. West Nile encephalitis epidemic in southeastern Romania. Lancet 1998, 352, 767–771. [Google Scholar] [CrossRef]
- Cernescu, C.; Nedelcu, N.; Tardei, G.; Ruta, S.; Tsai, T.F. Continued Transmission of West Nile Virus to Humans in Southeastern Romania, 1997–1998. J. Infect. Dis. 2000, 181, 710–712. [Google Scholar] [CrossRef]
- Sirbu, A.; Ceianu, C.S.; Panculescu-Gatej, R.I.; Vazquez, A.; Tenorio, A.; Rebreanu, R.; Niedrig, M.; Nicolescu, G.; Pistol, A. Outbreak of West Nile virus infection in humans, Romania, July to October 2010. Eurosurveillance 2011, 16, 19762. [Google Scholar]
- Dinu, S.; Cotar, A.; Pănculescu-Gătej, I.; Fălcuţă, E.; Prioteasa, F.; Sîrbu, A.; Oprişan, G.; Bădescu, D.; Reiter, P.; Ceianu, C. West Nile virus circulation in south-eastern Romania, 2011 to 2013. Eurosurveillance 2015, 20, 21130. [Google Scholar] [CrossRef] [PubMed] [Green Version]
- Cotar, A.I.; Fălcuță, E.; Dinu, S.; Necula, A.; Bîrluțiu, V.; Ceianu, C.S.; Prioteasa, F.L. West Nile virus lineage 2 in Romania, 2015–2016: Co-circulation and strain replacement. Parasites Vectors 2018, 11, 562. [Google Scholar] [CrossRef] [PubMed] [Green Version]
- Transmission of West Nile Virus, June to December 2018—Table of Cases, 2018 Transmission Season. Available online: https://www.ecdc.europa.eu/en/publications-data/transmission-west-nile-virus-june-december-2018-table-cases-2018-transmission (accessed on 20 July 2020).
- Weekly Updates: 2020 West Nile Virus Transmission Season. Available online: https://www.ecdc.europa.eu/en/west-nile-fever/surveillance-and-disease-data/disease-data-ecdc (accessed on 20 July 2020).
- Paz, S.; Semenza, J. Environmental Drivers of West Nile Fever Epidemiology in Europe and Western Asia—A Review. Int. J. Environ. Res. Public Health 2013, 10, 3543–3562. [Google Scholar] [CrossRef] [Green Version]
- Marcantonio, M.; Rizzoli, A.; Metz, M.; Rosà, R.; Marini, G.; Chadwick, E.; Neteler, M. Identifying the Environmental Conditions Favouring West Nile Virus Outbreaks in Europe. PLoS ONE 2015, 10, e0121158. [Google Scholar] [CrossRef] [Green Version]
- Paz, S.; Malkinson, D.; Green, M.S.; Tsioni, G.; Papa, A.; Danis, K.; Sirbu, A.; Ceianu, C.; Katalin, K.; Ferenczi, E.; et al. Permissive Summer Temperatures of the 2010 European West Nile Fever Upsurge. PLoS ONE 2013, 8, e56398. [Google Scholar] [CrossRef] [Green Version]
- Reisen, W.K.; Fang, Y.; Martinez, V.M. Avian Host and Mosquito (Diptera: Culicidae) Vector Competence Determine the Efficiency of West Nile and St. Louis Encephalitis Virus Transmission. J. Med. Entomol. 2005, 42, 367–375. [Google Scholar] [CrossRef]
- Rappole, J.H.; Hubalek, Z. Migratory birds and West Nile virus. J. Appl. Microbiol. 2003, 94, 47–58. [Google Scholar] [CrossRef]
- Young, S.G.; Tullis, J.A.; Cothren, J. A remote sensing and GIS-assisted landscape epidemiology approach to West Nile virus. Appl. Geogr. 2013, 45, 241–249. [Google Scholar] [CrossRef]
- Petrisor, A.-I.; Ianos, I.; Talanga, C. Land Cover and Use Changes Focused on the Urbanization Processes in Romania. Environ. Eng. Manag. J. 2010, 9, 765–771. [Google Scholar] [CrossRef]
- Păstrav, I.-R.; Domșa, C.; Mihalca, A.D. Synopsis of the mosquitoes (Diptera: Culicidae) of Romania. Zootaxa 2020, 4772, 54–88. [Google Scholar] [CrossRef] [PubMed]
- Checklist of the Birds of Romania. Milvus Group. 2017. Available online: https://milvus.ro/en/birds/lista-speciilor-de-pasari-din-romania/ (accessed on 4 November 2020).
- Newton, I.; Brockie, K. The Migration Ecology of Birds; Elsevier/Academic Press: Amsterdam, The Netherlands, 2008; ISBN 978-0-12-517367-4. [Google Scholar]
- Geoportal ANCPI. Available online: http://geoportal.ancpi.ro/ (accessed on 20 July 2020).
- WorldClim. Available online: https://www.worldclim.org/ (accessed on 20 July 2020).
- Copernicus Land Monitoring Service. Available online: https://land.copernicus.eu/ (accessed on 20 July 2020).
- Kriticos, D.J.; Webber, B.L.; Leriche, A.; Ota, N.; Macadam, I.; Bathols, J.; Scott, J.K. CliMond: Global high-resolution historical and future scenario climate surfaces for bioclimatic modelling: CliMond: Climate surfaces for bioclimatic modelling. Methods Ecol. Evol. 2012, 3, 53–64. [Google Scholar] [CrossRef]
- Bun Venit la Institutul Național de Statistică. Institutul Național de Statistică. Available online: https://insse.ro/cms/ (accessed on 20 July 2020).
- Evans, J.D. Straightforward Statistics for the Behavioral Sciences; Brooks/Cole Pub. Co: Pacific Grove, CA, USA, 1996; ISBN 978-0-534-23100-2. [Google Scholar]
- Jolliffe, I.T.; Stephenson, D.B. (Eds.) Forecast Verification: A Practitioner’s Guide in Atmospheric Science, 2nd ed.; Wiley-Blackwell: Chichester, UK, 2012; ISBN 978-0-470-66071-3. [Google Scholar]
- Welcome to the QGIS Project! Available online: https://qgis.org/en/site/ (accessed on 20 July 2020).
- Segal, M.R. Machine Learning Benchmarks and Random Forest Regression; Center for Bioinformatics and Molecular Biostatistics: San Francisco, CA, USA, 2004. [Google Scholar]
- Cutler, D.R.; Edwards, T.C.; Beard, K.H.; Cutler, A.; Hess, K.T.; Gibson, J.; Lawler, J.J. Random Forests for Classification in Ecology. Ecology 2007, 88, 2783–2792. [Google Scholar] [CrossRef]
- R Core Team. R: A Language and Environment for Statistical Computing; R Foundation for Statistical Computing: Vienna, Austria, 2013. [Google Scholar]
- Menardi, G.; Torelli, N. Training and assessing classification rules with imbalanced data. Data Min. Knowl. Discov. 2014, 28, 92–122. [Google Scholar] [CrossRef]
- Lunardon, N.; Menardi, G.; Torelli, N. Rose: A Package for Binary Imbalanced Learning. R J. 2014, 6, 79–89. [Google Scholar] [CrossRef] [Green Version]
- Landis, J.R.; Koch, G.G. The measurement of observer agreement for categorical data. Biometrics 1977, 33, 159–174. [Google Scholar] [CrossRef] [Green Version]
- Altman, D.G. Practical Statistics for Medical Research; Chapman and Hall: London, UK, 1991; p. 404. [Google Scholar]
- Monaco, F.; Savini, G.; Calistri, P.; Polci, A.; Pinoni, C.; Bruno, R.; Lelli, R. 2009 West Nile disease epidemic in Italy: First evidence of overwintering in Western Europe? Res. Vet. Sci. 2011, 91, 321–326. [Google Scholar] [CrossRef]
- Romanca, C.; Vladimirescu, A.; Tsai, T.F.; Ceianu, C.; Karabatsos, N.; Lanciotti, R.; Savage, H.M.; Ungureanu, A.; Laiv, L.; Nicolescu, G. Entomologic and avian investigations of an epidemic of West Nile fever in Romania in 1996, with serologic and molecular characterization of a virus isolate from mosquitoes. Am. J. Trop. Med. Hyg. 1999, 61, 600–611. [Google Scholar] [CrossRef] [Green Version]
- Bradley, C.A.; Gibbs, S.E.J.; Altizer, S. Urban Land Use Predicts West Nile Virus Exposure in Songbirds. Ecol. Appl. 2008, 18, 1083–1092. [Google Scholar] [CrossRef] [Green Version]
- Kramer, L.D.; Styer, L.M.; Ebel, G.D. A Global Perspective on the Epidemiology of West Nile Virus. Annu. Rev. Entomol. 2008, 53, 61–81. [Google Scholar] [CrossRef] [Green Version]
- Goldberg, T.L.; Ruiz, M.O.; Hamer, G.L.; Brawn, J.D.; Kitron, U.D.; Hayes, D.B.; Loss, S.R.; Walker, E.D. Host Selection by Culex pipiens Mosquitoes and West Nile Virus Amplification. Am. J. Trop. Med. Hyg. 2009, 80, 268–278. [Google Scholar] [CrossRef] [Green Version]
- Goddard, M.A.; Dougill, A.J.; Benton, T.G. Scaling up from gardens: Biodiversity conservation in urban environments. Trends Ecol. Evol. 2010, 25, 90–98. [Google Scholar] [CrossRef]
- Rizzoli, A.; Silaghi, C.; Obiegala, A.; Rudolf, I.; Hubalek, Z.; Foldvari, G.; Plantard, O.; Vayssier-Taussat, M.; Bonnet, S.; Spitalska, E.; et al. Ixodes ricinus and Its Transmitted Pathogens in Urban and Peri-Urban Areas in Europe: New Hazards and Relevance for Public Health. Front. Public Health 2014, 2. [Google Scholar] [CrossRef]
- Ludu Oslobanu, E.L.; Mihu-Pintilie, A.; Anită, D.; Anita, A.; Lecollinet, S.; Savuta, G. West Nile Virus Reemergence in Romania: A Serologic Survey in Host Species. Vector Borne Zoonotic Dis. 2014, 14, 330–337. [Google Scholar] [CrossRef]
- Vasić, A.; Oșlobanu, L.; Marinov, M.; Crivei, L.; Rățoi, I.; Aniță, A.; Aniță, D.; Doroșencu, A.; Alexe, V.; Răileanu, S.; et al. Evidence of West Nile Virus (WNV) Circulation in Wild Birds and WNV RNA Negativity in Mosquitoes of the Danube Delta Biosphere Reserve, Romania, 2016. Trop. Med. 2019, 4, 116. [Google Scholar] [CrossRef] [Green Version]
- Calistri, P. Epidemiology of West Nile in Europe and in the Mediterranean Basin. TOV J. 2010, 4, 29–37. [Google Scholar] [CrossRef] [Green Version]
- Lim, S.M.; Brault, A.C.; van Amerongen, G.; Sewbalaksing, V.D.; Osterhaus, A.D.M.E.; Martina, B.E.E.; Koraka, P. Susceptibility of European jackdaws (Corvus monedula) to experimental infection with lineage 1 and 2 West Nile viruses. J. Gen. Virol. 2014, 95, 1320–1329. [Google Scholar] [CrossRef] [PubMed]
- Eder, M.; Cortes, F.; Teixeira de Siqueira Filha, N.; Araújo de França, G.V.; Degroote, S.; Braga, C.; Ridde, V.; Turchi Martelli, C.M. Scoping review on vector-borne diseases in urban areas: Transmission dynamics, vectorial capacity and co-infection. Infect. Dis. Poverty 2018, 7, 90. [Google Scholar] [CrossRef]
- Johnson, G.D.; Eidson, M.; Schmit, K.; Ellis, A.; Kulldorff, M. Geographic Prediction of Human Onset of West Nile Virus Using Dead Crow Clusters: An Evaluation of Year 2002 Data in New York State. Am. J. Epidemiol. 2006, 163, 171–180. [Google Scholar] [CrossRef]
- Abdelrazec, A.; Lenhart, S.; Zhu, H. Transmission dynamics of West Nile virus in mosquitoes and corvids and non-corvids. J. Math. Biol. 2014, 68, 1553–1582. [Google Scholar] [CrossRef]
- Shaw, L.M.; Chamberlain, D.; Evans, M. The House Sparrow Passer domesticus in urban areas: Reviewing a possible link between post-decline distribution and human socioeconomic status. J. Ornithol. 2008, 149, 293–299. [Google Scholar] [CrossRef]
- Komar, N.; Panella, N.A.; Burns, J.E.; Dusza, S.W.; Mascarenhas, T.M.; Talbot, T.O. Serologic Evidence for West Nile Virus Infection in Birds in the New York City Vicinity During an Outbreak in 1999. Emerg. Infect. Dis. 2001, 7, 621–623. [Google Scholar] [CrossRef]
- Taylor, R.M.; Rizk, F.; Work, T.H.; Hurlbut, H.S. A Study of the Ecology of West Nile Virus in Egypt 1. Am. J. Trop. Med. Hyg. 1956, 5, 579–620. [Google Scholar] [CrossRef]
- Panella, N.A.; Young, G.; Komar, N. Experimental infection of Eurasian collared-dove (Streptopelia decaocto) with West Nile virus. J. Vector Ecol. 2013, 38, 210–214. [Google Scholar] [CrossRef]


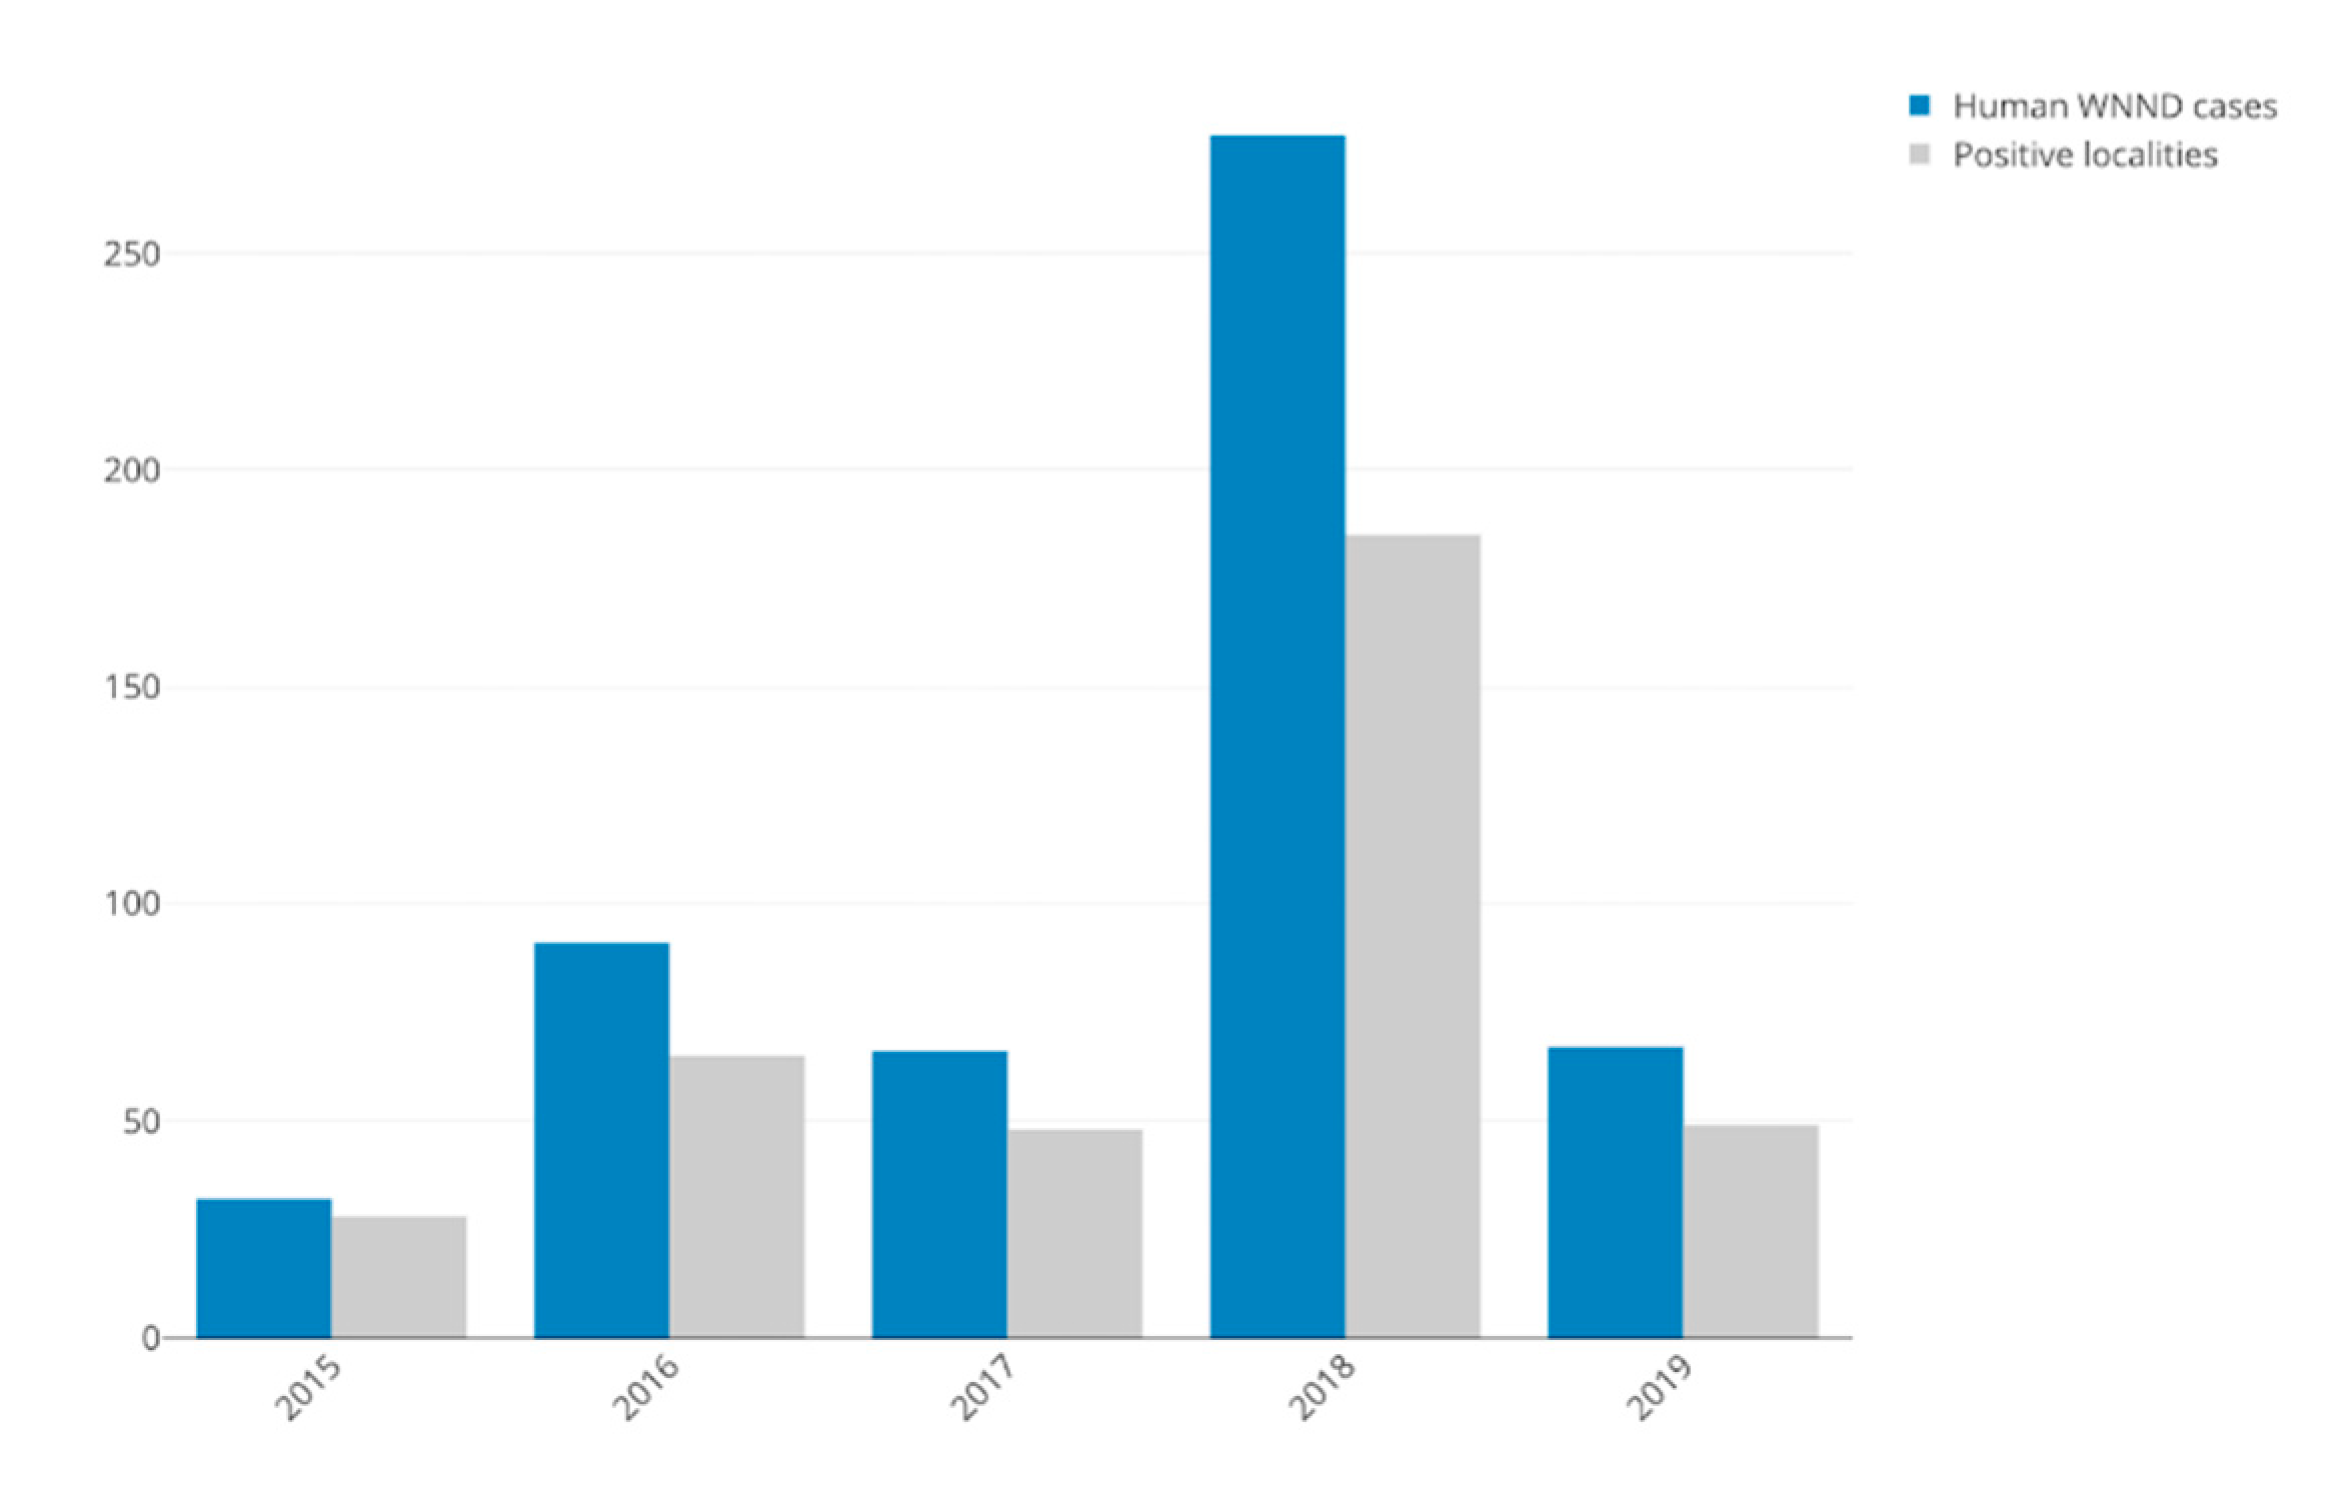
| Variable | 2015 | 2016 | 2017 | 2018 | 2019 | Total |
|---|---|---|---|---|---|---|
| Total Human WNND Cases | 32 | 93 | 66 | 277 | 67 | 535 |
| Total Positive Localities (% of total localities) | 28 (0.87%) | 65 (2.04%) | 48 (1.50%) | 185 (5.80%) | 49 (1.53%) | 308 * |
| New Positive Localities (percent out of annual total) | not calculated | 59 (90.8%) | 36 (75%) | 170 (91.9%) | 33 (67.3%) | - |
| Localities that Turned Negative in the Next Year (percent out of annual total) | 22 (78.6%) | 53 (81.5%) | 33 (68.75%) | 169 (91.4%) | not calculated | - |
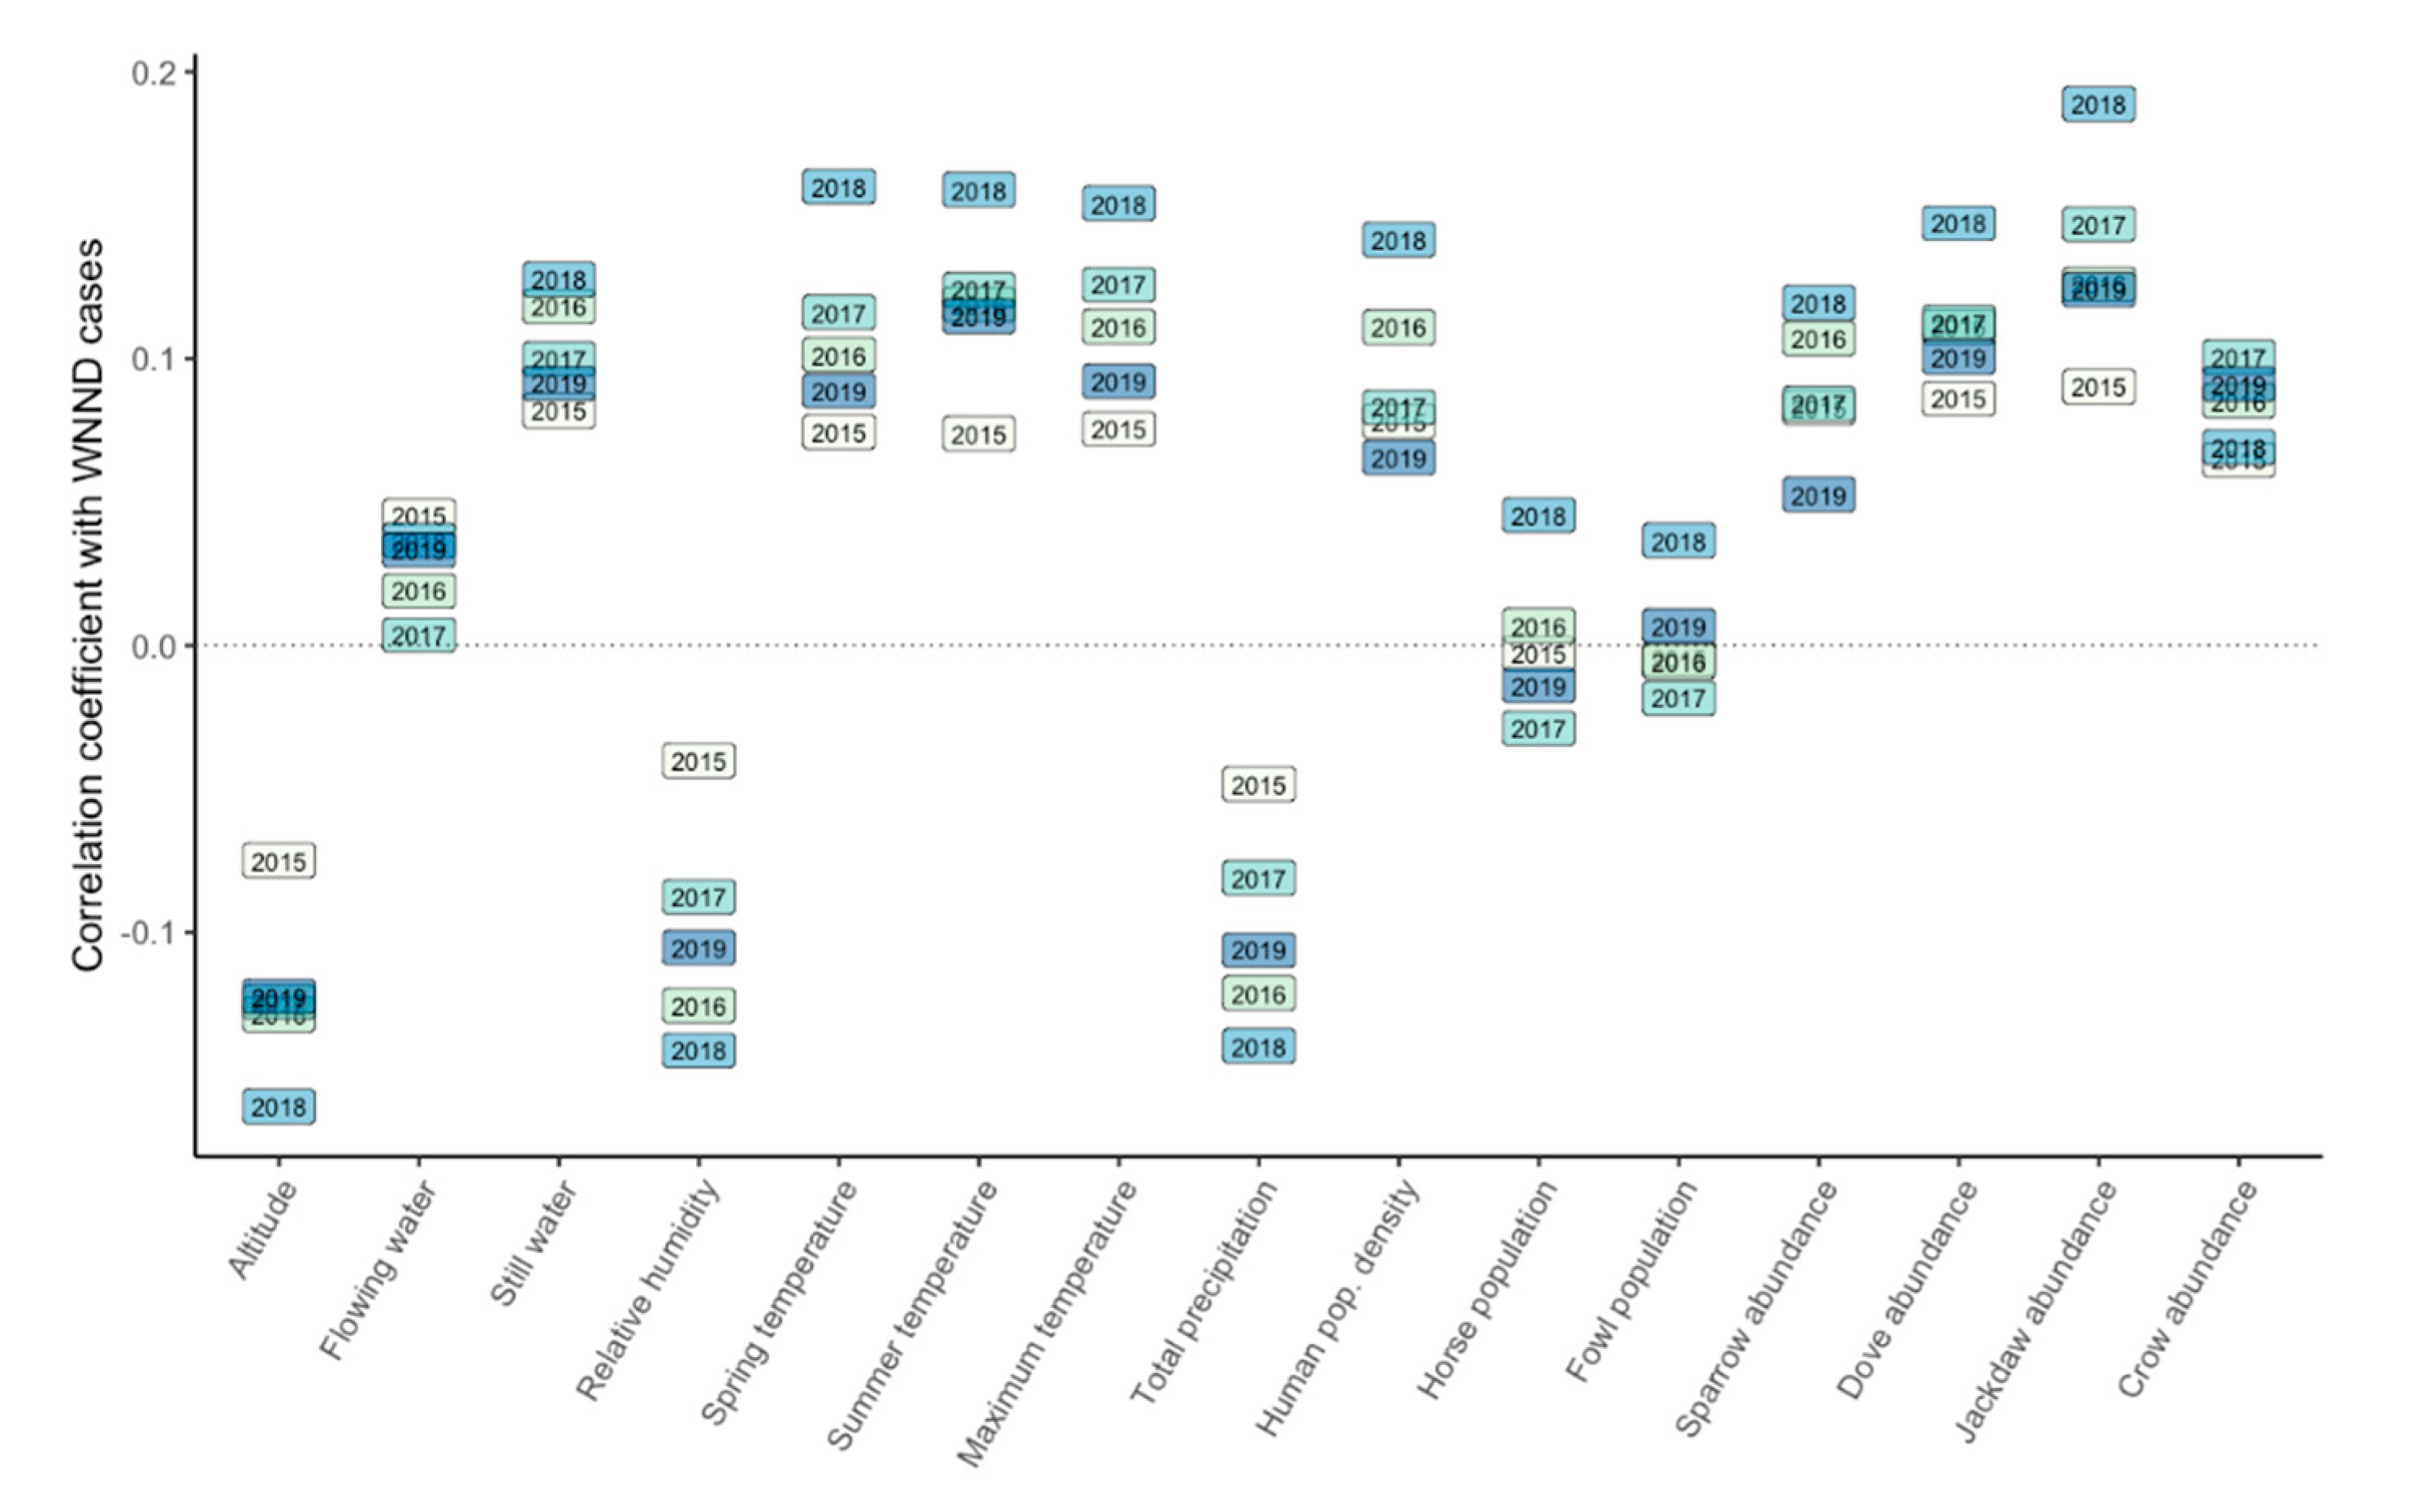
| Year | 2015 | 2016 | 2017 | 2018 | 2019 |
|---|---|---|---|---|---|
| Spearman’s rank correlation coefficient | 0.2972029 | 0.4517637 | 0.3884571 | 0.7636387 | 0.3927736 |
| Variable | Balanced Accuracy | Sensitivity | Specificity | Cohen’s Kappa | McNemar’s Test p Value |
|---|---|---|---|---|---|
| Verification metrics | 0.94 | 0.911 | 0.967 | 0.906 | 0.0002671 |
Publisher’s Note: MDPI stays neutral with regard to jurisdictional claims in published maps and institutional affiliations. |
© 2020 by the authors. Licensee MDPI, Basel, Switzerland. This article is an open access article distributed under the terms and conditions of the Creative Commons Attribution (CC BY) license (http://creativecommons.org/licenses/by/4.0/).
Share and Cite
Coroian, M.; Petrić, M.; Pistol, A.; Sirbu, A.; Domșa, C.; Mihalca, A.D. Human West Nile Meningo-Encephalitis in a Highly Endemic Country: A Complex Epidemiological Analysis on Biotic and Abiotic Risk Factors. Int. J. Environ. Res. Public Health 2020, 17, 8250. https://doi.org/10.3390/ijerph17218250
Coroian M, Petrić M, Pistol A, Sirbu A, Domșa C, Mihalca AD. Human West Nile Meningo-Encephalitis in a Highly Endemic Country: A Complex Epidemiological Analysis on Biotic and Abiotic Risk Factors. International Journal of Environmental Research and Public Health. 2020; 17(21):8250. https://doi.org/10.3390/ijerph17218250
Chicago/Turabian StyleCoroian, Mircea, Mina Petrić, Adriana Pistol, Anca Sirbu, Cristian Domșa, and Andrei Daniel Mihalca. 2020. "Human West Nile Meningo-Encephalitis in a Highly Endemic Country: A Complex Epidemiological Analysis on Biotic and Abiotic Risk Factors" International Journal of Environmental Research and Public Health 17, no. 21: 8250. https://doi.org/10.3390/ijerph17218250