Associations between Governmental Policies to Improve the Nutritional Quality of Supermarket Purchases and Individual, Retailer, and Community Health Outcomes: An Integrative Review


Abstract
:1. Introduction
2. Methods
2.1. Policy Identification
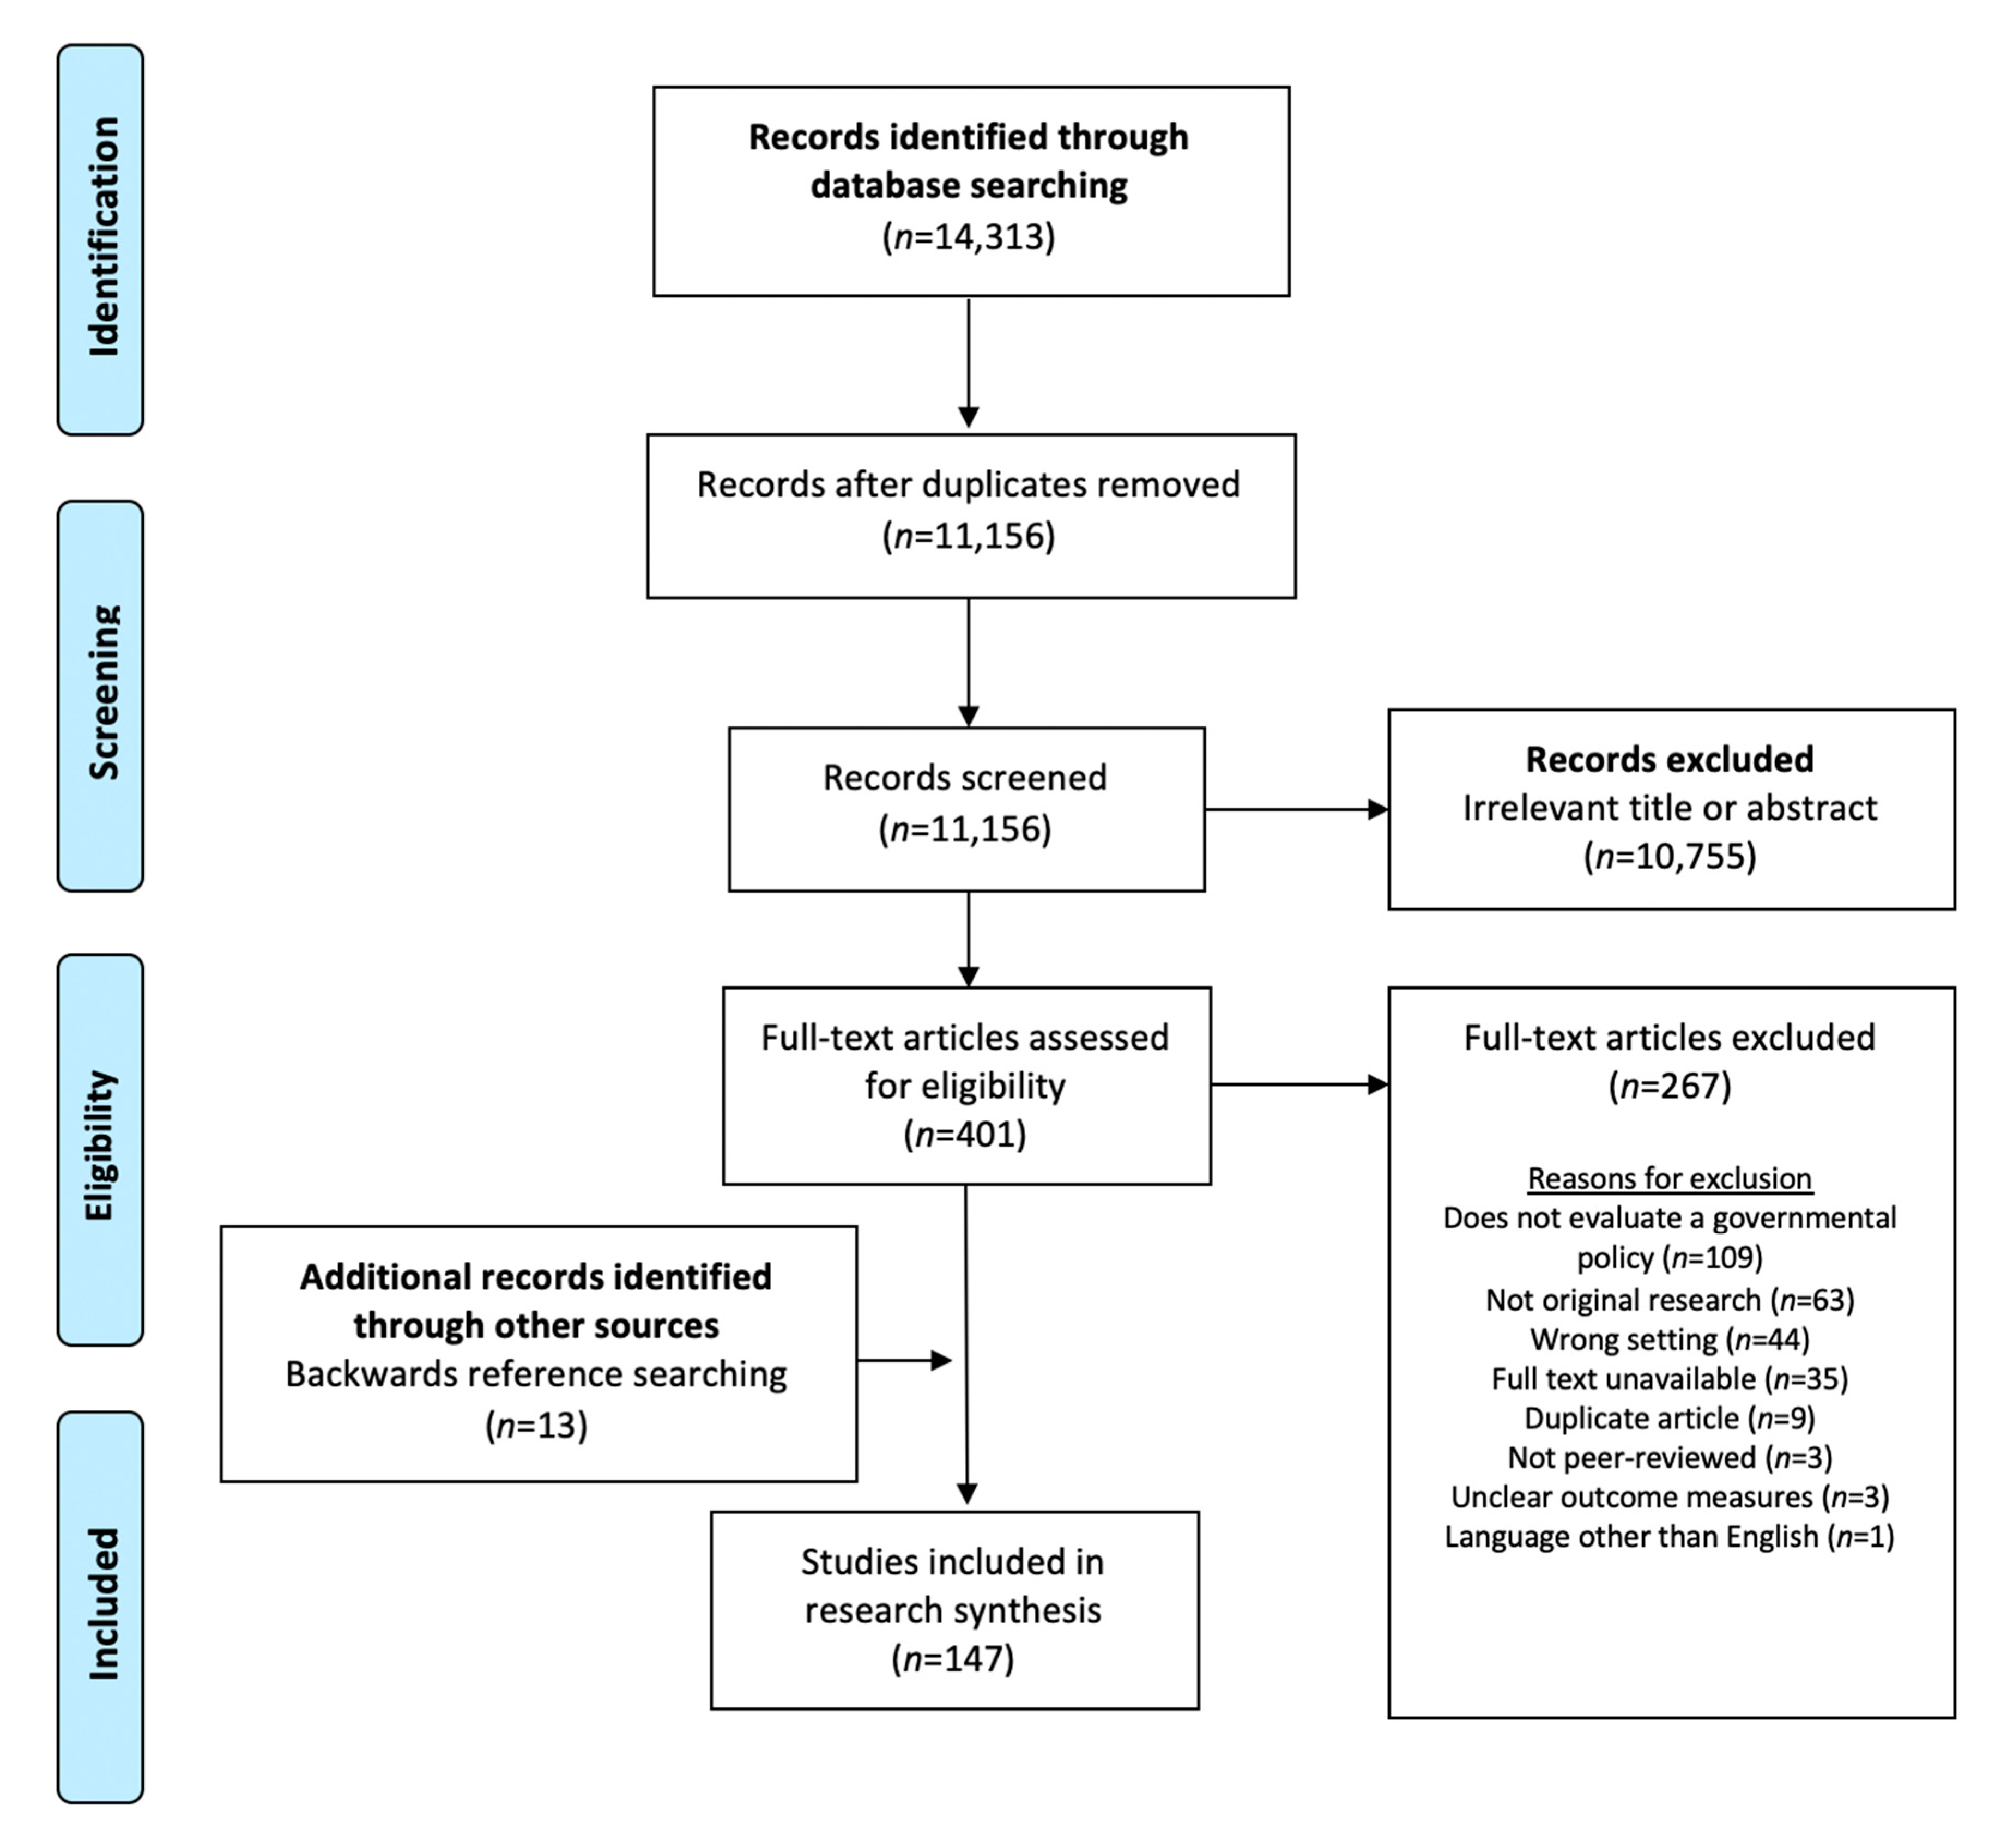
2.2. Search Strategy and Inclusion Criteria
2.3. Evidence Synthesis
3. Results
3.1. Nutrition Labeling
Require Calorie Labeling of Prepared Food in Supermarkets
3.2. Economic Tools to Address Food Affordability and Purchase Incentives
3.2.1. Increase Supplemental Nutrition Assistance Program (SNAP) Benefits
3.2.2. Provide Financial Incentives for Fruits and Vegetables to Low-Income Households
3.2.3. Tax Sweetened Beverages
3.2.4. Revise Composition and Quantities of Foods Provided through the USDA Special Supplemental Nutrition Program for Women, Infants and Children (WIC)
3.3. Incentives and Rules to Create a Healthy Retail Environment
3.3.1. Provide Financial Assistance to Supermarkets to Locate in Underserved Areas
3.3.2. Allow Payment for Online Grocery Purchases with SNAP
4. Discussion
Strengths and Limitations
5. Conclusions
Author Contributions
Funding
Acknowledgments
Conflicts of Interest
Appendix A. Search Terms
| Search #1 |
| Terms related to supermarket |
| (grocer* OR supermarket OR store OR Retail* OR outlet OR e-commerce OR mercado) |
| AND |
| Terms related to food and beverage |
| food OR foods OR beverage* OR fruit OR fruits OR vegetable* OR snack* OR drink OR drinks OR lunch OR dinner* OR breakfast OR meat OR poultry OR beef OR chicken OR fish OR milk OR cheese OR yogurt OR juice OR soda OR grain OR grains OR meal OR bean OR beans OR nut OR nuts OR candy OR sweets OR cookies OR chips OR “ice cream” OR sugar OR salt OR sugar-sweetened OR “sugar sweetened” OR sweet OR nutrition* OR calorie OR calories |
| AND |
| Terms related to policy |
| policy OR policies OR Law OR laws OR regulat* OR ordinance* OR statute* OR tax OR taxes OR taxation OR incentive* OR “healthy food financing” OR subsid* OR “menu labeling” OR “calorie labeling” OR WIC OR “supplemental nutrition” OR “food stamps” OR access OR rule OR rules OR “retail expansion” OR “community development” OR “food trust” OR “food desert” OR loan OR loans OR “healthy food business” OR “healthy neighborhood” OR “federal nutrition program” OR “fresh food fund” OR “grocery financing” OR zoning OR “minimum stocking” OR “staple food” OR “excess food” OR “food waste” OR “grocery store development program” OR “closer to my grocer” OR license OR licensing OR permit OR permitting OR “Baton Rouge” OR frameworks OR “grocery access” OR “fresh food financing” OR “supermarket access” OR “healthy food center” OR “neighborhood development” OR “healthy families” OR “fresh food retailer” |
| Search #2 |
| Terms related to beverage taxes |
| (“sweetened beverage*” OR “sugary drink*” OR “sugary beverage*”) AND (tax OR taxes OR taxation) |
| Search #3 |
| Terms related to SNAP benefit increases |
| (ARRA OR (benefit AND increase)) AND “Supplemental Nutrition Assistance Program” |
| Search #4 |
| Terms related to WIC food package revisions |
| ((WIC AND (fruit* OR vegetable*) AND voucher) |
| OR |
| (((WIC OR “Special Supplemental Nutrition Program for Women, Infants, and Children”) AND (“food package OR revisions))) AND (“2014/04”[Date–Publication]: “3000”[Date-Publication])) |
| Search #5 |
| Terms related to the online purchasing pilot |
| “online grocery” OR “online purchas* pilot” OR (online AND shopping AND “Supplemental Nutrition Assistance Program”) |
| Search #6 |
| Terms related to produce prescription programs |
| ((fruit OR vegetable* OR produce) AND (prescription OR rx)) AND (supermarket OR grocer*) |
References
- Afshin, A.; Sur, P.J.; Fay, K.A.; Cornaby, L.; Ferrara, G.; Salama, J.S.; Mullany, E.C.; Abate, K.H.; Abbafati, C.; Abebe, Z. Health effects of dietary risks in 195 countries, 1990–2017: A systematic analysis for the Global Burden of Disease Study 2017. Lancet 2019, 393, 1958–1972. [Google Scholar] [CrossRef] [Green Version]
- Jardim, T.V.; Mozaffarian, D.; Abrahams-Gessel, S.; Sy, S.; Lee, Y.; Liu, J.; Huang, Y.; Rehm, C.; Wilde, P.; Micha, R. Cardiometabolic disease costs associated with suboptimal diet in the United States: A cost analysis based on a microsimulation model. PLoS Med. 2019, 16, e1002981. [Google Scholar] [CrossRef] [PubMed] [Green Version]
- Hoffman, J.S.; Salerno, J.; Moss, A.; Dunne, B.; Fineberg, H.V.; Brownell, K.D. The Weight of the Nation: Surprising Lessons About Diets, Food, and Fat from the Extraordinary Series from HBO Documentary Series; St. Martin’s Press: New York, NY, USA, 2012. [Google Scholar]
- Food-PRICE: Food Policy Review and Intervention Cost-Effectiveness. Available online: https://www.food-price.org/ (accessed on 28 July 2020).
- Gortmaker, S.L.; Long, M.W.; Resch, S.C.; Ward, Z.J.; Cradock, A.L.; Barrett, J.L.; Wright, D.R.; Sonneville, K.R.; Giles, C.M.; Carter, R.C. Cost effectiveness of childhood obesity interventions: Evidence and methods for CHOICES. Am. J. Prev. Med. 2015, 49, 102–111. [Google Scholar] [CrossRef] [PubMed]
- Mancino, L.; Guthrie, J.; Ver Ploeg, M.; Lin, B.-H. Nutritional Quality of Foods Acquired by Americans: Findings from USDA’s National Household Food Acquisition and Purchase Survey; United States Department of Agriculture, Economic Research Service: Washington, DC, USA, 2018.
- Ver Ploeg, M.; Mancino, L.; Todd, J.E.; Clay, D.M.; Scharadin, B. Where Do Americans Usually Shop for Food and How Do They Travel to Get There? Initial Findings from the National Household Food Acquisition and Purchase Survey; United States Department of Agriculture, Economic Research Service: Washington, DC, USA, 2015.
- Glanz, K.; Bader, M.D.; Iyer, S. Retail grocery store marketing strategies and obesity: An integrative review. Am. J. Prev. Med. 2012, 42, 503–512. [Google Scholar] [CrossRef]
- Cohen, D.A.; Bogart, L.; Castro, G.; Rossi, A.D.; Williamson, S.; Han, B. Beverage marketing in retail outlets and The Balance Calories Initiative. Prev. Med. 2018, 115, 1–7. [Google Scholar] [CrossRef]
- Shan, Z.; Rehm, C.D.; Rogers, G.; Ruan, M.; Wang, D.D.; Hu, F.B.; Mozaffarian, D.; Zhang, F.F.; Bhupathiraju, S.N. Trends in dietary carbohydrate, protein, and fat intake and diet quality among US adults, 1999–2016. JAMA 2019, 322, 1178–1187. [Google Scholar] [CrossRef] [Green Version]
- An FTC Staff Study. Slotting Allowances in the Retail Grocery Industry: Selected Case Studies in Five Product Categories; Federal Trade Commission: Washington, DC, USA, 2003. [Google Scholar]
- Rivlin, G. Rigged Supermarket Shelves for Sale; Center for Science in the Public Interest: Washington, DC, USA, 2016. [Google Scholar]
- Moher, D.; Liberati, A.; Tetzlaff, J.; Altman, D.G.; Group, P. Preferred reporting items for systematic reviews and meta-analyses: The PRISMA statement. PLoS Med 2009, 6, e1000097. [Google Scholar] [CrossRef] [Green Version]
- World Cancer Research Fund. NOURISHING Database; World Cancer Research Fund International: London, UK, 2018. [Google Scholar]
- World Health Organization. Global database on the Implementation of Nutrition Action (GINA). In World Health Organization; World Health Organization: Geneva, Switzerland, 2012. [Google Scholar]
- Healthy Food Access Portal. Healthy Food Financing Funds. Available online: https://extranet.who.int/nutrition/gina/en/home/ (accessed on 28 July 2020).
- Growing Food Connections, Briefs. Growing Food Connections; Metropolitan Universities: Towson, MD, USA, 2017; p. 1. [Google Scholar]
- Healthy Food Policy Project. Available online: https://healthyfoodpolicyproject.org/ (accessed on 11 October 2020).
- Food and Drug Administration. Menu Labeling Requirements. Available online: https://www.fda.gov/food/food-labeling-nutrition/menu-labeling-requirements (accessed on 28 July 2020).
- Food and Drug Administration. Menu Labeling Social Media Toolkit for Consumer Outreach. Available online: https://www.fda.gov/food/nutrition-education-resources-materials/menu-labeling-social-media-toolkit-consumer-outreach (accessed on 28 July 2020).
- Supplemental Nutrition Assistance Program Participation and Costs; United States Department of Agriculture, Food and Nutrition Services: Washington, DC, USA, 2020.
- Center on Budget and Policy Priorities. Chart Book: SNAP Helps Struggling Families Put Food on the Table. Available online: https://www.cbpp.org/sites/default/files/atoms/files/3-13-12fa-chartbook.pdf (accessed on 28 July 2020).
- Center on Budget and Policy Priorities. Policy Basics: The Supplemental Nutrition Assistance Program (SNAP). Available online: https://www.cbpp.org/research/food-assistance/policy-basics-the-supplemental-nutrition-assistance-program-snap (accessed on 8 October 2020).
- Gordon, A.R.; Briefel, R.R.; Collins, A.M.; Rowe, G.M.; Klerman, J.A. Delivering summer electronic benefit transfers for children through the supplemental nutrition assistance program or the special supplemental nutrition program for women, infants, and children: Benefit use and impacts on food security and foods consumed. J. Acad. Nutr. Diet. 2017, 117, 367–375. [Google Scholar] [CrossRef] [PubMed]
- Almada, L.N.; Tchernis, R. Measuring effects of SNAP on obesity at the intensive margin. Econ. Hum. Biol. 2018, 31, 150–163. [Google Scholar] [CrossRef] [Green Version]
- United States Department of Agriculture. Local and Regional Foods. Available online: https://www.ers.usda.gov/agriculture-improvement-act-of-2018-highlights-and-implications/local-and-regional-foods/ (accessed on 28 July 2020).
- Healthy Food America. TAXING SUGARY DRINKS. Available online: http://www.healthyfoodamerica.org/taxing_sugary_drinks#:~:text=The%20evidence%20of%20harm%20from,diet%20drinks%20in%20beverage%20taxes (accessed on 28 July 2020).
- Institute of Medicine. WIC Food Packages: Time for a Change; The National Academies Press: Washington, DC, USA, 2006. [Google Scholar]
- Dietary Guidelines for Americans; United States Department of Health and Human Services, United States Department of Agriculture: Washington, DC, USA, 2005.
- Kleinmann, R. Pediatric Nutrition Handbook; American Academy of Pediatrics: Elk Grove Village, IL, USA, 2004. [Google Scholar]
- United States Department of Agriculture. Final Rule: Revisions in the WIC Food Packages. Available online: https://www.fns.usda.gov/wic/fr-030414 (accessed on 28 July 2020).
- The Food Trust. Special Report: HFFI Impacts. Available online: http://thefoodtrust.org/administrative/hffi-impacts (accessed on 28 July 2020).
- Lange, S.J.; Moore, L.V.; Galuska, D.A. Local government retail incentives for healthier food retailers in the USA, 2014. Public Health Nutr. 2019, 22, 2521–2529. [Google Scholar] [CrossRef] [PubMed]
- United States Department of Agriculture. FNS Launches the Online Purchasing Pilot. Available online: https://www.fns.usda.gov/snap/online-purchasing-pilot (accessed on 28 July 2020).
- Bachman, J.L.; Arigo, D. Reported Influences on Restaurant-Type Food Selection Decision Making in a Grocery Store Chain. J. Nutr. Educ. Behav. 2018, 50, 555–563. [Google Scholar] [CrossRef] [PubMed]
- Cleveland, L.P.; Simon, D.; Block, J.P. Compliance in 2017 with Federal Calorie Labeling in 90 Chain Restaurants and 10 Retail Food Outlets Prior to Required Implementation. Am. J. Public Health 2018, 108, 1099–1102. [Google Scholar] [CrossRef]
- Nianogo, R.A.; Kuo, T.; Smith, L.V.; Arah, O.A. Associations between self-perception of weight, food choice intentions, and consumer response to calorie information: A retrospective investigation of public health center clients in Los Angeles County before the implementation of menu-labeling regulation. BMC Public Health 2016, 16, 8. [Google Scholar] [CrossRef] [PubMed] [Green Version]
- Andrews, M.; Bhatta, R.; Ploeg, M.V. An Alternative to Developing Stores in Food Deserts: Can Changes in SNAP Benefits Make a Difference? Appl. Econ. Perspect. Policy 2013, 35, 150–170. [Google Scholar] [CrossRef]
- Beatty, T.K.M.; Tuttle, C.J. Expenditure Response to Increases in In-Kind Transfers: Evidence from the Supplemental Nutrition Assistance Program. Am. J. Agric. Econ. 2015, 97, 390–404. [Google Scholar] [CrossRef] [Green Version]
- Collins, A.M.; Klerman, J.A. Improving Nutrition by Increasing Supplemental Nutrition Assistance Program Benefits. Am. J. Prev. Med. 2017, 52, S179–S185. [Google Scholar] [CrossRef]
- Jiyoon, K. Do SNAP participants expand non-food spending when they receive more SNAP benefits?—Evidence from the 2009 SNAP benefits increase. Food Policy 2016, 65, 9–20. [Google Scholar] [CrossRef]
- Cheng, X.H.; Jo, Y.; Kim, J. Heterogeneous Impact of Supplemental Nutrition Assistance Program Benefit Changes on Food Security by Local Prices. Am. J. Prev. Med. 2019. [Google Scholar] [CrossRef]
- McClain, A.C.; Tucker, K.L.; Falcon, L.M.; Mattei, J. Food insecurity and dietary intake by Supplemental Nutrition Assistance Program participation status among mainland US Puerto Rican adults after the 2009 American Recovery and Reinvestment Act. Public Health Nutr. 2019, 22, 2989–2998. [Google Scholar] [CrossRef]
- Todd, J.E. Revisiting the Supplemental Nutrition Assistance Program Cycle of Food Intake: Investigating Heterogeneity, Diet Quality, and a Large Boost in Benefit Amounts. Appl. Econ. Perspect. Policy 2015, 37, 437–458. [Google Scholar] [CrossRef]
- Todd, J.E.; Gregory, C. Changes in Supplemental Nutrition Assistance Program real benefits and daily caloric intake among adults. Food Policy 2018, 79, 111–120. [Google Scholar] [CrossRef]
- Waehrer, G.; Deb, P.; Decker, S.L. Did the 2009 American Recovery and Reinvestment Act affect dietary intake of low-income individuals? Econ. Hum. Biol. 2015, 19, 170–183. [Google Scholar] [CrossRef] [PubMed] [Green Version]
- Lin, B.-H.; Yen, S.T.; Dong, D.; Smallwood, D.M. Economic Incentives for Dietary Improvement among Food Stamp Recipients. Contemp. Econ. Policy 2010, 28, 524–536. [Google Scholar] [CrossRef]
- Morrissey, T.W.; Miller, D.P. Supplemental Nutrition Assistance Program Participation Improves Children’s Health Care Use: An Analysis of the American Recovery and Reinvestment Act’s Natural Experiment. Acad. Pediatr. 2019. [Google Scholar] [CrossRef] [PubMed]
- Marcinkevage, J.; Auvinen, A.; Nambuthiri, S. Washington state’s fruit and vegetable prescription program: Improving affordability of healthy foods for low-income patients. Prev. Chronic Dis. 2019. [Google Scholar] [CrossRef]
- Grindal, T.; Wilde, P.; Schwartz, G.; Klerman, J.; Bartlett, S.; Berman, D. Does food retail access moderate the impact of fruit and vegetable incentives for SNAP participants? Evidence from western Massachusetts. Food Policy 2016, 61, 59–69. [Google Scholar] [CrossRef] [Green Version]
- Harnack, L.; Oakes, J.M.; Elbel, B.; Beatty, T.; Rydell, S.; French, S. Effects of Subsidies and Prohibitions on Nutrition in a Food Benefit Program A Randomized Clinical Trial. JAMA Intern. Med. 2016, 176, 1610–1618. [Google Scholar] [CrossRef]
- Moran, A.; Thorndike, A.; Franckle, R.; Boulos, R.; Doran, H.; Fulay, A.; Greene, J.; Blue, D.; Block, J.P.; Rimm, E.B.; et al. Financial Incentives Increase Purchases Of Fruit And Vegetables Among Lower-Income Households With Children. Health Aff. 2019, 38, 1557–1566. [Google Scholar] [CrossRef]
- Olsho, L.E.W.; Klerman, J.A.; Wilde, P.E.; Bartlett, S. Financial incentives increase fruit and vegetable intake among Supplemental Nutrition Assistance Program participants: A randomized controlled trial of the USDA Healthy Incentives Pilot. Am. J. Clin. Nutr. 2016, 104, 423–435. [Google Scholar] [CrossRef]
- Phipps, E.J.; Braitman, L.E.; Stites, S.D.; Singletary, S.B.; Wallace, S.L.; Hunt, L.; Axelrod, S.; Glanz, K.; Uplinger, N. Impact of a Rewards-Based Incentive Program on Promoting Fruit and Vegetable Purchases. Am. J. Public Health 2015, 105, 166–172. [Google Scholar] [CrossRef]
- Phipps, E.J.; Braitman, L.E.; Stites, S.D.; Wallace, S.L.; Singletary, S.B.; Hunt, L.H. The Use of Financial Incentives to Increase Fresh Fruit and Vegetable Purchases in Lower-Income Households: Results of a Pilot Study. J. Health Care Poor Underserved 2013, 24, 864–874. [Google Scholar] [CrossRef] [PubMed]
- Polacsek, M.; Moran, A.; Thorndike, A.N.; Boulos, R.; Franckle, R.L.; Greene, J.C.; Blue, D.J.; Block, J.P.; Rimm, E.B. A Supermarket Double-Dollar Incentive Program Increases Purchases of Fresh Fruits and Vegetables Among Low-Income Families With Children: The Healthy Double Study. J. Nutr. Educ. Behav. 2018, 50, 217–228. [Google Scholar] [CrossRef] [PubMed]
- Steele-Adjognon, M.; Weatherspoon, D. Double Up Food Bucks program effects on SNAP recipients’ fruit and vegetable purchases. BMC Public Health 2017, 17, 7. [Google Scholar] [CrossRef] [PubMed] [Green Version]
- Wilde, P.; Klerman, J.A.; Olsho, L.E.W.; Bartlett, S. Explaining the Impact of USDA’s Healthy Incentives Pilot on Different Spending Outcomes. Appl. Econ. Perspect. Policy 2016, 38, 655–672. [Google Scholar] [CrossRef]
- French, S.A.; Rydell, S.A.; Mitchell, N.R.; Oakes, J.M.; Elbel, B.; Harnack, L. Financial incentives and purchase restrictions in a food benefit program affect the types of foods and beverages purchased: Results from a randomized trial. Int. J. Behav. Nutr. Phys. Act. 2017, 14, 10. [Google Scholar] [CrossRef] [Green Version]
- Basu, S.; Seligman, H.; Bhattacharya, J. Nutritional policy changes in the supplemental nutrition assistance program: A microsimulation and cost-effectiveness analysis. Med. Decis. Mak. 2013, 33, 937–948. [Google Scholar] [CrossRef]
- Mozaffarian, D.; Liu, J.; Sy, S.; Huang, Y.; Rehm, C.; Lee, Y.; Wilde, P.; Abrahams-Gessel, S.; Veiga Jardim, T.d.S.; Gaziano, T.; et al. Cost-effectiveness of financial incentives and disincentives for improving food purchases and health through the US Supplemental Nutrition Assistance Program (SNAP): A microsimulation study. PLoS Med. 2018, 15. [Google Scholar] [CrossRef]
- Choi, S.E.; Seligman, H.; Basu, S. Cost effectiveness of subsidizing fruit and vegetable purchases through the Supplemental Nutrition Assistance Program. Am. J. Prev. Med. 2017, 52, e147–e155. [Google Scholar] [CrossRef] [Green Version]
- Penalvo, J.L.; Cudhea, F.; Micha, R.; Rehm, C.D.; Afshin, A.; Whitsel, L.; Wilde, P.; Gaziano, T.; Pearson-Stuttard, J.; O’Flaherty, M.; et al. The potential impact of food taxes and subsidies on cardiovascular disease and diabetes burden and disparities in the United States. BMC Med. 2017, 15. [Google Scholar] [CrossRef] [Green Version]
- Pearson-Stuttard, J.; Bandosz, P.; Rehm, C.D.; Penalvo, J.; Whitsel, L.; Gaziano, T.; Conrad, Z.; Wilde, P.; Micha, R.; Lloyd-Williams, F.; et al. Reducing US Cardiovascular Disease Disparities Through Dietary Policy. Circulation 2017, 135. [Google Scholar] [CrossRef]
- Wilde, P.E.; Conrad, Z.; Rehm, C.D.; Pomeranz, J.L.; Penalvo, J.L.; Cudhea, F.; Pearson-Stuttard, J.; O’Flaherty, M.; Micha, R.; Mozaffarian, D. Reductions in national cardiometabolic mortality achievable by food price changes according to Supplemental Nutrition Assistance Program (SNAP) eligibility and participation. J. Epidemiol. Community Health 2018, 72, 817–824. [Google Scholar] [CrossRef] [PubMed]
- Klerman, J.A.; Bartlett, S.; Wilde, P.; Olsho, L. The short-run impact of the healthy incentives pilot program on fruit and vegetable intake. Am. J. Agric. Econ. 2014, 96, 1372–1382. [Google Scholar] [CrossRef]
- Andreyeva, T.; Chaloupka, F.J.; Brownell, K.D. Estimating the potential of taxes on sugar-sweetened beverages to reduce consumption and generate revenue. Prev. Med. Int. J. Devoted Pract. Theory 2011, 52, 413–416. [Google Scholar] [CrossRef] [PubMed]
- Baskin, E.; Coary, S.P. Implications of the Philadelphia beverage tax on sales and beverage substitution for a major grocery retailer chain. J. Int. Food Agribus. Mark. 2019, 31, 293–307. [Google Scholar] [CrossRef]
- Cawley, J.; Frisvold, D.; Hill, A.; Jones, D. The impact of the Philadelphia beverage tax on purchases and consumption by adults and children. J. Health Econ. 2019, 67, 16. [Google Scholar] [CrossRef] [Green Version]
- Cawley, J.; Frisvold, D.E. The Pass-Through of Taxes on Sugar-Sweetened Beverages to Retail Prices: The Case of Berkeley, California. J. Policy Anal. Manag. 2017, 36, 303–326. [Google Scholar] [CrossRef]
- Cawley, J.; Willage, B.; Frisvold, D. Pass-through of a tax on sugar-sweetened beverages at the Philadelphia International Airport. JAMA 2018, 319, 305–306. [Google Scholar] [CrossRef] [PubMed]
- Chen, Z.; Finkelstein, E.A.; Nonnemaker, J.M.; Karns, S.A.; Todd, J.E. Predicting the effects of sugar-sweetened beverage taxes on food and beverage demand in a large demand system. Am. J. Agric. Econ. 2014, 96, 1–25. [Google Scholar]
- Coary, S.P.; Baskin, E. Sweetened beverages excise tax pass-through rates: A case study in Philadelphia. J. Int. Food Agribus. Mark. 2018, 30, 382–391. [Google Scholar] [CrossRef]
- Debnam, J. Selection Effects and Heterogeneous Demand Responses to the Berkeley Soda Tax Vote. Am. J. Agric. Econ. 2017, 99, 1172–1187. [Google Scholar] [CrossRef]
- Dharmasena, S.; Capps, O., Jr. Intended and unintended consequences of a proposed national tax on sugar-sweetened beverages to combat the U.S. obesity problem. Health Econ. 2012, 21, 669–694. [Google Scholar] [CrossRef] [PubMed]
- Dharmasena, S.; Davis, G.C.; Capps, O., Jr. Partial versus General Equilibrium Calorie and Revenue Effects Associated with a Sugar-Sweetened Beverage Tax. J. Agric. Resour. Econ. 2014, 39, 157–173. [Google Scholar]
- Falbe, J.; Rojas, N.; Grummon, A.H.; Madsen, K.A. Higher Retail Prices of Sugar-Sweetened Beverages 3 Months After Implementation of an Excise Tax in Berkeley, California. Am. J. Public Health 2015, 105, 2194–2201. [Google Scholar] [CrossRef]
- Falbe, J.; Thompson, H.R.; Becker, C.M.; Rojas, N.; McCulloch, C.E.; Madsen, K.A. Impact of the Berkeley excise tax on sugar-sweetened beverage consumption. Am. J. Public Health 2016, 106, 1865–1871. [Google Scholar] [CrossRef]
- Finkelstein, E.A.; Zhen, C.; Bilger, M.; Nonnemaker, J.; Farooqui, A.M.; Todd, J.E. Implications of a sugar-sweetened beverage (SSB) tax when substitutions to non-beverage items are considered. J. Health Econ. 2013, 32, 219–239. [Google Scholar] [CrossRef] [PubMed]
- Finkelstein, E.A.; Zhen, C.; Nonnemaker, J.; Todd, J.E. Impact of targeted beverage taxes on higher- and lower-income households. Arch Intern Med 2010, 170, 2028–2034. [Google Scholar] [CrossRef] [Green Version]
- Fletcher, J.M.; Frisvold, D.E.; Tefft, N. Non-linear effects of soda taxes on consumption and weight outcomes. Health Econ. 2015, 24, 566–582. [Google Scholar] [CrossRef] [PubMed]
- Ford, C.N.; Ng, S.W.; Popkin, B.M. Targeted Beverage Taxes Influence Food and Beverage Purchases among Households with Preschool Children. J. Nutr. 2015, 145, 1835–1843. [Google Scholar] [CrossRef] [PubMed] [Green Version]
- Ford, C.N.; Poti, J.M.; Ng, S.W.; Popkin, B.M. SSB taxes and diet quality in US preschoolers: Estimated changes in the 2010 Healthy Eating Index. Pediatr. Obes. 2017, 12, 146–154. [Google Scholar] [CrossRef] [PubMed] [Green Version]
- Gortmaker, S.L.; Wang, Y.C.; Long, M.W.; Giles, C.M.; Ward, Z.J.; Barrett, J.L.; Kenney, E.L.; Sonneville, K.R.; Afzal, A.S.; Resch, S.C.; et al. Three Interventions That Reduce Childhood Obesity Are Projected To Save More Than They Cost To Implement. Health Aff. (Proj. Hope) 2015, 34, 1932–1939. [Google Scholar] [CrossRef] [PubMed] [Green Version]
- Harding, M.; Lovenheim, M. The effect of prices on nutrition: Comparing the impact of product- and nutrient-specific taxes. J. Health Econ. 2017, 53, 53–71. [Google Scholar] [CrossRef] [PubMed] [Green Version]
- Jithitikulchai, T.; Andreyeva, T. Sugar-Sweetened Beverage Demand and Tax Simulation for Federal Food Assistance Participants: A Case of Two New England States. Appl. Health Econ. Health Policy 2018, 16, 549–558. [Google Scholar] [CrossRef] [PubMed]
- Kristensen, A.H.; Flottemesch, T.J.; Maciosek, M.V.; Jenson, J.; Barclay, G.; Ashe, M.; Sanchez, E.J.; Story, M.; Teutsch, S.M.; Brownson, R.C. Reducing childhood obesity through U.S. federal policy: A microsimulation analysis. Am. J. Prev. Med. 2014, 47, 604–612. [Google Scholar] [CrossRef] [PubMed] [Green Version]
- Langellier, B.A.; Lê-Scherban, F.; Purtle, J. Funding quality pre-kindergarten slots with Philadelphia’s new ‘sugary drink tax’: Simulating effects of using an excise tax to address a social determinant of health. Public Health Nutr. 2017, 20, 2450–2458. [Google Scholar] [CrossRef] [PubMed]
- Lawman, H.G.; Bleich, S.N.; Yana, J.L.; LeVasseur, M.T.; Mitra, N.; Roberto, C.A. Unemployment claims in Philadelphia one year after implementation of the sweetened beverage tax. PLoS ONE 2019, 14, e0213218. [Google Scholar] [CrossRef] [PubMed] [Green Version]
- Lee, M.M.; Falbe, J.; Schillinger, D.; Basu, S.; McCulloch, C.E.; Madsen, K.A. Sugar-Sweetened Beverage Consumption 3 Years After the Berkeley, California, Sugar-Sweetened Beverage Tax. Am. J. Public Health 2019, 109, 637–639. [Google Scholar] [CrossRef] [PubMed]
- Lin, B.H.; Smith, T.A.; Lee, J.Y.; Hall, K.D. Measuring weight outcomes for obesity intervention strategies: The case of a sugar-sweetened beverage tax. Econ. Hum. Biol. 2011, 9, 329–341. [Google Scholar] [CrossRef]
- Liu, S.; Osgood, N.; Gao, Q.; Xue, H.; Wang, Y. Systems simulation model for assessing the sustainability and synergistic impacts of sugar-sweetened beverages tax and revenue recycling on childhood obesity prevention. J. Oper. Res. Soc. 2016, 67, 708–721. [Google Scholar] [CrossRef]
- Long, M.W.; Gortmaker, S.L.; Ward, Z.J.; Resch, S.C.; Moodie, M.L.; Sacks, G.; Swinburn, B.A.; Carter, R.C.; Wang, Y.C. Cost effectiveness of a sugar-sweetened beverage excise tax in the US. Am. J. Prev. Med. 2015, 49, 112–123. [Google Scholar] [CrossRef]
- Long, M.W.; Polacsek, M.; Bruno, P.; Giles, C.M.; Ward, Z.J.; Cradock, A.L.; Gortmaker, S.L. Cost-Effectiveness Analysis and Stakeholder Evaluation of 2 Obesity Prevention Policies in Maine, US. J. Nutr. Educ. Behav. 2019, 51, 1177–1187. [Google Scholar] [CrossRef]
- Lusk, J.L.; Schroeter, C. When do fat taxes increase consumer welfare? Health Econ. 2012, 21, 1367–1374. [Google Scholar] [CrossRef] [PubMed] [Green Version]
- Mekonnen, T.A.; Odden, M.C.; Coxson, P.G.; Guzman, D.; Lightwood, J.; Wang, Y.C.; Bibbins-Domingo, K. Health benefits of reducing sugar-sweetened beverage intake in high risk populations of California: Results from the cardiovascular disease (CVD) policy model. PLoS ONE 2013, 8, e81723. [Google Scholar] [CrossRef] [PubMed]
- Powell, L.M.; Wada, R.; Persky, J.J.; Chaloupka, F.J. Employment Impact of Sugar-Sweetened Beverage Taxes. Am. J. Public Health 2014, 104, 672–677. [Google Scholar] [CrossRef] [PubMed]
- Roberto, C.A.; Lawman, H.G.; LeVasseur, M.T.; Mitra, N.; Peterhans, A.; Herring, B.; Bleich, S.N. Association of a Beverage Tax on Sugar-Sweetened and Artificially Sweetened Beverages With Changes in Beverage Prices and Sales at Chain Retailers in a Large Urban Setting. JAMA 2019, 321, 1799–1810. [Google Scholar] [CrossRef] [Green Version]
- Ruff, R.R.; Zhen, C. Estimating the effects of a calorie-based sugar-sweetened beverage tax on weight and obesity in New York City adults using dynamic loss models. Ann. Epidemiol. 2015, 25, 350–357. [Google Scholar] [CrossRef]
- Silver, L.D.; Ng, S.W.; Ryan-Ibarra, S.; Taillie, L.S.; Induni, M.; Miles, D.R.; Poti, J.M.; Popkin, B.M. Changes in prices, sales, consumer spending, and beverage consumption one year after a tax on sugar-sweetened beverages in Berkeley, California, US: A before-and-after study. PLoS Med. 2017, 14, 19. [Google Scholar] [CrossRef] [Green Version]
- Taylor, R.L.; Kaplan, S.; Villas-Boas, S.B.; Jung, K. Soda wars: The effect of a soda tax election on university beverage sales. Econ. Inq. 2019, 57, 1480–1496. [Google Scholar] [CrossRef]
- Wang, E.Y. The impact of soda taxes on consumer welfare: Implications of storability and taste heterogeneity. Rand J. Econ. 2015, 46, 409–441. [Google Scholar] [CrossRef]
- Wang, Y.C.; Coxson, P.; Shen, Y.-M.; Goldman, L.; Bibbins-Domingo, K. A Penny-Per-Ounce Tax On Sugar-Sweetened Beverages Would Cut Health And Cost Burdens Of Diabetes. Health Aff. 2012, 31, 199–207. [Google Scholar] [CrossRef] [Green Version]
- Wilde, P.; Huang, Y.; Sy, S.; Abrahams-Gessel, S.; Jardim, T.V.; Paarlberg, R.; Mozaffarian, D.; Micha, R.; Gaziano, T. Cost-Effectiveness of a US National Sugar-Sweetened Beverage Tax With a Multistakeholder Approach: Who Pays and Who Benefits. Am. J. Public Health 2019, 109, 276–284. [Google Scholar] [CrossRef]
- Zeiss, J.; Carlson, L.; Ball, A.D. Uncalculated first-party externalities given a beverage tax. Soc. Sci. Q. 2019, 100, 736–748. [Google Scholar] [CrossRef]
- Zhen, C.; Brissette, I.F.; Ruff, R.R. By Ounce or by Calorie: The Differential Effects of Alternative Sugar-Sweetened Beverage Tax Strategies. Am. J. Agric. Econ. 2014, 96, 1070–1083. [Google Scholar] [CrossRef] [PubMed] [Green Version]
- Zheng, H.; Huang, L.; Ross, W., Jr. Reducing Obesity by Taxing Soft Drinks: Tax Salience and Firms’ Strategic Responses. J. Public Policy Mark. 2019, 38, 297–315. [Google Scholar] [CrossRef]
- Zhong, Y.; Auchincloss, A.H.; Lee, B.K.; Kanter, G.P. The Short-Term Impacts of the Philadelphia Beverage Tax on Beverage Consumption. Am. J. Prev. Med. 2018, 55, 26–34. [Google Scholar] [CrossRef] [PubMed]
- Grummon, A.H.; Lockwood, B.B.; Taubinsky, D.; Allcott, H. Designing better sugary drink taxes. Science 2019, 365, 989–990. [Google Scholar] [CrossRef] [PubMed]
- Vercammen, K.A.; Moran, A.J.; Zatz, L.Y.; Rimm, E.B. 100% Juice, Fruit, and Vegetable Intake Among Children in the Special Supplemental Nutrition Program for Women, Infants, and Children and Nonparticipants. Am. J. Prev. Med. 2018, 55, e11–e18. [Google Scholar] [CrossRef]
- Meiqari, L.; Torre, L.; Gazmararian, J.A. Exploring the Impact of the New WIC Food Package on Low-Fat Milk Consumption Among WIC Recipients: A Pilot Study. J. Health Care Poor Underserved 2015, 26, 712–725. [Google Scholar] [CrossRef]
- Ritchie, L.D.; Whaley, S.E.; Crocker, N.J. Satisfaction of California WIC participants with food package changes. J. Nutr. Educ. Behav. 2014, 46, S71–S78. [Google Scholar] [CrossRef]
- McLaury, K.C.; Jernigan, V.B.B.; Johnson, D.B.; Buchwald, D.; Duncan, G.E. Variation in WIC Cash-Value Voucher Redemption Among American Indian Reservation Communities in Washington State. J. Hunger Environ. Nutr. 2016, 11, 254–262. [Google Scholar] [CrossRef] [Green Version]
- Tester, J.M.; Leung, C.W.; Crawford, P.B. Revised WIC Food Package and Children’s Diet Quality. Pediatrics 2016, 137. [Google Scholar] [CrossRef] [Green Version]
- Ng, S.W.; Hollingsworth, B.A.; Busey, E.A.; Wandell, J.L.; Miles, D.R.; Poti, J.M. Federal Nutrition Program Revisions Impact Low-income Households’ Food Purchases. Am. J. Prev. Med. 2018, 54, 403–412. [Google Scholar] [CrossRef] [PubMed]
- Kong, A.; Odoms-Young, A.M.; Schiffer, L.A.; Kim, Y.; Berbaum, M.L.; Porter, S.J.; Blumstein, L.B.; Bess, S.L.; Fitzgibbon, M.L. The 18-month impact of special supplemental nutrition program for women, infants, and children food package revisions on diets of recipient families. Am. J. Prev. Med. 2014, 46, 543–551. [Google Scholar] [CrossRef] [PubMed] [Green Version]
- Kim, L.P.; Whaley, S.E.; Gradziel, P.H.; Crocker, N.J.; Ritchie, L.D.; Harrison, G.G. Mothers prefer fresh fruits and vegetables over jarred baby fruits and vegetables in the new special supplemental nutrition program for women, infants, and children food package. J. Nutr. Educ. Behav. 2013, 45, 723–727. [Google Scholar] [CrossRef] [PubMed]
- Joyce, T.; Reeder, J. Changes in breastfeeding among WIC participants following implementation of the new food package. Matern. Child Health J. 2015, 19, 868–876. [Google Scholar] [CrossRef]
- Hamner, H.C.; Paolicelli, C.; Casavale, K.O.; Haake, M.; Bartholomew, A. Food and Beverage Intake From 12 to 23 Months by WIC Status. Pediatrics 2019, 143. [Google Scholar] [CrossRef] [Green Version]
- Hamad, R.; Collin, D.F.; Baer, R.J.; Jelliffe-Pawlowski, L.L. Association of Revised WIC Food Package With Perinatal and Birth Outcomes: A Quasi-Experimental Study. JAMA Pediatr. 2019. [Google Scholar] [CrossRef]
- Hamad, R.; Batra, A.; Karasek, D.; LeWinn, K.Z.; Bush, N.R.; Davis, R.L.; Tylavsky, F.A. The Impact of the Revised WIC Food Package on Maternal Nutrition During Pregnancy and Postpartum. Am. J. Epidemiol. 2019, 188, 1493–1502. [Google Scholar] [CrossRef]
- Au, L.E.; Paolicelli, C.; Gurzo, K.; Ritchie, L.D.; Weinfield, N.S.; Plank, K.R.; Whaley, S.E. Contribution of WIC-Eligible Foods to the Overall Diet of 13- and 24-Month-Old Toddlers in the WIC Infant and Toddler Feeding Practices Study-2. J. Acad. Nutr. Diet. 2019, 119, 435–448. [Google Scholar] [CrossRef]
- Bertmann, F.M.; Barroso, C.; Ohri-Vachaspati, P.; Hampl, J.S.; Sell, K.; Wharton, C.M. Women, infants, and children cash value voucher (CVV) use in Arizona: A qualitative exploration of barriers and strategies related to fruit and vegetable purchases. J. Nutr. Educ. Behav. 2014, 46, S53–S58. [Google Scholar] [CrossRef] [Green Version]
- Cakir, M.; Beatty, T.K.M.; Boland, M.A.; Park, T.A.; Snyder, S.; Wang, Y. Spatial and Temporal Variation in the Value of the Women, Infants, and Children Program’s Fruit and Vegetable Voucher. Am. J. Agric. Econ. 2018, 100, 691–706. [Google Scholar] [CrossRef]
- Chaparro, M.P.; Anderson, C.E.; Crespi, C.M.; Whaley, S.E.; Wang, M.C. The effect of the 2009 WIC food package change on childhood obesity varies by gender and initial weight status in Los Angeles County. Pediatr. Obes. 2019, 14, e12526. [Google Scholar] [CrossRef] [PubMed]
- Chaparro, M.P.; Crespi, C.M.; Anderson, C.E.; Wang, M.C.; Whaley, S.E. The 2009 Special Supplemental Nutrition Program for Women, Infants, and Children (WIC) food package change and children’s growth trajectories and obesity in Los Angeles County. Am. J. Clin. Nutr. 2019, 109, 1414–1421. [Google Scholar] [CrossRef] [PubMed]
- Chaparro, M.P.; Wang, M.C.; Anderson, C.E.; Crespi, C.M.; Whaley, S.E. The Association between the 2009 WIC Food Package Change and Early Childhood Obesity Risk Varies by Type of Infant Package Received. J. Acad. Nutr. Diet. 2019. [Google Scholar] [CrossRef] [PubMed] [Green Version]
- Ishdorj, A.; Capps, O., Jr. The effect of revised wic food packages on native American children. Am. J. Agric. Econ. 2013, 95, 1266–1272. [Google Scholar] [CrossRef]
- Li, K.; Wen, M.; Reynolds, M.; Zhang, Q. WIC Participation and Breastfeeding after the 2009 WIC Revision: A Propensity Score Approach. Int. J. Environ. Res. Public Health 2019, 16, 2645. [Google Scholar] [CrossRef] [Green Version]
- Daepp, M.I.G.; Gortmaker, S.L.; Wang, Y.C.; Long, M.W.; Kenney, E.L. WIC Food Package Changes: Trends in Childhood Obesity Prevalence. Pediatrics 2019, 143. [Google Scholar] [CrossRef]
- Singleton, C.R.; Opoku-Agyeman, W.; Affuso, E.; Baskin, M.L.; Levitan, E.B.; Sen, B.; Affuso, O. WIC Cash Value Voucher Redemption Behavior in Jefferson County, Alabama, and Its Association With Fruit and Vegetable Consumption. Am. J. Health Promot. 2018, 32, 325–333. [Google Scholar] [CrossRef]
- Solomon, C.A.; Batada, A.; Zillante, A.; Kennedy, A.; Hudak, K.M.; Racine, E.F. Food cost is the least of my worries: A qualitative study exploring food and beverage purchasing decisions among parents enrolled in the WIC program. J. Hunger Environ. Nutr. 2018, 13, 497–506. [Google Scholar] [CrossRef]
- Zenk, S.N.; Odoms-Young, A.; Powell, L.M.; Campbell, R.T.; Block, D.; Chavez, N.; Krauss, R.C.; Strode, S.; Armbruster, J. Fruit and Vegetable Availability and Selection Federal Food Package Revisions, 2009. Am. J. Prev. Med. 2012, 43, 423–428. [Google Scholar] [CrossRef]
- Zenk, S.N.; Powell, L.M.; Odoms-Young, A.M.; Krauss, R.; Fitzgibbon, M.L.; Block, D.; Campbell, R.T. Impact of the Revised Special Supplemental Nutrition Program for Women, Infants, and Children (WIC) Food Package Policy on Fruit and Vegetable Prices. J. Acad. Nutr. Diet. 2014, 114, 288–296. [Google Scholar] [CrossRef] [Green Version]
- Andreyeva, T.; Luedicke, J. Federal Food Package Revisions Effects on Purchases of Whole-Grain Products. Am. J. Prev. Med. 2013, 45, 422–429. [Google Scholar] [CrossRef] [PubMed]
- Andreyeva, T.; Luedicke, J. Incentivizing fruit and vegetable purchases among participants in the Special Supplemental Nutrition Program for Women, Infants, and Children. Public Health Nutr. 2015, 18, 33–41. [Google Scholar] [CrossRef] [PubMed] [Green Version]
- Andreyeva, T.; Luedicke, J.; Henderson, K.E.; Schwartz, M.B. The Positive Effects of the Revised Milk and Cheese Allowances in the Special Supplemental Nutrition Program for Women, Infants, and Children. J. Acad. Nutr. Diet. 2014, 114, 622–630. [Google Scholar] [CrossRef]
- Andreyeva, T.; Luedicke, J.; Tripp, A.S.; Henderson, K.E. Effects of Reduced Juice Allowances in Food Packages for the Women, Infants, and Children Program. Pediatrics 2013, 131, 919–927. [Google Scholar] [CrossRef] [PubMed] [Green Version]
- Andreyeva, T.; Tripp, A.S. The healthfulness of food and beverage purchases after the federal food package revisions: The case of two New England states. Prev. Med. 2016, 91, 204–210. [Google Scholar] [CrossRef] [Green Version]
- Herman, D.R.; Harrison, G.G.; Afifi, A.A.; Jenks, E. Effect of a targeted subsidy on intake of fruits and vegetables among low-income women in the special supplemental nutrition program for women, infants, and children. Am. J. Public Health 2008, 98, 98–105. [Google Scholar] [CrossRef]
- Hillier, A.; McLaughlin, J.; Cannuscio, C.C.; Chilton, M.; Krasny, S.; Karpyn, A. The Impact of WIC Food Package Changes on Access to Healthful Food in 2 Low-Income Urban Neighborhoods. J. Nutr. Educ. Behav. 2012, 44, 210–216. [Google Scholar] [CrossRef]
- Pelletier, J.E.; Schreiber, L.R.N.; Laska, M.N. Minimum Stocking Requirements for Retailers in the Special Supplemental Nutrition Program for Women, Infants, and Children: Disparities Across US States. Am. J. Public Health 2017, 107, 1171–1174. [Google Scholar] [CrossRef]
- Lu, W.H.; McKyer, E.L.J.; Dowdy, D.; Evans, A.; Ory, M.; Hoelscher, D.M.; Wang, S.J.; Miao, J.G. Evaluating the Influence of the Revised Special Supplemental Nutrition Program for Women, Infants, and Children (WIC) Food Allocation Package on Healthy Food Availability, Accessibility, and Affordability in Texas. J. Acad. Nutr. Diet. 2016, 116, 292–301. [Google Scholar] [CrossRef]
- O’Malley, K.; Luckett, B.G.; Dunaway, L.F.; Bodor, J.N.; Rose, D. Use of a new availability index to evaluate the effect of policy changes to the Special Supplemental Nutrition Program for Women, Infants, and Children (WIC) on the food environment in New Orleans. Public Health Nutr. 2015, 18, 25–32. [Google Scholar] [CrossRef] [Green Version]
- Herman, D.R.; Harrison, G.G.; Jenks, E. Choices made by low-income women provided with an economic supplement for fresh fruit and vegetable purchase. J. Am. Diet. Assoc. 2006, 106, 740–744. [Google Scholar] [CrossRef] [PubMed]
- Okeke, J.O.; Ekanayake, R.M.; Santorelli, M.L. Effects of a 2014 Statewide Policy Change on Cash-Value Voucher Redemptions for Fruits/Vegetables Among Participants in the Supplemental Nutrition Program for Women, Infants, and Children (WIC). Matern. Child Health J. 2017, 21, 1874–1879. [Google Scholar] [CrossRef] [PubMed]
- Zimmer, M.C.; Vernarelli, J.A. Changes in nutrient and food group intakes among children and women participating in the Special Supplemental Nutrition Program for Women, Infants, and Children: Findings from the 2005-2008 and 2011-2014 National Health and Nutrition Examination Surveys. Public Health Nutr. 2019, 22, 3309–3314. [Google Scholar] [CrossRef] [PubMed]
- Oh, M.; Jensen, H.H.; Rahkovsky, I. Did revisions to the WIC program affect household expenditures on whole grains? Appl. Econ. Perspect. Policy 2016, ppw020. [Google Scholar] [CrossRef] [Green Version]
- Chiasson, M.A.; Findley, S.; Sekhobo, J.; Scheinmann, R.; Edmunds, L.; Faly, A.; McLeod, N. Changing WIC changes what children eat. Obesity 2013, 21, 1423–1429. [Google Scholar] [CrossRef]
- Morshed, A.B.; Davis, S.M.; Greig, E.A.; Myers, O.B.; Cruz, T.H. Effect of WIC food package changes on dietary intake of preschool children in New Mexico. Health Behav. Policy Rev. 2015, 2, 3–12. [Google Scholar] [CrossRef] [Green Version]
- Whaley, S.E.; Ritchie, L.D.; Spector, P.; Gomez, J. Revised WIC food package improves diets of WIC families. J. Nutr. Educ. Behav. 2012, 44, 204–209. [Google Scholar] [CrossRef] [PubMed]
- Cobb, L.K.; Anderson, C.A.M.; Appel, L.; Jones-Smith, J.; Bilal, U.; Gittelsohn, J.; Franco, M. Baltimore City Stores Increased The Availability Of Healthy Food After WIC Policy Change. Health Aff. 2015, 34, 1849–1857. [Google Scholar] [CrossRef]
- Langellier, B.A.; Chaparro, M.P.; Wang, M.C.; Koleilat, M.; Whaley, S.E. The new food package and breastfeeding outcomes among women, infants, and children participants in Los Angeles County. Am. J. Public Health 2014, 104, S112–S118. [Google Scholar] [CrossRef]
- Evans, A.; Banks, K.; Jennings, R.; Nehme, E.; Nemec, C.; Sharma, S.; Hussaini, A.; Yaroch, A. Increasing access to healthful foods: A qualitative study with residents of low-income communities. Int. J. Behav. Nutr. Phys. Act. 2015, 12 (Suppl. 1), S5. [Google Scholar] [CrossRef] [Green Version]
- Cummins, S.; Flint, E.; Matthews, S.A. New Neighborhood Grocery Store Increased Awareness Of Food Access But Did Not Alter Dietary Habits Or Obesity. Health Aff. 2014, 33, 283–291. [Google Scholar] [CrossRef] [PubMed] [Green Version]
- Elbel, B.; Mijanovich, T.; Kiszko, K.; Abrams, C.; Cantor, J.; Dixon, L.B. The Introduction of a Supermarket via Tax-Credits in a Low-Income Area: The Influence on Purchasing and Consumption. Am. J. Health Promot. 2017, 31, 59–66. [Google Scholar] [CrossRef] [PubMed]
- Elbel, B.; Moran, A.; Dixon, L.B.; Kiszko, K.; Cantor, J.; Abrams, C.; Mijanovich, T. Assessment of a government-subsidized supermarket in a high-need area on household food availability and children’s dietary intakes. Public Health Nutr. 2015, 18, 2881–2890. [Google Scholar] [CrossRef] [PubMed]
- Dubowitz, T.; Ghosh-Dastidar, M.; Cohen, D.A.; Beckman, R.; Steiner, E.D.; Hunter, G.P.; Flórez, K.R.; Huang, C.; Vaughan, C.A.; Sloan, J.C. Changes in diet after introduction of a full service supermarket in a food desert. Health Aff. (Proj. Hope) 2015, 34, 1858. [Google Scholar] [CrossRef] [Green Version]
- Dubowitz, T.; Ghosh-Dastidar, M.; Cohen, D.A.; Beckman, R.; Steiner, E.D.; Hunter, G.P.; Florez, K.R.; Huang, C.; Vaughan, C.A.; Sloan, J.C.; et al. Diet And Perceptions Change With Supermarket Introduction In A Food Desert, But Not Because Of Supermarket Use. Health Aff. 2015, 34, 1858–1868. [Google Scholar] [CrossRef] [Green Version]
- Pitts, S.B.J.; Wu, Q.; McGuirt, J.T.; Sharpe, P.A.; Rafferty, A.P. Impact on Dietary Choices After Discount Supermarket Opens in Low-Income Community. J. Nutr. Educ. Behav. 2018, 50, 729–735. [Google Scholar] [CrossRef] [Green Version]
- Zeng, D.; Thomsen, M.R.; Nayga, R.M.; Bennett, J.L. Supermarket access and childhood bodyweight: Evidence from store openings and closings. Econ. Hum. Biol. 2019, 33, 78–88. [Google Scholar] [CrossRef]
- Zhang, Y.T.; Laraia, B.A.; Mujahid, M.S.; Blanchard, S.D.; Warton, E.M.; Moffet, H.H.; Karter, A.J. Is a reduction in distance to nearest supermarket associated with BMI change among type 2 diabetes patients? Health Place 2016, 40, 15–20. [Google Scholar] [CrossRef] [Green Version]
- Freedman, M.; Kuhns, A. Supply-side subsidies to improve food access and dietary outcomes: Evidence from the New Markets Tax Credit. Urban Stud. 2018, 55, 3234–3251. [Google Scholar] [CrossRef] [Green Version]
- Ulrich, V.; RD, A.H.; MSW PHD, K.I.D. The impact of a new nonprofit supermarket within an urban food desert on household food shopping. Med. Res. Arch. 2015. [Google Scholar] [CrossRef]
- Wang, M.C.; MacLeod, K.E.; Steadman, C.; Williams, L.; Bowie, S.L.; Herd, D.; Luluquisen, M.; Woo, M. Is the Opening of a Neighborhood Full-Service Grocery Store Followed by a Change in the Food Behavior of Residents? J. Hunger Environ. Nutr. 2007, 2, 3–18. [Google Scholar] [CrossRef]
- Cleary, R.; Bonanno, A.; Chenarides, L.; Goetz, S.J. Store profitability and public policies to improve food access in non-metro US counties. Food Policy 2018, 75, 158–170. [Google Scholar] [CrossRef]
- Chen, S.E.; Florax, R. Zoning for Health: The Obesity Epidemic and Opportunities for Local Policy Intervention. J. Nutr. 2010, 140, 1181–1184. [Google Scholar] [CrossRef] [PubMed] [Green Version]
- Rogus, S.; Athens, J.; Cantor, J.; Elbel, B. Measuring Micro-Level Effects of a New Supermarket: Do Residents Within 0.5 Mile Have Improved Dietary Behaviors? J. Acad. Nutr. Diet. 2018, 118, 1037–1046. [Google Scholar] [CrossRef] [PubMed]
- Richardson, A.S.; Ghosh-Dastidar, M.; Beckman, R.; Florez, K.R.; DeSantis, A.; Collins, R.L.; Dubowitz, T. Can the introduction of a full-service supermarket in a food desert improve residents’ economic status and health? Ann. Epidemiol. 2017, 27, 771–776. [Google Scholar] [CrossRef]
- Chrisinger, B. A Mixed-Method Assessment of a New Supermarket in a Food Desert: Contributions to Everyday Life and Health. J. Urban Health Bull. N. Y. Acad. Med. 2016, 93, 425–437. [Google Scholar] [CrossRef] [Green Version]
- Giang, T.; Karpyn, A.; Laurison, H.B.; Hillier, A.; Perry, R.D. Closing the grocery gap in underserved communities: The creation of the Pennsylvania fresh food financing initiative. J. Public Health Manag. Pract. 2008, 14, 272–279. [Google Scholar] [CrossRef]
- Brandt, E.J.; Silvestri, D.M.; Mande, J.R.; Holland, M.L.; Ross, J.S. Availability of Grocery Delivery to Food Deserts in States Participating in the Online Purchase Pilot. JAMA Netw. Open 2019, 2, e1916444. [Google Scholar] [CrossRef] [Green Version]
- Lagisetty, P.; Flamm, L.; Rak, S.; Landgraf, J.; Heisler, M.; Forman, J. A multi-stakeholder evaluation of the Baltimore City virtual supermarket program. BMC Public Health 2017, 17, 9. [Google Scholar] [CrossRef] [Green Version]
- Martinez, O.; Tagliaferro, B.; Rodriguez, N.; Athens, J.; Abrams, C.; Elbel, B. EBT Payment for Online Grocery Orders: A Mixed-Methods Study to Understand Its Uptake among SNAP Recipients and the Barriers to and Motivators for Its Use. J. Nutr. Educ. Behav. 2018, 50, 396–402. [Google Scholar] [CrossRef]
- Rogus, S.; Guthrie, J.F.; Niculescu, M.; Mancino, L. Online grocery shopping knowledge, attitudes, and behaviors among SNAP participants. J. Nutr. Educ. Behav. 2020, 52, 539–545. [Google Scholar] [CrossRef]
- Decker, D.; Flynn, M. Food Insecurity and Chronic Disease: Addressing Food Access as a Healthcare Issue. Rhode Isl. Med. J. 2018, 101, 28–30. [Google Scholar]
- Arenas, D.J.; Thomas, A.; Wang, J.; DeLisser, H.M. A systematic review and meta-analysis of depression, anxiety, and sleep disorders in US adults with food insecurity. J. Gen. Intern. Med. 2019, 1–9. [Google Scholar] [CrossRef]
- de Oliveira, K.H.D.; de Almeida, G.M.; Gubert, M.B.; Moura, A.S.; Spaniol, A.M.; Hernandez, D.C.; Pérez-Escamilla, R.; Buccini, G. Household food insecurity and early childhood development: Systematic review and meta-analysis. Matern. Child Nutr. 2020, e12967. [Google Scholar] [CrossRef]
- Trust for America’s Health. The State of Obesity: Better Policies for a Healthier America 2019; Trust for America’s Health: Washington, DC, USA, 2019. [Google Scholar]


| Policy Approach | Policy Action | Policy Description |
|---|---|---|
| Nutrition Label Standards and Regulations on The Use of Claims and Implied Claims on Food | Require Calorie Labeling of Prepared Food in Supermarkets (n = 3) | The 2010 Affordable Care Act mandated restaurants and similar food retail establishments with 20 or more locations nationwide disclose the number of calories in prepared foods on menus, menu boards, or in close proximity to food items (“calorie labeling”) (P.L. 111-148, §4205) [19]. Food retailers are also required to display a statement about daily calorie intake (“2000 calories a day is used for general nutrition advice, but calorie needs vary”) and must alert consumers that nutrition information for standard menu items is available upon request. The federal calorie labeling law differed from previously implemented state and local policies in that it expanded covered food retail establishments to include not only restaurants, but also supermarkets and other venues selling prepared foods. The Food and Drug Administration (FDA) published their final menu labeling rule in December 2014, issued draft industry guidance in 2017, and the law took effect on 7 May 2018. The following year, the FDA launched a consumer-facing nutrition education campaign to encourage the use of calorie information when eating out [20]. |
| Use Economic Tools to Address Food Affordability and Purchase Incentives | Increase SNAP Benefits (n = 13) | SNAP provides monthly food benefits to approximately 36 million low-income Americans [21]. The majority (83%) of SNAP benefits are spent in supermarkets, totaling about $46 billion annually [21,22]. SNAP benefits are calculated on the assumption that households will spend 30% of their incomes on food, with SNAP bridging the gap between that contribution and the cost of the Thrifty Food Plan (a very low cost healthy diet, as determined by the USDA) [23]. Congressional action can increase the monthly SNAP benefit amount, and Congress has approved benefit increases in response to economic downturns. For example, in response to the great recession, the American Recovery and Reinvestment Act increased SNAP benefits by an average of 13.6% (about $80/month for a family of four) from April 2009 until November 2013 (P.L.111-5, §101). Benefit increases could also be provided by expanding Summer EBT for Children (Summer EBT), which provides benefits to families of students eligible for free or reduced-price lunch during the summer months, when school is not in session. Additionally, several policies may increase SNAP benefits indirectly, by reducing the number of meals provided to school-aged children by low-income households each week [24]. For example, policies that increase school participation in the Community Eligibility Provision, which allows schools or districts serving a certain percentage of eligible students to provide all students with free breakfast and lunch, may indirectly increase SNAP benefits among households with children by increasing student participation in school meal programs [25]. |
| Provide Financial Incentives for Fruits and Vegetables to Low-Income Households (n = 19) | The 2014 Farm Bill provided $100 million in mandatory funding for the Food Insecurity and Nutrition Incentive grant program to support programs that provide SNAP participants with financial incentives for the purchase of fruits and vegetables (P.L. 113-79, §4208) [26]. The 2018 Farm Bill expanded and permanently reauthorized this program, renamed the Gus Schumacher Nutrition Incentive Program (GusNIP), and increased funding to $250 million over five years (P.L. 115-334, §4205). Through GusNIP, the USDA also authorized the Produce Prescription Program, which provides funding to organizations to partner with healthcare providers to provide financial incentives for fresh fruits and vegetables to low-income people at risk of diet-related health conditions. | |
| Tax Sweetened Beverages (n = 48) | In 2014, the city of Berkeley, California became the first U.S. city to pass a sweetened beverage excise tax of $0.01 per ounce [27]. Since then, a total of seven U.S. cities and the Navajo Nation have implemented similar taxes. All taxes except that of the Navajo Nation range from $0.01 to $0.02 per ounce. Sweetened beverage taxes typically apply to beverages with added sugar, but may also include drinks with low- or no-calorie sweeteners (e.g., the city of Philadelphia, Pennsylvania taxes both calorically and non-calorically sweetened beverages). Compared to a sales tax, which does not affect the posted retail price, excise taxes on beverage distributors can be passed on to consumers through retail price increases (“pass-through”). | |
| Revise the WIC Food Package (n = 44) | In October 2009, as required under the Child Nutrition Act (P.L. 111-296, §17), the USDA reviewed and revised the WIC food package to better align with the 2005 Dietary Guidelines for Americans, American Academy of Pediatrics Infant Feeding Guidelines, and 2006 Institute of Medicine recommendations [28,29,30]. The revisions included cash-value vouchers for fruits and vegetables, expanded whole grain and low-fat dairy options, reductions in whole milk, juice, eggs, and cheese, and additional incentives for breastfeeding [31]. WIC-authorized stores were required to stock a minimum variety of fruits, vegetables, and whole grain products. States have flexibility to determine which specific foods are included in the food package (within federal guidelines) and may require stricter minimum stocking standards for authorized stores. | |
| Set Incentives and Rules to Create a Healthy Retail and Food Service Environment | Provide Financial Assistance to Supermarkets to Locate in Underserved Areas (n = 22) | The Healthy Food Financing Initiative (HFFI) was launched in 2011 and formally established at the USDA as part of the 2014 Farm Bill (P.L. 113-79, §4206) [32]. The goal of the program was to improve access to healthy foods in low-income communities by building supermarkets or farmers’ markets and improving the quality of foods offered in small stores through grants, loans, and tax incentives. Between 2011 and 2015, the HFFI awarded $195 million to community development organizations for nearly 1000 healthy food access projects in 35 states. Many municipalities operate similar programs at the state or local level [33]. |
| Allow Payment with SNAP for Online Grocery Purchases (n = 4) | The 2014 Farm Bill mandated the USDA Online Purchasing Pilot Program, which tests accepting SNAP/EBT for online grocery transactions (P.L. 113-79, §4011) [34]. In 2017, the USDA Food and Nutrition Service announced the selection of seven retailers in seven states to participate in the program, which was launched in Amazon, Shoprite, and Walmart in select zip codes in New York in April 2019. The program was meant to roll out among the remaining selected states and retailers over the next several years, but has rapidly expanded due to the COVID-19 pandemic. At the time of writing, forty states and five retailers were participating. |
| Study Design Feature | Total (n = 147) | Calorie Labeling (n = 3) | SNAP Benefit Increase (n = 13) | Fruit and Vegetable Incentives (n = 19) | Sweetened Beverage Tax (n = 48) | WIC Food Package Revisions (n = 44) | Financial Assistance for Supermarkets (n = 22) | Online SNAP/EBT (n = 4) |
|---|---|---|---|---|---|---|---|---|
| Study Design | ||||||||
| Experimental | 11 (7%) | 0 (0%) | 2 (15%) | 9 (47%) | 0 (0%) | 0 (0%) | 0 (0%) | 0 (0%) |
| Quasi-experimental | 55 (37%) | 1 (33%) | 8 (62%) | 2 (11%) | 17 (35%) | 14 (32%) | 13 (59%) | 0 (0%) |
| Descriptive (Quantitative) | 76 (52%) | 2 (67%) | 3 (23%) | 7 (37%) | 31 (65%) | 25 (57%) | 7 (32%) | 1 (25%) |
| Descriptive (Qualitative) | 6 (4%) | 0 (0%) | 0 (0%) | 0 (0%) | 0 (0%) | 4 (9%) | 1 (5%) | 1 (25%) |
| Mixed or multiple methods | 5 (3%) | 0 (0%) | 0 (0%) | 1 (5%) | 0 (0%) | 1 (2%) | 1 (5%) | 2 (50%) |
| Population | ||||||||
| Adults | 70 (48%) | 2 (67%) | 7 (54%) | 13 (68%) | 20 (42%) | 12 (27%) | 13 (59%) | 3 (75%) |
| Children | 35 (24%) | 0 (0%) | 3 (23%) | 1 (5%) | 10 (21%) | 19 (43%) | 2 (9%) | 0 (0%) |
| Households | 38 (26%) | 0 (0%) | 5 (38%) | 9 (47%) | 13 (27%) | 8 (18%) | 3 (14%) | 0 (0%) |
| Other (e.g., stores) | 33 (22%) | 1 (33%) | 1 (8%) | 2 (11%) | 13 (27%) | 10 (23%) | 5 (23%) | 1 (25%) |
| U.S. Census Region | ||||||||
| National | 64 (44%) | 1 (33%) | 11 (85%) | 7 (37%) | 26 (54%) | 13 (30%) | 5 (23%) | 1 (25%) |
| Northeast | 44 (30%) | 1 (33%) | 2 (15%) | 8 (42%) | 12 (25%) | 9 (20%) | 11 (50%) | 1 (25%) |
| South | 9 (6%) | 0 (0%) | 0 (0%) | 0 (0%) | 0 (0%) | 5 (11%) | 3 (14%) | 1 (25%) |
| Midwest | 10 (7%) | 0 (0%) | 1 (8%) | 3 (16%) | 2 (4%) | 3 (7%) | 1 (5%) | 0 (0%) |
| West | 30 (20%) | 1 (33%) | 1 (8%) | 1 (5%) | 10 (21%) | 14 (32%) | 2 (9%) | 1 (25%) |
| Urban/Rural * | ||||||||
| Urban | 54 (37%) | 1 (33%) | 1 (8%) | 9 (47%) | 18 (38%) | 15 (34%) | 11 (50%) | 3 (75%) |
| Rural | 9 (6%) | 0 (0%) | 0 (0%) | 6 (32%) | 0 (0%) | 2 (5%) | 1 (5%) | 0 (0%) |
| Not specified or applicable | 91 (62%) | 2 (67%) | 12 (92%) | 8 (42%) | 31 (65%) | 27 (61%) | 10 (45%) | 1 (25%) |
Publisher’s Note: MDPI stays neutral with regard to jurisdictional claims in published maps and institutional affiliations. |
© 2020 by the authors. Licensee MDPI, Basel, Switzerland. This article is an open access article distributed under the terms and conditions of the Creative Commons Attribution (CC BY) license (http://creativecommons.org/licenses/by/4.0/).
Share and Cite
Moran, A.J.; Gu, Y.; Clynes, S.; Goheer, A.; Roberto, C.A.; Palmer, A. Associations between Governmental Policies to Improve the Nutritional Quality of Supermarket Purchases and Individual, Retailer, and Community Health Outcomes: An Integrative Review. Int. J. Environ. Res. Public Health 2020, 17, 7493. https://doi.org/10.3390/ijerph17207493
Moran AJ, Gu Y, Clynes S, Goheer A, Roberto CA, Palmer A. Associations between Governmental Policies to Improve the Nutritional Quality of Supermarket Purchases and Individual, Retailer, and Community Health Outcomes: An Integrative Review. International Journal of Environmental Research and Public Health. 2020; 17(20):7493. https://doi.org/10.3390/ijerph17207493
Chicago/Turabian StyleMoran, Alyssa J., Yuxuan Gu, Sasha Clynes, Attia Goheer, Christina A. Roberto, and Anne Palmer. 2020. "Associations between Governmental Policies to Improve the Nutritional Quality of Supermarket Purchases and Individual, Retailer, and Community Health Outcomes: An Integrative Review" International Journal of Environmental Research and Public Health 17, no. 20: 7493. https://doi.org/10.3390/ijerph17207493