Assessing Seasonal Nitrate Contamination by Nitrate Dual Isotopes in a Monsoon-Controlled Bay with Intensive Human Activities in South China

 ,
, 
Abstract
:1. Introduction
2. Materials and Methods
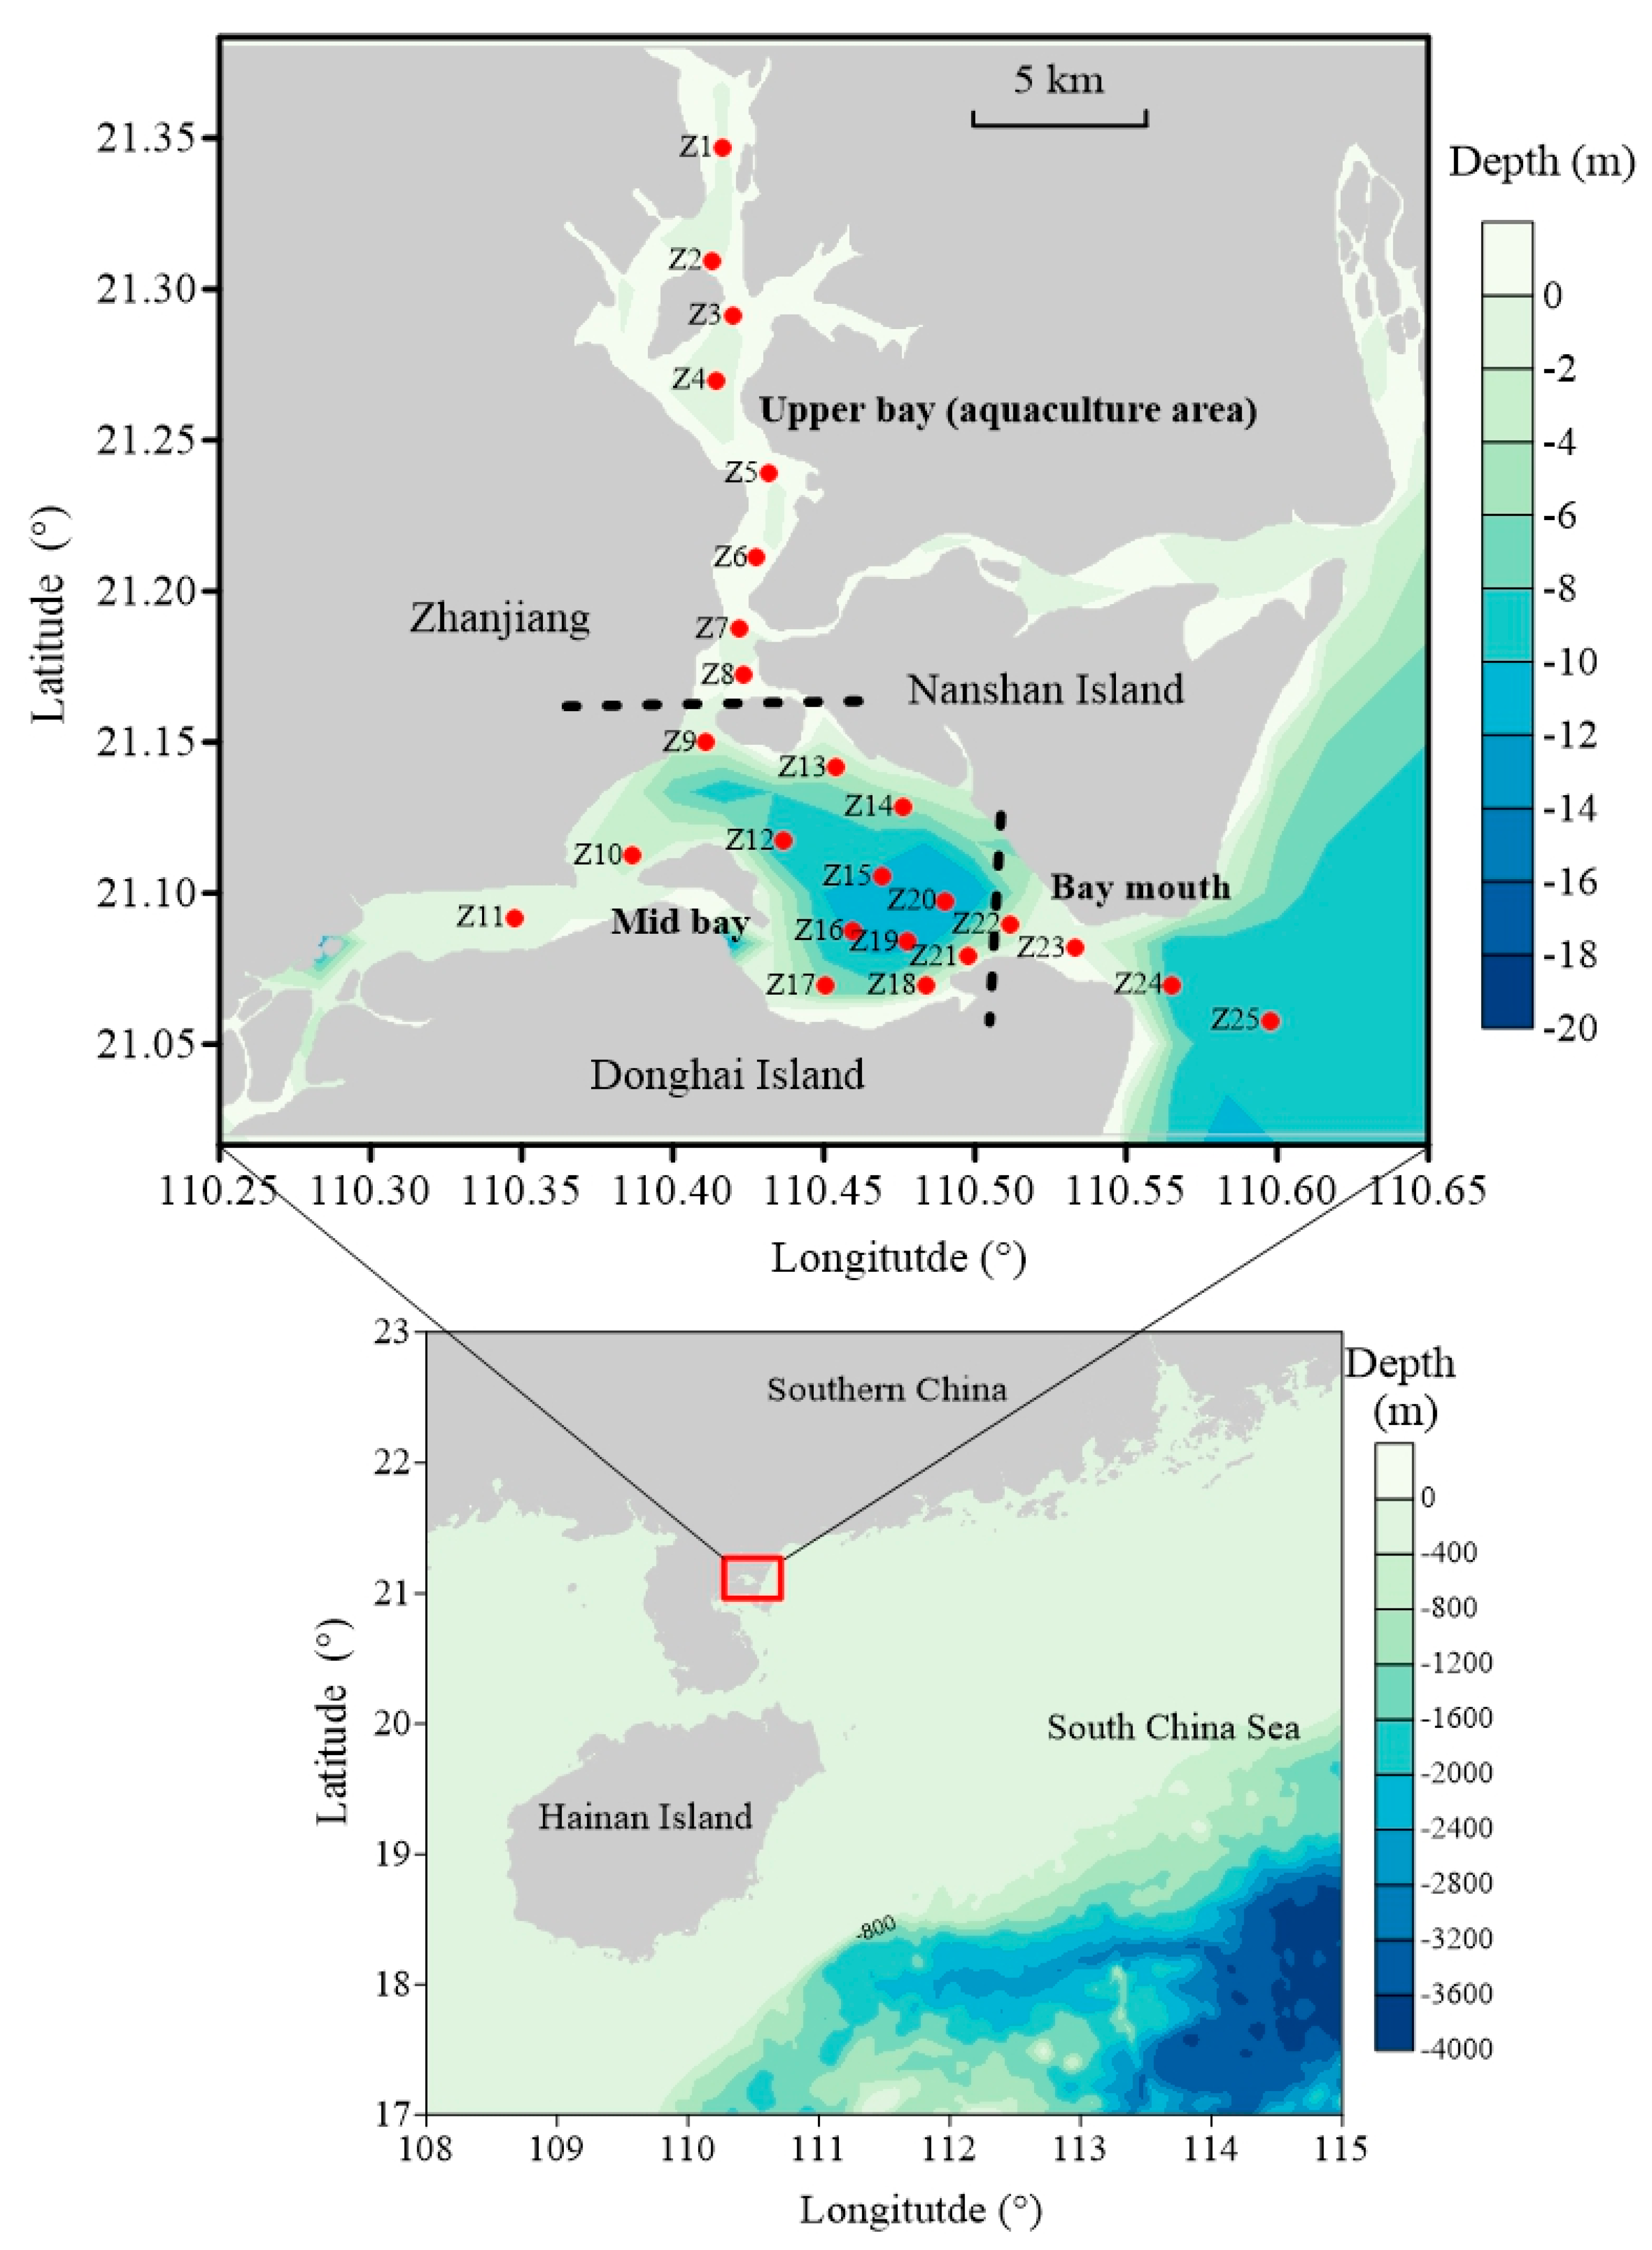
2.1. Field Sampling
2.2. Chemical Analysis
2.3. Mixing Model
2.4. SIAR Model
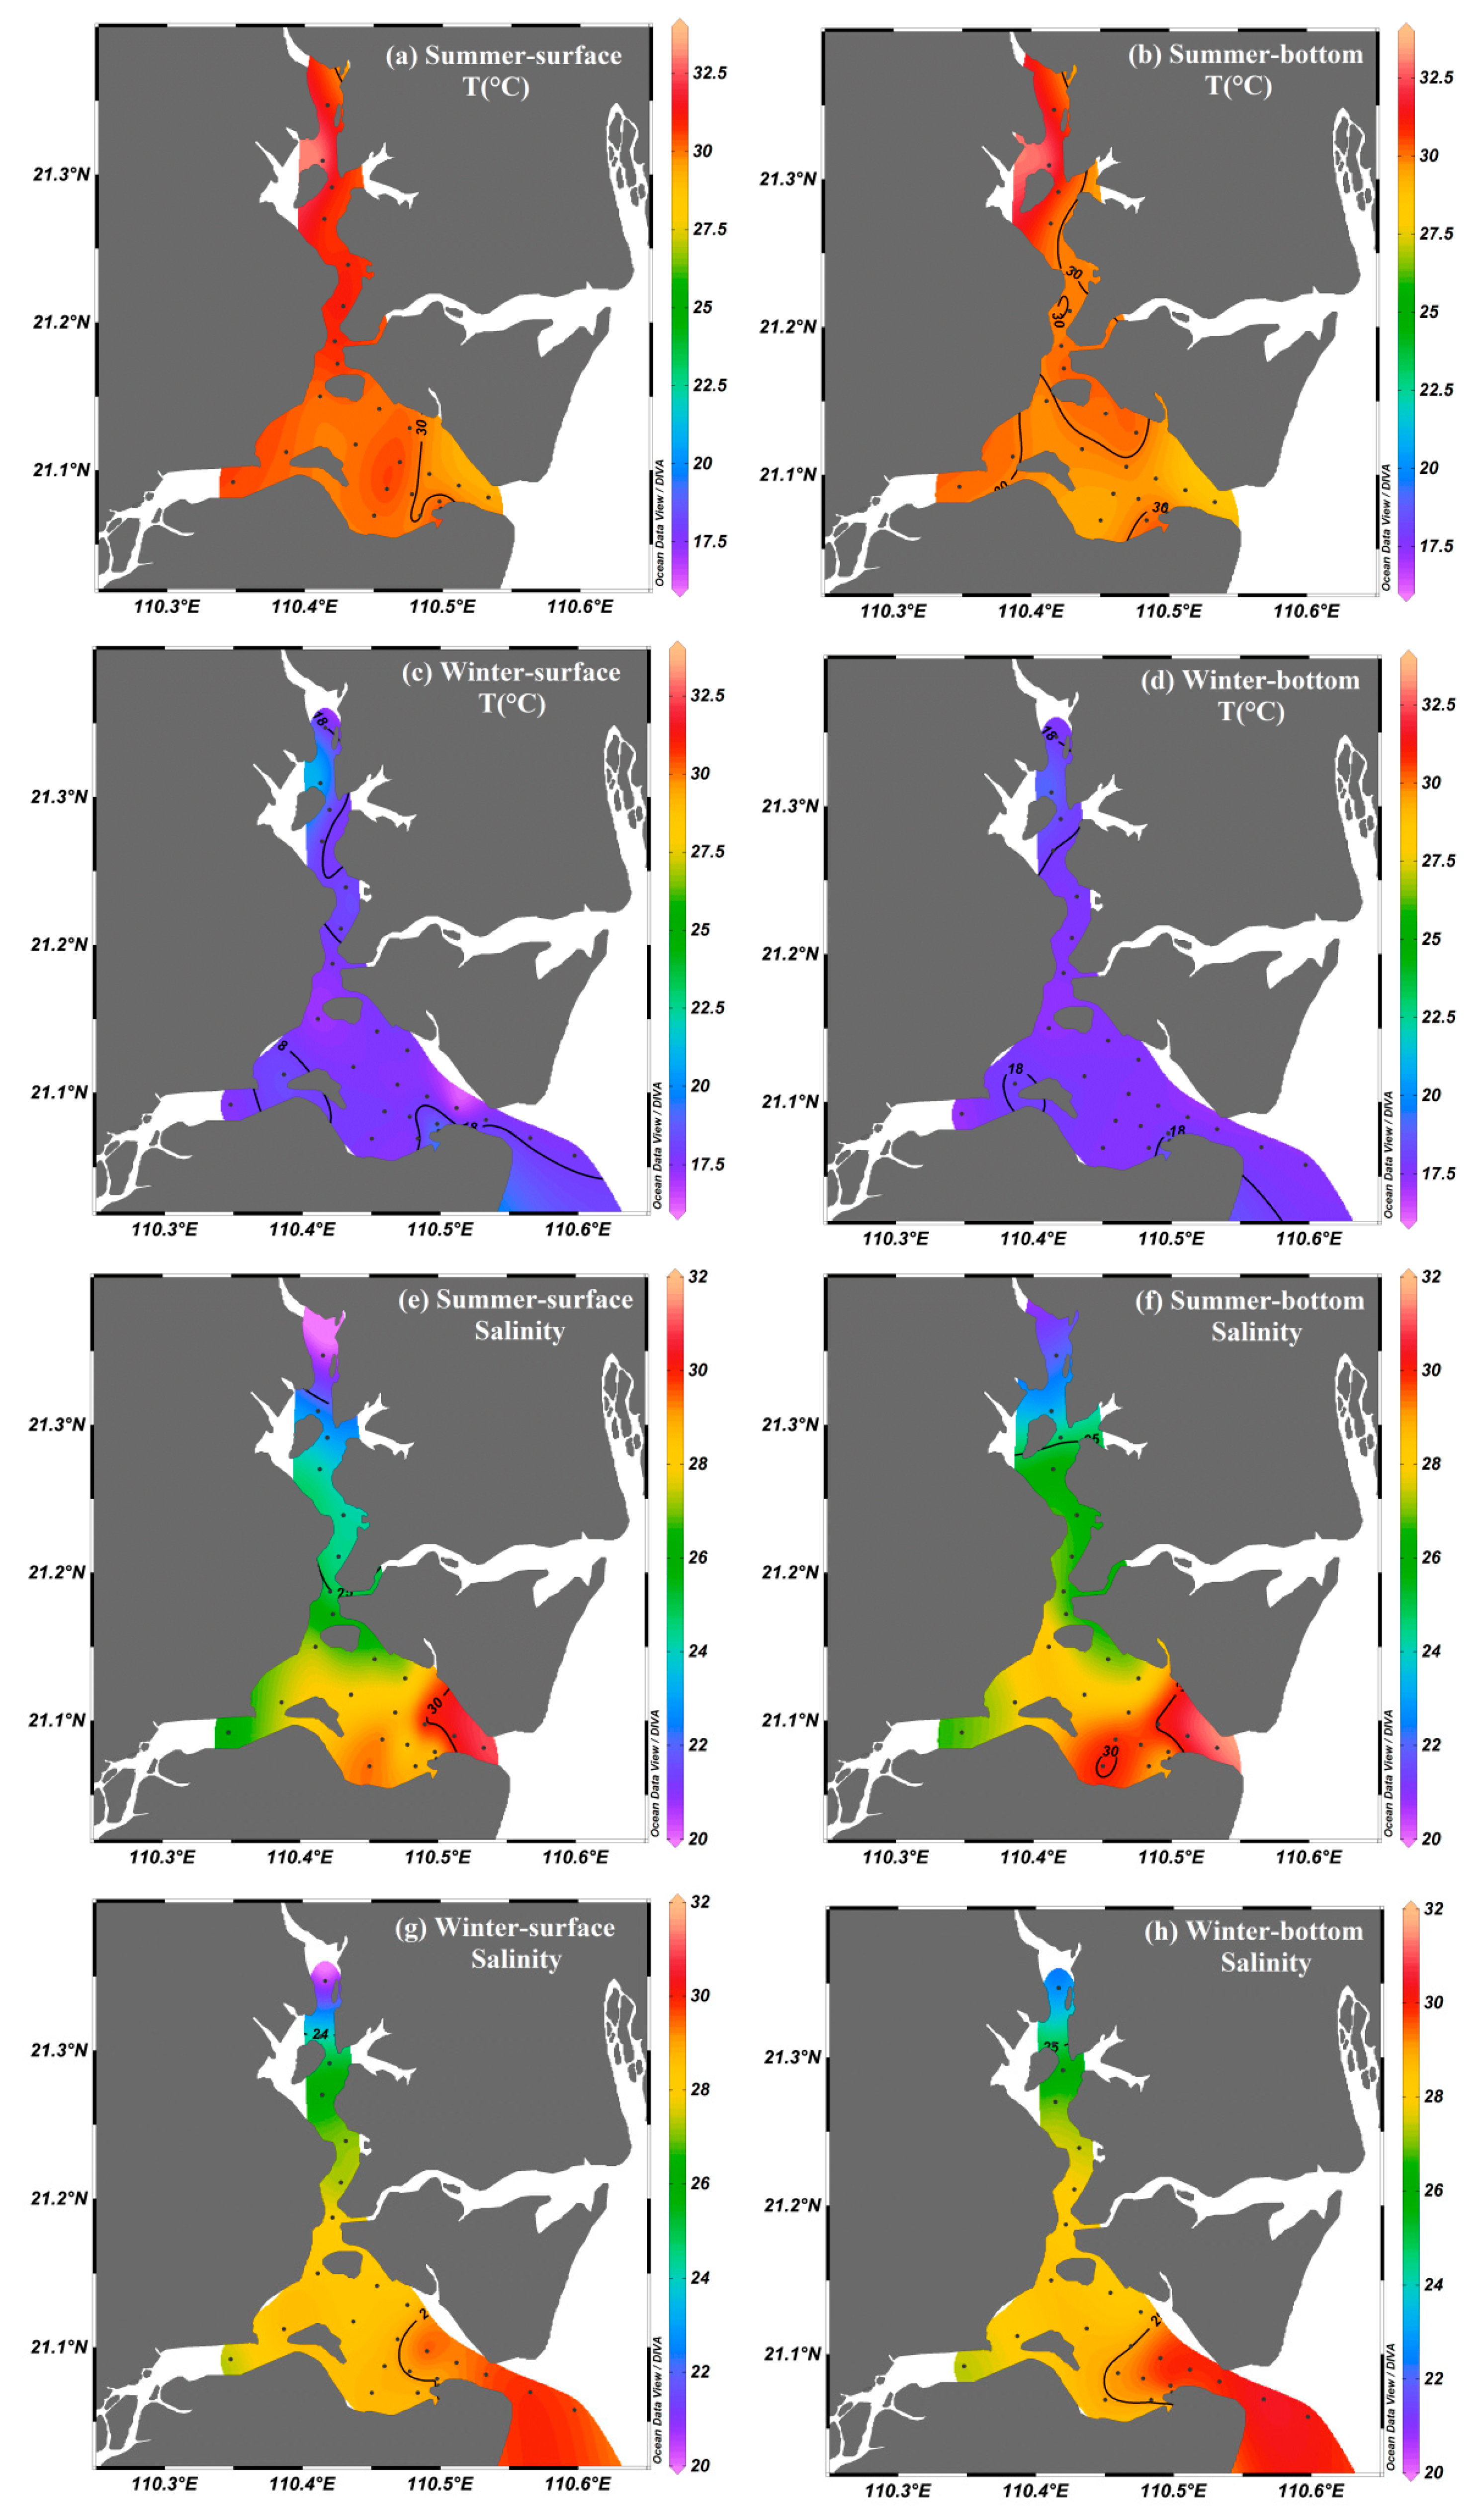
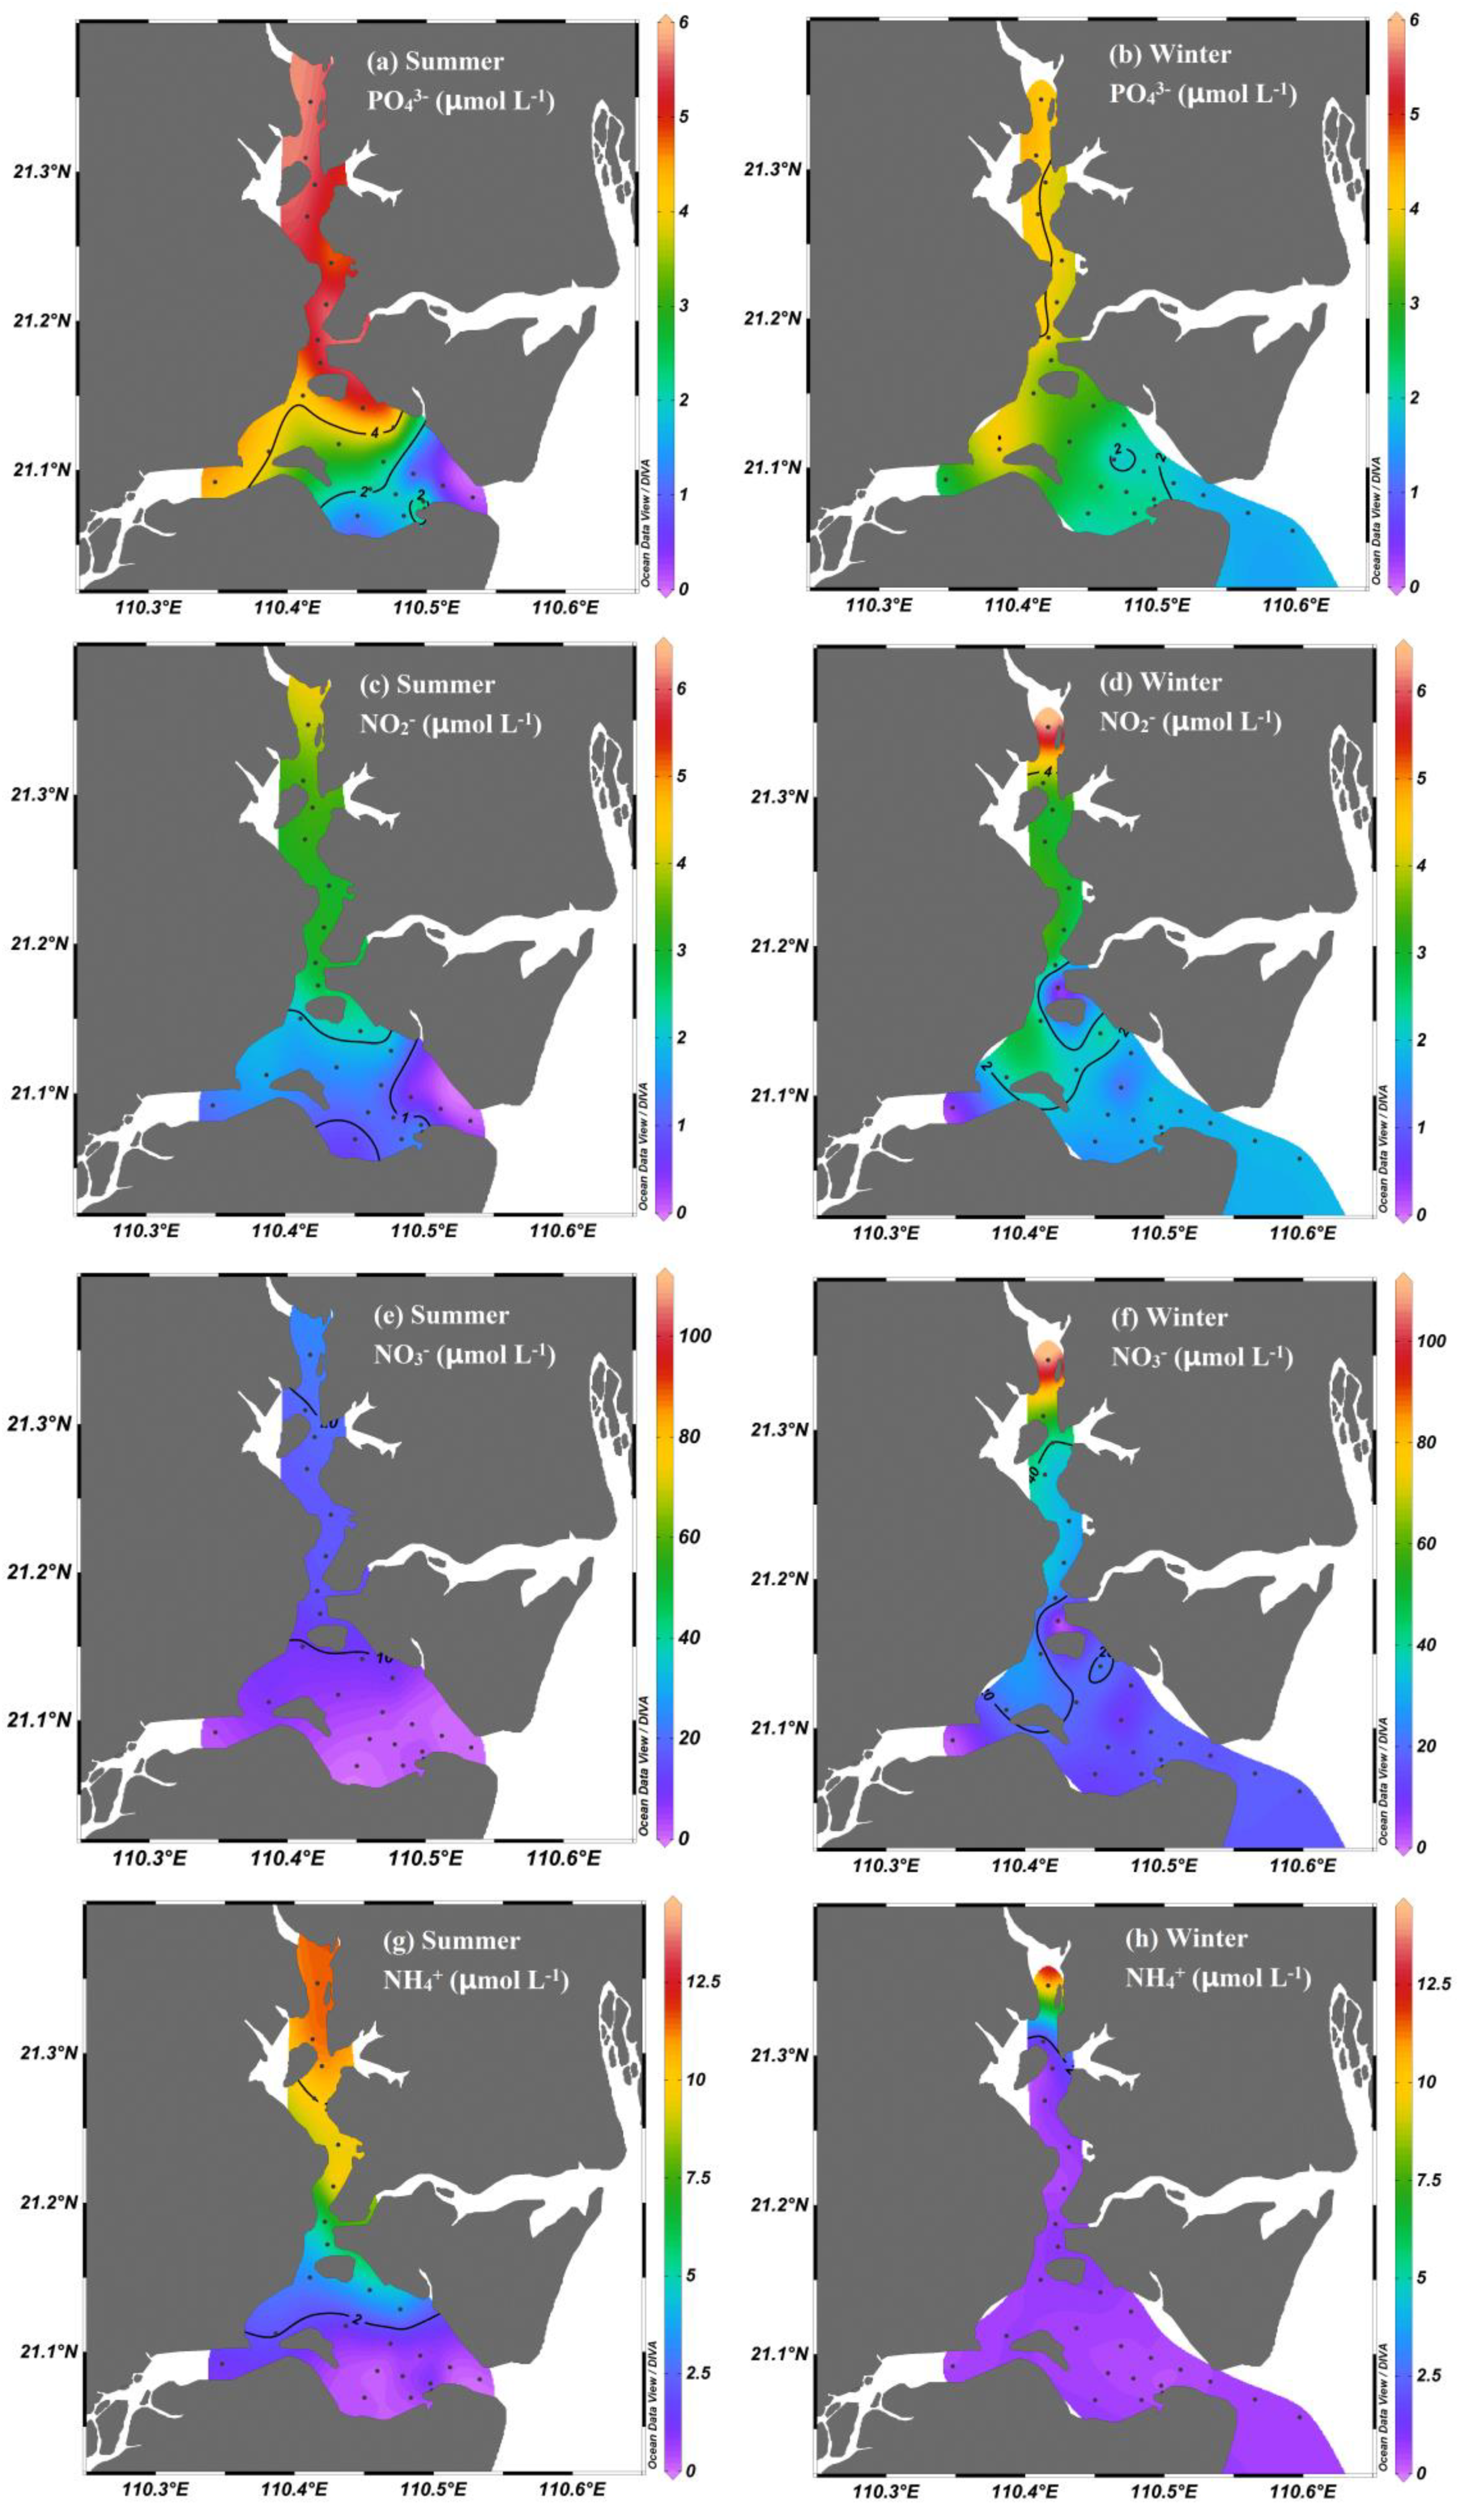
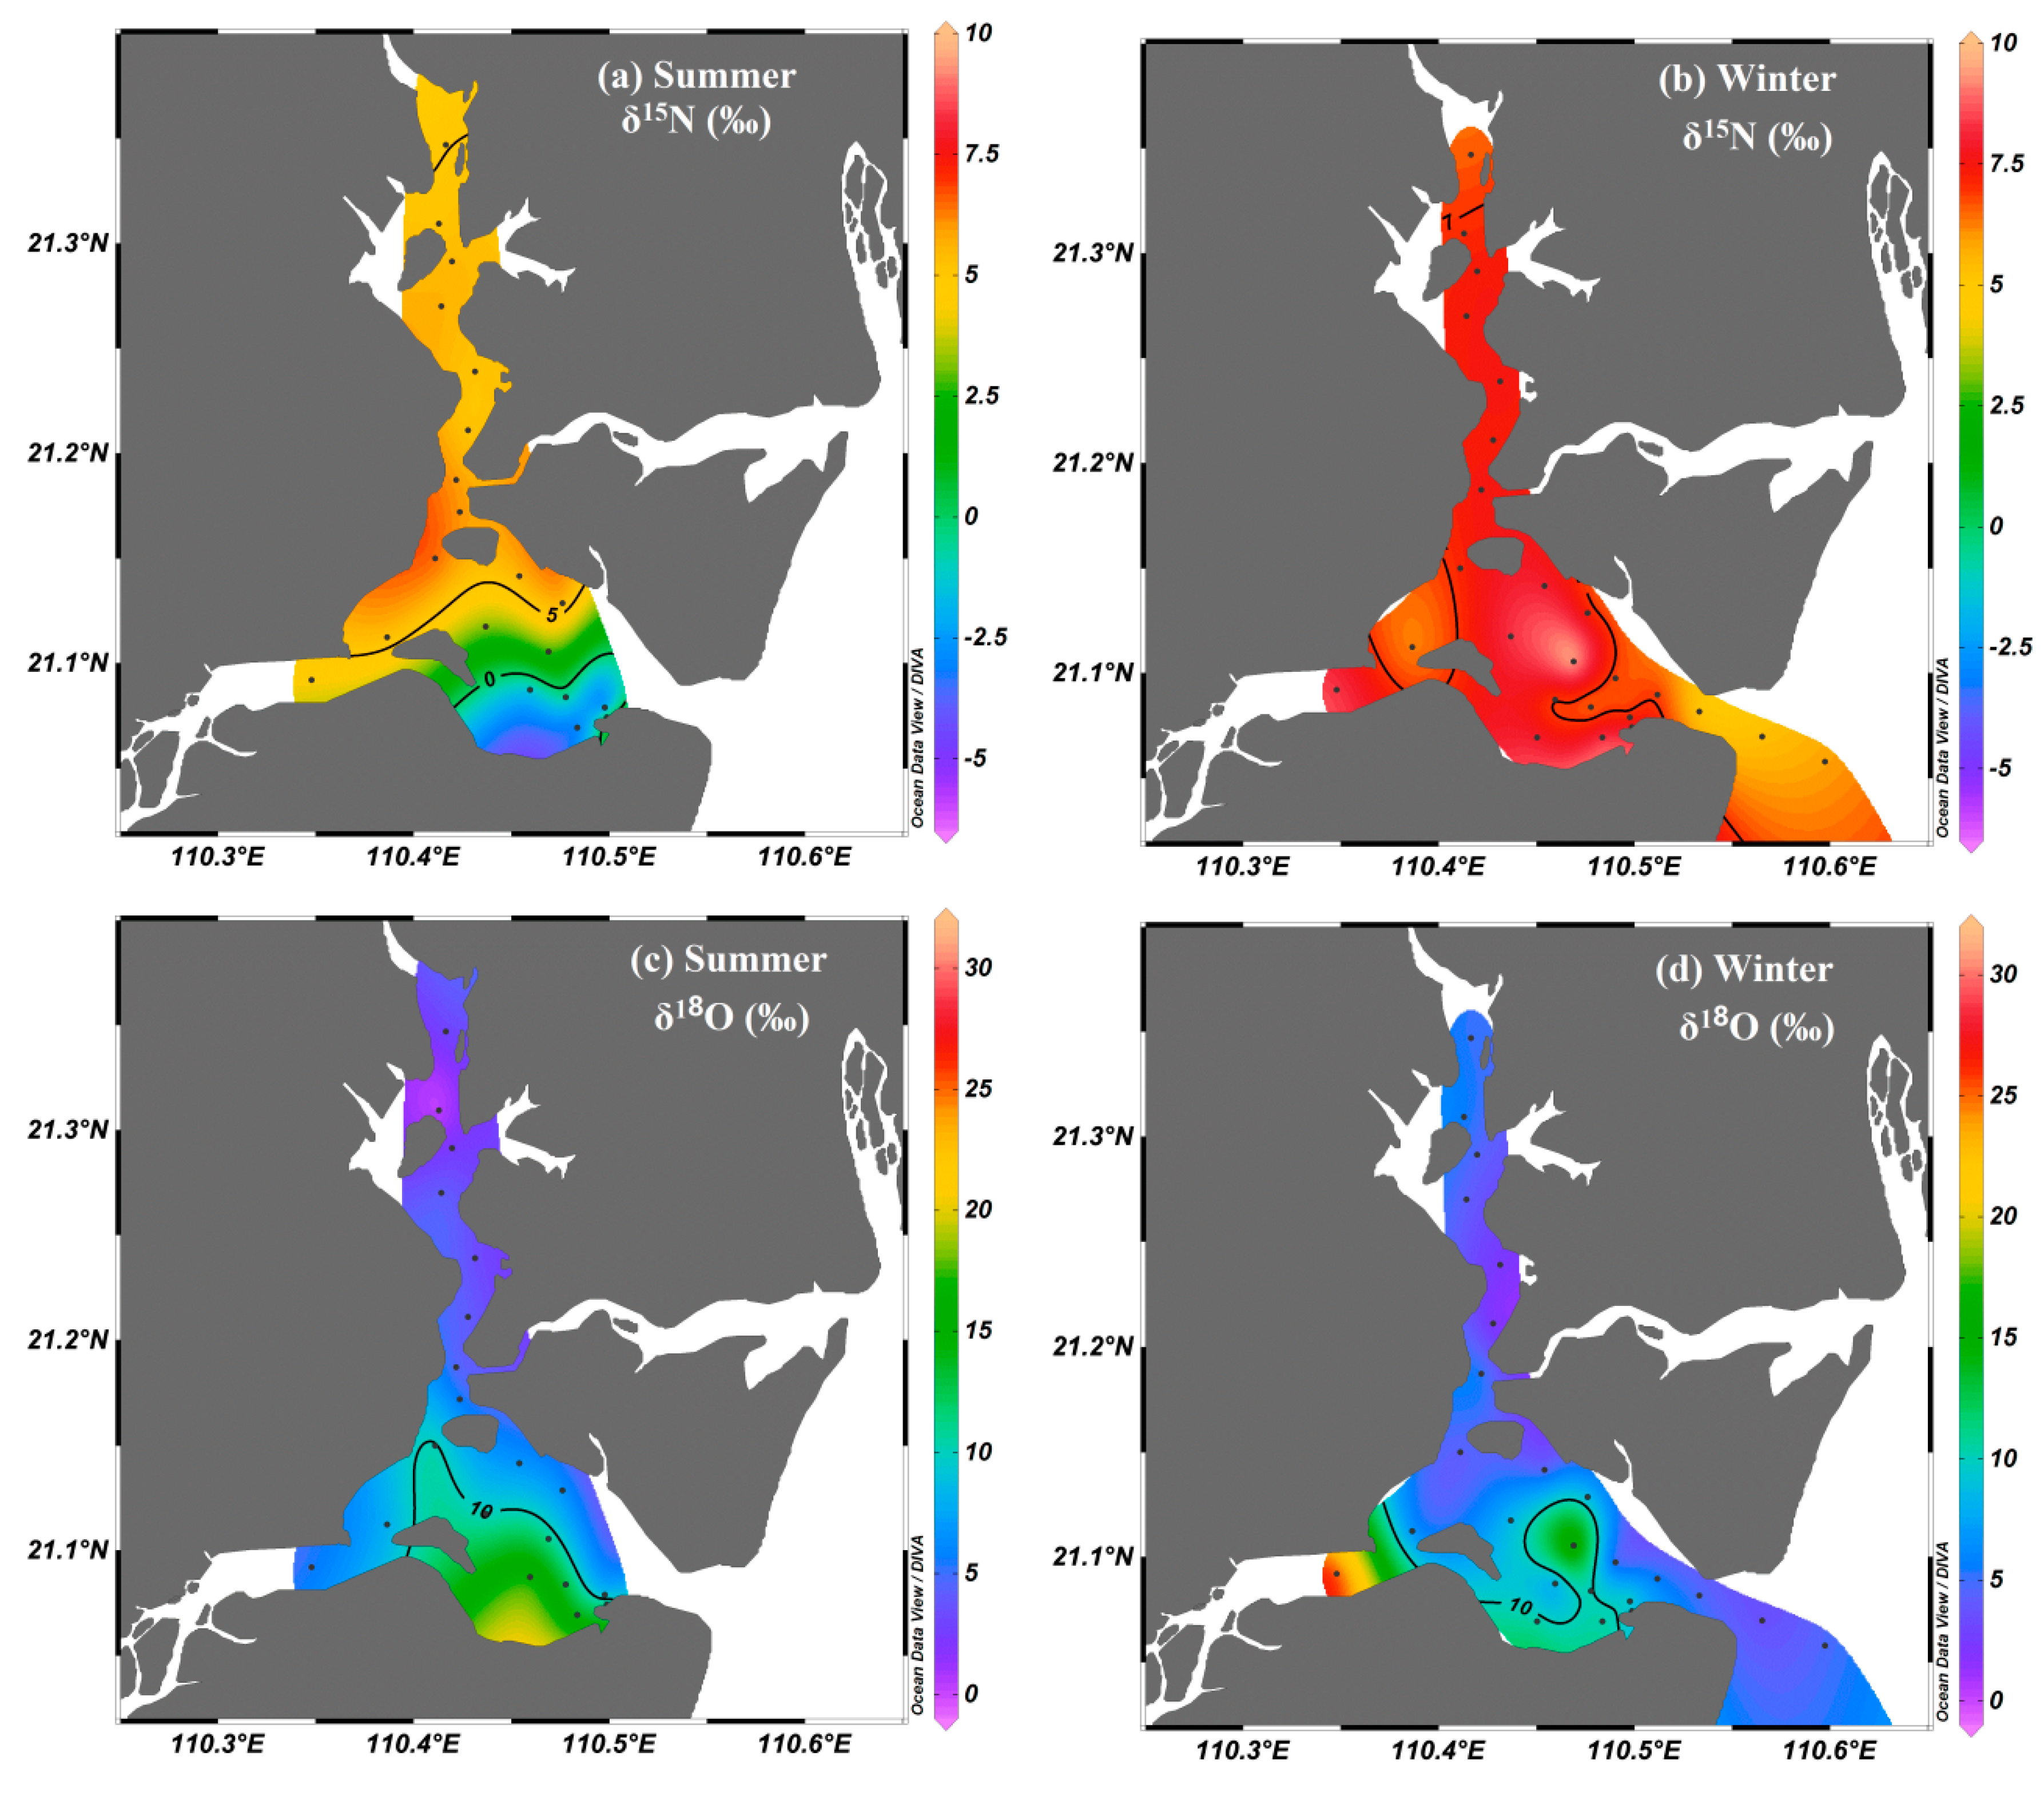
3. Results
4. Discussion
4.1. Limiting Nutrients in Zhanjiang Bay
4.2. Biological Processes of NO3− in Zhanjiang Bay
4.3. Sources of NO3− to the Bay
5. Conclusions
Author Contributions
Funding
Conflicts of Interest
References
- Diaz, R.J.; Rosenberg, R. Spreading dead zones and consequences for marine ecosystems. Science 2008, 321, 926–929. [Google Scholar] [CrossRef]
- Sharples, J.; Middelburg, J.J.; Fennel, K.; Jickells, T.D. What proportion of riverine nutrients reaches the open ocean? Glob. Biogeochem. Cycles 2017, 31, 39–58. [Google Scholar] [CrossRef] [Green Version]
- Yan, X.; Xu, M.N.; Wan, X.S.; Yang, J.Y.T.; Trull, T.W.; Dai, M.; Kao, S.J. Dual isotope measurements reveal zoning of nitrate processing in the summer Changjiang (Yangtze) River plume. Geophys. Res. Lett. 2017, 44, 12289–12297. [Google Scholar] [CrossRef] [Green Version]
- Lao, Q.; Chen, F.; Liu, G.; Chen, C.; Jin, G.; Zhu, Q.; Wei, C.; Zhang, C. Isotopic evidence for the shift of nitrate sources and active biological transformation on the western coast of Guangdong Province, South China. Mar. Pollut. Bull. 2019, 142, 603–612. [Google Scholar] [CrossRef]
- Ye, F.; Jia, G.; Xie, L.; Wei, G.; Xu, J. Isotope constraints on seasonal dynamics of dissolved and particulate n in the pearl river estuary, south china. J. Geophys. Res. Ocean. 2016, 121, 8689–8705. [Google Scholar]
- Yang, Z.; Chen, J.; Li, H.; Jin, H.; Gao, S.; Ji, Z.; Zhu, Y.; Ran, L.; Zhang, J.; Liao, Y. Sources of nitrate in Xiangshan Bay (China), as identified using nitrogen and oxygen isotopes. Estuar. Coast. Shelf Sci. 2018, 207, 109–118. [Google Scholar] [CrossRef]
- Huang, X.P.; Huang, L.M.; Yue, W.Z. The characteristics of nutrients and eutrophication in the Pearl River Estuary, South China. Mar. Pollut. Bull. 2003, 47, 30–36. [Google Scholar] [CrossRef]
- Galloway, J.N.; Dentener, F.J.; Capone, D.G.; Boyer, E.W.; Howarth, R.W.; Seitzinger, S.P.; Asner, G.P.; Cleveland, C.C.; Green, P.A.; Holland, E.A. Nitrogen cycles: Past, present, and future. Biogeochemistry 2004, 70, 153–226. [Google Scholar] [CrossRef]
- Kendall, C. Tracing nitrogen sources and cycling in catchments. In Isotope Tracers in Catchment Hydrology; Kendall, C., McDonnel, J.J., Eds.; Elsevier: New York, NY, USA, 1998; pp. 519–576. [Google Scholar]
- Moore, C.M.; Mills, M.M.; Arrigo, K.R.; Bermanfrank, I.; Bopp, L.; Boyd, P.W.; Galbraith, E.D.; Geider, R.J.; Guieu, C.; Jaccard, S.L. Processes and patterns of oceanic nutrient limitation. Nat. Geosci. 2013, 6, 701–710. [Google Scholar] [CrossRef] [Green Version]
- Xue, D.; De Baets, B.; Van Cleemput, O.; Hennessy, C.; Berglund, M.; Boeckx, P. Use of a bayesian isotope mixing model to estimate proportional contributions of multiple nitrate sources in surface water. Environ. Pollut. 2012, 161, 43–49. [Google Scholar] [CrossRef]
- Granger, J.; Sigman, D.M.; Needoba, J.A.; Harrison, P.J. Coupled nitrogen and oxygen isotope fractionation of nitrate during assimilation by cultures of marine phytoplankton. Limnol. Oceanogr. 2004, 49, 1763–1773. [Google Scholar] [CrossRef] [Green Version]
- Sigman, D.M.; Granger, J.; Difiore, P.J.; Lehmann, M.F.; Ho, R.; Cane, G.; Geen, A.V. Coupled nitrogen and oxygen isotope measurements of nitrate along the eastern north pacific margin. Glob. Biogeochem. Cycles 2005, 19, GB4022. [Google Scholar] [CrossRef]
- Sigman, D.M.; Robinson, R.; Knapp, A.N.; Geen, A.V.; Mccorkle, D.C.; Brandes, J.A.; Thunell, R.C. Distinguishing between water column and sedimentary denitrification in the santa barbara basin using the stable isotopes of nitrate. Geochem. Geophys. Geosystems 2013, 4, 1–20. [Google Scholar] [CrossRef] [Green Version]
- Xue, D.; Botte, J.; Baets, B.D.; Accoe, F.; Nestler, A.; Taylor, P.; Cleemput, O.V.; Berglund, M.; Boeckx, P. Present limitations and future prospects of stable isotope methods for nitrate source identification in surface- and groundwater. Water Res. 2009, 43, 1159–1170. [Google Scholar] [CrossRef]
- Granger, J.; Sigman, D.M.; Lehmann, M.F.; Tortell, P.D. Nitrogen and oxygen isotope fractionation during dissimilatory nitrate reduction by denitrifying bacteria. Limnol. Oceanogr. 2008, 53, 2533–2545. [Google Scholar] [CrossRef]
- Zhang, M.; Zhi, Y.; Shi, J.; Wu, L. Apportionment and uncertainty analysis of nitrate sources based on the dual isotope approach and a bayesian isotope mixing model at the watershed scale. Sci. Total Environ. 2018, 639, 1175–1187. [Google Scholar] [CrossRef]
- Zhang, J.; Fengxia, Z.; Chunliang, C.; Xingli, S.; Yuzhen, S.; Hui, Z.; Fajin, C.; Yiguo, H. Spatial distribution and correlation characteristics of heavy metals in the seawater, suspended particulate matter and sediments in Zhanjiang Bay, China. PLoS ONE 2018, 13, e0201414. [Google Scholar] [CrossRef] [Green Version]
- Shi, Y.; Zhang, Y.; Sun, X. Spatiotemporal distribution of eutrophication and its relationship with environmental factors in Zhanjiang Sea bay area. Environ. Sci. Technol. 2015, 38, 90–96. (In Chinese) [Google Scholar]
- Chen, F.; Lao, Q.; Jia, G.; Chen, C.; Zhu, Q.; Zhou, X. Seasonal variations of nitrate dual isotopes in wet deposition in a tropical city in china. Atmos. Environ. 2019, 196, 1–9. [Google Scholar] [CrossRef]
- McIlvin, M.R.; Altabet, M.A. Chemical conversion of nitrate and nitrite to nitrous oxide for nitrogen and oxygen isotopic analysis in freshwater and seawater. Anal. Chem. 2005, 77, 5589–5595. [Google Scholar] [CrossRef]
- Dähnke, K.; Bahlmann, E.; Emeis, K. A nitrate sink in estuaries? An assessment by means of stable nitrate isotopes in the Elbe Estuary. Limnol. Oceanogr. 2008, 53, 1504–1511. [Google Scholar] [CrossRef] [Green Version]
- Fry, B. Conservative mixing of stable isotopes across estuarine salinity gradients: A conceptual framework for monitoring watershed influences on downstream fisheries production. Estuaries 2002, 25, 264–271. [Google Scholar] [CrossRef]
- Moore, J.W.; Semmens, B.X. Incorporating uncertainty and prior information into stable isotope mixing models. Ecol. Lett. 2008, 11, 470–480. [Google Scholar] [CrossRef]
- Cheng, H.; Ma, Q.; Yang, F. Level of eutrophication and phytoplankton diversity in Zhanjiang Bay. Trans. Oceanol. Limnol. 2009, 3, 123–128. (In Chinese) [Google Scholar]
- Zhang, L.; Yu, L.; Tang, M. Eutrophication and red tide in coastal waters of Zhanjiang port. Water Resour. Prot. 2009, 25, 50–54. (In Chinese) [Google Scholar]
- Zhang, G.; Gong, Y.; Sun, X. Study on the ecological characteristics of phytoplankton community in Zhanjiang Bay. Mar. Sci. Bull. 2012, 5, 38–43. (In Chinese) [Google Scholar]
- Ye, F.; Ni, Z.; Xie, L.; Wei, G.; Jia, G. Isotopic evidence for the turnover of biological reactive nitrogen in the pearl river estuary, south china. J. Geophys. Res. Biogeosci. 2015, 120, 661–672. [Google Scholar] [CrossRef]
- Wankel, S.D.; Kendall, C.; Francis, C.A.; Paytan, A. Nitrogen sources and cycling in the San Francisco bay estuary: A nitrate dual isotopic composition approach. Limnol. Oceanogr. 2006, 51, 1654–1664. [Google Scholar] [CrossRef] [Green Version]
- Sanders, T.; Schöl, A.; Dähnke, K. Hot spots of nitrification in the elbe estuary and their impact on nitrate regeneration. Estuaries Coasts 2018, 41, 128–138. [Google Scholar] [CrossRef]
- Chen, F.; Jia, G.; Chen, J. Nitrate sources and watershed denitrification inferred from nitrate dual isotopes in the Beijiang River, South China. Biogeochemistry 2009, 94, 163–174. [Google Scholar] [CrossRef]
- Mayer, B.; Boyer, E.W.; Goodale, C.; Jaworski, N.A.; van Breemen, N.; Howarth, R.W.; Seitzinger, S.; Billen, G.; Lajtha, K.; Nadelhoffer, K.; et al. Sources of nitrate in rivers draining sixteen watersheds in the northeastern U.S.: Isotopic constraints. Biogeochemistry 2002, 57, 171–197. [Google Scholar] [CrossRef]
- Wankel, S.D.; Kendall, C.; Paytan, A. Using nitrate dual isotopic composition (δ15n and δ18o) as a tool for exploring sources and cycling of nitrate in an estuarine system: Elkhorn slough, California. J. Geophys. Res. Biogeosci. 2015, 114, 315–327. [Google Scholar]
- Wong, W.W.; Grace, M.R.; Cartwright, I.; Cook, P.L.M. Sources and fate of nitrate in a groundwater-fed estuary elucidated using stable isotope ratios of nitrogen and oxygen. Limnol. Oceanogr. 2014, 59, 1493–1509. [Google Scholar] [CrossRef]
- Zhang, L.; Wang, L.; Yin, K.; Ying, L.; Zhang, D.; Yang, Y.; Huang, X. Pore water nutrient characteristics and the fluxes across the sediment in the pearl river estuary and adjacent waters, china. Estuar. Coast. Shelf Sci. 2013, 133, 182–192. [Google Scholar] [CrossRef]
- Xiao, H.W.; Xie, L.H.; Long, A.M.; Ye, F.; Pan, Y.P.; Li, D.N.; Long, Z.H.; Chen, L.; Xiao, H.Y.; Liu, C.Q. Use of isotopic compositions of nitrate in tsp to identify sources and chemistry in south china sea. Atmos. Environ. 2015, 109, 70–78. [Google Scholar] [CrossRef]
- Yang, J.Y.T.; Hsu, S.C.; Dai, M.; Hsiao, S.S.Y.; Kao, S.J. Isotopic composition of water-soluble nitrate in bulk atmospheric deposition at dongsha island: Sources and implications of external n supply to the Northern South China Sea. Biogeosciences 2014, 11, 9661–9695. [Google Scholar] [CrossRef] [Green Version]
- Dai, M.; Wang, L.; Guo, X.; Zhai, W.; Li, Q.; He, B.; Kao, S.J. Nitrification and inorganic nitrogen distribution in a large perturbed river/estuarine system: The Pearl River Estuary, China. Biogeosciences 2008, 5, 1227–1244. [Google Scholar] [CrossRef] [Green Version]
- Silva, S.R.; Ging, P.B.; Lee, R.W.; Ebbert, J.C.; Tesoriero, A.J.; Inkpen, E.L. Forensic applications of nitrogen and oxygen isotopes in tracing nitrate sources in urban environments. Environ. Forensics 2002, 3, 125–130. [Google Scholar] [CrossRef]
- Zhang, Q.; Streets, D.G.; He, K.; Wang, Y.; Richter, A.; Burrows, J.P.; Uno, I.; Jang, C.J.; Chen, D.; Yao, Z. Nox emission trends for china, 1995—2004: The view from the ground and the view from space. J. Geophys. Res. Atmos. 2007, 112, D22306. [Google Scholar] [CrossRef] [Green Version]


© 2020 by the authors. Licensee MDPI, Basel, Switzerland. This article is an open access article distributed under the terms and conditions of the Creative Commons Attribution (CC BY) license (http://creativecommons.org/licenses/by/4.0/).
Share and Cite
Li, J.; Cao, R.; Lao, Q.; Chen, F.; Chen, C.; Zhou, X.; Meng, Y.; Zhu, Q. Assessing Seasonal Nitrate Contamination by Nitrate Dual Isotopes in a Monsoon-Controlled Bay with Intensive Human Activities in South China. Int. J. Environ. Res. Public Health 2020, 17, 1921. https://doi.org/10.3390/ijerph17061921
Li J, Cao R, Lao Q, Chen F, Chen C, Zhou X, Meng Y, Zhu Q. Assessing Seasonal Nitrate Contamination by Nitrate Dual Isotopes in a Monsoon-Controlled Bay with Intensive Human Activities in South China. International Journal of Environmental Research and Public Health. 2020; 17(6):1921. https://doi.org/10.3390/ijerph17061921
Chicago/Turabian StyleLi, Jiacheng, Ruixue Cao, Qibin Lao, Fajin Chen, Chunqing Chen, Xin Zhou, Yafei Meng, and Qingmei Zhu. 2020. "Assessing Seasonal Nitrate Contamination by Nitrate Dual Isotopes in a Monsoon-Controlled Bay with Intensive Human Activities in South China" International Journal of Environmental Research and Public Health 17, no. 6: 1921. https://doi.org/10.3390/ijerph17061921