The Use of Deep Learning to Predict Stroke Patient Mortality


1
Department of Physical Therapy, Youngsan University, Yangsan 626-790, Korea
2
Department of Computer Science, Kent State University, Kent, OH 44242, USA
3
Department of Healthcare Management, Youngsan University, Yangsan 626-790, Korea
*
Author to whom correspondence should be addressed.
Int. J. Environ. Res. Public Health 2019, 16(11), 1876; https://doi.org/10.3390/ijerph16111876
Submission received: 30 April 2019
/
Revised: 23 May 2019
/
Accepted: 24 May 2019
/
Published: 28 May 2019
Abstract
:The increase in stroke incidence with the aging of the Korean population will rapidly impose an economic burden on society. Timely treatment can improve stroke prognosis. Awareness of stroke warning signs and appropriate actions in the event of a stroke improve outcomes. Medical service use and health behavior data are easier to collect than medical imaging data. Here, we used a deep neural network to detect stroke using medical service use and health behavior data; we identified 15,099 patients with stroke. Principal component analysis (PCA) featuring quantile scaling was used to extract relevant background features from medical records; we used these to predict stroke. We compared our method (a scaled PCA/deep neural network [DNN] approach) to five other machine-learning methods. The area under the curve (AUC) value of our method was 83.48%; hence; it can be used by both patients and doctors to prescreen for possible stroke.
1. Introduction
Stroke is one of the leading causes of death and disability worldwide [1]. In Korea, stroke is the second-leading cause of death [2]. The Korean population is aging very rapidly; the percentage aged ≥ 60 years is predicted to increase from 13.7% in 2015 to 28.6% by 2050 [3]. Incidence of stroke increases with age. Stroke patients have longer hospital stays and higher re-admission rates and medical costs than patients with other chronic diseases [4,5]. In the U.S., the total annual direct medical costs of stroke in 2008 were USD 18.8 billion; in the same year, the per-person expenditure was USD 7657 [6]. Length of hospital stay, medical expenditure, readmission rate, and accompanying comorbidities greatly affect medical resource use [7,8,9,10]. Studies on stroke patients are very important for efficient utilization of medical resources.
The concept of artificial intelligence (AI) has recently permeated various sectors of life, including rapidly evolving healthcare systems [11]. As electronic diagnoses, therapies, and record-keeping expand, it is essential to leverage, integrate, and optimize these advances [12]. In the field of medicine, patient data are amassed in distributed electronic health record (EHR) databases and voluminous clinical, imaging, and laboratory datasets, among others [13]. Such data can be utilized to predict disease incidence and prognosis.
Recent nationwide efforts seek to use big data to expand precision medicine to many other medical areas [14,15]. Precision medicine is broadly defined as patient-specific diagnosis and therapy [16]. EHRs and health insurance claims data can aid precision medicine by improving prognostic models [11]. Deep learning using big data has been employed to predict disease [17,18,19]. Deep learning is actively used in many fields, yielding satisfactory results when conventional analyses are not appropriate [20,21]. The deep-learning model of Xu et al. afforded better predictive performance than a generalized linear model (GLM), a least absolute shrinkage and selection operator (LASSO) model, and an autoregressive integrated moving average (ARIMA) model [22]. Therefore, deep learning can predict disease. However, few studies have sought to predict stroke mortality using big data.
To date, there have not been deep learning-based, but heuristic or nature-inspired methods for detecting stroke or cardiovascular diseases. Teoh [23] applied the neural network using different sources of temporal data from the electronic health record through a dual-input topology. Although this study used statistical data to predict stroke, major risk factors related to stroke were missed. Pereira et al. [24] provide stroke detection system using convolutional neural network with computed tomography. Although overall detection accuracy of this study is relatively high, it needs detailed medical images to diagnose the occurrence of stroke. Beriteli et al. [25] proposed a training technique to diagnose the ECG signals using the neural network. Wu et al. [26] applied the neural network to assess the risk levels of hypertension with health examination data.
Here, we identify factors affecting stroke mortality, and derive a predictive model based on deep learning, employing 2013–2016 Korean National Hospital Discharge In-depth Injury Survey (KNHDS) data. This will allow healthcare policymakers to improve the quality of medical care, evaluate its appropriateness, and employ diagnostic resources efficiently. Our research was performed to predict stroke mortality using large-scale electronic health records. This study is expected to expand the research that can prescreen diverse diseases the in e-health field in future.
2. Related Work
Several studies have used deep learning methods to solve various problems [27,28,29,30,31]. In particular, there have been many computer-aided diagnosis systems using deep learning for detecting diverse diseases [32,33,34,35,36,37,38,39,40,41]. Machine-learning/deep learning has been employed to detect or predict certain diseases using various approaches and datasets. Kim et al. [42] developed and validated several machine-learning models (i.e., support vector machine—SVM, random forest—RF, artificial neural network—ANN, and linear regression—LR) to identify the risk of osteoporosis in postmenopausal women; the cited authors used medical records such as those of the Korean National Health and Nutrition Surveys. Although its accuracy was acceptable, only relatively small datasets were used (1000 patients for training and 674 for testing). Wang et al. [43] sought to detect heart failure earlier using structured and unstructured data from EHRs and an RF classifier. Arandjelović et al. [44] applied a Markov process to predict various health outcomes using electronic medical records (EMRs). Putin et al. [45] sought to predict human chronological age using deep neural networks (DNNs); 60,600 common blood biochemistry and cell count test results were evaluated. Yoo et al. [46] developed a self-assessment system identifying adults at high risk of knee osteoarthritis using an ANN and various datasets. Hung et al. [19] used several classifiers (i.e., DNN, gradient-boosting decision tree—GBDT, LR, and SVM) to explore an EMC database of about 800,000 patients; the aim was to predict five-year stroke occurrence. Rajkomar et al. [47] used deep learning to predict several medical events by analyzing EMR data (216,221 adult patients). All of these previous studies used machine-learning/deep learning to detect diverse diseases. However, to the best of our knowledge, there have been few efforts to predict stroke with these methods.
3. Materials and Methods
3.1. Subjects
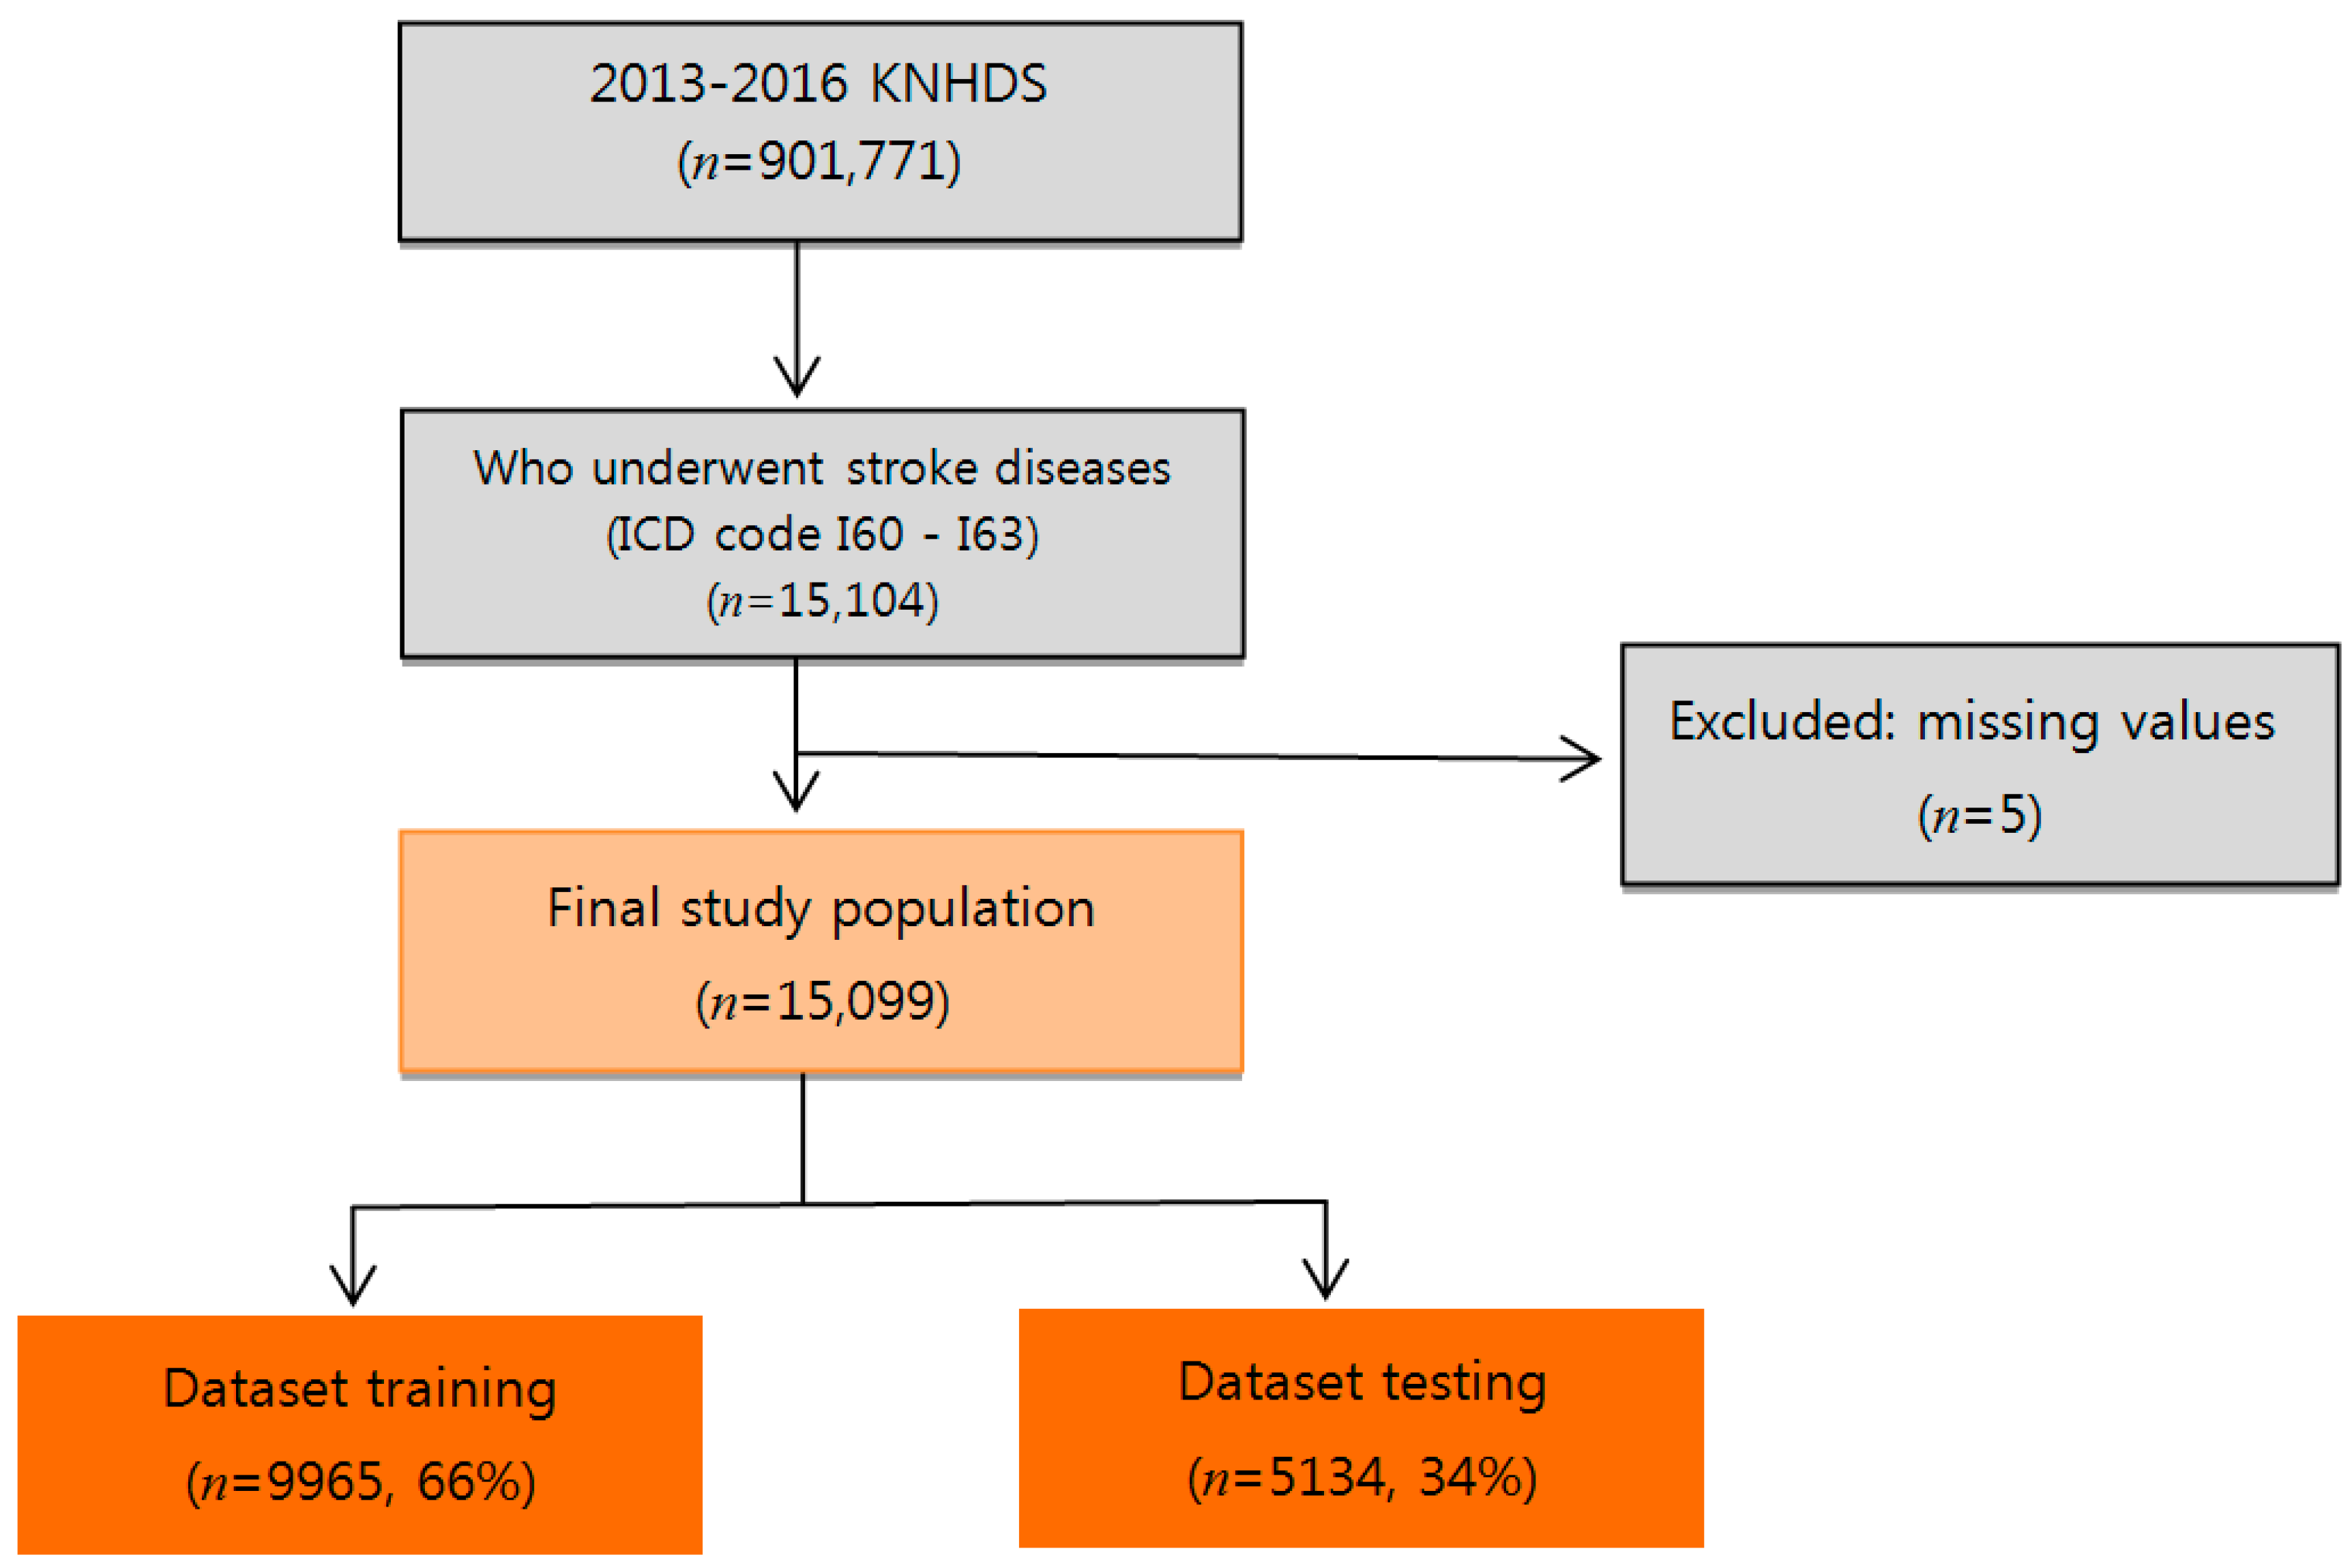
We used data from the KNHDS, collected from 2013 to 2016 by the Korea Centers for Disease Control and Prevention (KCDC) (Figure 1). The KNHDS collected data from about 150 hospitals nationwide, all with more than 100 beds [48]. The subjects were 15,099 stroke patients with primary International Classification of Diseases diagnostic codes corresponding to hemorrhagic stroke (I60–I62) and ischemic stroke (I63). Table 1 shows general statistical information about patients. The mean age of the subjects was 66 years. Of the patients, 54.7% were male, 45.3% were female; and 6.9% (1038 people) were patients who died.
3.2. Principal Variables
The dependent variable was mortality rate of stroke patients. Independent variables reflecting social demographic status included gender, age, and type of insurance. Medical variables included mode of admission, length of hospital stay, hospital region, total number of hospital beds, stroke type, brain surgery status, and Charlson Comorbidity Index (CCI) score. The CCI is widely used to adjust for comorbidities, and is given by the sum of weighted scores based on the presence/absence of 19 different medical conditions [49]. However, we excluded cerebrovascular diseases because they may overlap with the primary disease. Brain surgery was defined as microvascular decompression, craniotomy, cranioplasty, ventriculostomy with shunting, removal of a subdural/epidural hematoma, and endarterectomy. Type of insurance was defined as national health insurance, medicare, industrial accident, and car insurance. Admission mode was defined as emergency, ambulatory, and others. Stroke type was categorized as ischemic stroke and hemorrhagic stroke. The hospital regions were Seoul, metropolitan Seoul, Gyeonggi, and other. The total number of hospital beds per region was 100–299, 300–499, 500–999, or ≥ 1000.
3.3. Methods
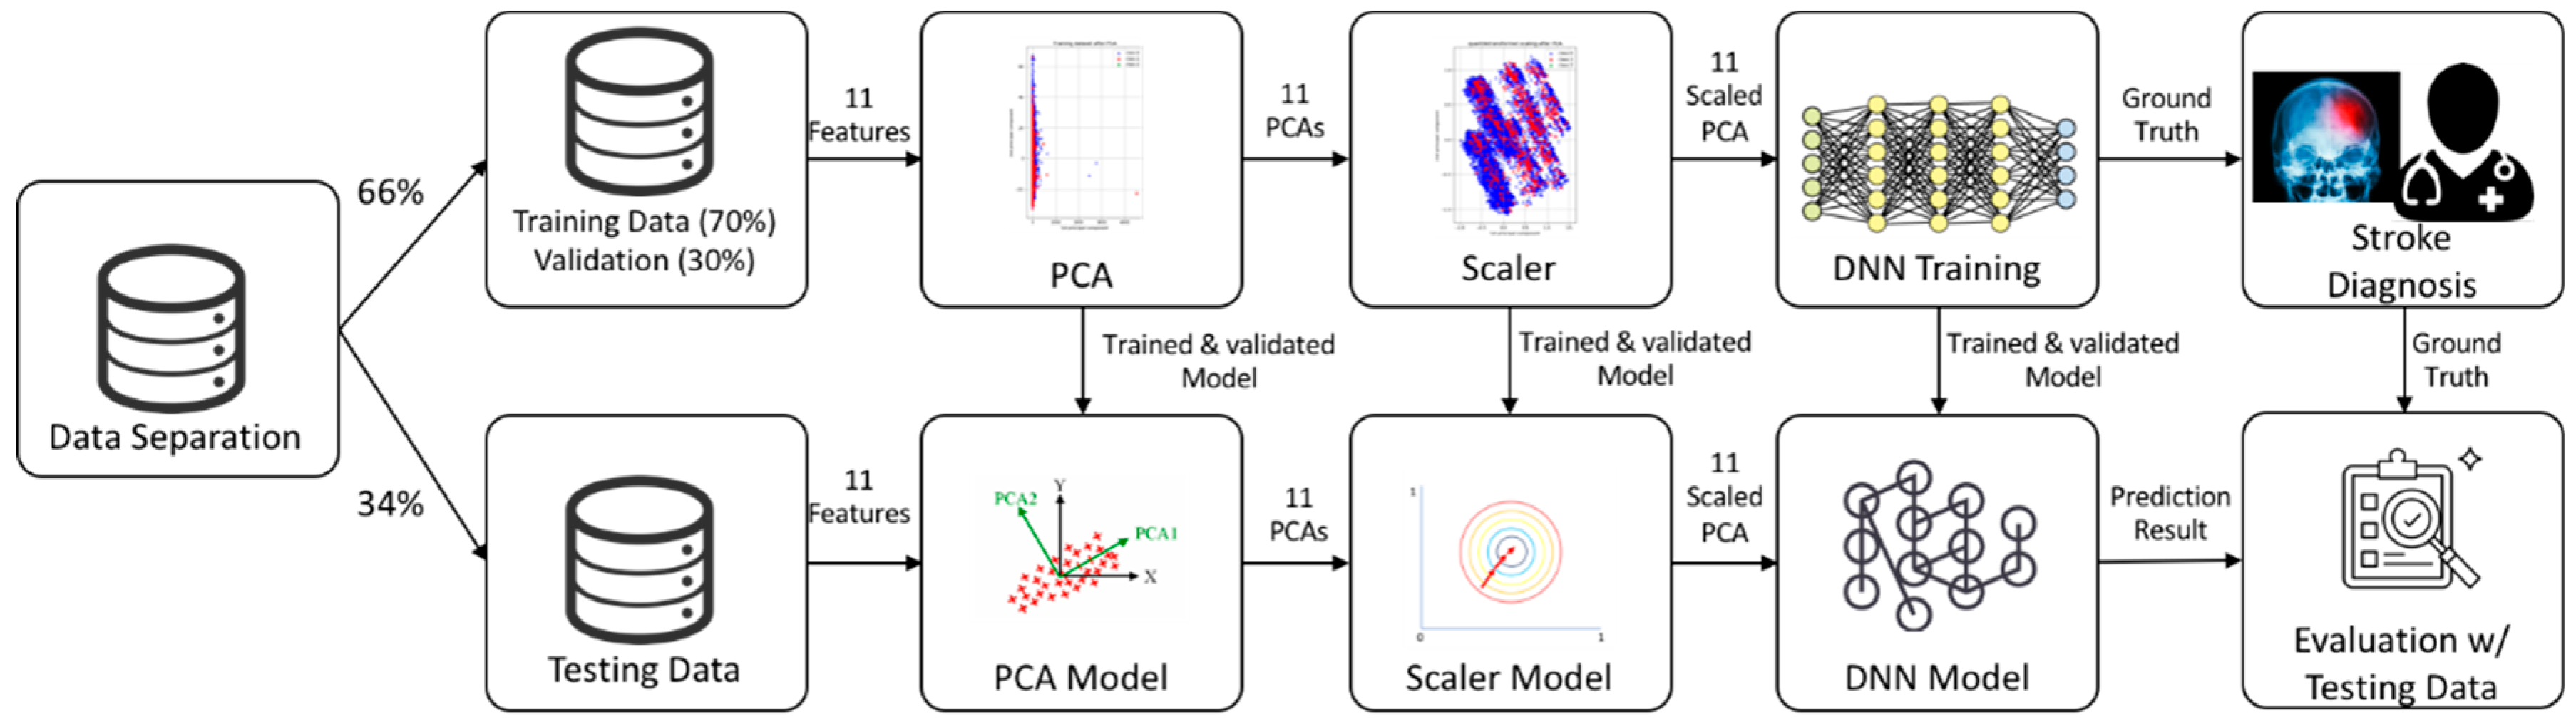
Our deep learning model included 11 variables: gender, age, type of insurance, mode of admission, brain surgery required, region, length of hospital stay, hospital location, the number of hospital beds, stroke type, and the CCI. We used a DNN/scaled principal component analysis (PCA) to automatically generate features from the data and identify risk factors for stroke. We enrolled 15,099 subjects with a history of stroke. Figure 2 shows the system architecture: (1) We used Korea National Health and Nutrition Examination Survey (KNHANES) data for the 11 included variables, where these data were divided into training (66%) and testing sets (34%); in the training set, we used 30% of the samples for validation; (2) we preprocessed data using both PCA and a scaler to convert categorical variables into continuous variables, and to generate models for testing; (3) we then trained the DNN using the scaled PCA variables and (4) compared the predicted results to “ground truth” data (clinician labels). The training and test data did not overlap.
Traditionally, detection performance is measured by evaluating accuracy (Acc). However, an imbalance was evident in the stroke datasets; more survival (n = 13,971) than non-survival (n = 1038) data were present. Thus, we used three additional metrics: sensitivity (Sn), specificity (Sp), and positive predictive value (PPV). The Sn reflects the probability of detecting non-survival; Sp reflects the probability of detecting survival; and PPV is the probability that non-survival status was corrected for appropriately. We used four parameters, true-positive (TP), true-negative (TN), false-positive (FP) and false-negative (FN), to evaluate model performance. The TP is the correctly predicted stroke rate and the TN is the correctly predicted non-stroke rate. The FP and FN are the incorrectly predicted stroke and non-stroke rates, respectively. The Sn, Sp, PPV, and Acc were calculated as follows:
Sn = TP/(TP + FN)
Sp = TN/(TN + FP)
PPV = TP/(TP + FP)
Acc = (TP + TN)/(TP + FN + FP + TN)
3.4. Preprocessing
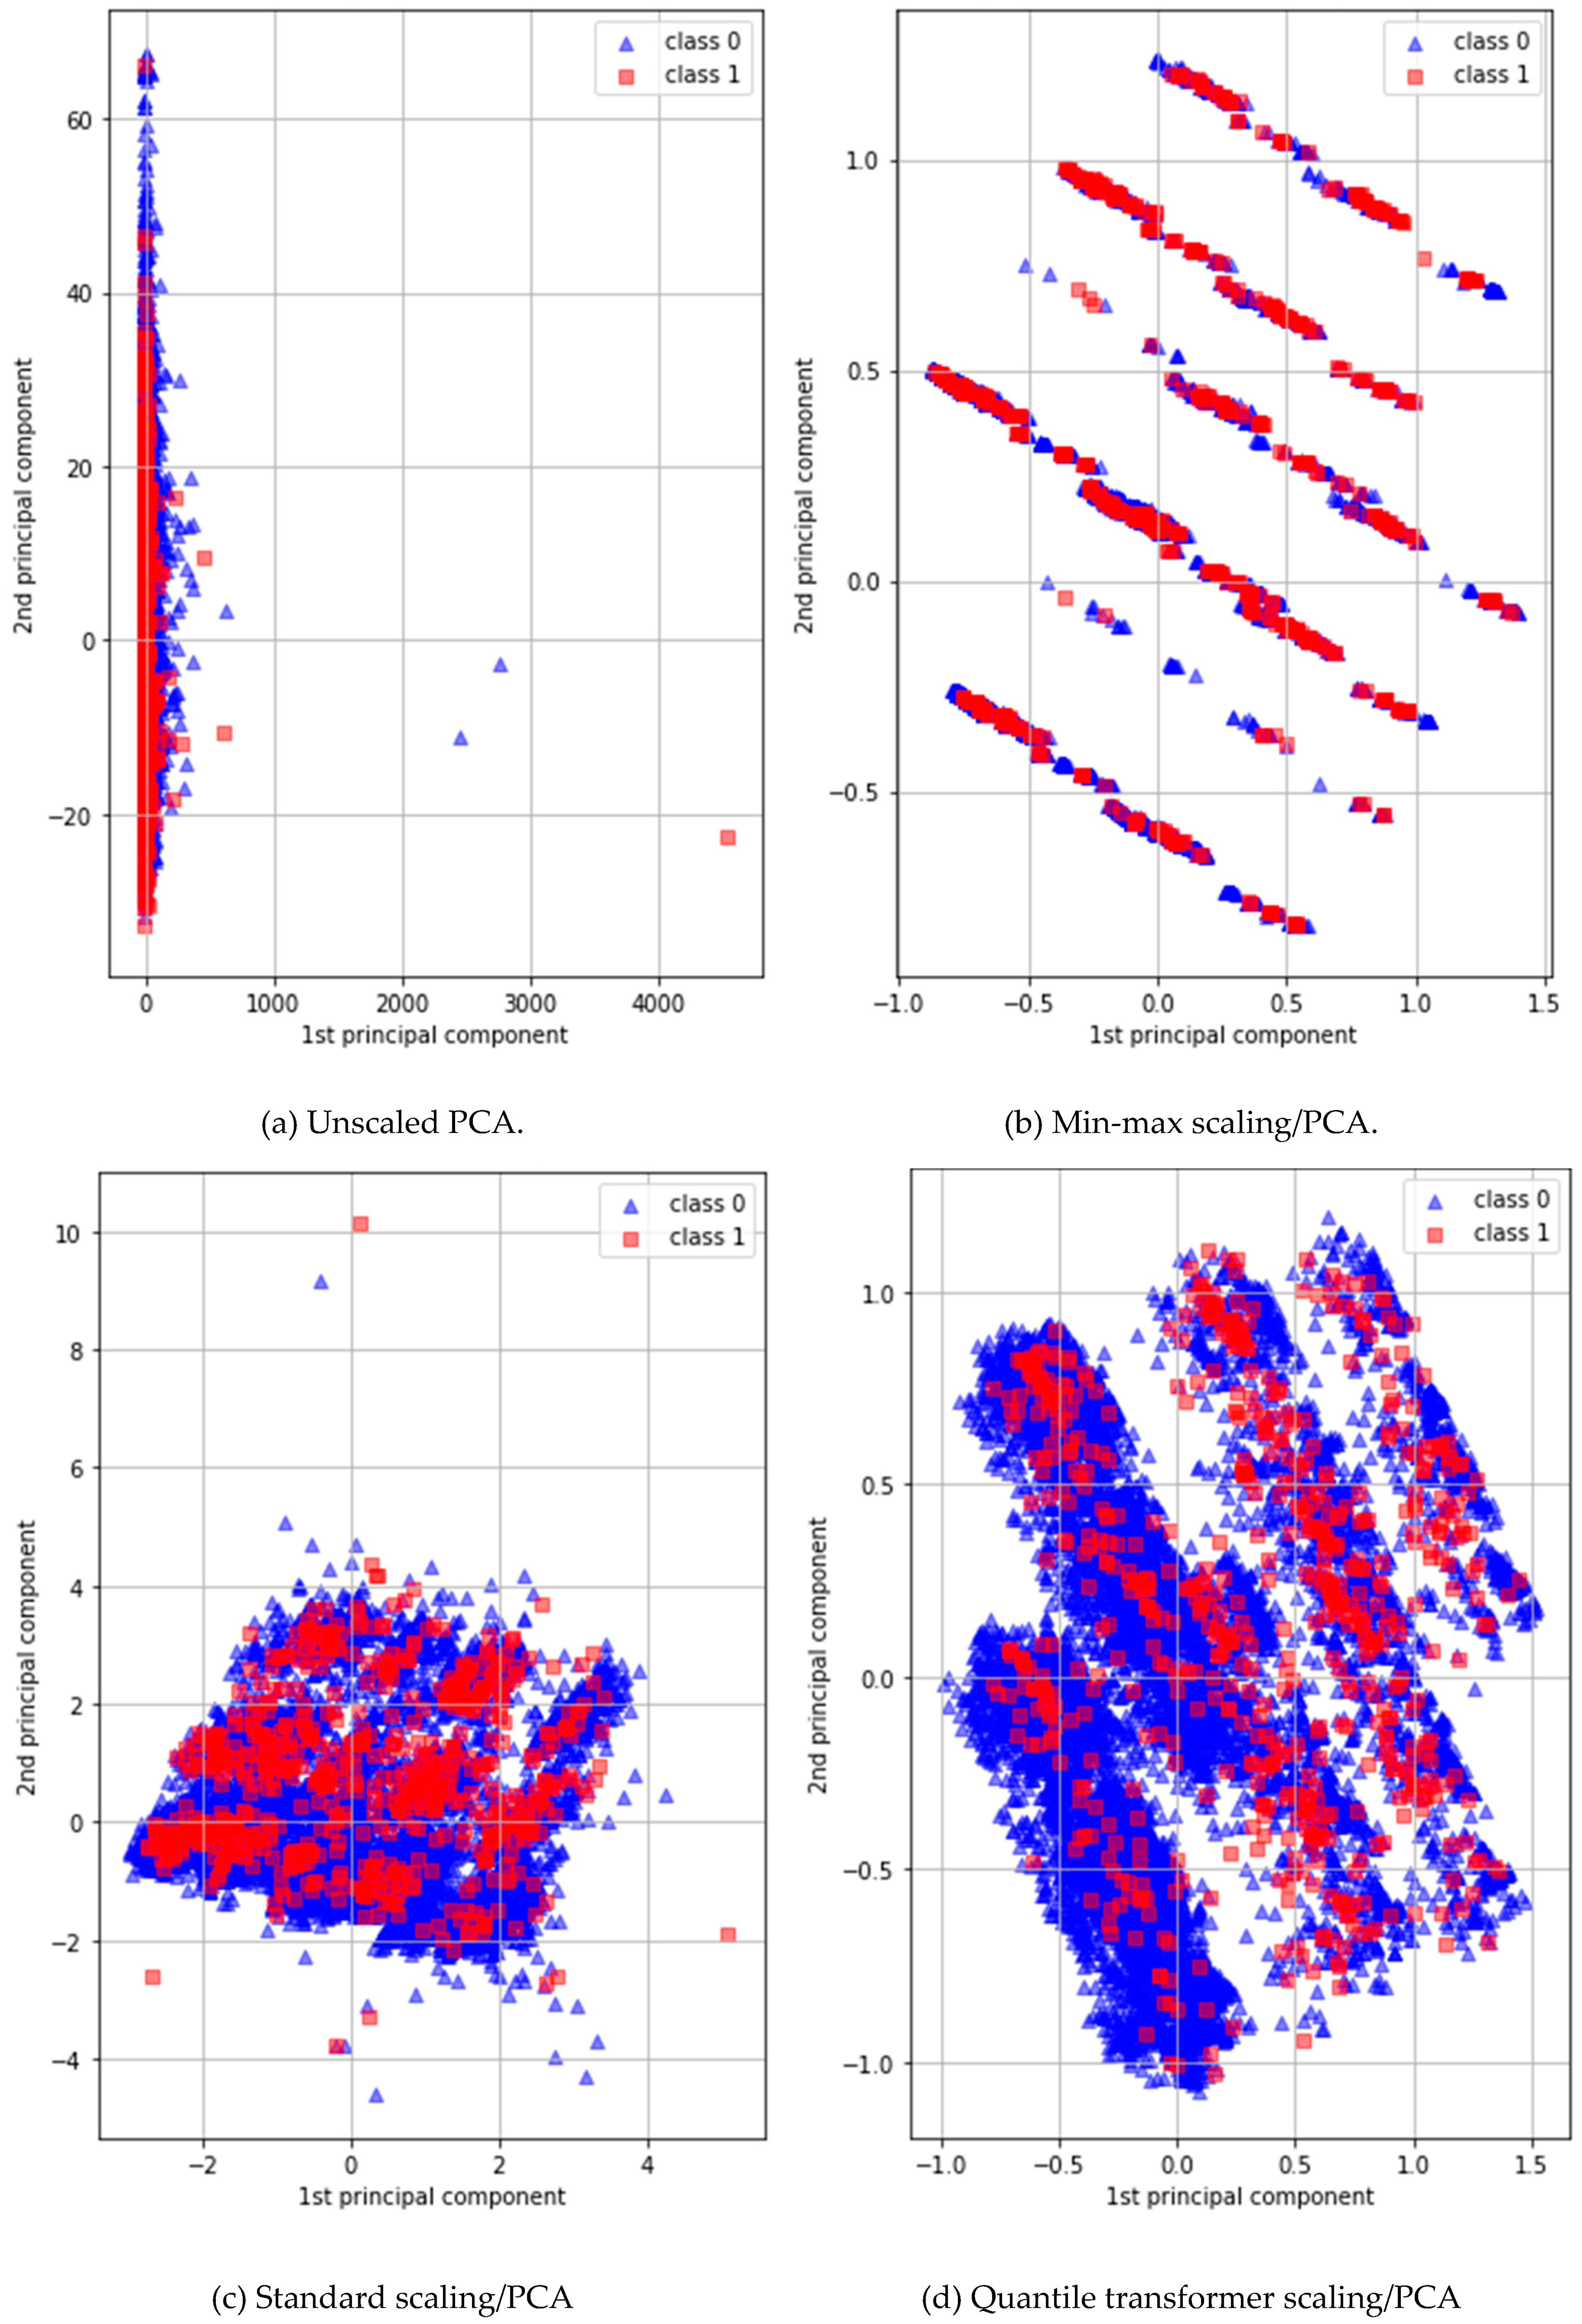
PCA is a simple non-parametric method used to extract useful information from elaborate datasets. In general, PCA preprocessing efficiently defines new features, reducing dimensions to find hidden or simplified structures for inclusion in classification algorithms [50]. However, the dataset that we used featured major categorical/binary and minor continuous variables. The former variables should not be input into a DNN classifier because they lack detailed information. We used the PCA maximum-attribute filter to convert all 11 binary or categorical variables into 11 continuous variables to minimize data discretization. Figure 3 shows the first and second principal components of four different PCAs: (a) a normal PCA; (b) a PCA with a standard scaler; (c) a PCA with a min/max scaler; and (d), a PCA with a quantile transformer scaler. A DNN/PCA-quantile-transformer scaler afforded the best performance.
3.5. DNN Architecture
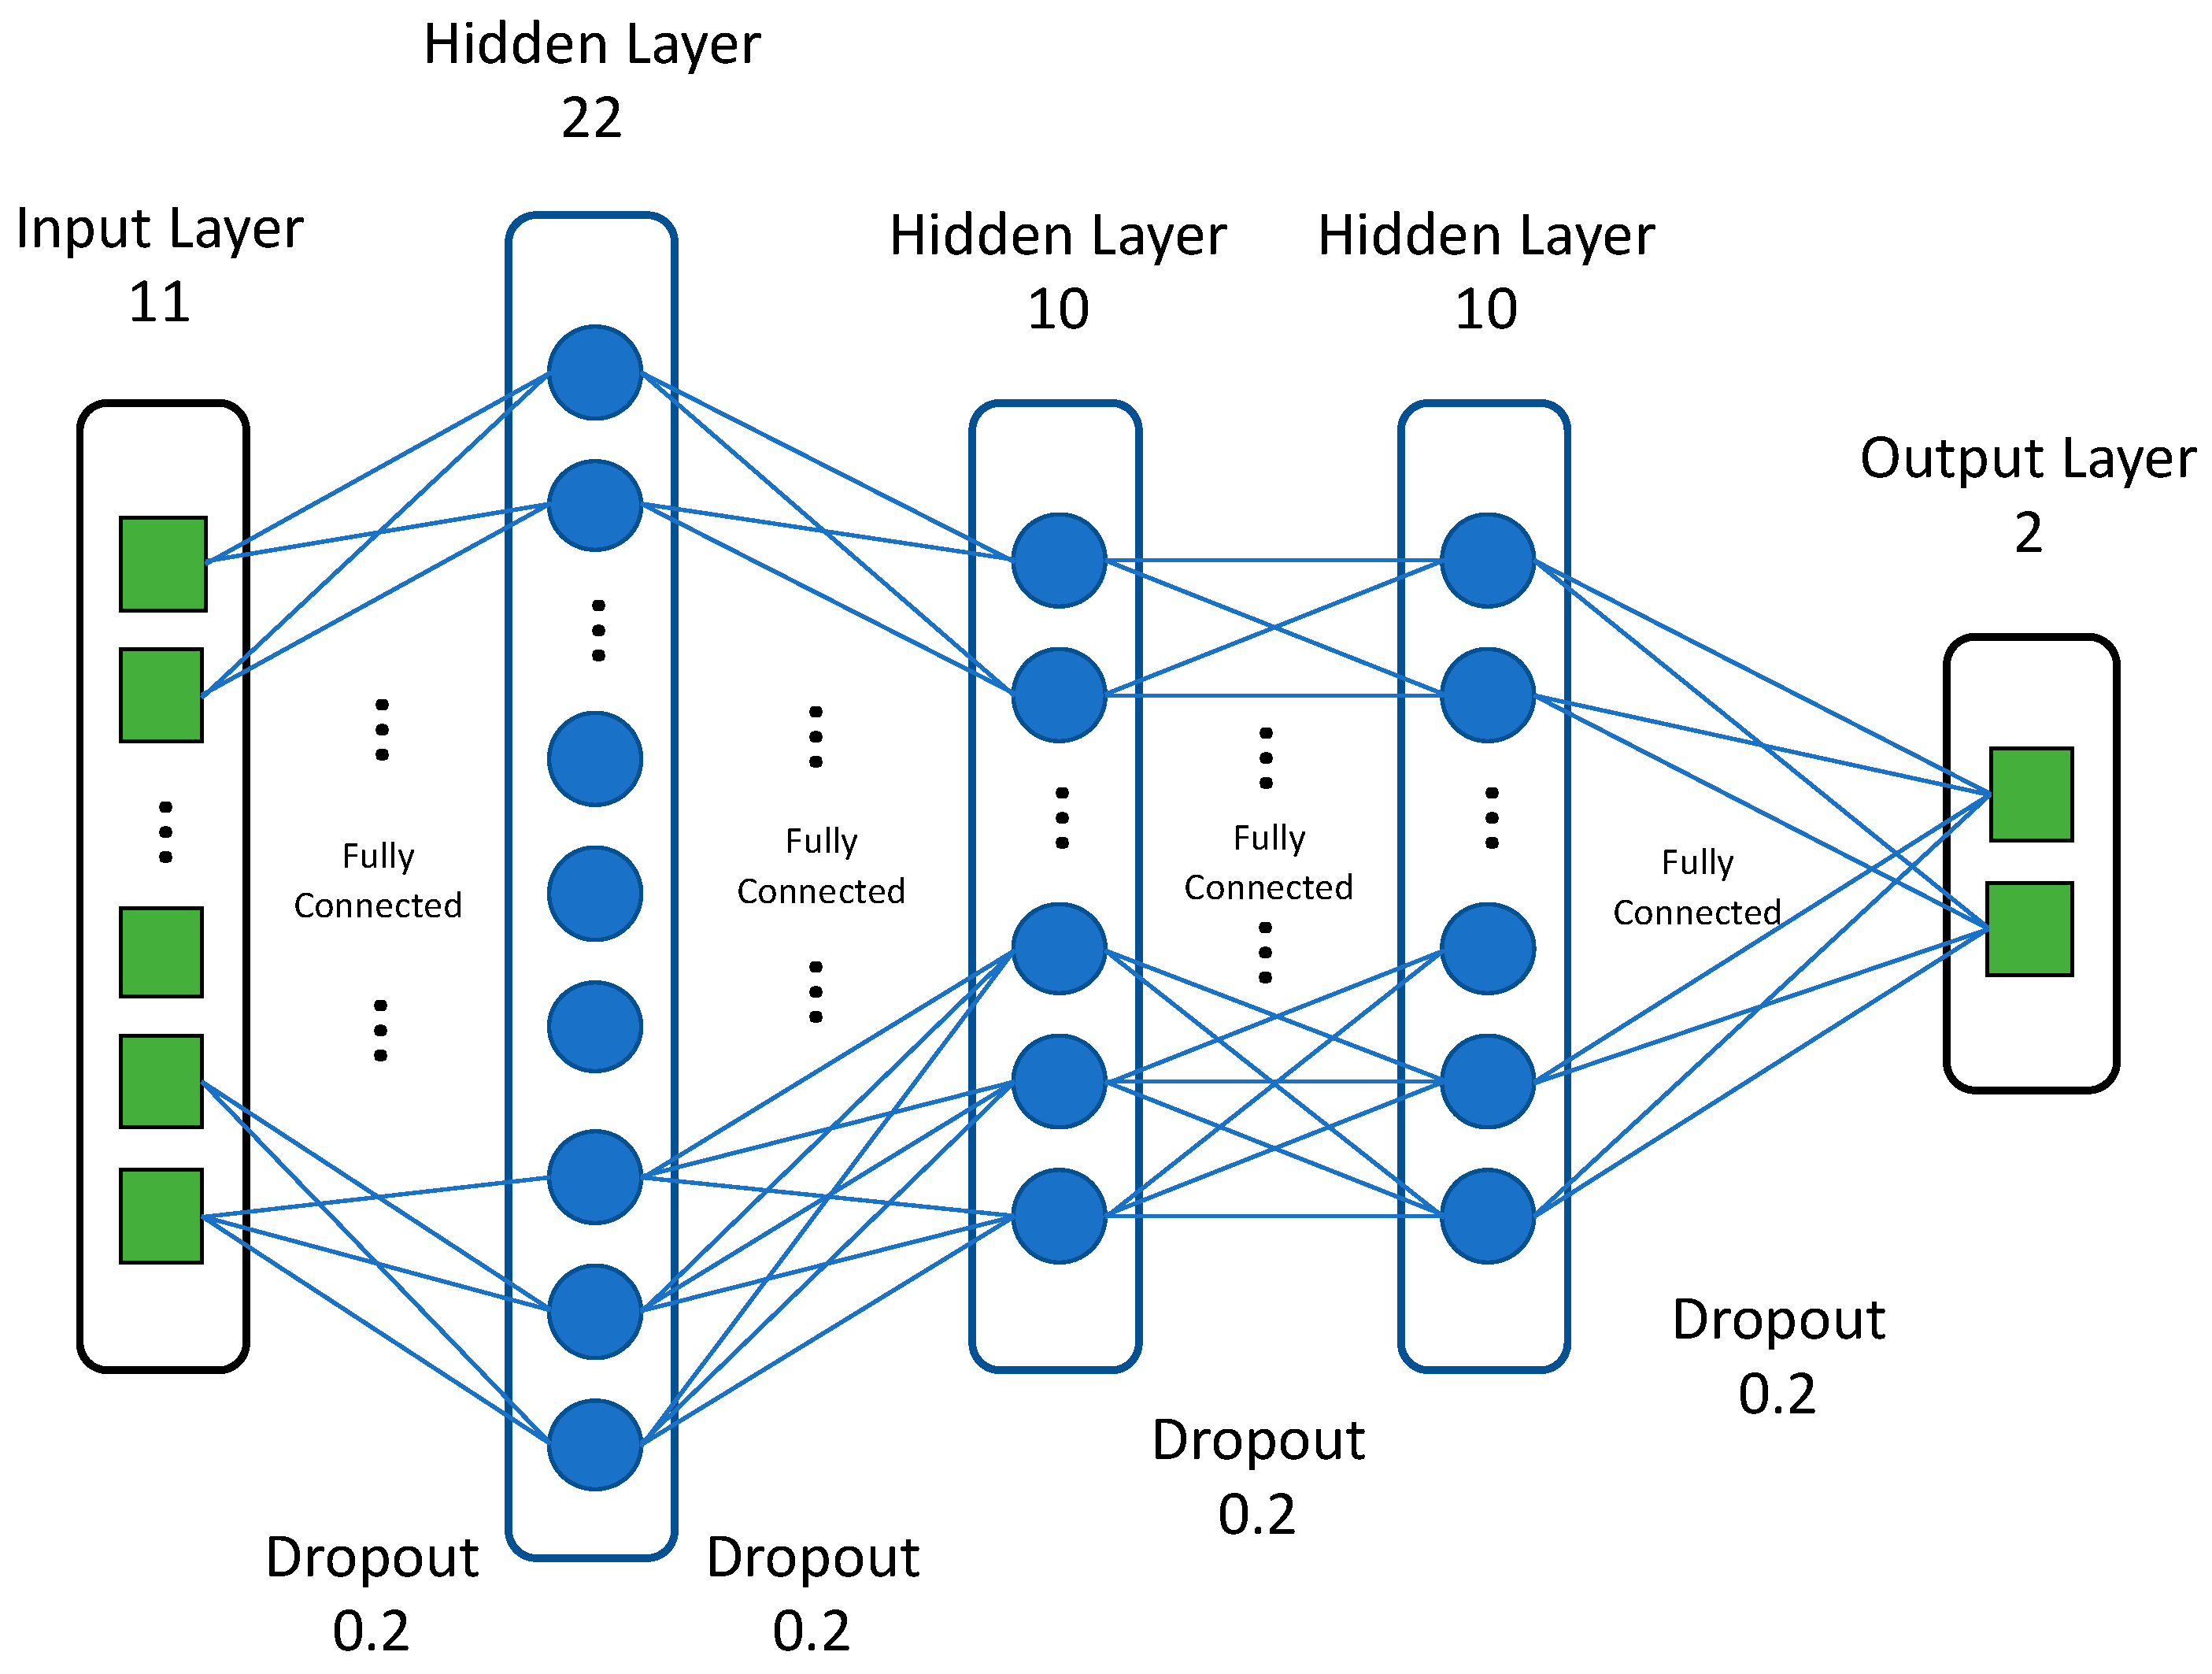
We employed simple feed-forward neural networks, trained using a standard backpropagation algorithm, in our deep (four hidden layers) learning models. For each DNN, we adjusted several hyperparameters, including the number of hidden layers, the number of neurons in each layer, the activation function, the optimization method, and the regularization technique. The best DNN featured four hidden layers with 22, 10, 10, and 10 neurons, respectively. The last layer, with one neuron, yielded a regression output. Accuracy served as the optimization loss function (we applied regularization terms). The DNN featured ReLU activation [51] in each layer; the dropout [52] probability was 0.2 for each layer. We used Adam optimization [53] with 0.001 for learning rate and L2 regularization during training; this optimizer is robust in terms of hyperparameter choice and, empirically, has shown very good performance. We applied batch normalization [54] after the first two layers to counter overfitting and ensure stable convergence. Figure 4 shows the architecture of the proposed DNN.
4. Results and Discussion
Of the various settings tested, the best DNN architecture featured four hidden layers, each with 22 or 10 neurons, 50 training epochs, and a batch size of 5. Table 2 shows the confusion matrix resulting from scaled PCA preprocessing.
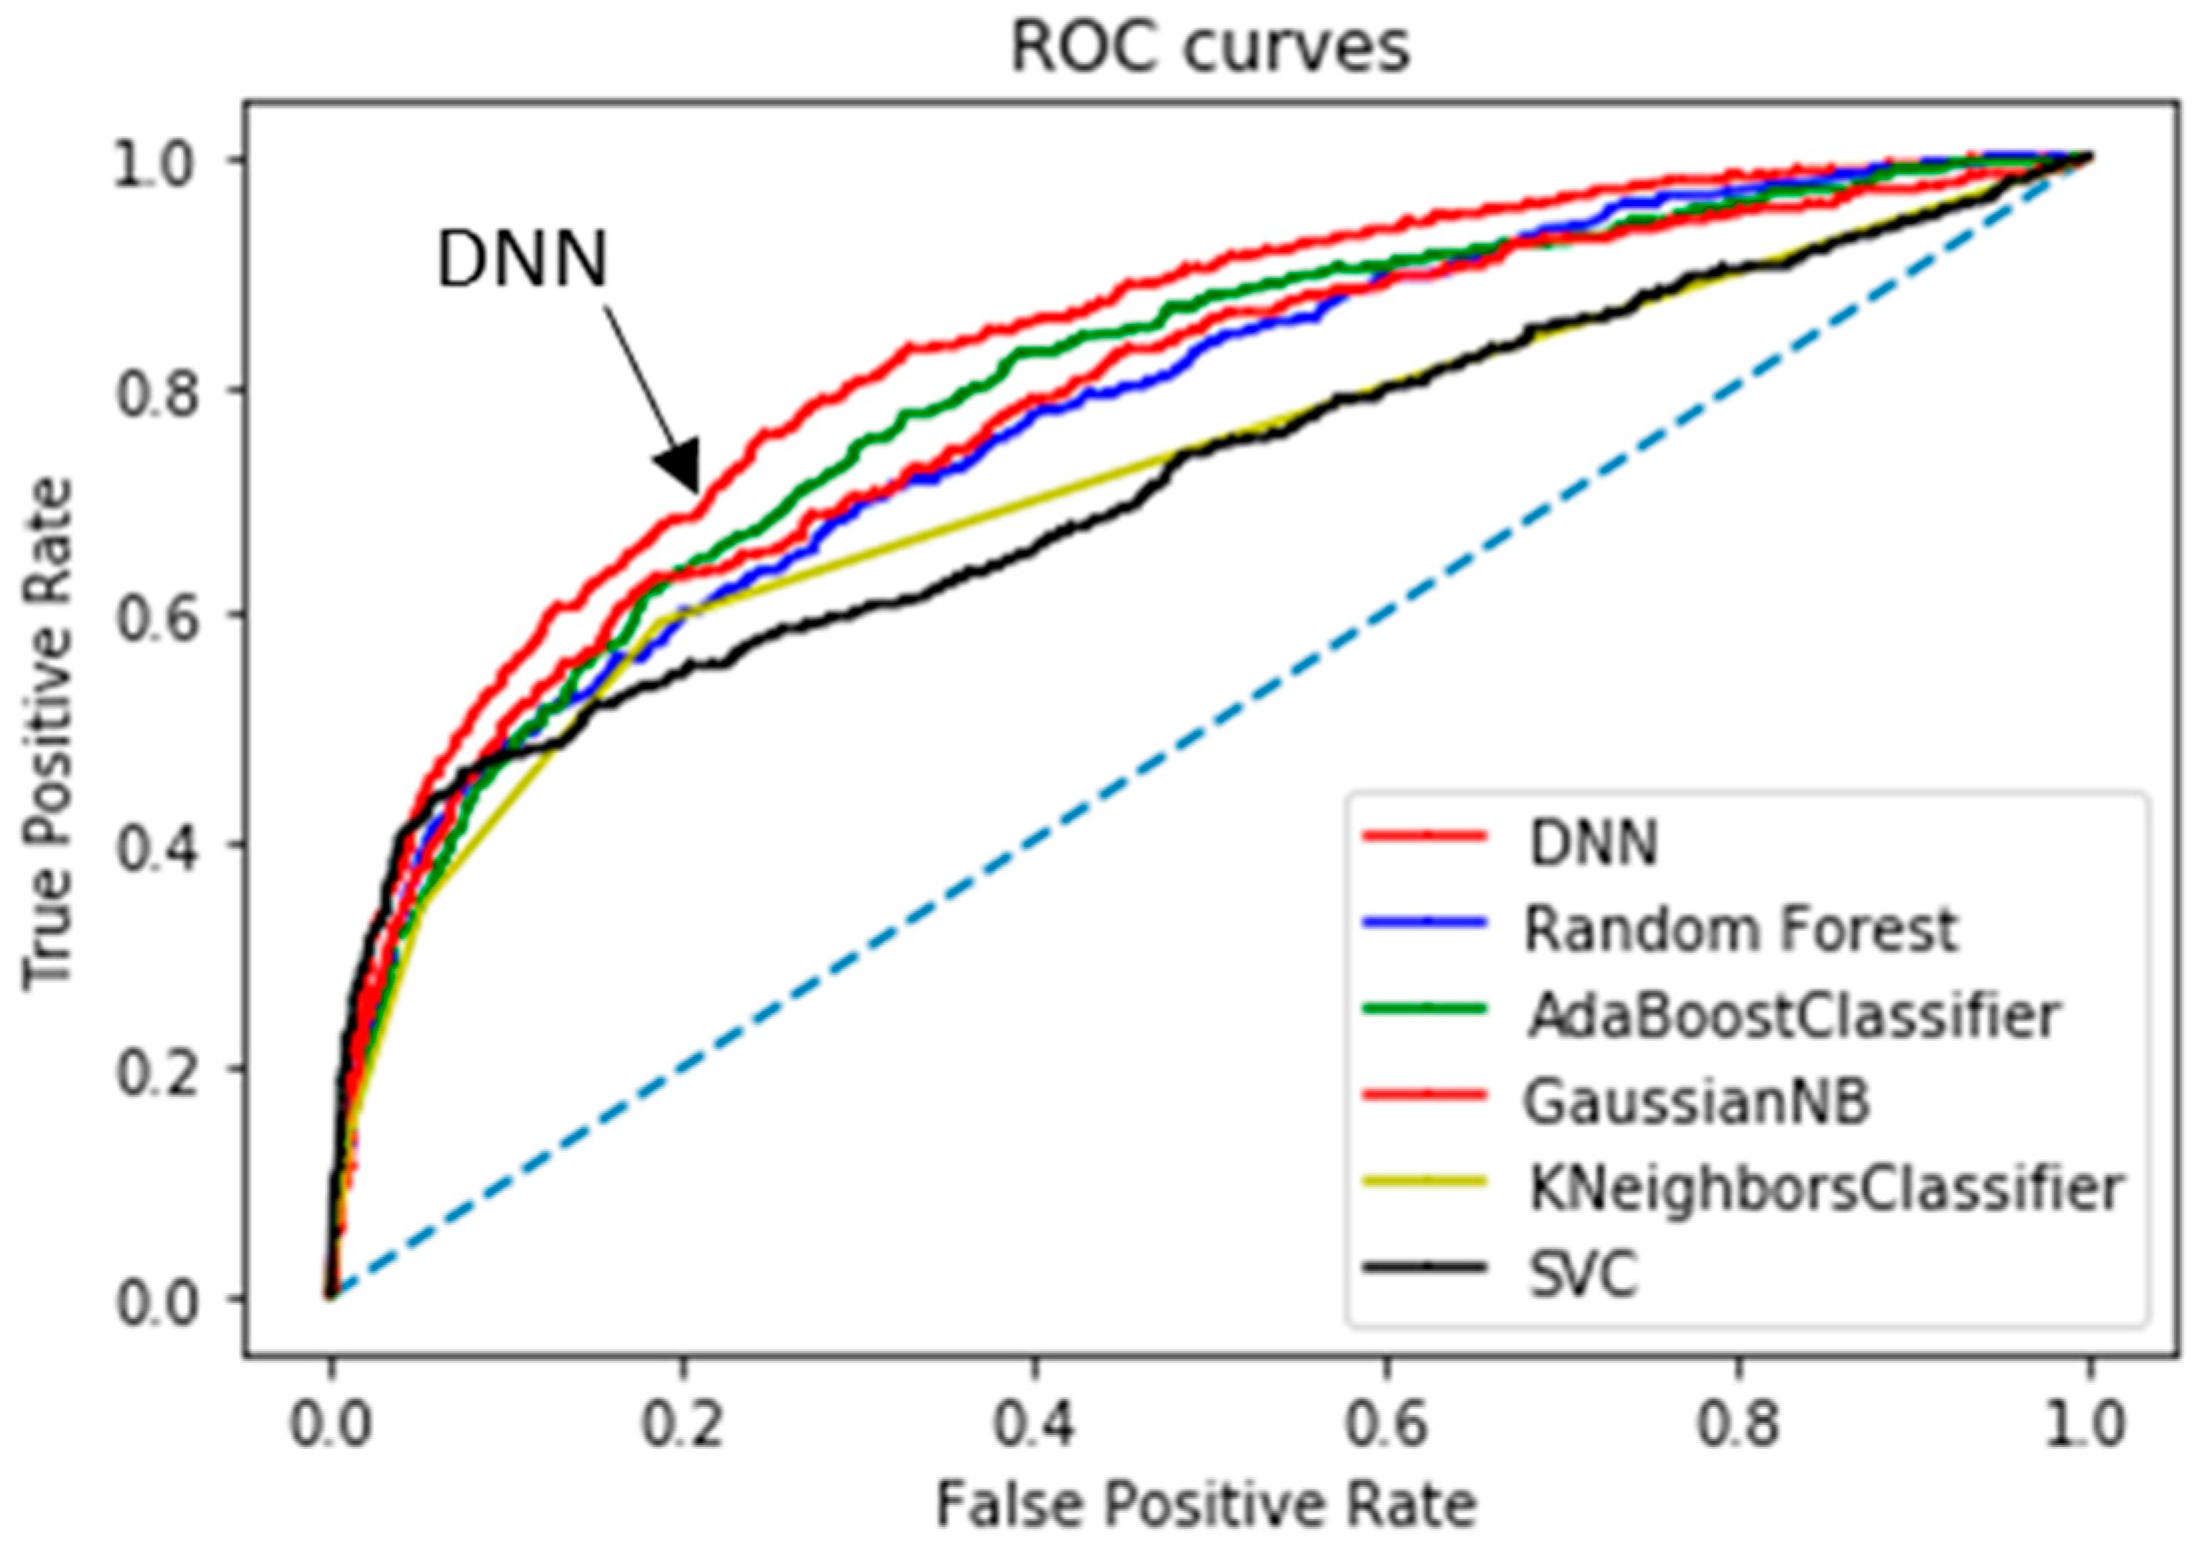
Table 3 summarizes the computational results yielded by the classification algorithms; we list thresholds, confusion matrix values, and five performance parameters; the AUCs of the top two classifiers are highlighted in bold. Considering all model parameters, the optimal stroke probability threshold was 0.13, with a model Acc of 84.03%, Sn of 64.32%, Sp of 85.56%, and PPV of 25.7%. We determined the thresholds of each classifier to make the balance between the sensitivity and specificity empirically. Compared to the commonly used performance metrics (Sn, Sp, PPV, and Acc), the area under the curve (AUC; a single value) better reflects algorithm performance [57]. Our method afforded an AUC of 83.48%; a comparison of the receiver operating characteristic (ROC) curve (indicating the predictive performance of our DNN/scaled PCA model) and the ROC curves of other classifiers is shown in Figure 6. The DNN/scaled PCA algorithm was optimal, followed by the AdaBoost classifier. Table 4 shows the comparison of the performance using 10-fold cross validation in order to verify the results from Figure 6 and Table 3. The AUCs of the top two classifiers are highlighted in bold, such as DNN and ADB. These results clearly support the conclusion that the DNN/scaled PCA algorithm outperforms the other five algorithms.
We used the DNN/scaled PCA classifier to estimate stroke occurrence, and derived correlation coefficients between various patient variables and stroke. However, these did not clearly reveal the relationships between principal components and stroke. Table 5 lists the four correlation coefficients (r-values; over +/− 0.09) among the 11 variables; the best correlation (+0.2) is highlighted in bold and other informative results (over +/− 0.09) are in italics and shown in red.
We considered tuning hyperparameters, such as the number of nodes and depth of the DNN, to improve stroke detection. Although tuning can be valuable, no general rule is available; we would have had to train 2–8 layers with 10–40 nodes based on trial-and-error. We used two methods to prevent overfitting, dropout and batch normalization; the latter prevents loss of feed-forward data in a manner similar to appropriate weighting on initialization, and dropout uses weighting to minimize the effects of certain hidden nodes.
Our method predicts stroke using indirect or limited data, such as medical service use history and health behavior. This will reduce future medical costs and facilitate diagnosis. The limitations of our work included a lack of input data separation and the lack of longitudinal data. Also, we employed survey data, which has drawbacks which include the binary format. Although we used scaled PCA to improve the data resolution, additional input variables may be required. In addition, our results apply only to subjects who may suffer from stroke in the future; we excluded those currently receiving treatment for stroke. This may reduce the overall accuracy of our predictive model.
5. Conclusions
Based on the data of 15,099 subjects, we developed a deep learning model featuring scaled PCA to automatically predict stroke based on medical utilization history and health behaviors. No subjective variables were included in the model. Our work allows early detection of patients at high risk of stroke who need additional checkups and appropriate treatment prior to disease exacerbation. Our method renders it unnecessary to select variables manually. As the input data are simple (albeit of low resolution, that is, binary or with a limited number of choices), we used a DNN to study the variables of interest and scaled PCA to generate improved continuous inputs for the DNN. The sensitivity, specificity and AUC value of our method were 64.32%, 85.56% and 83.48%, respectively. Our method can be used not only to predict stroke using limited data, but also other diseases.
In future, we will modify and apply our method for the analysis of other medical service use and health behavior datasets on conditions such as dementia. We will also use detailed indices and physiological signals as input data to achieve more meaningful DNN results. Finally, we will employ auto-fine-tuning methods to reduce training time and improve performance.
Author Contributions
Conceptualization, J.L. and S.C.; methodology, J.L., S.C. and J.K.; software, J.L. and J.K.; validation, J.L., S.C. and J.K.; investigation, J.L.; data curation, J.K.; writing—original draft preparation, J.L. and J.K.; writing—review and editing, S.C.; visualization, J.K.; project administration, S.C.; funding acquisition, J.L. and S.C.
Funding
This study was supported by a Research Grant from Youngsan University (2018).
Acknowledgments
In this section you can acknowledge any support given which is not covered by the author contribution or funding sections. This may include administrative and technical support, or donations in kind (e.g., materials used for experiments).
Conflicts of Interest
Declare conflicts of interest or state “The authors declare no conflict of interest.” Authors must identify and declare any personal circumstances or interest that may be perceived as inappropriately influencing the representation or interpretation of reported research results. Any role of the funders in the design of the study; in the collection, analyses or interpretation of data; in the writing of the manuscript, or in the decision to publish the results must be declared in this section. If there is no role, please state “The funders had no role in the design of the study; in the collection, analyses, or interpretation of data; in the writing of the manuscript, or in the decision to publish the results”.
References
- Pastore, D.; Pacifici, F.; Capuani, B.; Palmirotta, R.; Dong, C.; Coppola, A.; Abete, P.; Roselli, M.; Sbraccia, P.; Guadagni, F.; et al. Sex-genetic interaction in the risk for cerebrovascular disease. Curr. Med. Chem. 2017, 24, 2687–2699. [Google Scholar] [CrossRef]
- Kim, H.C.; Choi, D.P.; Ahn, S.V.; Nam, C.M.; Suh, I. Six-year survival and causes of death among stroke patients in Korea. Neuroepidemiology 2009, 32, 94–100. [Google Scholar] [CrossRef] [PubMed]
- Lee, H.; Oh, S.H.; Cho, H.; Cho, H.J.; Kang, H.Y. Prevalence and socio-economic burden of heart failure in an aging society of South Korea. BMC Cardiovasc. Disord. 2016, 16, 215. [Google Scholar]
- Lee, A.H.; Yau, K.K.; Wang, K. Recurrent ischaemic stroke hospitalisations: A retrospective cohort study using Western Australia linked patient records. Eur. J. Epidemiol. 2004, 19, 999–1003. [Google Scholar] [CrossRef] [PubMed]
- Chuang, K.Y.; Wu, S.C.; Ma, A.H.; Chen, Y.H.; Wu, C.L. Identifying factors associated with hospital readmissions among stroke patients in Taipei. J. Nurs. Res. 2005, 13, 117–128. [Google Scholar] [CrossRef] [PubMed]
- Joo, H.; George, M.G.; Fang, J.; Wang, G. A literature review of indirect costs associated with stroke. J. Stroke Cerebrovasc. Dis. 2014, 23, 1753–1763. [Google Scholar] [CrossRef]
- Andersen, H.E.; Schultz-Larsen, K.; Kreiner, S.; Forchhammer, B.H.; Eriksen, K.; Brown, A. Can readmission after stroke be prevented? Results of a randomized clinical study: A postdischarge follow-up service for stroke survivors. Stroke 2000, 31, 1038–1045. [Google Scholar] [CrossRef] [PubMed]
- Brainin, M.; Bornstein, N.; Boysen, G.; Demarin, V. Acute neurological stroke care in Europe: Results of the European Stroke Care Inventory. Eur. J. Neurol. 2000, 7, 5–10. [Google Scholar] [CrossRef]
- Bushnell, C.D.; Lee, J.; Duncan, P.W.; Newby, L.K.; Goldstein, L.B. Impact of comorbidities on ischemic stroke outcomes in women. Stroke 2008, 39, 2138–2140. [Google Scholar] [CrossRef]
- Rundek, T.; Nielsen, K.; Phillips, S.; Johnston, K.C.; Hux, M.; Watson, D. Health care resource use after acute stroke in the Glycine Antagonist in Neuroprotection (GAIN) Americas trial. Stroke 2004, 35, 1368–1374. [Google Scholar] [CrossRef]
- Hinman, J.D.; Rost, N.S.; Leung, T.W.; Montaner, J.; Muir, K.W.; Brown, S.; Arenillas, J.F.; Feldmann, E.; Liebeskind, D.S. Principles of precision medicine in stroke. J. Neurol. Neurosurg. Psychiatry 2017, 88, 54–61. [Google Scholar] [CrossRef]
- Liebeskind, D.S. Artificial intelligence in stroke care: Deep learning or superficial insight? EBioMedicine 2018, 35, 14–15. [Google Scholar] [CrossRef] [Green Version]
- Liebeskind, D.S.; Albers, G.W.; Crawford, K.; Derdeyn, C.P.; George, M.S.; Palesch, Y.Y.; Toga, A.W.; Warach, S.; Zhao, W.; Brott, T.G.; et al. Imaging in StrokeNet: Realizing the potential of Big Data. Stroke 2015, 46, 2000–2006. [Google Scholar] [CrossRef] [PubMed]
- Rostanski, S.K.; Marshall, R.S. Precision medicine for ischemic stroke. JAMA Neurol. 2016, 73, 773–774. [Google Scholar] [CrossRef] [PubMed]
- Feldmann, E.; Liebeskind, D.S. Developing precision stroke imaging. Front. Neurol. 2014, 5, 29. [Google Scholar] [CrossRef] [PubMed]
- Hamburg, M.A.; Collins, F.S. The path to personalized medicine. N. Engl. J. Med. 2010, 363, 301–304. [Google Scholar] [CrossRef]
- Allen, C.; Tsou, M.H.; Aslam, A.; Nagel, A.; Gawron, J.M. Applying GIS and machine learning methods to Twitter data for multiscale surveillance of influenza. PLoS ONE 2016, 11, e0157734. [Google Scholar] [CrossRef]
- He, F.; Hu, Z.J.; Zhang, W.C.; Cai, L.; Cai, G.X.; Aoyagi, K. Construction and evaluation of two computational models for predicting the incidence of influenza in Nagasaki Prefecture, Japan. Sci. Rep. 2017, 7, 7192. [Google Scholar] [CrossRef]
- Chen-Ying, H.; Wei-Chen, C.; Po-Tsun, L.; Ching-Heng, L.; Chi-Chun, L. Comparing deep neural network and other machine learning algorithms for stroke prediction in a large-scale population-based electronic medical claims database. Conf. Proc. IEEE Eng. Med. Biol. Soc. 2017, 2017, 3110–3113. [Google Scholar]
- Janowczyk, A.; Madabhushi, A. Deep learning for digital pathology image analysis: A comprehensive tutorial with selected use cases. J. Pathol. Inform. 2016, 7, 29. [Google Scholar] [CrossRef] [PubMed]
- Esteva, A.; Kuprel, B.; Novoa, R.A.; Ko, J.; Swetter, S.M.; Blau, H.M.; Thrun, S. Dermatologist-level classification of skin cancer with deep neural networks. Nature 2017, 542, 115–118. [Google Scholar] [CrossRef]
- Xu, Q.; Gel, Y.R.; Ramirez Ramirez, L.L.; Nezafati, K.; Zhang, Q.; Tsui, K.L. Forecasting influenza in Hong Kong with Google search queries and statistical model fusion. PLoS ONE 2017, 12, e0176690. [Google Scholar] [CrossRef] [PubMed]
- Teoh, D. Towards stroke prediction using electronic health records. BMC Med. Inform. Decis. Mak. 2018, 18, 127. [Google Scholar] [CrossRef]
- Pereira, D.R.; Reboucas Filho, P.P.; de Rosa, G.H.; Papa, J.P.; de Albuquerque, V.H.C. Stroke lesion detection using convolutional neural networks. In Proceedings of the 2018 International Joint Conference on Neural Networks (IJCNN), Rio, Brazil, 8–13 July 2018; IEEE: Piscataway, NJ, USA, 2018; pp. 1–6. [Google Scholar]
- Beritelli, F.; Capizzi, G.; Sciuto, G.L.; Napoli, C.; Woźniak, M. A novel training method to preserve generalization of RBPNN classifiers applied to ECG signals diagnosis. Neural Netw. 2018, 108, 331–338. [Google Scholar] [CrossRef] [PubMed]
- Wu, J.H.; Wei, W.; Zhang, L.; Wang, J.; Damaševičius, R.; Li, J.; Wang, H.D.; Wang, G.L.; Zhang, X.; Yuan, J.X.; et al. Risk Assessment of Hypertension in Steel Workers Based on LVQ and Fisher-SVM Deep Excavation. IEEE Access 2019, 7, 23109–23119. [Google Scholar] [CrossRef]
- Ma, X.; Dai, Z.; He, Z.; Ma, J.; Wang, Y.; Wang, Y. Learning traffic as images: A deep convolutional neural network for large-scale transportation network speed prediction. Sensors 2017, 17, 818. [Google Scholar] [CrossRef] [PubMed]
- Xu, K.; Feng, D.; Mi, H. Deep convolutional neural network-based early automated detection of diabetic retinopathy using fundus image. Molecules 2017, 22, 2054. [Google Scholar] [CrossRef]
- Izadpanahkakhk, M.; Razavi, S.; Taghipour-Gorjikolaie, M.; Zahiri, S.; Uncini, A. Deep region of interest and feature extraction models for palmprint verification using convolutional neural networks transfer learning. Appl. Sci. 2018, 8, 1210. [Google Scholar] [CrossRef]
- Steven Eyobu, O.; Han, D. Feature representation and data augmentation for human activity classification based on wearable IMU sensor data using a deep LSTM neural network. Sensors 2018, 18, 2892. [Google Scholar] [CrossRef]
- Jing, L.; Wang, T.; Zhao, M.; Wang, P. An adaptive multi-sensor data fusion method based on deep convolutional neural networks for fault diagnosis of planetary gearbox. Sensors 2017, 17, 414. [Google Scholar] [CrossRef]
- Jiao, Z.; Gao, X.; Wang, Y.; Li, J. A parasitic metric learning net for breast mass classification based on mammography. Pattern Recognit. 2018, 75, 292–301. [Google Scholar] [CrossRef]
- Hu, Y.; Li, J.; Jiao, Z. Mammographic Mass Detection Based on Saliency with Deep Features. In Proceedings of the International Conference on Internet Multimedia Computing and Service, Xi’an, China, 19–21 August 2016; ACM: New York, NY, USA, 2016; pp. 292–297. [Google Scholar]
- Yang, D.; Wang, Y.; Jiao, Z. Asymmetry Analysis with Sparse Autoencoder in Mammography. In Proceedings of the International Conference on Internet Multimedia Computing and Service, Xi’an, China, 19–21 August 2016; ACM: New York, NY, USA, 2016; pp. 287–291. [Google Scholar]
- Shen, D.; Wu, G.; Suk, H.I. Deep learning in medical image analysis. Annu. Rev. Biomed. Eng. 2017, 19, 221–248. [Google Scholar] [CrossRef] [PubMed]
- Suk, H.I.; Shen, D. Deep learning-based feature representation for AD/MCI classification. In Proceedings of the International Conference on Medical Image Computing and Computer-Assisted Intervention, Nagoya, Japan, 22–26 September 2013; Springer: Berlin/Heidelberg, Germany, 2013; pp. 583–590. [Google Scholar]
- Hua, K.L.; Hsu, C.H.; Hidayati, S.C.; Cheng, W.H.; Chen, Y.J. Computer-aided classification of lung nodules on computed tomography images via deep learning technique. OncoTargets Ther. 2015, 8, 2015–2022. [Google Scholar]
- Anthimopoulos, M.; Christodoulidis, S.; Ebner, L.; Christe, A.; Mougiakakou, S. Lung pattern classification for interstitial lung diseases using a deep convolutional neural network. IEEE Trans. Med. Imaging 2016, 35, 1207–1216. [Google Scholar] [CrossRef]
- Kumar, D.; Wong, A.; Clausi, D.A. Lung nodule classification using deep features in CT images. In Proceedings of the 2015 12th Conference on Computer and Robot Vision, Halifax, NS, Canada, 3–5 June 2015; IEEE: Piscataway, NJ, USA, 2015; pp. 133–138. [Google Scholar]
- Jiao, Z.; Gao, X.; Wang, Y.; Li, J. A deep feature based framework for breast masses classification. Neurocomputing 2016, 197, 221–231. [Google Scholar] [CrossRef]
- Jiao, Z.; Gao, X.; Wang, Y.; Li, J.; Xu, H. Deep Convolutional Neural Networks for mental load classification based on EEG data. Pattern Recognit. 2018, 76, 582–595. [Google Scholar] [CrossRef]
- Kim, S.K.; Yoo, T.K.; Kim, D.W. Osteoporosis risk prediction using machine learning and conventional methods. In Proceedings of the 2013 35th Annual International Conference of the IEEE Engineering in Medicine and Biology Society (EMBC), Osaka, Japan, 3–7 July 2013; IEEE: Piscataway, NJ, USA, 2013; pp. 188–191. [Google Scholar]
- Wang, Y.; Ng, K.; Byrd, R.J.; Hu, J.; Ebadollahi, S.; Daar, Z.; Steinhubl, S.R.; Stewart, W.F. Early detection of heart failure with varying prediction windows by structured and unstructured data in electronic health records. In Proceedings of the 2015 37th Annual International Conference of the IEEE Engineering in Medicine and Biology Society (EMBC), Milan, Italy, 25–29 August 2015; IEEE: Piscataway, NJ, USA, 2015; pp. 2530–2533. [Google Scholar]
- Arandjelović, O. Prediction of health outcomes using big (health) data. In Proceedings of the 2015 37th Annual International Conference of the IEEE Engineering in Medicine and Biology Society (EMBC), Milan, Italy, 25–29 August 2015; IEEE: Piscataway, NJ, USA, 2015; pp. 2543–2546. [Google Scholar]
- Putin, E.; Mamoshina, P.; Aliper, A.; Korzinkin, M.; Moskalev, A.; Kolosov, A.; Ostrovskiy, A.; Cantor, C.; Vijg, J.; Zhavoronkov, A. Deep biomarkers of human aging: Application of deep neural networks to biomarker development. Aging (Albany N. Y.) 2016, 8, 1021. [Google Scholar] [CrossRef] [PubMed]
- Yoo, T.K.; Kim, D.W.; Choi, S.B.; Park, J.S. Simple scoring system and artificial neural network for knee osteoarthritis risk prediction: A cross-sectional study. PLoS ONE 2016, 11, e0148724. [Google Scholar] [CrossRef]
- Rajkomar, A.; Oren, E.; Chen, K.; Dai, A.M.; Hajaj, N.; Hardt, M.; Liu, P.J.; Liu, X.; Marcus, J.; Sun, M. Scalable and accurate deep learning with electronic health records. NPJ Digit. Med. 2018, 1, 18. [Google Scholar] [CrossRef]
- Lee, W.K.; Lim, D.; Park, H. Disability-adjusted life years (DALYs) for injuries using death certificates and hospital discharge survey by the Korean Burden of Disease Study 2012. J. Korean Med. Sci. 2016, 31 (Suppl. 2), S200–S207. [Google Scholar] [CrossRef]
- Charlson, M.E.; Pompei, P.; Ales, K.L.; MacKenzie, C.R. A new method of classifying prognostic comorbidity in longitudinal studies: Development and validation. J. Chronic Dis. 1987, 40, 373–383. [Google Scholar] [CrossRef]
- Shlens, J. A tutorial on principal component analysis. arXiv 2014, arXiv:1404.1100. [Google Scholar]
- He, K.; Kaiming, H.; Xiangyu, Z.; Shaoqing, R.; Jian, S. Delving deep into rectifiers: Surpassing human-level performance on ImageNet classification. In Proceedings of the 2015 IEEE International Conference on Computer Vision (ICCV) Internet, Santiago, Chile, 7–13 December 2015. [Google Scholar] [CrossRef]
- Srivastava, N.; Hinton, G.; Krizhevsky, A.; Sutskever, I.; Salakhutdinov, R. Dropout: A simple way to prevent neural networks from overfitting. J. Mach. Learn. Res. 2014, 15, 1929–1958. [Google Scholar]
- Kingma, D.P.; Ba, J. Adam: A method for stochastic optimization. arXiv 2014, arXiv:1412.6980. [Google Scholar]
- Ioffe, S.; Szegedy, C. Batch normalization: Accelerating deep network training by reducing internal covariate shift. arXiv 2015, arXiv:1502.03167. [Google Scholar]
- Chollet, F. Keras: The Python Deep Learning Library; Astrophysics Source Code Library, 2018; Available online: http://adsabs.harvard.edu/abs/2018ascl.soft06022C.
- Abadi, M.; Barham, P.; Chen, J.; Chen, Z.; Davis, A.; Dean, J.; Devin, M.; Ghemawat, S.; Irving, G.; Isard, M.; et al. TensorFlow: A system for large-scale machine learning. In Proceedings of the 12th USENIX Symposium on Operating Systems Design and Implementation (OSDI ’16), Savannah, GA, USA, 2–4 November 2016; pp. 265–283. [Google Scholar]
- Kim, J.; Chu, C.-H. ETD: An extended time delay algorithm for ventricular fibrillation detection. In Proceedings of the 36th Annual International Conference of the IEEE Engineering in Medicine and Biology Society, Chicago, IL, USA, 26–30 August 2014; IEEE: Piscataway, NJ, USA, 2014; pp. 6479–6482. [Google Scholar]
Figure 1.
The patient selection process. KNHDS = Korean National Hospital Discharge In-depth Injury Survey. ICD = International Classification of Diseases.
Figure 1.
The patient selection process. KNHDS = Korean National Hospital Discharge In-depth Injury Survey. ICD = International Classification of Diseases.

Figure 2.
The architecture of the deep neural network (DNN)/scaled principal component analysis (PCA) approach.
Figure 2.
The architecture of the deep neural network (DNN)/scaled principal component analysis (PCA) approach.

Figure 3.
Two-dimensional plots of the first and second principal components (class 0 indicates non-stroke patients and class 1 indicates stroke patients).
Figure 3.
Two-dimensional plots of the first and second principal components (class 0 indicates non-stroke patients and class 1 indicates stroke patients).

Figure 4.
The architecture of the proposed DNN.

Figure 5.
Train loss during training with early stopping.

Figure 6.
Regarding predictive performance, the area under the receiver operating characteristic curve value was highest (83.48%) for the DNN/scaled PCA classifier.
Figure 6.
Regarding predictive performance, the area under the receiver operating characteristic curve value was highest (83.48%) for the DNN/scaled PCA classifier.


Table 1.
Distribution of subjects by general characteristics.
| Variables | N (%) | |
|---|---|---|
| Mean age | 66.1 years | |
| Gender | Male | 8252 (54.7) |
| Female | 6847 (45.3) | |
| Mortality | Yes | 1038 (6.9) |
| No | 14,061 (93.1) | |
| Stroke type | ischemic | 10,668 (70.7) |
| hemorrhagic | 4431 (29.3) | |
Table 2.
Confusion matrix for our method.
| Confusion Matrix | Predicted (T) | Predicted (F) |
|---|---|---|
| Actual (T) | 238 | 132 |
| Actual (F) | 688 | 4076 |
Table 3.
Comparison of the confusion matrix values and performance for six classifiers (testing data).
Table 3.
Comparison of the confusion matrix values and performance for six classifiers (testing data).
| TH | TP | FP | FN | TN | SN (%) | SP | PP | ACC | AUC | |
|---|---|---|---|---|---|---|---|---|---|---|
| RFC | 0.077 | 223 | 960 | 147 | 3804 | 60.27 | 79.85 | 18.85 | 78.44 | 77.59 |
| ADB | 0.487 | 234 | 928 | 136 | 3836 | 63.24 | 80.52 | 20.14 | 79.28 | 79.25 |
| GNB | 0.065 | 258 | 1396 | 112 | 3368 | 69.73 | 70.7 | 15.6 | 70.63 | 78.08 |
| KNNC | 0.065 | 219 | 892 | 151 | 3872 | 59.19 | 81.28 | 19.71 | 79.68 | 72.11 |
| SVC | 0.065 | 221 | 1380 | 149 | 3384 | 59.73 | 71.03 | 13.8 | 70.22 | 71.51 |
| DNN | 0.13 | 238 | 688 | 132 | 4076 | 64.32 | 85.56 | 25.7 | 84.03 | 83.48 |
TH, threshold; RFC, random forest classifier; ADB, AdaBoost classifier: GNB, Gaussian naive Bayes; KNNC, K-nearest neighbor classifier; SVC, support vector machine; DNN, deep neural network.
Table 4.
Comparison of the performance for six classifiers (10-fold cross-validation).
| Classifier | AUC | Classifier | AUC |
|---|---|---|---|
| RFC | 79.4 | ADB | 80.5 |
| GNB | 80.0 | KNNC | 72.2 |
| SVC | 69.7 | DNN | 83.5 |
Table 5.
Correlation coefficients of the variables (over 0.09) among 11 variables.
| Variable | Corr. Coff. | Variable | Corr. Coff. |
|---|---|---|---|
| Brain surgery required | 0.124062 | Admission mode | −0.093137 |
| Stroke type | 0.203716 | Mortality | 1 |
© 2019 by the authors. Licensee MDPI, Basel, Switzerland. This article is an open access article distributed under the terms and conditions of the Creative Commons Attribution (CC BY) license (http://creativecommons.org/licenses/by/4.0/).
Share and Cite
MDPI and ACS Style
Cheon, S.; Kim, J.; Lim, J. The Use of Deep Learning to Predict Stroke Patient Mortality. Int. J. Environ. Res. Public Health 2019, 16, 1876. https://doi.org/10.3390/ijerph16111876
AMA Style
Cheon S, Kim J, Lim J. The Use of Deep Learning to Predict Stroke Patient Mortality. International Journal of Environmental Research and Public Health. 2019; 16(11):1876. https://doi.org/10.3390/ijerph16111876
Chicago/Turabian StyleCheon, Songhee, Jungyoon Kim, and Jihye Lim. 2019. "The Use of Deep Learning to Predict Stroke Patient Mortality" International Journal of Environmental Research and Public Health 16, no. 11: 1876. https://doi.org/10.3390/ijerph16111876
Note that from the first issue of 2016, this journal uses article numbers instead of page numbers. See further details here.