Limited Knowledge of Chronic Kidney Disease among Type 2 Diabetes Mellitus Patients in India

1
Department of Pharmaceutical Medicine (Division of Pharmacology), School of Pharmaceutical Education and Research, Jamia Hamdard, New Delhi 110062, India
2
Department of Medicine, Hamdard Institute of Medical Sciences and Research, Jamia Hamdard, New Delhi 110062, India
3
Department of Pharmacology, School of Pharmaceutical Education and Research, Jamia Hamdard, New Delhi 110062, India
*
Author to whom correspondence should be addressed.
Int. J. Environ. Res. Public Health 2019, 16(8), 1443; https://doi.org/10.3390/ijerph16081443
Submission received: 6 March 2019
/
Revised: 12 April 2019
/
Accepted: 13 April 2019
/
Published: 23 April 2019
(This article belongs to the Section Health Behavior, Chronic Disease and Health Promotion)
Abstract
:Diabetes and hypertension are the two major causes of chronic kidney disease (CKD). Epidemiological studies have found poor knowledge about the CKD among the general population. Hence, this study aimed to assess the awareness of CKD among type 2 diabetes mellitus (T2DM) patients in India. Patients with confirmed T2DM were included in the study. Patients receiving dialysis or with a history of a kidney transplant were excluded. A validated questionnaire was used to assess knowledge about CKD. Demographic characteristics were presented using descriptive statistics and trends in groups were calculated using the chi-square test. Statistical analysis was performed using SAS v9.4. A total of 323 patients completed the study. The mean age of the patients was 56 ± 11.25 years, and 51.7% were female. Only 33.43% of the patients correctly identified diabetes and hypertension as risk factors for CKD, while 44.27% were aware of the kidney’s function. Statistically significant associations were observed between kidney disease knowledge and education status (p = 0.004), socioeconomic status (p = 0.000), and income status (p = 0.003). No association was observed between the knowledge about CKD and age, gender, hypertension stages, CKD stages, duration of diabetes as well as hypertension and co-morbidities. Based on the results of this study, we found poor knowledge of CKD among Indian T2DM patients. The government should start a CKD awareness programme to deal with this rising co-morbid condition.
1. Introduction
Diabetic kidney disease (DKD), also known as diabetic nephropathy, is a common microvascular complication of type 2 diabetes mellitus (T2DM). DKD is considered a major public health problem for both the patient and the healthcare system. Diabetes and hypertension are two major risk factors of chronic kidney disease (CKD) [1]. Even pre-hypertension is associated with an increased risk of CKD, with a relative risk of 1.28 (95% CI: 1.13 to 1.44) [2]. Albuminuria and proteinuria are hallmarks for CKD, which is characterized by a decline in renal function [3,4]. Diabetes and hypertension are also the most common causes of end-stage renal failure, accounting for nearly 50% of cases [5,6,7]. In the United States (US), diabetes and hypertension are the leading causes of kidney failure in CKD patients [8]. CKD has high global prevalence, with rates reported between 11% to 13% [9]. The Start India Project, which assessed the prevalence of CKD among diabetic patients, has estimated that more than 40% of T2DM patients have CKD. Likewise, one in five hypertensive subjects has CKD [10]. According to the 2010 Global Burden of Disease study, diabetes and CKD were ranked 9th and 18th among the listed causes of overall global mortality [11]. DKD was also associated with higher mortality, morbidity, and healthcare expenditure [12,13], imparting high economic burden on DKD patients [14].
Real world studies have also suggested a significant and incremental increase in the economic burden for DKD patients [14,15]. A retrospective cohort study found that T2DM patients with co-morbid stage-4 CKD incur yearly costs of USD 33,162 for their treatment [16]. In another retrospective observational study, DKD was found to be significantly associated with higher costs of treatment, healthcare resource use, and risk of disease progression [17]. According to a report from the National Health Service (NHS), treating kidney disease costs more than skin, lung, and breast cancer combined [18]. The economic burden due to CKD can be reduced if patients are diagnosed at an early stage. In low- and middle-income countries (LMICs), the majority of the patients generally only become aware of their CKD status when they reach the end-stage of kidney failure and require dialysis [19]. Furthermore, due to the absence of appropriate healthcare coverage and limited access to renal replacement therapy, the treatment of end-stage renal disease (ESRD) becomes unaffordable in LMICs, and patients are bound to pay out-of-pocket [20]. Timely diagnosis and treatment are the most cost-effective and clinically appropriate public health strategies to deal with this condition.
Early identification and treatments for DKD have been shown to slow, stop, or even reverse the progress of the disease and the decline of kidney function [21,22]. Yet the majority of CKD cases are not identified early. Limited knowledge of CKD is the main barrier to the early diagnosis and prevention of disease progression [23]. Several epidemiological studies have reported about the limited knowledge of CKD among the general public [24,25]. A global cross-sectional study done in six regions (Eastern Asia, Southern Asia, Middle East, Africa, Eastern Europe, and Latin America) found only 6% of the public to be aware of CKD [26]. Similarly, the data provided by the Kidney Early Evaluation Program (KEEP) and the National Health and Nutrition Examination Survey (NHANES) revealed that only 9% of the DKD patients were aware of their CKD status [27]. A study by Chow et al. found there to be poor knowledge of CKD in the general public and suggested future studies in population of high-risk individuals [24]. In a resource-limited country like India, where there are only 6.49 physicians for every 10,000 people [28] and the cost of dialysis is unaffordable [19], awareness of the disease is of paramount importance and is considered to be the first step toward prevention. Therefore, this study aimed to evaluate the knowledge of CKD among T2DM patients in India.
2. Methodology
2.1. Study Setting
This cross-sectional study was conducted at the out-patient department of endocrinology, at Hakeem Abdul Hameed Centenary (HAHC) Hospital, Jamia Hamdard, New Delhi, India. The study period was from April 2017–May 2018. Before the initiation of the study, the study protocol was approved by the Jamia Hamdard Institutional Ethics Committee (JHIEC-2017-04/17), India. The study was conducted in full compliance with the Declaration of Helsinki guidelines [29] and written in accordance with the Strengthening the Reporting of Observational Studies in Epidemiology (STROBE) guidelines for reporting a cross-sectional study [30]. Written informed consent was provided voluntarily by the participants. Participants were assured of their confidentiality and the anonymity of their identity.
2.2. Study Population
Patient selection was carried out on the basis of pre-defined inclusion and exclusion criteria. Only participants that fulfilled all the following criteria were included in the study: (a) willingness to participate in the study by providing signed informed consent form; (b) patients aged 18 years or above of either sex; (c) patients who had confirmed T2DM as per their medical records. Participants were excluded from the study if they were receiving dialysis or had a history of a kidney transplant. Patients with incomplete interview information were also excluded.
Patients’ demographic characteristics like age, sex, marital status, substance use (smoking, drinking), and family history were recorded in the case record form. We used modified Kuppuswamy’s socioeconomic scale to assess the economic status of the patients. According to this scale, socioeconomic status was divided into five subscales (upper, upper middle, lower middle, upper lower, and lower) on the basis of occupation, education, and family income. The majority of the patients fell into two categories, lower or lower middle class, so the patients were categorized into two classes (i.e., lower class or middle class).
2.3. Questionnaire Used
The questionnaire used to assess the CKD awareness was adopted from Chow et al. [24]. The questionnaire consisted of seven questions covering aspects of anatomy (number of kidneys needed to lead a normal life), physiology (the function of a kidney), etiology (risk factors of CKD), presentation (symptoms of CKD, progression), resources availability, and treatment (please refer to the supplementary file for the questionnaire). Every correct answer was allocated one point, so that patients could score a maximum of seven points or a minimum of zero point. Patients were considered to have good knowledge if they scored ≥4 points and poor knowledge if they scored <4 points.
2.4. Clinical and Laboratory Analysis
Anthropometric parameters and blood pressure were recorded by the trained nurse personnel. Blood pressure was measured using Richter auscultatory sphygmomanometers at two times: one at 5 min of rest and another at sitting position. Mean systolic blood pressure (SBP) and diastolic blood pressure (DBP) were recorded. Patients’ blood pressure records were also reviewed for an accurate reflection of hypertension stage. Patients were classified as hypertensive if the mean SBP was ≥140 mmHg and DBP was ≥90 mmHg or if they had been previously prescribed antihypertensive medication. Patients were further categorized as prehypertensive (SBP 120–139 mmHg or DBP 80–89 mmHg), stage-I hypertensive (SBP 140–159 mmHg or DBP 90–99 mmHg), and stage II hypertensive (SBP ≥ 160 mmHg or DBP ≥ 100 mmHg) [31]. Similarly, T2DM was defined on the basis of their medical record or fasting plasma glucose and/or glycated hemoglobin (HbA1c) level or as per the American Diabetes Association (ADA) guidelines (random blood sugar ≥ 200 mg/dL) [32]. To assure the accurate reflection of glycemic control, we also reviewed the patients’ HbA1c records. HbA1c level below 7 was considered a good glycemic control, and HbA1c ≥ 7 was considered a poor glycemic control. CKD was defined on the basis of kidney function, as determined by means of estimated glomerular filtration rate (eGFR). The Chronic Kidney Disease Epidemiology Collaboration (CKD-EPI) equation was used to calculate the eGFR (mL/min/1.73 m2) [33]. The National Kidney Foundation (NKF) classified CKD into six stages based on eGFR, where stage I refers to eGFR ≥ 90, stage II refers to eGFR 60–89, stage IIIa refers to eGFR 45–59, stage IIIb refers to eGFR 30–44, stage IV refers to eGFR 15–29, and stage V refers to eGFR < 15 [34]. Due to the small number of patients in CKD stage IIIa, IIIb, and IV, we included these classifications together under CKD stage III. The status of co-morbidities and duration of diabetes and hypertension were confirmed by physician, patients’ previous medical records, and current prescription. Literacy was self-reported by the patient.
Blood samples (5 mL) were collected for the routine test. The HbA1c test was performed by using a fully automated HPLC using a BIORAD testing system. Serum creatinine was determined by a modified Jaffe colorimetric method using a fully automated Siemens adiva-1800 chemistry analyzer (Siemens Healthcare Pvt Ltd., Mumbai, India). Blood glucose levels were determined by using a fully automated Roche Cobas 6000 analyzer (Roche, Mannheim, Germany). The entire tests were performed in the central pathology lab of Hamdard Institute of Medical Sciences and Research.
2.5. Statistical Analysis
Demographic characteristics were presented using descriptive statistics. Categorical variables were presented by frequency and percentages. Differences and association were computed using the chi-square test and multiple logistic regression. We considered good knowledge (≥4 scores) and poor knowledge (<4 scores) as the dependent dichotomous variable and associations were computed using the chi-square test. Similarly, we considered correct and incorrect responses of every question (domains) as the dependent dichotomous variable and associations with the demographic characteristics and clinical parameters were calculated using the chi-square test. A p value < 0.05 was considered statistically significant. All the statistical analyses were performed using SAS v9.4 (SAS Institute Inc: Cary, NC, USA).
3. Results
A total of 365 patients participated in the study, of which 42 were excluded, as they did not fulfill the inclusion criteria. The mean ± SD age of patients was 56 ± 11.25 years, and 51.7% were female. The majority (96.3%) was married and not covered by health schemes or health insurance and bound to pay out-of-pocket for the treatment. More than three-fourth of patients (77.7%) was of lower socioeconomic status and 63.5% were educated. Mean ± SD duration of diabetes was 10 ± 4.39 years and approximately 43.3% of the patients had a family history of diabetes. CKD stage III was prevalent in 34.4% (eGFR < 60 mL/min/1.73 m2) of patients, while 23.5% and 17.3% of patients had hypertension stage I and stage II, respectively. Demographic characteristics are presented in Table 1.
3.1. Patient’s Knowledge of CKD
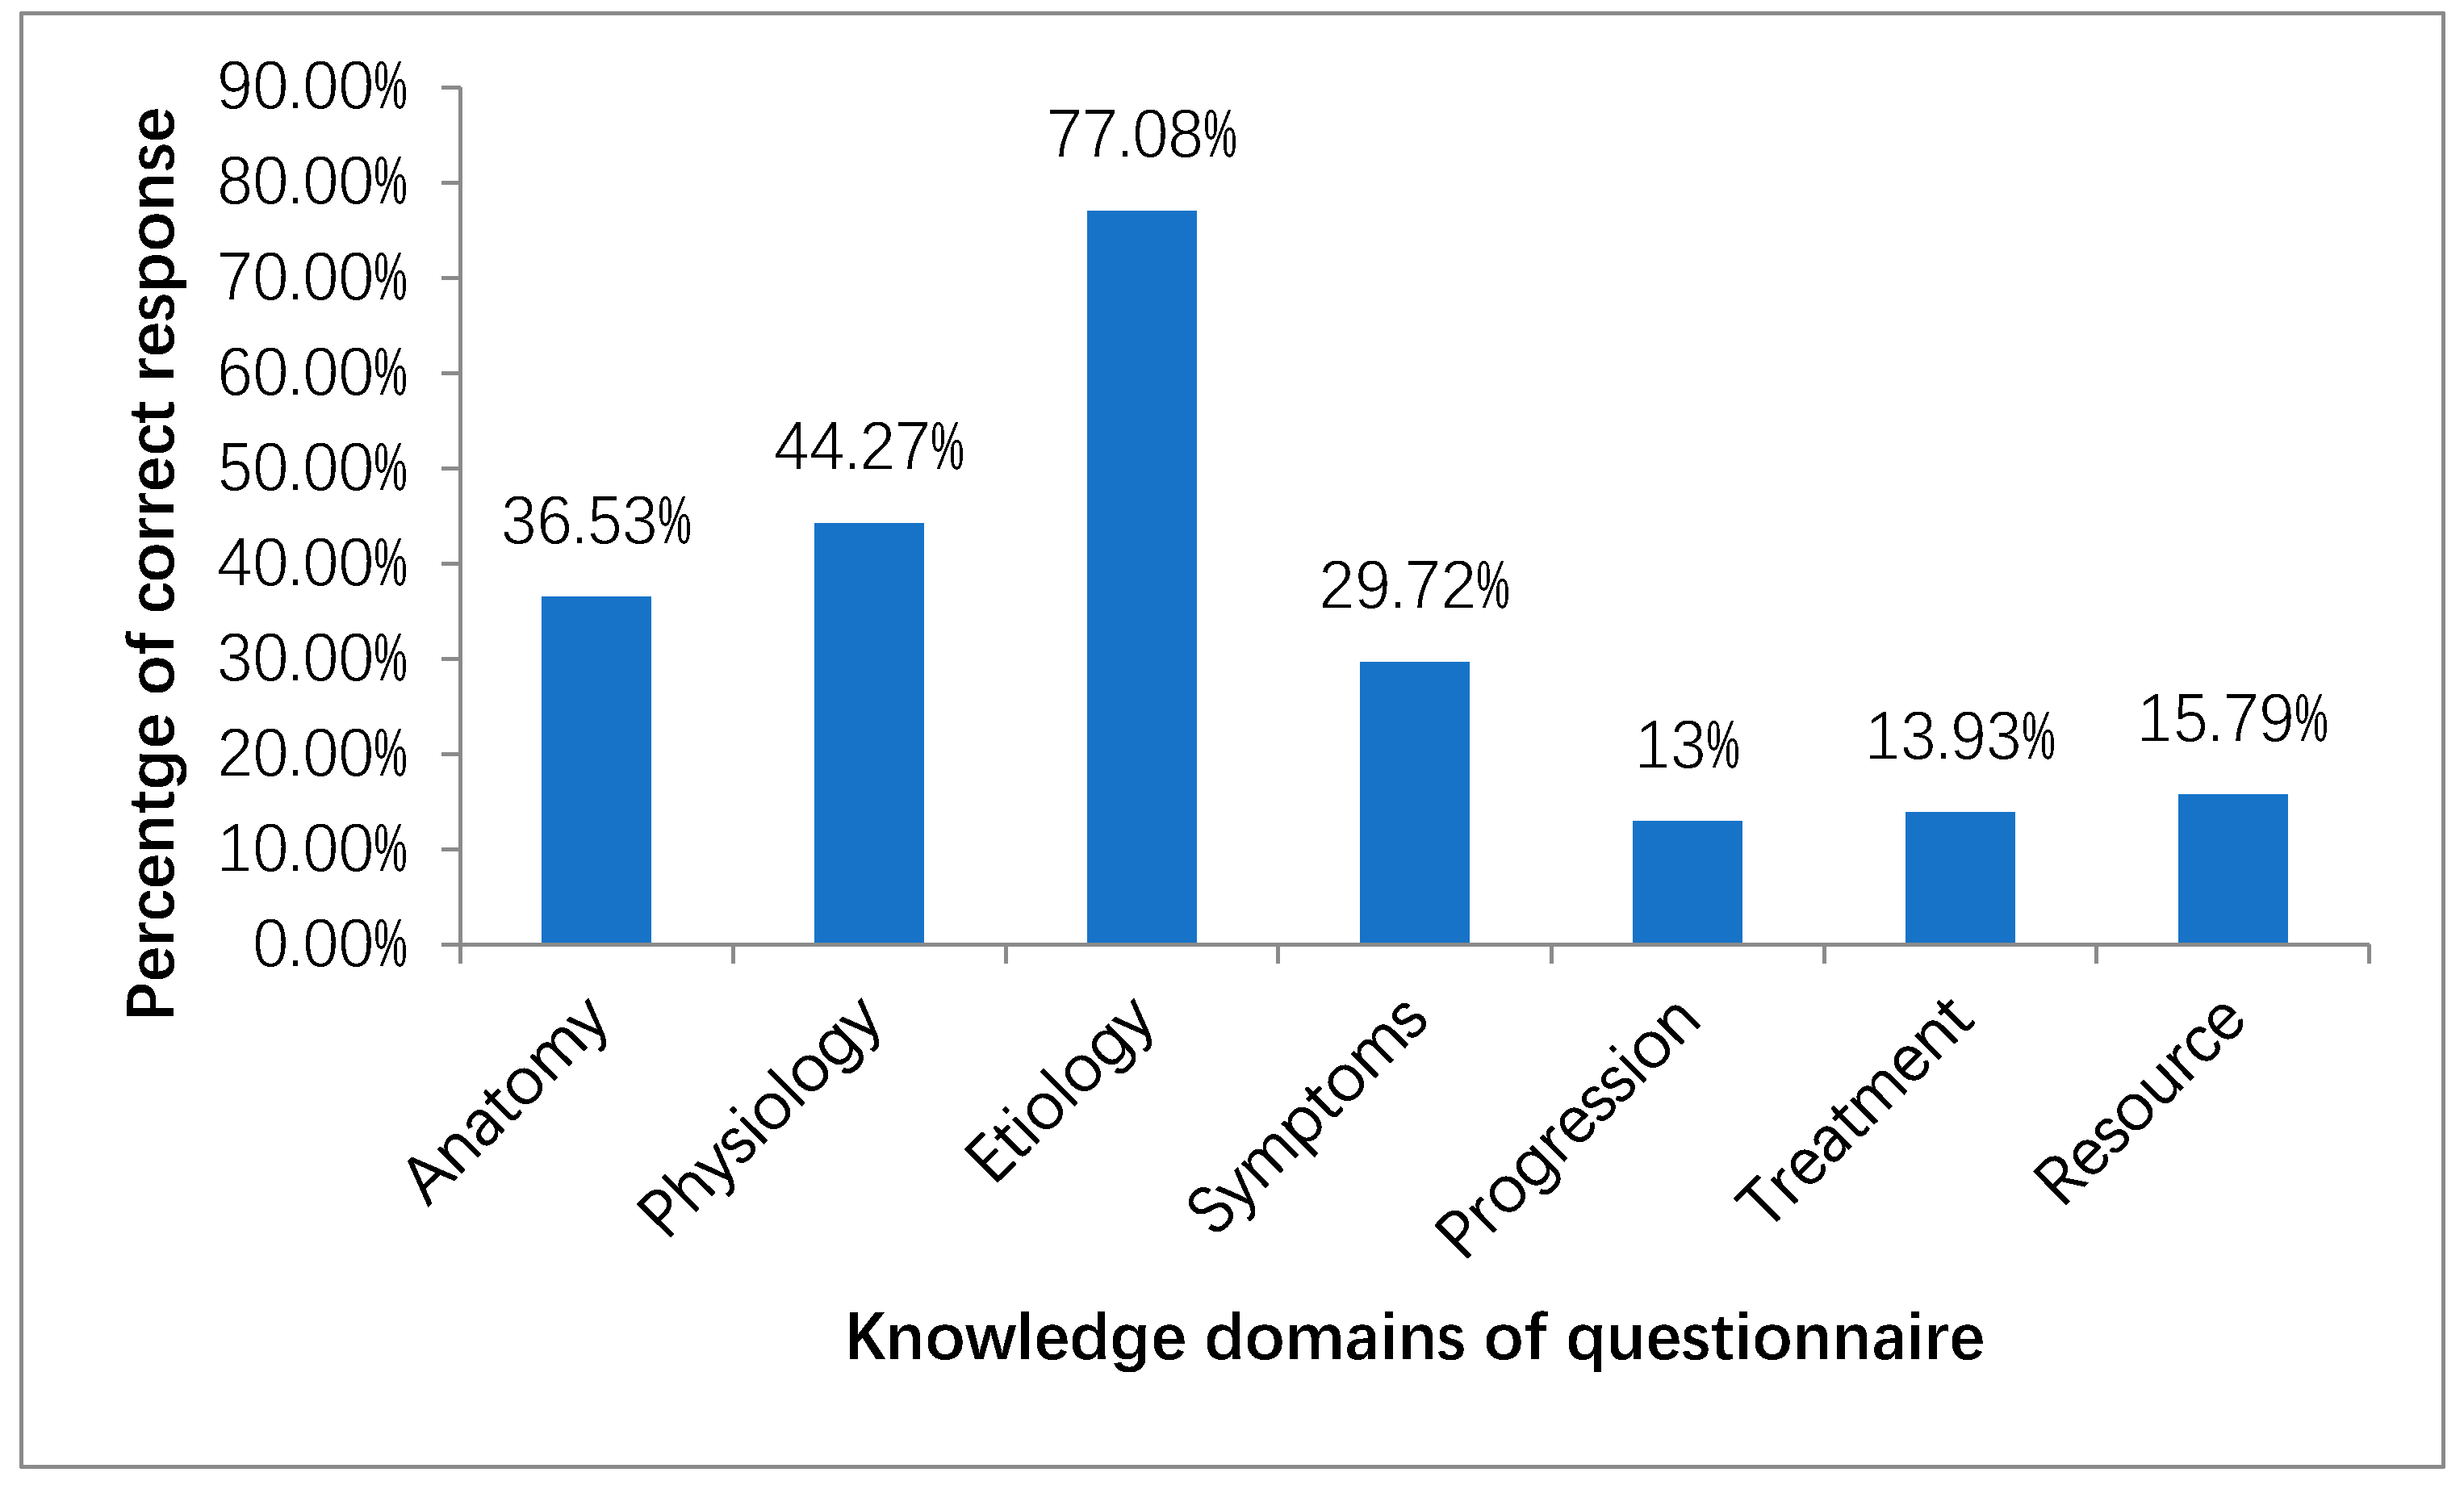
Amongst seven domains of CKD knowledge, 118 patients (36.53%) correctly answered the anatomy part of the questionnaire that only one kidney is required to live a normal life. Less than half of the study population (44.27%) was aware that the filtration of waste products in the blood is the function of the kidney. More than three-fourth of the respondents (77.08%) correctly identified the risk factors of CKD in which only one-third (33.43%) of the respondents were aware of diabetes and hypertension as risk factors. Only 6.5% correctly identified hypertension, diabetes, and inherited condition as risk factors for the development of CKD. While 29.72% of the patients correctly identified symptoms of early kidney disease that might progress to kidney failure, only 4.95% of patients were aware that kidney disease could present without any symptoms. Likewise, a similar percentage of patients correctly identified that medications cannot cure CKD. Only 13.93% of patients were aware that dialysis treatment can be carried out both in a dialysis center and at home. Figure 1 shows the percentages of patients who correctly answered the questions.
Only 21.36% of respondents were found to have good knowledge (≥4 scores) of CKD, and the remaining had poor knowledge (<4 scores) of CKD (Table 2). Respondents who were literate, had a monthly family income more than 20,000 INR (Indian National Rupees), and belong to the middle class were found to have significantly good knowledge of CKD (all p < 0.05). No significant difference in knowledge score was observed among respondents stratified according to CKD stages, hypertension stages, BMI, gender, co-morbidities, family history, and duration of diabetes and hypertension (all p > 0.05).
3.2. Factors Influencing CKD knowledge
Being older (≥50 years), female gender, substance use (smoking, drinking), and occupation were non-significantly associated with CKD knowledge in all of the seven domains of the questionnaire. Patients who had a family history of diabetes were more likely to have a higher knowledge of CKD in all the domains except the treatment domain.
Patients belonging to the middle class were found to have a significantly higher knowledge of CKD in almost every domain of the CKD questionnaire (p < 0.05). Similarly, patients who had a monthly family income more than 20,000 INR were found to have a significantly higher knowledge of CKD (p < 0.05). Poor glycemic control patients were found to have a higher knowledge of the anatomy-related part of the questionnaire, with an odds ratio of 1.71 (95% CI: 1.04 to 2.80) as compared to good glycemic control patients (Table 3 and Table 4). CKD stage II and III patients had significantly higher knowledge in the physiology and disease progression parts of the questionnaire, respectively (p < 0.05), in comparison to the stage I CKD patients. A detailed description of the results is presented in Table 3 and Table 4. Multiple logistic regression analysis reveals that patients who were literate (adjusted odds ratio (AOR) 1.78 (95% CI: 1.30–2.36), p = 0.02) and had a higher family income (AOR 2.26 (95% CI: 1.66–3.14), p = 0.04) was found to have significantly good knowledge of CKD.
4. Discussion
It is evident from the literature that burden of diabetes is continuously increasing, which will contribute to the rising prevalence of CKD globally [9,10]. Published literature revealed that CKD can be reversible and preventable from its progression to end-stage kidney disease if it is diagnosed at an early stage [21,22]. Previous studies found poor knowledge of CKD among the general public, however, limited studies have assessed the knowledge of CKD among high-risk patients [23,24,25]. This was the first cross-sectional study assessing the knowledge of CKD among a high-risk population with diabetes and hypertension as co-morbid conditions. The current study revealed poor knowledge of CKD among these patients. Less than a quarter of the patients had good knowledge of CKD (knowledge score ≥ 4). Poor knowledge of CKD was also found in other studies conducted around the globe [24,35].
In this study, only one-third (33%) of the patients identified hypertension and diabetes as risk factors of CKD. A cross-sectional survey conducted among the non-CKD Malaysian population found half of the population (51.2%) to be aware of diabetes and hypertension as risk factors of CKD [24]. Variation in risk factor awareness could be due to the higher education level among the Malaysian population, as all (100%) the respondents were literate and 78.3% of the respondents had secondary or above secondary education levels [24]. Similarly, a cross-sectional telephonic survey among community-dwelling adults also revealed poor awareness of CKD and less than half of the population were aware of diabetes or hypertension as risk factors of CKD [35]. A lack of awareness about common risk factors like hypertension and diabetes is raising the alarm for the need for further action. Furthermore, this population is less likely to get proper screening, adhere to prescribed medication regimens, or take part in decision making, which may ultimately contribute to the rising prevalence of CKD and further progression of CKD to its end stages. Our study also found that patients who had a family history of diabetes or poor glycemic control were more likely to have a higher knowledge of CKD, including the risk factors. Higher knowledge among these patients could be possibly due to poor health status (uncontrolled diabetes), or patients who have heard of CKD are more likely to have better knowledge [36]. A study by Fezeu et al. [37] also concluded that patients whose relatives had a chronic condition are generally more aware (p < 0.001) of the disease. Patients belonging to the middle class or having higher family income were also found to have a higher knowledge of CKD. Family income is considered to be an important factor affecting the quality of life among non-dialysis CKD patients [38]. Previous studies also suggested that low income is associated with a higher prevalence of chronic conditions [39].
No significant difference in knowledge score was observed among respondents stratified according to CKD stages, hypertension stages, BMI, age, gender, and co-morbidities. The findings of Finkelstein et al. [40] also found no impact of age, gender, and disease on patients’ knowledge of CKD. However, they found that knowledge of CKD improved significantly as the CKD stage progressed, particularly in stage 5 CKD. Our result was contrary to that, as we did not find any significant improvement in knowledge on the basis of CKD stages. A possible reason for this could be due to the inclusion of non-dialysis (stage I to III CKD) patients only.
The study should be interpreted in light of certain limitations. Firstly, the findings of the study cannot be generalized to the entire CKD population, as the study was comprised only of patients from a single center. Secondly, the study was limited in regard to the selection of participants (selection bias); to overcome this, we consecutively selected the participants. There were several notable strengths of this study. Firstly, the study included T2DM and hypertensive patients and performed stratification based on CKD and hypertension stages. Secondly, the knowledge level was correlated with diabetes and hypertension status. The present study also highlighted the needs of CKD education among T2DM and hypertensive patients, since a lack of knowledge about these risk factors was reflected in the study that may have resulted in late referral to the nephrologist and poor participation in the decision-making process. Future studies are warranted to assess the CKD knowledge in a large population-based sample and to frame a CKD awareness model for high-risk patients as well as the general population in order to promote earlier diagnosis, better treatment, and innovative care.
5. Conclusions
We found poor knowledge of kidney disease among T2DM and hypertensive Indian patients. The government should start a CKD awareness programme to deal with this devastating co-morbid condition, which would help in achieving cost-effective prevention.
Supplementary Materials
The following are available online at https://www.mdpi.com/1660-4601/16/8/1443/s1: Supplementary File S1: Questionnaire to assess the awareness of kidney disease.
Author Contributions
Conceptualization: S.H., A.H.; Methodology: S.H., A.H.; Statistical Analysis: S.H.; Writing—Original draft preparation: S.H., A.H., A.K.N. All authors have reviewed and revised the draft critically for intellectual content. All authors provided final approval to the version submitted to the journal.
Funding
This research received no external funding.
Acknowledgments
First author (Salman Hussain) is thankful to Sun Pharmaceuticals, India, for providing assistantship for this project under the joint collaboration for the Ph.D. programme with Jamia Hamdard, New Delhi, India.
Conflicts of Interest
The authors declare no conflict of interest.
References
- Lea, J.P.; Nicholas, S.B. Diabetes mellitus and hypertension: Key risk factors for kidney disease. J. Natl. Med. Assoc. 2002, 94, 7S. [Google Scholar]
- Li, Y.; Xia, P.; Xu, L.; Wang, Y.; Chen, L. A meta-analysis on prehypertension and chronic kidney disease. PLoS ONE 2016, 11, e0156575. [Google Scholar] [CrossRef] [PubMed]
- Levin, A.; Stevens, P.E.; Bilous, R.W.; Coresh, J.; De Francisco, A.L.; De Jong, P.E.; Griffith, K.E.; Hemmelgarn, B.R.; Iseki, K.; Lamb, E.J.; et al. Kidney Disease: Improving Global Outcomes (KDIGO) CKD Work Group. KDIGO 2012 clinical practice guideline for the evaluation and management of chronic kidney disease. Kidney Int. Suppl. 2013, 3, 1–150. [Google Scholar]
- Zhang, L.; Wang, F.; Wang, L.; Wang, W.; Liu, B.; Liu, J.; Chen, M.; He, Q.; Liao, Y.; Yu, X.; et al. Prevalence of chronic kidney disease in China: A cross-sectional survey. Lancet 2012, 379, 815–822. [Google Scholar] [CrossRef]
- Tozawa, M.; Iseki, K.; Iseki, C.; Kinjo, K.; Ikemiya, Y.; Takishita, S. Blood pressure predicts risk of developing end-stage renal disease in men and women. Hypertension 2003, 41, 1341–1345. [Google Scholar] [CrossRef] [PubMed]
- Tuttle, K.R.; Bakris, G.L.; Bilous, R.W.; Chiang, J.L.; De Boer, I.H.; Goldstein-Fuchs, J.; Hirsch, I.B.; Kalantar-Zadeh, K.; Narva, A.S.; Navaneethan, S.D.; et al. Diabetic kidney disease: A report from an ADA Consensus Conference. Am. J. Kidney Dis. 2014, 64, 510–533. [Google Scholar] [CrossRef]
- Rajapurkar, M.M.; John, G.T.; Kirpalani, A.L.; Abraham, G.; Agarwal, S.K.; Almeida, A.F.; Gang, S.; Gupta, A.; Modi, G.; Pahari, D.; et al. What do we know about chronic kidney disease in India: First report of the Indian CKD registry. BMC Nephrol. 2012, 13, 10. [Google Scholar] [CrossRef]
- Collins, A.J.F. United States Renal Data System 2008 Annual Data Report. Am. J. Kidney Dis. 2009, 53, S1–S374. [Google Scholar] [CrossRef]
- Hill, N.R.; Fatoba, S.T.; Oke, J.L.; Hirst, J.A.; O’Callaghan, C.A.; Lasserson, D.S.; Hobbs, F.R. Global Prevalence of Chronic Kidney Disease—A Systematic Review and Meta-Analysis. PLoS ONE 2016, 11, e0158765. [Google Scholar] [CrossRef]
- Prasannakumar, M.; Rajput, R.; Seshadri, K.; Talwalkar, P.; Agarwal, P.; Gokulnath, G.; Kotak, B.; Raza, A.; Vasnawala, H.; Teli, C. An observational, cross-sectional study to assess the prevalence of chronic kidney disease in type 2 diabetes patients in India (START-India). Indian J. Endocrinol. Metab. 2015, 19, 520–523. [Google Scholar]
- Lozano, R.; Naghavi, M.; Foreman, K.; Lim, S.; Shibuya, K.; Aboyans, V.; Abraham, J.; Adair, T.; Aggarwal, R.; Ahn, S.Y.; et al. Global and regional mortality from 235 causes of death for 20 age groups in 1990 and 2010: A systematic analysis for the Global Burden of Disease Study 2010. Lancet 2012, 380, 2095–2128. [Google Scholar] [CrossRef]
- Afkarian, M.; Sachs, M.C.; Kestenbaum, B.; Hirsch, I.B.; Tuttle, K.R.; Himmelfarb, J.; De Boer, I.H. Kidney disease and increased mortality risk in type 2 diabetes. J. Am. Soc. Nephrol. 2013, 24, 302–308. [Google Scholar] [CrossRef] [PubMed]
- Burrows, N.R.; Hora, I.; Geiss, L.S.; Gregg, E.W.; Albright, A. Incidence of End-Stage Renal Disease Attributed to Diabetes Among Persons with Diagnosed Diabetes—United States and Puerto Rico, 2000–2014. MMWR Morb. Mortal. Wkly. Rep. 2017, 66, 1165–1170. [Google Scholar] [CrossRef]
- Foley, R.N.; Collins, A.J. The growing economic burden of diabetic kidney disease. Curr. Diab. Rep. 2009, 9, 460. [Google Scholar] [CrossRef]
- McQueen, R.B.; Farahbakhshian, S.; Bell, K.F.; Nair, K.V.; Saseen, J.J. Economic burden of comorbid chronic kidney disease and diabetes. J. Med. Econ. 2017, 20, 585–591. [Google Scholar] [CrossRef] [PubMed]
- Vupputuri, S.; Kimes, T.M.; Calloway, M.O.; Christian, J.B.; Bruhn, D.; Martin, A.A.; Nichols, G.A. The economic burden of progressive chronic kidney disease among patients with type 2 diabetes. J. Diabetes Complicat. 2014, 28, 10–16. [Google Scholar] [CrossRef] [PubMed]
- Zhou, Z.; Chaudhari, P.; Yang, H.; Fang, A.P.; Zhao, J.; Law, E.H.; Wu, E.Q.; Jiang, R.; Seifeldin, R. Healthcare Resource Use, Costs, and Disease Progression Associated with Diabetic Nephropathy in Adults with Type 2 Diabetes: A Retrospective Observational Study. Diabetes Ther. 2017, 8, 555–571. [Google Scholar] [CrossRef] [Green Version]
- Chronic Kidney Disease. Available online: http://www.worldkidneyday.org/faqs/chronic-kidney-disease/ (accessed on 26 January 2019).
- Chugh, K.; Jha, V.; Chugh, S. (Eds.) Economics of dialysis and renal transplantation in the developing world. Transpl. Proc. 1999, 31, 3275–3277. [Google Scholar] [CrossRef]
- Sakhuja, V.; Sud, K. End-stage renal disease in India and Pakistan: Burden of disease and management issues. Kidney Int. 2003, 63, S115–S118. [Google Scholar] [CrossRef] [Green Version]
- National Kidney Foundation. Available online: https://www.kidney.org/news/newsroom/nr/92 (accessed on 26 January 2019).
- Sarnak, M.J.; Levey, A.S.; Schoolwerth, A.C.; Coresh, J.; Culleton, B.; Hamm, L.L.; McCullough, P.A.; Kasiske, B.L.; Kelepouris, E.; Klag, M.J.; et al. Kidney disease as a risk factor for development of cardiovascular disease: A statement from the American Heart Association Councils on Kidney in Cardiovascular Disease, High Blood Pressure Research, Clinical Cardiology, and Epidemiology and Prevention. Hypertension 2003, 42, 1050–1065. [Google Scholar] [CrossRef] [PubMed]
- Van Dipten, C.; de Grauw, W.J.; Wetzels, J.F.; Assendelft, W.J.; Scherpbier-de Haan, N.D.; Dees, M.K. What patients with mild-to-moderate kidney disease know, think, and feel about their disease: An in-depth interview study. J. Am. Board Fam. Med. 2018, 31, 570–577. [Google Scholar] [CrossRef] [PubMed]
- Chow, W.L.; Joshi, V.D.; Tin, A.S.; van der Erf, S.; Lim, J.F.Y.; Swah, T.S.; Teo, S.S.; Goh, P.S.; Tan, G.C.; Lim, C.; et al. Limited knowledge of chronic kidney disease among primary care patients–a cross-sectional survey. BMC Nephrol. 2012, 13, 54. [Google Scholar] [CrossRef]
- Gheewala, P.A.; Peterson, G.M.; Zaidi, S.T.R.; Jose, M.D.; Castelino, R.L. Public knowledge of chronic kidney disease evaluated using a validated questionnaire: A cross-sectional study. BMC Public Health 2018, 18, 371. [Google Scholar] [CrossRef]
- Ene-Iordache, B.; Perico, N.; Bikbov, B.; Carminati, S.; Remuzzi, A.; Perna, A.; Islam, N.; Bravo, R.F.; Aleckovic-Halilovic, M.; Zou, H.; et al. Chronic kidney disease and cardiovascular risk in six regions of the world (ISN-KDDC): A cross-sectional study. Lancet Glob. Health 2016, 4, e307–e319. [Google Scholar] [CrossRef]
- Whaley-Connell, A.; Sowers, J.R.; McCullough, P.A.; Roberts, T.; McFarlane, S.I.; Chen, S.-C.; Li, S.; Wang, C.; Collins, A.J.; Bakris, G.L.; et al. Diabetes mellitus and CKD awareness: The kidney early evaluation program (KEEP) and national health and nutrition examination survey (NHANES). Am. J. Kidney Dis. 2009, 53, S11–S21. [Google Scholar] [CrossRef]
- India Statistics Summary. Available online: http://apps.who.int/gho/data/node.country.country-IND. (accessed on 6 January 2019).
- World Medical Association. Declaration of Helsinki: Ethical principles for medical research involving human subjects. JAMA 2013, 310, 2191–2194. [Google Scholar] [CrossRef]
- Von Elm, E.; Altman, D.G.; Egger, M.; Pocock, S.J.; Gøtzsche, P.C.; Vandenbroucke, J.P. The Strengthening the Reporting of Observational Studies in Epidemiology (STROBE) Statement: Guidelines for reporting observational studies. Int. J. Surg. 2014, 12, 1495–1499. [Google Scholar] [CrossRef] [Green Version]
- Bell, K.; Twiggs, J.; Olin, B.R.; Date, I.R. Hypertension: The Silent Killer: Updated JNC-8 Guideline Recommendations; Alabama Pharmacy Association: Montgomery, AL, USA, 2015; pp. 1–8. [Google Scholar]
- American Diabetes Association. Report of the expert committee on the diagnosis and classification of diabetes mellitus. Diabetes Care 2003, 26, s5–s20. [Google Scholar] [CrossRef]
- Levey, A.S.; Stevens, L.A.; Schmid, C.H.; Zhang, Y.L.; Castro, A.F.; Feldman, H.I.; Kusek, J.W.; Eggers, P.; Van Lente, F.; Greene, T.; et al. A new equation to estimate glomerular filtration rate. Ann. Int. Med. 2009, 150, 604–612. [Google Scholar] [CrossRef]
- Levey, A.S.; Coresh, J.; Bolton, K.; Culleton, B.; Harvey, K.S.; Ikizler, T.A.; Johnson, C.A.; Kausz, A.; Kimmel, P.L.; Kusek, J.; et al. K/DOQI clinical practice guidelines for chronic kidney disease: Evaluation, classification, and stratification. Am. J. Kidney Dis. 2002, 39, S1–S266. [Google Scholar]
- Chow, K.; Szeto, C.; Kwan, B.; Leung, C.; Li, P. Public lacks knowledge on chronic kidney disease: Telephone survey. Hong Kong Medj. 2014, 20, 139–144. [Google Scholar] [CrossRef] [PubMed]
- Ng, C.Y.; Lee, Z.S.; Goh, K.S. Cross-sectional study on knowledge of chronic kidney disease among medical outpatient clinic patients. Med. J. Malays. 2016, 71, 99–104. [Google Scholar]
- Fezeu, L.; Fointama, E.; Ngufor, G.; Mbeh, G.; Mbanya, J.-C. Diabetes awareness in general population in Cameroon. Diabetes Res. Clin. Pract. 2010, 90, 312–318. [Google Scholar] [CrossRef]
- Lemos, C.F.; Rodrigues, M.P.; Veiga, J.R.P. Family income is associated with quality of life in patients with chronic kidney disease in the pre-dialysis phase: A cross sectional study. Health Qual. Life Outcomes 2015, 13, 202. [Google Scholar] [CrossRef] [PubMed]
- Rabi, D.M.; Edwards, A.L.; Southern, D.A.; Svenson, L.W.; Sargious, P.M.; Norton, P.; Larsen, E.T.; Ghali, W.A. Association of socio-economic status with diabetes prevalence and utilization of diabetes care services. BMC Health Serv. Res. 2006, 6, 124. [Google Scholar] [CrossRef] [PubMed]
- Finkelstein, F.O.; Story, K.; Firanek, C.; Barre, P.; Takano, T.; Soroka, S.; Mujais, S.; Rodd, K.; Mendelssohn, D. Perceived knowledge among patients cared for by nephrologists about chronic kidney disease and end-stage renal disease therapies. Kidney Int. 2008, 74, 1178–1184. [Google Scholar] [CrossRef] [PubMed] [Green Version]
Figure 1.
Percentage of patients with correct responses to the administered questionnaire.


Table 1.
Background characteristics of the patients.
| Variables | Male | Female | Total | p Value |
|---|---|---|---|---|
| Age groups | >0.999 | |||
| ≥50 | 93 (59.6%) | 99 (59.3%) | 192 (59.4%) | |
| <50 | 63 (40.4%) | 68 (40.7%) | 131 (40.6%) | |
| Marital Status | >0.999 | |||
| Married | 150 (96.2%) | 161 (96.4%) | 311 (96.3%) | |
| Unmarried | 6 (3.85%) | 6 (3.59%) | 12 (3.72%) | |
| Family History of Diabetes | 0.8223 | |||
| Yes | 69 (44.2%) | 71 (42.5%) | 140 (43.3%) | |
| No | 87 (55.8%) | 96 (57.5%) | 183 (56.7%) | |
| Substance Use | 0.0459 | |||
| Yes | 43 (27.6%) | 30 (18.0%) | 73 (22.6%) | |
| No | 113 (72.4%) | 137 (82.0%) | 250 (77.4%) | |
| Education | 0.0077 | |||
| Literate | 111 (71.2%) | 94 (56.3%) | 205 (63.5%) | |
| Illiterate | 45 (28.8%) | 73 (43.7%) | 118 (36.5%) | |
| Occupation | 0.0308 | |||
| Employed | 98 (62.8%) | 124 (74.3%) | 222 (68.7%) | |
| Unemployed | 58 (37.2%) | 43 (25.7%) | 101 (31.3%) | |
| Socioeconomic Status | 0.0324 | |||
| Middle | 43 (27.6%) | 29 (17.4%) | 72 (22.3%) | |
| Lower | 113 (72.4%) | 138 (82.6%) | 251 (77.7%) | |
| CKD Stage | 0.3724 | |||
| Stage III | 48 (30.8%) | 63 (37.7%) | 111 (34.4%) | |
| Stage II | 65 (41.7%) | 66 (39.5%) | 131 (40.6%) | |
| Stage I | 43 (27.6%) | 38 (22.8%) | 81 (25.1%) | |
| HTN Stage | 0.6244 | |||
| Stage I HTN | 40 (25.6%) | 36 (21.6%) | 76 (23.5%) | |
| Stage II HTN | 23 (14.7%) | 33 (19.8%) | 56 (17.3%) | |
| Prehypertension | 43 (27.6%) | 46 (27.5%) | 89 (27.6%) | |
| Normal | 50 (32.1%) | 52 (31.1%) | 102 (31.6%) | |
| BMI Categories | 0.6529 | |||
| Overweight | 61 (39.1%) | 59 (35.3%) | 120 (37.2%) | |
| Obese | 32 (20.5%) | 41 (24.6%) | 73 (22.6%) | |
| Normal | 63 (40.4%) | 67 (40.1%) | 130 (40.2%) | |
| Co-morbidities | 0.6431 | |||
| Yes | 53 (34.0%) | 61 (36.5%) | 114 (35.3%) | |
| No | 103 (66.0%) | 106 (63.5%) | 209 (64.7%) | |
| Duration of diabetes | 0.3743 | |||
| Less than 10 years | 79 (50.6%) | 89 (53.3%) | 168 (52.0%) | |
| More than 10 years | 77 (49.4%) | 78 (46.7%) | 155 (48.0%) | |
| Duration of HTN | ||||
| Less than 5 years | 44 (63.76%) | 37 (58.73%) | 81 (61.36%) | 0.5942 |
| More than 5 years | 25 (36.23%) | 26 (41.26%) | 51 (38.63%) |
CKD: Chronic Kidney Disease; HTN: Hypertension; BMI: Body Mass Index.
Table 2.
Knowledge scores among the patients stratified on the basis of demographic and clinical characteristics.
Table 2.
Knowledge scores among the patients stratified on the basis of demographic and clinical characteristics.
| Variables | Less than 4 Correct Answers | At least 4 Correct Answers | Total | p Value |
|---|---|---|---|---|
| Age Groups | 0.5832 | |||
| ≥50 | 153 (60.2%) | 39 (56.5%) | 192 (59.4%) | |
| <50 | 101 (39.8%) | 30 (43.5%) | 131 (40.6%) | |
| Gender | 0.2231 | |||
| Female | 136 (53.5%) | 31 (44.9%) | 167 (51.7%) | |
| Male | 118 (46.5%) | 38 (55.1%) | 156 (48.3%) | |
| Family History of Diabetes | 0.1018 | |||
| Yes | 104 (40.9%) | 36 (52.2%) | 140 (43.3%) | |
| No | 150 (59.1%) | 33 (47.8%) | 183 (56.7%) | |
| Substance Use | 0.8724 | |||
| Yes | 57 (22.4%) | 16 (23.2%) | 73 (22.6%) | |
| No | 197 (77.6%) | 53 (76.8%) | 250 (77.4%) | |
| Education | 0.004 | |||
| Literate | 151 (59.44%) | 54 (78.26%) | 205 (63.5%) | |
| Illiterate | 103 (40.56%) | 15 (21.74%) | 118 (36.5%) | |
| Occupation | 0.0783 | |||
| Employed | 181 (71.3%) | 41 (59.4%) | 222 (68.7%) | |
| Unemployed | 73 (28.7%) | 28 (40.6%) | 101 (31.3%) | |
| Socioeconomic Status | 0.0003 | |||
| Middle | 45 (17.7%) | 27 (39.1%) | 72 (22.3%) | |
| Lower | 209 (82.3%) | 42 (60.9%) | 251 (77.7%) | |
| Monthly Family Income | 0.0034 | |||
| More than 20,000 INR | 34 (13.4%) | 20 (29.0%) | 54 (16.7%) | |
| Less than 20,000 INR | 220 (86.6%) | 49 (71.0%) | 269 (83.3%) | |
| CKD Stages | 0.5453 | |||
| Stage III | 89 (35.0%) | 22 (31.9%) | 111 (34.4%) | |
| Stage II | 99 (39.0%) | 32 (46.4%) | 131 (40.6%) | |
| Stage I | 66 (26.0%) | 15 (21.7%) | 81 (25.1%) | |
| HTN Stages | 0.4704 | |||
| Stage I HTN | 63 (24.8%) | 13 (18.8%) | 76 (23.5%) | |
| Stage II HTN | 40 (15.7%) | 16 (23.2%) | 56 (17.3%) | |
| Prehypertension | 70 (27.6%) | 19 (27.5%) | 89 (27.6%) | |
| Normal | 81 (31.9%) | 21 (30.4%) | 102 (31.6%) | |
| Glycemic Control | 0.1321 | |||
| Poor (HbA1c ≥ 7) | 187 (73.6%) | 44 (63.8%) | 231 (71.5%) | |
| Good (HbA1c < 7) | 67 (26.4%) | 25 (36.2%) | 92 (28.5%) | |
| BMI Categories | 0.5314 | |||
| Overweight | 97 (38.2%) | 23 (33.3%) | 120 (37.2%) | |
| Obese | 59 (23.2%) | 14 (20.3%) | 73 (22.6%) | |
| Normal | 98 (38.6%) | 32 (46.4%) | 130 (40.2%) | |
| Co-morbidities | 0.4791 | |||
| Yes | 87 (34.3%) | 27 (39.1%) | 114 (35.3%) | |
| No | 167 (65.7%) | 42 (60.9%) | 209 (64.7%) | |
| Duration of Diabetes | 0.3418 | |||
| Less than 10 years | 136 (53.5%) | 32 (46.4%) | 168 (52.0%) | |
| More than 10 years | 118 (46.5%) | 37 (53.6%) | 155 (48.0%) | |
| Duration of HTN | ||||
| Less than 5 years | 66 (62.85%) | 15 (55.55%) | 81 (61.36%) | 0.5123 |
| More than 5 years | 39 (37.15%) | 12 (44.45%) | 51 (38.63%) |
INR: Indian National Rupees; CKD: Chronic Kidney Disease; HbA1c: Glycated Hemoglobin; HTN: Hypertension; BMI: Body Mass Index.
Table 3.
Association between different domains of knowledge and demographic characteristics.
| Variables | C_Q1 (Anatomy) | IC_Q1 (Anatomy) | Odds Ratio | C_Q2 (Physiology) | IC_Q2 (Physiology) | Odds Ratio | C_Q3 (Etiology) | IC_Q3 (Etiology) | Odds Ratio |
|---|---|---|---|---|---|---|---|---|---|
| Age Groups | |||||||||
| ≥50 | 66 (20.4%) | 126 (39.0%) | 0.796 (0.503, 1.260) | 80 (24.8%) | 112 (34.7%) | 0.771 (0.493, 1.205) | 154 (47.7%) | 38 (11.8%) | 1.536 (0.911, 2.590) |
| <50 | 52 (16.1%) | 79 (24.5%) | Reference | 63 (19.5%) | 68 (21.1%) | Reference | 95 (29.4%) | 36 (11.1%) | Reference |
| Gender | |||||||||
| Female | 60 (18.5%) | 107 (33.1%) | 0.947 (0.602, 1.491) | 70 (21.7%) | 97 (30.0%) | 0.821 (0.529, 1.274) | 126 (39.0%) | 41 (12.7%) | 0.825 (0.490, 1.389) |
| Male | 58 (18.0%) | 98 (30.3%) | Reference | 73 (22.6%) | 83 (25.7%) | Reference | 123 (38.1%) | 33 (10.2%) | Reference |
| Family History of Diabetes | |||||||||
| Yes | 56 (17.3%) | 84 (26.0%) | 1.301 (0.825, 2.053) | 72 (22.3%) | 68 (21.1%) | 1.670 (1.070, 2.607) | 115 (35.6%) | 25 (7.74%) | 1.682 (0.978, 2.893) |
| No | 62 (19.2%) | 121 (37.5%) | Reference | 71 (22.0%) | 112 (34.7%) | Reference | 134 (41.5%) | 49 (15.2%) | Reference |
| Substance Use | |||||||||
| Yes | 30 (9.29%) | 43 (13.3%) | 1.284 (0.753, 2.190) | 34 (10.5%) | 39 (12.1%) | 1.128 (0.668, 1.903) | 61 (18.9%) | 12 (3.72%) | 1.676 (0.847, 3.317) |
| No | 88 (27.2%) | 162 (50.2%) | Reference | 109 (33.7%) | 141 (43.7%) | Reference | 188 (58.2%) | 62 (19.2%) | Reference |
| Education | |||||||||
| Literate | 74 (22.9%) | 131 (40.6%) | 0.950 (0.594, 1.519) | 87 (26.9%) | 118 (36.5%) | 0.816 (0.518, 1.287) | 162 (50.2%) | 43 (13.3%) | 1.342 (0.790, 2.281) |
| Illiterate | 44 (13.6%) | 74 (22.9%) | Reference | 56 (17.3%) | 62 (19.2%) | Reference | 87 (26.9%) | 31 (9.60%) | Reference |
| Occupation | |||||||||
| Employed | 76 (23.5%) | 146 (45.2%) | 0.731 (0.451, 1.185) | 92 (28.5%) | 130 (40.2%) | 0.694 (0.432, 1.113) | 170 (52.6%) | 52 (16.1%) | 0.910 (0.517, 1.603) |
| Unemployed | 42 (13.0%) | 59 (18.3%) | Reference | 51 (15.8%) | 50 (15.5%) | Reference | 79 (24.5%) | 22 (6.81%) | Reference |
| Socioeconomic Status | |||||||||
| Middle | 34 (10.5%) | 38 (11.8%) | 1.779 (1.045, 3.028) * | 45 (13.9%) | 27 (8.36%) | 2.602 (1.516, 4.467) ** | 63 (19.5%) | 9 (2.79%) | 2.446 (1.152, 5.196) * |
| Lower | 84 (26.0%) | 167 (51.7%) | Reference | 98 (30.3%) | 153 (47.4%) | Reference | 186 (57.6%) | 65 (20.1%) | Reference |
| Family Income | |||||||||
| More than 20,000 INR (monthly) | 27 (8.36%) | 27 (8.36%) | 1.956 (1.084, 3.529) * | 32 (9.91%) | 22 (6.81%) | 2.070 (1.142, 3.752) * | 47 (14.6%) | 7 (2.17%) | 2.227 (0.961, 5.162) * |
| Less than 20,000 INR (monthly) | 91 (28.2%) | 178 (55.1%) | Reference | 111 (34.4%) | 158 (48.9%) | Reference | 202 (62.5%) | 67 (20.7%) | Reference |
| CKD Stage | |||||||||
| Stage III | 36 (11.1%) | 75 (23.2%) | 0.861 (0.471, 1.574) | 46 (14.2%) | 65 (20.1%) | 1.269 (0.703, 2.291) | 86 (26.6%) | 25 (7.74%) | 1.536 (0.803, 2.937) |
| Stage II | 53 (16.4%) | 78 (24.1%) | 1.218 (0.687, 2.160) | 68 (21.1%) | 63 (19.5%) | 1.935 (1.096, 3.419) * | 107 (33.1%) | 24 (7.43%) | 1.990 (1.042, 3.800) |
| Stage I | 29 (8.98%) | 52 (16.1%) | Reference | 29 (8.98%) | 52 (16.1%) | Reference | 56 (17.3%) | 25 (7.74%) | Reference |
| HTN Stage | |||||||||
| Stage I HTN | 24 (7.43%) | 52 (16.1%) | 0.659 (0.353, 1.231) | 31 (9.60%) | 45 (13.9%) | 0.908 (0.497, 1.659) | 46 (14.2%) | 30 (9.29%) | 0.307 (0.153, 0.614) ** |
| Stage II HTN | 23 (7.12%) | 33 (10.2%) | 0.996 (0.513, 1.931) | 34 (10.5%) | 22 (6.81%) | 2.037 (1.049, 3.958) ** | 44 (13.6%) | 12 (3.72%) | 0.733 (0.322, 1.671) |
| Prehypertension | 29 (8.98%) | 60 (18.6%) | 0.690 (0.381, 1.250) | 34 (10.5%) | 55 (17.0%) | 0.815 (0.456, 1.455) | 74 (22.9%) | 15 (4.64%) | 0.987 (0.461, 2.112) |
| Normal | 42 (13.0%) | 60 (18.6%) | Reference | 44 (13.6%) | 58 (18.0%) | Reference | 85 (26.3%) | 17 (5.26%) | Reference |
| BMI Categories | |||||||||
| Overweight | 39 (12.1%) | 81 (25.1%) | 0.770 (0.458, 1.296) | 54 (16.7%) | 66 (20.4%) | 1.152 (0.698, 1.900) | 98 (30.3%) | 22 (6.81%) | 1.840 (1.013, 3.343) |
| Obese | 29 (8.98%) | 44 (13.6%) | 1.055 (0.586, 1.897) | 35 (10.8%) | 38 (11.8%) | 1.296 (0.728, 2.308) | 59 (18.3%) | 14 (4.33%) | 1.741 (0.869, 3.486) |
| Normal | 50 (15.5%) | 80 (24.8%) | Reference | 54 (16.7%) | 76 (23.5%) | Reference | 92 (28.5%) | 38 (11.8%) | Reference |
| Co-morbidities | |||||||||
| Yes | 43 (13.3%) | 71 (22.0%) | 1.082 (0.675, 1.736) | 51 (15.8%) | 63 (19.5%) | 1.030 (0.650, 1.630) | 87 (26.9%) | 27 (8.36%) | 0.935 (0.545, 1.605) |
| No | 75 (23.2%) | 134 (41.5%) | Reference | 92 (28.5%) | 117 (36.2%) | Reference | 162 (50.2%) | 47 (14.6%) | Reference |
| Duration of Diabetes | |||||||||
| More than 10 years | 56 (17.3%) | 99 (30.7%) | 0.967 (0.615, 1.522) | 68 (21.1%) | 87 (26.9%) | 0.969 (0.625, 1.504) | 117 (36.2%) | 38 (11.8%) | 0.840 (0.500, 1.412) |
| Less than 10 years | 62 (19.2%) | 106 (32.8%) | Reference | 75 (23.2%) | 93 (28.8%) | Reference | 132 (40.9%) | 36 (11.1%) | Reference |
| Glycemic Control | |||||||||
| Poor (HbA1c ≥ 7) | 76 (23.5%) | 155 (48.0%) | 1.713 (1.046, 2.806) * | 95 (29.4%) | 136 (42.1%) | 1.562 (0.961, 2.539) | 174 (53.9%) | 57 (17.6%) | 1.445 (0.789, 2.648) |
| Good (HbA1c < 7) | 42 (13.0%) | 50 (15.5%) | Reference | 48 (14.9%) | 44 (13.6%) | Reference | 75 (23.2%) | 17 (5.26%) | Reference |
| Duration of HTN # | |||||||||
| More than 5 years | 22 (16.66%) | 29 (21.97%) | 1.16 (0.57, 2.36) | 28 (21.21%) | 23 (17.42%) | 1.13 (0.55, 2.28) | 39 (29.54%) | 12 (9.09%) | 1.28 (0.57, 2.88) |
| Less than 5 years | 32 (24.24%) | 49 (37.12%) | Reference | 42 (31.81%) | 39 (29.54%) | Reference | 58 (43.94%) | 23 (17.42%) | Reference |
C: Correct response; IC: Incorrect response; INR: Indian National Rupees; CKD: Chronic Kidney Disease; HTN: Hypertension; BMI: Body Mass Index. Bold data represents significant value. * Represents significant findings (p < 0.05); ** Represents significant findings (p <0.001); # Analysis based on patients belongs to stage I and stage II HTN class only.
Table 4.
Association between different domains of knowledge and demographic characteristics (continued).
Table 4.
Association between different domains of knowledge and demographic characteristics (continued).
| Variables | C_Q4 (Symptoms) | IC_Q4 (Symptoms) | Odds Ratio | C_Q5 (Progression) | IC_Q5 (Progression) | Odds Ratio | C_Q6 (Treatment) | IC_Q6 (Treatment) | Odds Ratio | C_Q7 (Resource) | IC_Q7 (Resource) | Odds Ratio |
|---|---|---|---|---|---|---|---|---|---|---|---|---|
| Age Groups | ||||||||||||
| ≥50 | 54 (16.7%) | 138 (42.7%) | 0.829 (0.511, 1.344) | 23 (7.12%) | 169 (52.3%) | 0.802 (0.418, 1.541) | 23 (7.12%) | 169 (52.3%) | 0.674 (0.358, 1.269) | 26 (8.05%) | 166 (51.4%) | 0.664 (0.364, 1.211) |
| <50 | 42 (13.0%) | 89 (27.6%) | Reference | 19 (5.88%) | 112 (34.7%) | Reference | 22 (6.81%) | 109 (33.7%) | Reference | 25 (7.74%) | 106 (32.8%) | Reference |
| Gender | ||||||||||||
| Female | 46 (14.2%) | 121 (37.5%) | 0.806 (0.500, 1.300) | 26 (8.05%) | 141 (43.7%) | 1.613 (0.829, 3.137) | 20 (6.19%) | 147 (45.5%) | 0.713 (0.378, 1.343) | 25 (7.74%) | 142 (44.0%) | 0.880 (0.484, 1.601) |
| Male | 50 (15.5%) | 106 (32.8%) | Reference | 16 (4.95%) | 140 (43.3%) | Reference | 25 (7.74%) | 131 (40.6%) | Reference | 26 (8.05%) | 130 (40.2%) | Reference |
| Family History of Diabetes | ||||||||||||
| Yes | 48 (14.9%) | 92 (28.5%) | 1.467 (0.908, 2.371) | 25 (7.74%) | 115 (35.6%) | 2.123 (1.097, 4.109) * | 21 (6.50%) | 119 (36.8%) | 1.169 (0.621, 2.200) | 22 (6.81%) | 118 (36.5%) | 0.990 (0.541, 1.811) |
| No | 48 (14.9%) | 135 (41.8%) | Reference | 17 (5.26%) | 166 (51.4%) | Reference | 24 (7.43%) | 159 (49.2%) | Reference | 29 (8.98%) | 154 (47.7%) | Reference |
| Substance Use | ||||||||||||
| Yes | 22 (6.81%) | 51 (15.8%) | 1.026 (0.581, 1.812) | 13 (4.02%) | 60 (18.6%) | 1.651 (0.809, 3.371) | 6 (1.86%) | 67 (20.7%) | 0.485 (0.197, 1.195) | 10 (3.10%) | 63 (19.5%) | 0.809 (0.384, 1.707) |
| No | 74 (22.9%) | 176 (54.5%) | Reference | 29 (8.98%) | 221 (68.4%) | Reference | 39 (12.1%) | 211 (65.3%) | Reference | 41 (12.7%) | 209 (64.7%) | Reference |
| Education | ||||||||||||
| Literate | 64 (19.8%) | 141 (43.7%) | 1.220 (0.738, 2.015) | 27 (8.36%) | 178 (55.1%) | 1.041 (0.530, 2.048) | 28 (8.67%) | 177 (54.8%) | 0.940 (0.490, 1.801) | 28 (8.67%) | 177 (54.8%) | 0.653 (0.357, 1.197) |
| Illiterate | 32 (9.91%) | 86 (26.6%) | Reference | 15 (4.64%) | 103 (31.9%) | Reference | 17 (5.26%) | 101 (31.3%) | Reference | 23 (7.12%) | 95 (29.4%) | Reference |
| Occupation | ||||||||||||
| Employed | 61 (18.9%) | 161 (49.8%) | 0.714 (0.431, 1.184) | 25 (7.74%) | 197 (61.0%) | 0.627 (0.322, 1.222) | 33 (10.2%) | 189 (58.5%) | 1.295 (0.638, 2.626) | 30 (9.29%) | 192 (59.4%) | 0.595 (0.322, 1.102) |
| Unemployed | 35 (10.8%) | 66 (20.4%) | Reference | 17 (5.26%) | 84 (26.0%) | Reference | 12 (3.72%) | 89 (27.6%) | Reference | 21 (6.50%) | 80 (24.8%) | Reference |
| Socioeconomic Status | ||||||||||||
| Middle | 31 (9.60%) | 41 (12.7%) | 2.164 (1.254, 3.733) ** | 15 (4.64%) | 57 (17.6%) | 2.183 (1.090, 4.374) * | 11 (3.41%) | 61 (18.9%) | 1.151 (0.551, 2.405) | 21 (6.50%) | 51 (15.8%) | 3.033 (1.607, 5.726) ** |
| Lower | 65 (20.1%) | 186 (57.6%) | Reference | 27 (8.36%) | 224 (69.3%) | Reference | 34 (10.5%) | 217 (67.2%) | Reference | 30 (9.29%) | 221 (68.4%) | Reference |
| Family Income | ||||||||||||
| More than 20,000 INR (monthly) | 23 (7.12%) | 31 (9.60%) | 1.992 (1.091, 3.640) * | 13 (4.02%) | 41 (12.7%) | 2.624 (1.260, 5.463) ** | 10 (3.10%) | 44 (13.6%) | 1.519( 0.701, 3.292) | 15 (4.64%) | 39 (12.1%) | 2.489 (1.247, 4.969) ** |
| Less than 20,000 INR (monthly) | 73 (22.6%) | 196 (60.7%) | Reference | 29 (8.98%) | 240 (74.3%) | Reference | 35 (10.8%) | 234 (72.4%) | Reference | 36 (11.1%) | 233 (72.1%) | Reference |
| CKD Stage | ||||||||||||
| Stage III | 27 (8.36%) | 84 (26.0%) | 0.811 (0.424, 1.551) | 8 (2.48%) | 103 (31.9%) | 0.292 (0.119, 0.717) * | 16 (4.95%) | 95 (29.4%) | 1.537 (0.624, 3.787) | 16 (4.95%) | 95 (29.4%) | 0.968 (0.431, 2.177) |
| Stage II | 46 (14.2%) | 85 (26.3%) | 1.365 (0.748, 2.491) | 17 (5.26%) | 114 (35.3%) | 0.561 (0.268, 1.175) | 21 (6.50%) | 110 (34.1%) | 1.742 (0.732, 4.143) | 23 (7.12%) | 108 (33.4%) | 1.225 (0.572, 2.620) |
| Stage I | 23 (7.12%) | 58 (18.0%) | Reference | 17 (5.26%) | 64 (19.8%) | Reference | 8 (2.48%) | 73 (22.6%) | Reference | 12 (3.72%) | 69 (21.4%) | Reference |
| HTN Stage | ||||||||||||
| Stage I HTN | 19 (5.88%) | 57 (17.6%) | 0.926 (0.469, 1.829) | 11 (3.41%) | 65 (20.1%) | 1.400 (0.572, 3.424) | 11 (3.41%) | 65 (20.1%) | 1.159 (0.488, 2.750) | 11 (3.41%) | 65 (20.1%) | 1.064 (0.454, 2.494) |
| Stage II HTN | 20 (6.19%) | 36 (11.1%) | 1.543 (0.765, 3.113) | 10 (3.10%) | 46 (14.2%) | 1.798 (0.712, 4.544) | 10 (3.10%) | 46 (14.2%) | 1.489 (0.607, 3.654) | 11 (3.41%) | 45 (13.9%) | 1.537 (0.645, 3.659) |
| Prehypertension | 30 (9.29%) | 59 (18.3%) | 1.412 (0.758, 2.630) | 10 (3.10%) | 79 (24.5%) | 1.047 (0.422, 2.596) | 11 (3.41%) | 78 (24.1%) | 0.965 (0.409, 2.278) | 15 (4.64%) | 74 (22.9%) | 1.274 (0.578, 2.811) |
| Normal | 27 (8.36%) | 75 (23.2%) | Reference | 11 (3.41%) | 91 (28.2%) | Reference | 13 (4.02%) | 89 (27.6%) | Reference | 14 (4.33%) | 88 (27.2%) | Reference |
| BMI Categories | ||||||||||||
| Overweight | 29 (8.98%) | 91 (28.2%) | 0.623 (0.358, 1.084) | 16 (4.95%) | 104 (32.2%) | 0.755( 0.376, 1.518) | 18 (5.57%) | 102 (31.6%) | 1.031 (0.513, 2.073) | 12 (3.72%) | 108 (33.4%) | 0.424 (0.204, 0.881) |
| Obese | 23 (7.12%) | 50 (15.5%) | 0.899 (0.487, 1.660) | 4 (1.24%) | 69 (21.4%) | 0.285 (0.094, 0.861) * | 8 (2.48%) | 65 (20.1%) | 0.719 (0.298, 1.735) | 12 (3.72%) | 61 (18.9%) | 0.750 (0.354, 1.589) |
| Normal | 44 (13.6%) | 86 (26.6%) | Reference | 22 (6.81%) | 108 (33.4%) | Reference | 19 (5.88%) | 111 (34.4%) | Reference | 27 (8.36%) | 103 (31.9%) | Reference |
| Co-morbidities | ||||||||||||
| Yes | 35 (10.8%) | 79 (24.5%) | 1.075 (0.654, 1.767) | 18 (5.57%) | 96 (29.7%) | 1.445 (0.748, 2.794) | 15 (4.64%) | 99 (30.7%) | 0.904 (0.464, 1.761) | 21 (6.50%) | 93 (28.8%) | 1.347 (0.731, 2.483) |
| No | 61 (18.9%) | 148 (45.8%) | Reference | 24 (7.43%) | 185 (57.3%) | Reference | 30 (9.29%) | 179 (55.4%) | Reference | 30 (9.29%) | 179 (55.4%) | Reference |
| Duration of Diabetes | ||||||||||||
| More than 10 years | 51 (15.8%) | 104 (32.2%) | 1.340 (0.831, 2.163) | 21 (6.50%) | 134 (41.5%) | 1.097 (0.574, 2.098) | 22 (6.81%) | 133 (41.2%) | 1.043 (0.555, 1.958) | 26 (8.05%) | 129 (39.9%) | 1.153 (0.634, 2.097) |
| Less than 10 years | 45 (13.9%) | 123 (38.1%) | Reference | 21 (6.50%) | 147 (45.5%) | Reference | 23 (7.12%) | 145 (44.9%) | Reference | 25 (7.74%) | 143 (44.3%) | Reference |
| Glycemic Control | ||||||||||||
| Poor (HbA1c ≥ 7) | 69 (21.4%) | 162 (50.2%) | 0.975 (0.574, 1.657) | 32 (9.91%) | 199 (61.6%) | 0.758 (0.356, 1.614) | 34 (10.5%) | 197 (61.0%) | 0.787 (0.380, 1.629) | 39 (12.1%) | 192 (59.4%) | 0.739 (0.368, 1.484) |
| Good (HbA1c < 7) | 27 (8.36%) | 65 (20.1%) | Reference | 10 (3.10%) | 82 (25.4%) | Reference | 11 (3.41%) | 81 (25.1%) | Reference | 12 (3.72%) | 80 (24.8%) | Reference |
| Duration of HTN # | ||||||||||||
| More than 5 years | 14 (10.60%) | 37 (27.81%) | 0.75 (0.35, 1.63) | 12 (9.09%) | 40 (30.30%) | 0.857 (0.379, 1.935) | 8 (6.06%) | 43 (32.57%) | 0.890 (0.344, 2.300) | 4 (3.03%) | 47 (65.60%) | 0.899 (0.249, 3.241) |
| Less than 5 years | 27 (20.45%) | 54 (40.90%) | Reference | 21 (15.90%) | 60 (45.45%) | Reference | 14 (10.60%) | 67 (50.75%) | Reference | 7 (5.30%) | 74 (56.06%) | Reference |
C: Correct response; IC: Incorrect response; INR: Indian National Rupees; CKD: Chronic Kidney Disease; HTN: Hypertension; BMI: Body Mass Index. Bold data represents significant value. * Represents significant findings (p < 0.05); ** Represents significant findings (p <0.001); # Analysis based on patients belongs to stage I and stage II HTN class only.
© 2019 by the authors. Licensee MDPI, Basel, Switzerland. This article is an open access article distributed under the terms and conditions of the Creative Commons Attribution (CC BY) license (http://creativecommons.org/licenses/by/4.0/).
Share and Cite
MDPI and ACS Style
Hussain, S.; Habib, A.; Najmi, A.K. Limited Knowledge of Chronic Kidney Disease among Type 2 Diabetes Mellitus Patients in India. Int. J. Environ. Res. Public Health 2019, 16, 1443. https://doi.org/10.3390/ijerph16081443
AMA Style
Hussain S, Habib A, Najmi AK. Limited Knowledge of Chronic Kidney Disease among Type 2 Diabetes Mellitus Patients in India. International Journal of Environmental Research and Public Health. 2019; 16(8):1443. https://doi.org/10.3390/ijerph16081443
Chicago/Turabian StyleHussain, Salman, Anwar Habib, and Abul Kalam Najmi. 2019. "Limited Knowledge of Chronic Kidney Disease among Type 2 Diabetes Mellitus Patients in India" International Journal of Environmental Research and Public Health 16, no. 8: 1443. https://doi.org/10.3390/ijerph16081443
Note that from the first issue of 2016, this journal uses article numbers instead of page numbers. See further details here.