Are There Changes in Inequalities in Injuries? A Review of Evidence in the WHO European Region


Abstract
:1. Introduction
2. Materials and Methods
2.1. Search Strategy
2.2. Inclusion and Exclusion Criteria
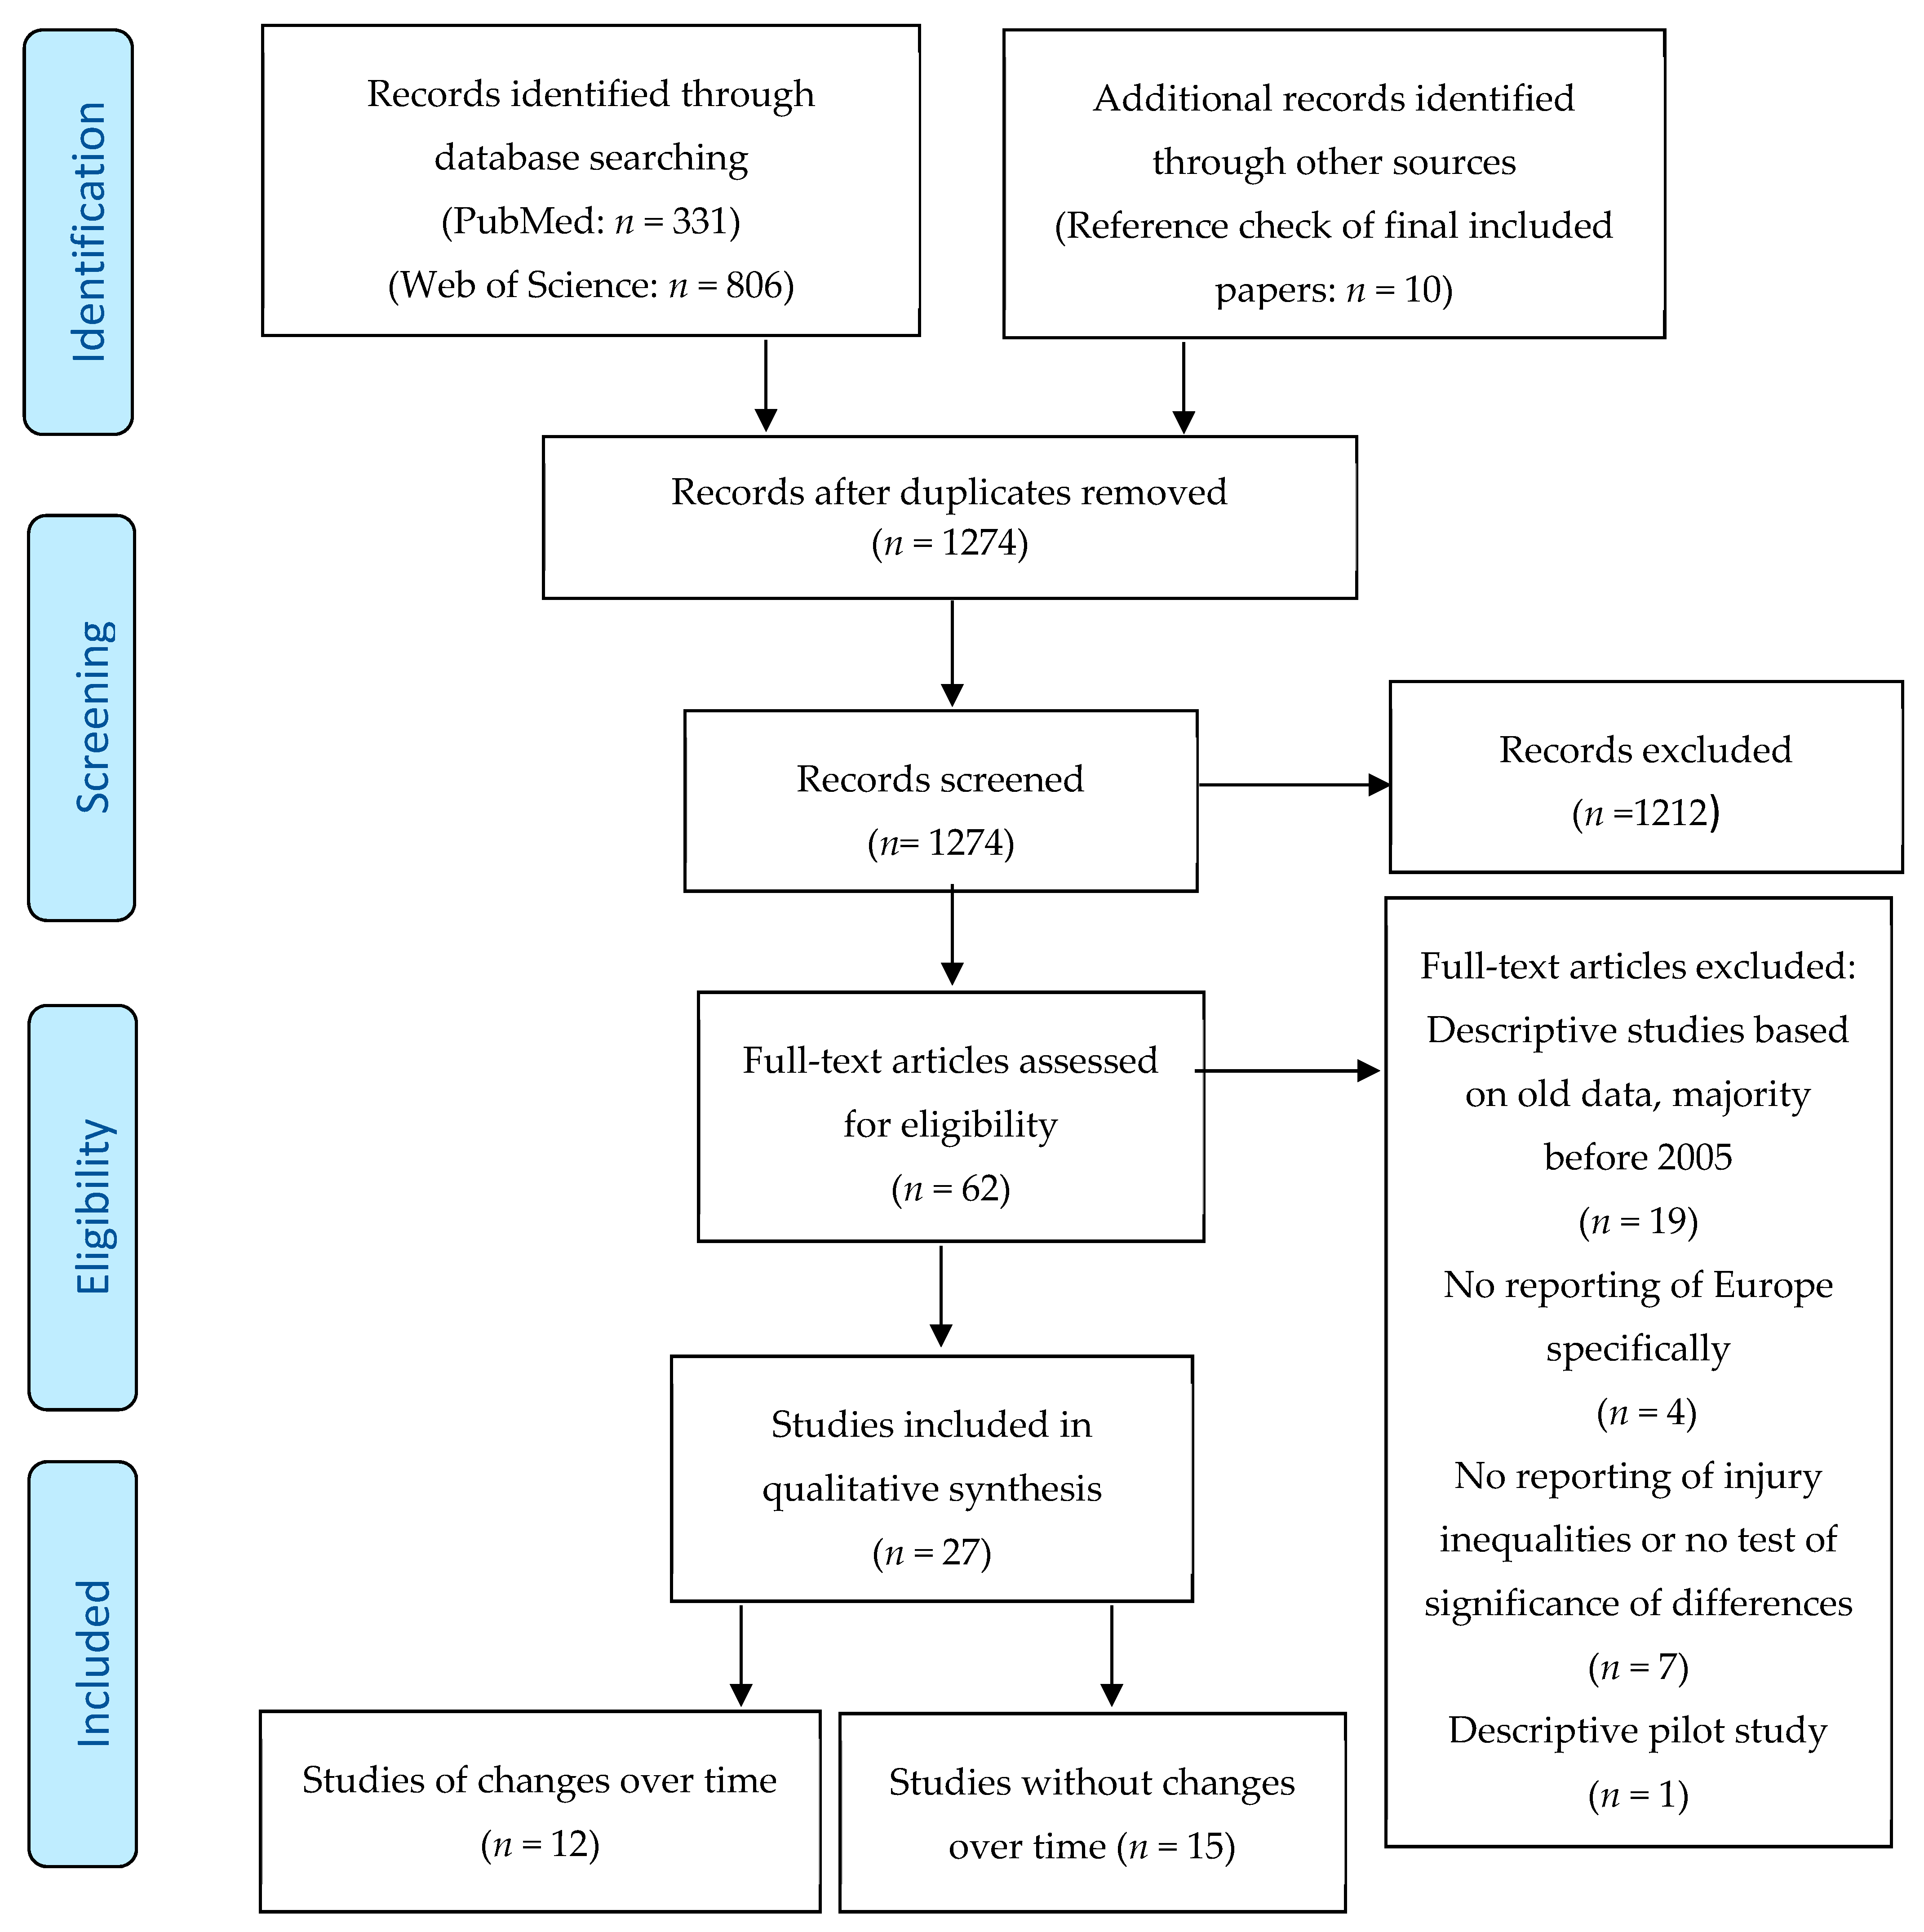
2.3. Literature Screening
2.4. Data Extraction and Synthesis
3. Results
3.1. Studies of Changes over Time
3.1.1. Cross-Country Studies over Time
3.1.2. Within-Country Studies over Time
3.2. Other Studies
3.2.1. Cross-Country Studies
3.2.2. Within-Country Studies
4. Discussion
4.1. Changes over Time in Inequalities in Injury
4.2. Studies in Inequality in Injuries Not Investigating Changes over Time
4.3. Physical Environment in Inequalities in Injuries
4.4. Strengths and Limitations
5. Conclusions
Author Contributions
Funding
Acknowledgments
Conflicts of Interest
References
- World Health Organization (WHO). Injuries and Violence: The Facts 2014; WHO: Geneva, Switzerland, 2014. [Google Scholar]
- World Health Organization (WHO). World Report on Child Injury Prevention; WHO: Geneva, Switzerland, 2008. [Google Scholar]
- World Health Organization (WHO). Global Status Report on Road Safety 2015; WHO: Geneva, Switzerland, 2015. [Google Scholar]
- World Health Organization (WHO). WHO Global Report on Falls Prevention in Older Age; WHO: Geneva, Switzerland, 2007. [Google Scholar]
- World Health Organization (WHO). Global Report on Drowning: Preventing a Leading Killer; WHO: Geneva, Switzerland, 2014. [Google Scholar]
- World Health Organization (WHO). Burn Prevention: Success Stories and Lessons Learned; WHO: Geneva, Switzerland, 2011. [Google Scholar]
- Haddon, W. The changing approach to the epidemiology, prevention, and amelioration of trauma: The transition to approaches etiologically rather than descriptively based. Inj. Prev. 1999, 5, 231–235. [Google Scholar] [CrossRef] [PubMed]
- Sethi, D.; Aldridge, E.; Rakovac, I.; Makhija, A. Worsening Inequalities in Child Injury Deaths in the WHO European Region. Int. J. Environ. Res Public Health 2017, 14, 1128. [Google Scholar] [CrossRef] [PubMed]
- Haagsma, J.A.; Graetz, N.; Bolliger, I.; Naghavi, M.; Higashi, H.; Mullany, E.C.; Abera, S.F.; Abraham, J.P.; Adofo, K.; Alsharif, U.; et al. The global burden of injury: Incidence, mortality, disability-adjusted life years and time trends from the Global Burden of Disease study 2013. Inj. Prev. 2016, 22, 3–18. [Google Scholar] [CrossRef] [PubMed]
- Donkin, A.; Goldblatt, P.; Allen, J.; Nathanson, V.; Marmot, M. Global action on the social determinants of health. BMJ Glob. Health 2017, 3, e000603. [Google Scholar] [CrossRef] [PubMed]
- Mock, C.N.; Smith, K.R.; Kobusingye, O.; Nugent, R.; Abdalla, S.; Ahuja, R.B.; Apramian, S.S.; Bachani, A.M.; Bellis, M.A.; Butchart, A.; et al. Injury Prevention and Environmental Health: Key Messages from Disease Control Priorities. In Injury Prevention and Environmental Health, 3rd ed.; Mock, C.N., Nugent, R., Kobusingye, O., Smith, K.R., Eds.; The International Bank for Reconstruction and Development and The World Bank: Washington, DC, USA, 2017; Chapter 1. [Google Scholar]
- Laflamme, L.; Hasselberg, M.; Burrows, S. Socioeconomic Differences in Injury Risks. A Review of Findings and a Discussion of Potential Countermeasures; World Health Organization (WHO): Copenhagen, Denmark, 2009. [Google Scholar]
- Ameratunga, S.; Ramke, J.; Jackson, N.; Tin Tin, S.; Gabbe, B. Disparities in Non-Fatal Health Outcomes in Pediatric General Trauma Studies. Int. J. Environ. Res. Public Health 2017, 15, 43. [Google Scholar] [CrossRef] [PubMed]
- Balan, B.; Lingam, L. Unintentional injuries among children in resource poor settings: Where do the fingers point? Arch. Dis. Child. 2012, 97, 35–38. [Google Scholar] [CrossRef] [PubMed]
- Birken, C.S.; Macarthur, C. Socioeconomic status and injury risk in children. Paediatr. Child Health 2004, 9, 323–325. [Google Scholar] [CrossRef] [Green Version]
- Dowswell, T.; Towner, E. Social deprivation and the prevention of unintentional injury in childhood: A systematic review. Health Educ. Res. 2002, 17, 221–237. [Google Scholar] [CrossRef]
- Evans, G.W. The environment of childhood poverty. Am. Psychol. 2004, 59, 77–92. [Google Scholar] [CrossRef]
- Möller, H.; Falster, K.; Ivers, R.; Jorm, L. Inequalities in unintentional injuries between indigenous and non-indigenous children: A systematic review. Inj. Prev. 2015, 21, e144-52. [Google Scholar] [CrossRef]
- Laflamme, L.; Diderichsen, L. Social differences in traffic-injury risks in childhood and youth—A literature review and an analytical frame for the unanswered questions. Inj. Prev. 2000, 6, 293–298. [Google Scholar] [CrossRef] [PubMed]
- Sengoelge, M.; Laflamme, L.; El-Khatib, Z. Ecological study of road traffic injuries in the eastern Mediterranean region: Country economic level, road user category and gender perspectives. BMC Public Health. 2018, 18, 236. [Google Scholar] [CrossRef] [PubMed]
- Khambalia, A.; Joshi, P.; Brussoni, M.; Raina, P.; Morrongiello, B.; Macarthur, C. Risk factors for unintentional injuries due to falls in children aged 0–6 years: A systematic review. Inj. Prev. 2006, 12, 378–381. [Google Scholar] [CrossRef] [PubMed]
- Bedri, H.; Romanowski, K.S.; Liao, J.; Al-Ramahi, G.; Heard, J.; Granchi, T.; Wibbenmeyer, L. A National Study of the Effect of Race, Socioeconomic Status, and Gender on Burn Outcomes. J. Burn Care Res. 2017, 38, 161–168. [Google Scholar] [CrossRef] [PubMed]
- Richards, H.; Kokocinska, M.; Lewis, D. A five year review of paediatric burns and social deprivation: Is there a link? Burns 2017, 43, 1183–1188. [Google Scholar] [CrossRef] [PubMed]
- Smolle, C.; Cambiaso-Daniel, J.; Forbes, A.A.; Wurzer, P.; Hundeshagen, G.; Branski, L.K.; Huss, F.; Kamolz, L.-P. Recent trends in burn epidemiology worldwide: A. systematic review. Burns 2017, 43, 249–257. [Google Scholar] [CrossRef] [PubMed]
- Shenassa, E.D.; Stubbendick, A.; Brown, M.J. Social disparities in housing and related pediatric injury: A multilevel study. Am. J. Public Health 2004, 94, 633–639. [Google Scholar] [CrossRef]
- Weitzman, M.; Baten, A.; Rosenthal, D.G.; Hoshino, R.; Tohn, E.; Jacobs, D.E. Housing and child health. Curr. Probl. Pediatr. Adolesc. Health Care 2013, 43, 187–224. [Google Scholar] [CrossRef]
- Mytton, J.A.; Towner, E.M.; Powell, J.; Pilkington, P.A.; Gray, S. Taking the long view: A systematic review reporting long-term perspectives on child unintentional injury. Inj. Prev. 2012, 18, 334–342. [Google Scholar] [CrossRef]
- Robertson, L.S. Injury Epidemiology, 2nd ed.; Oxford University Press: New York, NY, USA, 1998; p. 265. [Google Scholar]
- O’Neill, J.; Tabish, H.; Welch, V.; Petticrew, M.; Pottie, K.; Clarke, M.; Evans, T.; Pardo, J.P.; Waters, E.; White, H.; et al. Applying an equity lens to interventions: Using PROGRESS ensures consideration of socially stratifying factors to illuminate inequities in health. J. Clin. Epidemiol. 2014, 67, 56–64. [Google Scholar] [CrossRef]
- Shamseer, L.; Moher, D.; Clarke, M.; Ghersi, D.; Liberati, A.; Petticrew, M.; Shekelle, P.; Stewart, L.A.; PRISMA-P Group. Preferred reporting items for systematic review and meta-analysis protocols (PRISMA-P) 2015: Elaboration and explanation. BMJ 2015, 350, g7647. [Google Scholar] [CrossRef] [PubMed]
- Göpfert, A.; Sethi, D.; Rakovac, I.; Mitis, F. Growing inequalities in child injury deaths in Europe. Eur. J. Public Health 2015, 25, 660–662. [Google Scholar] [CrossRef] [PubMed] [Green Version]
- Pekkala, J.; Blomgren, J.; Pietiläinen, O.; Lahelma, E.; Rahkonen, O. Occupational class differences in diagnostic-specific sickness absence: A register-based study in the Finnish population, 2005–2014. BMC Public Health 2017, 17, 670. [Google Scholar] [CrossRef] [PubMed]
- Regidor, E.; Santos, J.M.; Ortega, P.; Calle, M.E.; Astasio, P.; Martínez, D. Decreasing income inequality and emergence of the association between income and premature mortality: Spain, 1970–2010. Health Place 2014, 27, 30–37. [Google Scholar] [CrossRef] [PubMed]
- Shackleton, N.; Hale, D.; Viner, R.M. Trends and socioeconomic disparities in preadolescent’s health in the UK: Evidence from two birth cohorts 32 years apart. J. Epidemiol. Community Health 2016, 70, 140–146. [Google Scholar] [CrossRef] [PubMed]
- Strand, B.H.; Steingrímsdóttir, Ó.A.; Grøholt, E.K.; Ariansen, I.; Graff-Iversen, S.; Næss, Ø. Trends in educational inequalities in cause specific mortality in Norway from 1960 to 2010: A turning point for educational inequalities in cause specific mortality of Norwegian men after the millennium? BMC Public Health 2014, 14, 1208. [Google Scholar] [CrossRef] [PubMed]
- Magid, A.; Leibovitch-Zur, S.; Baron-Epel, O. Increased inequality in mortality from road crashes among Arabs and Jews in Israel. Traffic Inj. Prev. 2015, 16, 42–47. [Google Scholar] [CrossRef]
- Olsen, J.R.; Mitchell, R.; Ogilvie, D.; M74 study team. Effect of a new motorway on social-spatial patterning of road traffic accidents: A retrospective longitudinal natural experimental study. PLoS ONE 2017, 12, e0184047. [Google Scholar] [CrossRef]
- Steinbach, R.; Grundy, C.; Edwards, P.; Wilkinson, P.; Green, J. The impact of 20 mph traffic speed zones on inequalities in road casualties in London. J. Epidemiol. Community Health 2011, 65, 921–926. [Google Scholar] [CrossRef]
- Steinbach, R.; Edwards, P.; Green, J. Controlling for exposure changes the relationship between ethnicity, deprivation and injury: An observational study of child pedestrian injury rates in London. Inj. Prev. 2014, 20, 159–166. [Google Scholar] [CrossRef]
- Orton, E.; Kendrick, D.; West, J.; Tata, L.J. Persistence of health inequalities in childhood injury in the UK: A population-based cohort study of children under 5. PLoS ONE 2014, 9, e111631. [Google Scholar] [CrossRef] [PubMed]
- Tyrrell, E.G.; Orton, E.; Tata, L.J. Changes in poisonings among adolescents in the UK between 1992 and 2012: A population based cohort study. Inj. Prev. 2016, 22, 400–406. [Google Scholar] [CrossRef] [PubMed]
- Gallo, V.; Mackenbach, J.P.; Ezzati, M.; Menvielle, G.; Kunst, A.E.; Rohrmann, S.; Kaaks, R.; Teucher, B.; Boeing, H.; Bergmann, M.M.; et al. Social inequalities and mortality in Europe—Results from a large multi-national cohort. PLoS ONE 2012, 7, e39013. [Google Scholar] [CrossRef] [PubMed]
- Gotsens, M.; Marí-Dell’Olmo, M.; Pérez, K.; Palència, L.; Martinez-Beneito, M.A.; Rodríguez-Sanz, M.; Burstrom, B.; Costa, G.; Deboosere, P.; Domínguez-Berjón, F.; et al. Socioeconomic inequalities in injury mortality in small areas of 15 European cities. Health Place 2013, 24, 165–172. [Google Scholar] [CrossRef] [PubMed] [Green Version]
- Mackenbach, J.P.; Kulhánová, I.; Bopp, M.; Deboosere, P.; Eikemo, T.A.; Hoffmann, R.; Kulik, M.C.; Leinsalu, M.; Martikainen, P.; Menvielle, G.; et al. Variations in the relation between education and cause-specific mortality in 19 European populations: A test of the “fundamental causes” theory of social inequalities in health. Soc. Sci. Med. 2015, 127, 51–62. [Google Scholar] [CrossRef] [PubMed]
- Sengoelge, M.; Elling, B.; Laflamme, L.; Hasselberg, M. Country-level economic disparity and child mortality related to housing and injuries: A study in 26 European countries. Inj. Prev. 2013, 19, 311–315. [Google Scholar] [CrossRef] [PubMed]
- Sengoelge, M.; Hasselberg, M.; Ormandy, D.; Laflamme, L. Housing, income inequality and child injury mortality in Europe: A cross-sectional study. Child Care Health Dev. 2014, 40, 283–291. [Google Scholar] [CrossRef] [PubMed]
- Bagher, A.; Andersson, L.; Wingren, C.J.; Ottosson, A.; Wangefjord, S.; Acosta, S. Socio-economic status and major trauma in a Scandinavian urban city: A population-based case-control study. Scand. J. Public Health 2016, 44, 217–223. [Google Scholar] [CrossRef] [PubMed]
- Corfield, A.R.; MacKay, D.F.; Pell, J.P. Association between trauma and socioeconomic deprivation: A registry-based, Scotland-wide retrospective cohort study of 9,238 patients. Scand. J. Trauma Resusc. Emerg. Med. 2016, 24, 90. [Google Scholar] [CrossRef] [PubMed]
- Falkstedt, D.; Sorjonen, K.; Hemmingsson, T.; Deary, I.J.; Melin, B. Psychosocial functioning and intelligence both partly explain socioeconomic inequalities in premature death. A population-based male cohort study. PLoS ONE 2013, 8, e82031. [Google Scholar] [CrossRef] [PubMed]
- Zoni, A.C.; Domínguez-Berjón, M.F.; Esteban-Vasallo, M.D.; Velázquez-Buendía, L.M.; Blaya-Nováková, V.; Regidor, E. Socioeconomic inequalities in injuries treated in primary care in Madrid, Spain. J. Public Health 2017, 39, 45–51. [Google Scholar] [CrossRef] [PubMed]
- Hughes, K.; McHale, P.; Wyke, S.; Lowey, H.; Bellis, M.A. Child injury: Using national emergency department monitoring systems to identify temporal and demographic risk factors. Inj. Prev. 2014, 20, 74–80. [Google Scholar] [CrossRef] [PubMed]
- Pirdavani, A.; Daniels, S.; van Vlierden, K.; Brijs, K.; Kochan, B. Socioeconomic and sociodemographic inequalities and their association with road traffic injuries. J. Transp. Health 2017, 4, 152–161. [Google Scholar] [CrossRef]
- Rok Simon, M.; Korošec, A.; Bilban, M. The influence of parental education and other socio-economic factors on child car seat use. Zdr. Varst. 2016, 56, 55–64. [Google Scholar] [CrossRef] [PubMed]
- Steinbach, R.; Green, J.; Kenward, M.G.; Edwards, P. Is ethnic density associated with risk of child pedestrian injury? A comparison of inter-census changes in ethnic populations and injury rates. Ethn. Health 2016, 21, 1–19. [Google Scholar] [CrossRef] [PubMed]
- Ahmad Kiadaliri, A.; Turkiewicz, A.; Englund, M. Educational inequalities in falls mortality among older adults: Population-based multiple cause of death data from Sweden. J. Epidemiol. Community Health 2018, 72, 68–70. [Google Scholar] [CrossRef] [PubMed]
- Baker, R.; Orton, E.; Tata, L.J.; Kendrick, D. Epidemiology of poisonings, fractures and burns among 0–24 year olds in England using linked health and mortality data. Eur. J. Public Health 2016, 26, 940–946. [Google Scholar] [CrossRef] [PubMed] [Green Version]
- Aldridge, E.; Sethi, D.; Yon, Y. Injuries: A Call for Public Health Action in Europe. An Update Using the 2015 Global Health Estimates; WHO Regional Office Europe: Copenhagen, Denmark, 2017. [Google Scholar]
- Royal College of Paediatrics and Child Health. State of Child Health; Royal College of Paediatrics and Child Health: London, UK, 2017. [Google Scholar]
- Bennett, J.E.; Pearson-Stuttard, J.; Kontis, V.; Capewell, S.; Wolfe, I.; Ezzati, M. Contributions of diseases and injuries to widening life expectancy inequalities in England from 2001 to 2016: A population-based analysis of vital registration data. Lancet Public Health 2018, 3, e586–e597. [Google Scholar] [CrossRef]
- GBD 2017 Disease and Injury Incidence and Prevalence Collaborators. Global, regional, and national incidence, prevalence, and years lived with disability for 354 diseases and injuries for 195 countries and territories, 1990–2017: A systematic analysis for the Global Burden of Disease Study 2017. Lancet 2018, 392, 1789–1858. [Google Scholar] [CrossRef]
- Zimmerman, E.; Woolf, S.H.; Haley, A. Understanding the Relationship between Education and Health: A Review of the Evidence and an Examination of Community Perspectives. In Population Health: Behavioral and Social Science Insights; Kaplan, R., Spittel, M., David, D., Eds.; AHRQ Publication No. 15-0002; Agency for Healthcare Research and Quality and Office of Behavioral and Social Sciences Research, National Institutes of Health: Rockville, MD, USA, 2015; Section V. Emerging Tools for Studying Population Health. [Google Scholar]
- Peek-Asa, C.; Zwerling, C. Role of environmental interventions in injury control and prevention. Epidemiol. Rev. 2003, 25, 77–89. [Google Scholar] [CrossRef]
- Laflamme, L.; Hasselberg, M.; Burrows, S. 20 Years of Research on Socioeconomic Inequality and Children’s-Unintentional Injuries Understanding the Cause-Specific Evidence at Hand. Int. J. Pediatr. 2010, 2010, 819687. [Google Scholar] [CrossRef] [PubMed]
- Laflamme, L.; Sethi, D.; Burrows, S.; Hasselberg, M.; Racioppi, F.; Apfel, F. Addressing the Socioeconomic Safety Divide: A. Policy Briefing; WHO European Office: Copenhagen, Denmark, 2009. [Google Scholar]
- World Health Organization Regional Office for Europe. Environment and Health Risks: A Review of the Influence and Effects of Social Inequalities; WHO: Copenhagen, Denmark, 2010. [Google Scholar]
- Smithson, J.; Garside, R.; Pearson, M. Barriers to, and facilitators of, the prevention of unintentional injury in children in the home: A systematic review and synthesis of qualitative research. Inj. Prev. 2011, 17, 119–126. [Google Scholar] [CrossRef] [PubMed]
- Atlantic Collaborative on Injury Prevention-ACIP. The Social Determinants of Injury. ACIP, 2008. Available online: www.parachutecanada.org/downloads/research/reports/ACIP_Report_SDOI.pdf (accessed on 6 October 2018).
- Bambra, C.; Gibson, M.; Sowden, A.; Wright, K.; Whitehead, M.; Petticrew, M. Tackling the wider social determinants of health and health inequalities: Evidence from systematic reviews. J. Epidemiol. Community Health 2010, 64, 284–291. [Google Scholar] [CrossRef] [PubMed]
- Watkins, D.A.; Dabestani, N.; Mock, C.N.; Cullen, M.R.; Smith, K.R.; Nugent, R. Trends in morbidity and mortality attributable to injuries and selected environmental hazards. In Injury Prevention and Environmental Health, 3rd ed.; Mock, C.N., Nugent, R., Kobusingye, O., Smith, K.R., Eds.; The International Bank for Reconstruction and Development and The World Bank: Washington, DC, USA, 2017; Chapter 2. [Google Scholar]
- Hong, Q.N.; Fàbregues, S.; Bartlett, G.; Boardman, F.; Cargo, M.; Dagenais, P.; Gagnon, M.-P.; Griffiths, F.; Nicolau, B.; O’Cathain, A.; et al. The Mixed Methods Appraisal Tool (MMAT) version 2018 for information professionals and researchers. Educ. Inf. 2018. [Google Scholar] [CrossRef]


| (“sociological factors”[MeSH Terms] OR disadvantaged[All Fields] OR disadvantage[All Fields] OR deprived[All Fields] OR social[All Fields] OR socio*[All Fields] OR sociological[All Fields] OR “vulnerable populations”[MeSH Terms] OR vulnerable[All Fields] OR vulnerability[ALL Fields] OR “psychosocial deprivation”[MeSH Terms] OR psychosocial[All Fields] OR psycho-social[All Fields] OR “socioeconomic factors”[MeSH Terms] OR socioeconomic[ALL Fields] OR socioeconomic[ALL Fields] OR deprivation[All Fields] OR sociodemographic[All Fields] OR socio-demographic[All Fields]) |
| AND |
| (“injuries”[MeSH Terms] OR “injury”[MeSH Terms] “accidents”[MeSH Terms] OR “injuries”[Title/Abstract] OR “injury”[Title/Abstract] OR “accidents”[Title/Abstract] OR “falls”[Title/Abstract] OR “poisoning”[Title/Abstract]) OR “drowning”[Title/Abstract] |
| AND |
| (inequality[Title/Abstract] OR inequity[Title/Abstract] OR inequities[Title/Abstract] OR inequalities[Title/Abstract] OR unequal[Title/Abstract] OR “environmental justice”[Title/Abstract] OR “environmental injustice”[Title/Abstract]) |
| AND |
| (“2010/01/01”[Date-Publication]: “2018/11/31”[Date-Publication]) |
| Author/Year | Study Design/Reference Period | Setting/Population | Age Group, Sex | Social Measure(s) | Measure of Association | Injury Outcome | Results |
|---|---|---|---|---|---|---|---|
| Cross-country | |||||||
| Göpfert et al., 2015 [31] | Ecological, 2000 vs. 2011 | WHO European Region, 53 countries | Children 1–14 years | Gross national income | Mortality rate ratios between HIC and LMIC | All injuries split by cause (6 categories of unintentional injuries, 3 categories of intentional injuries) | All injuries: Relative inequalities widened between LMIC and HIC from 2000 to 2011 and mortality rate ratio between the two income groups increased by 31% from 4.31 in 2000 to 5.64 in 2011 (p < 0.001); variation by injury cause. Unintentional injuries: Inequalities widened between two income groups; mortality rate ratio increased from 4.36 to 6.04 (p < 0.001) despite decreases in number of deaths and mortality rates; rate ratio increased 94% for road traffic injuries (1.96 to 3.8, p < 0.001) |
| Sethi et al., 2017 [8] | Ecological, 2000 vs. 2015 | WHO European Region, 53 countries | Children 1–14 years | Gross national income | Mortality rate ratios between HIC and LMIC | All injuries split by cause (6 categories of unintentional injuries, 3 categories of intentional injuries) | All injuries: Mortality rates persistently higher in LMIC compared to HIC between 2000 and 2015 and mortality declines greater in HIC than in LMIC; increased rate ratio between LMIC and HIC from 4.75 (CI 4.62–4.89) in year 2000 to 6.21 (CI 5.95–6.49) in year 2015 (31% increase, p < 0.001, ratio 1.31) Unintentional injuries: Rate ratio increased by 41% (p < 0.001) due to faster decline in HIC mortality from road traffic injuries (130% higher, p < 0.001) |
| Within countries | |||||||
| All injuries: | |||||||
| Pekkala et al., 2017 [32] | Cohort, 2005–2014 | Finland | Adults 25–64 years, stratified by sex | Occupation, 3 classes | Slope Index of Inequality (SII) and Relative Index of Inequality (RII) | Long-term sickness absence due to all injuries | No significant change in sickness absence due to injuries for absolute differences but relative differences narrowed over time in men (p < 0.0001) due to a strong decline in prevalence among manual workers |
| Regidor et al., 2014 [33] | Ecological, 1970–2010 | Spain, province level | All ages | Area of residence, provincial income | Absolute and relative differences (ratios) | All injury mortality | No association between absolute and relative quintiles of provincial income and premature injury mortality until 2010 (ratio of poorest province versus richest province 1.24, p < 0.05) |
| Shackleton et al., 2016 [34] | Cohort, 1980 vs. 2012 | United Kingdom | Children 9–13 years | Household income, 3 levels | Odds ratio per year; Interaction income group and cohort | 2 or more injuries requiring medical attention | No significant change 1980 (OR 1.09, CI: 0.95–1.25) vs. 2012 (OR 1.23, CI: 1.02–1.47) in odds of being injured when comparing lowest and highest income group; change over time (income × cohort), p = 0.18 |
| Strand et al., 2014 [35] | Cohort, 1960–2010 | Norway | Adults 45–74 years, stratified by sex | Education, 3 levels | Slope Index of Inequality (SII) and Relative Index of Inequality (RII) | All injury mortality | Injury mortality rates consistently higher in both male and female adults with basic versus higher education, persisting over time (SII 61 in men, 20 in women in 2010) |
| Road traffic injuries: | |||||||
| Magid et al., 2015 [36] | Time series, 2003–2011 | Israel * | All ages | Ethnicity: Arab and Jew | Injury and mortality rate ratios (RR) | All road traffic injuries | Mortality—reduction over time in both groups but at greater pace among Jews; Arabs consistently and increasingly at higher risk; RR 8.81 for 0–4 years, RR 3.08, 60–64 years Morbidity—reduction over time in both groups at a similar pace; Arabs consistently at higher risk |
| Olsen et al., 2017 [37] | Observational, 2008–2014 | Glasgow, Scotland | All ages | Area level (Scottish Index of Multiple Deprivation), 5 quintiles | Annual count of clustered injuries (fatal, serious, slight) | All road traffic injuries | Majority of clustered injuries occurred in the three most deprived areas (annual proportion 30.6 in most deprived versus 1.0 in the least deprived for most recent year 2014); new motorway had no impact on the socioeconomic patterning |
| Steinbach et al., 2011 [38] | Observational, 1987–2006 | London, England, 33 boroughs | All ages | Area level (Index of Multiple Deprivation), 5 quintiles | Trend across quintiles in (1) average annual percentage decline and (2) percentage reduction after 20 mph zones | All road traffic injuries and casualties; Killed and severely injured (KSI); Pedestrian casualties | All casualties: Graded decline over time from 1.2 in most deprived to 2.5 in least (p < 0.0001); no significant difference in % reduction after 20 mph zones (p = 0.62) Pedestrian/all casualties: Graded decline over time from 3.2 in most deprived to 4.0 in least (p < 0.015); no significant difference in % reduction after 20 mph zones (p = 0.60) KSI: No sig difference across quintiles either in decline over time or in % reduction after 20 mph zones |
| Steinbach et al., 2014 [39] | Ecological, 2001 versus 2011 | London, England, 33 boroughs | Children 5–9 and 10–14 years | Area level deprivation (Index of Multiple Deprivation), 10 deciles; area ethnic population density (3 categories); child ethnicity, 3 categories | Incidence of injury rate ratios (IRR) accounting for characteristics of the road environment (density of roads and junctions, speed, traffic volume) | Pedestrian injuries | Significantly reduced (p < 0.001) risk of child pedestrian injuries by more than half in all three ethnic groups over time: ‘White’ children IRR 0.488; CI: 0.45–0.53 ‘Asian’ children IRR 0.420; CI: 0.37–0.48 ‘Black’ children IRR 0.489; CI: 0.45–0.53 |
| Other injuries: | |||||||
| Orton et al., 2014 [40] | Cohort, Four 5-year periods from 1990–2009 | United Kingdom | Children 0–4 years | Area level deprivation (Townsend Index), 5 quintiles | Injury incidence ratios (IRRs) and attributable risk fraction | Injury treated by a general practitioner for burns and poisonings | Poisonings and burns significantly decreased over time (IRR test for trend p < 0.001) for all quintiles but consistently higher incidence with increasing deprivation, even when adjusting for sex, age and area deprivation; 28% of poisonings and 30% of burns attributable to deprivation |
| Tyrrell et al., 2016 [41] | Cohort, 1992–2012 | United Kingdom | Children 10–17 years | Area level deprivation (Townsend Index), 5 quintiles | Adjusted incidence of injury rate ratios (aIRR) | General practice visits for poisonings | Significant positive association between poisoning incidence and deprivation which remained consistent over time; (aIRR 2.83, CI: 2.34–3.40 in 1992–1996 and 2.63, CI: 2.41–2.88 in 2007–2012) |
| Author/Year/Reference | Study Design/Reference Year for Injury Outcome Data | Setting/Population | Age Group/Sex | Social Measure(s) | Measure of Association | Injury Outcome | Results |
|---|---|---|---|---|---|---|---|
| Cross-country | |||||||
| Gallo et al., 2012 [42] | Cohort, 2002–2006 | 9 European countries, cities/national/regional | Adults 40–65 years | Education, 4 levels | Relative Index of Inequality (RII) | Mortality—All injuries | Men: Injury mortality significantly lower for those with highest education than lowest education (IIR = 0.56, CI: 0.35–0.90 crude); not significantly affected by adjustment for one or multiple risk factors (smoking status, alcohol consumption, leisure physical activity, fruit and vegetable consumption, body mass index (IRR = 0.61, CI: 0.38–0.98 adjusted) Women: No association between education level and injury mortality (IRR = 1.28, CI: 0.67–2.45) and unchanged when adjusting for one or multiple risk factors (IRR = 1.19, CI: 0.61–2.30) |
| Gotsens et al., 2013 [43] | Ecological, 2000–2009 | 15 European countries, cities and regions | All ages in five-year groups, stratified by sex | Index of socioeconomic deprivation based on 5 measures, 3 quintiles | Relative risk | Mortality—All injuries | Men: Positive association in majority of northern and western cities; no association in majority of eastern European cities; highest differences in Stockholm (RR = 1.27, CI: 1.22–1.31) Women: Positive association in 7 cities; no association in southern cities and no majority association in central eastern cities; highest differences in Stockholm (RR = 1.17, CI: 1.12–1.23) |
| Mortality—Road traffic injuries | Men: Significant positive association in six cities; highest differences in Stockholm (RR = 1.18, CI: 1.07–1.29) Women: No association in cities studied | ||||||
| Mortality—Falls | Men: Positive association in 4 cities; highest differences in Lisbon, Southern Europe (RR = 1.19, CI: 1.11–1.28) Women: Positive association only in Rotterdam, Western Europe (RR = 1.09, CI: 1.03–1.14) | ||||||
| Mackenbach et al., 2014 [44] | Mixed cross-sectional and longitudinal, varying from 1998–2007, country-specific | 16 European countries, national/regional/city | Adults 30–79 years, stratified by sex | Education, 3 levels and results ‘low’ vs. ‘high’ | Relative risk (RR) at 95%, 99% and median confidence intervals | Mortality—Road traffic, all users Mortality—Falls | Higher mortality risk among the ‘low’ vs. ‘high’ educated, more so for men (median RR 2.06) than for women (median RR 1.26) Higher mortality risk among the ‘low’ vs. ‘high’ educated, similar for both sexes (median RR 1.84 men, median RR 1.55 women) |
| Sengoelge et al., 2013 [45] | Ecological, 2006 | 26 European countries | Children 1–14 years | -Economic level, 2 measures -Living conditions, 2 indexes (housing strain, neighborhood strain) | Standard mortality ratios and correlations for association measures | Mortality—All injuries | Economic level: Significant correlation between income inequality and mortality (r = 2.05, CI: 1.07–3.03) and between GDP and mortality (r = −6.55, CI: −9.31–−3.80) Living conditions: Significant correlation between housing strain and mortality (r = 5.94, CI: 1.58–10.30); no correlation between neighborhood strain and mortality (r = 5.67, CI: −2.32–13.67) Economic level + living conditions: Income inequality and housing strain (r = 1.77, CI: 0.51–3.04) and GDP and housing strain (r = −6.02, CI: −9.61–−2.42) partially modified the correlation with mortality |
| Mortality—Road traffic, all users | Economic level: Significant correlation between income inequality and mortality (r = 0.61, CI: 0.27–0.95) and between GDP and mortality (r = −2.50; CI: −3.23–−1.77) Living conditions: Significant correlation between housing strain and mortality (r = 2.31; CI: 0.98–3.64) Economic level + living conditions: No significant modification in correlation between income inequality + housing strain and mortality (r = 0.39; CI: −0.03–0.81); sign. partial modification GDP+ housing strain and mortality (r = −2.25; CI: −3.20–−1.31) | ||||||
| Sengoelge et al., 2014 [46] | Ecological, 2006 | 26 European countries | Children 1–14 years in 3 age categories (1–4, 5–9, 10–14) | -Income inequality (80:20 ratio) -2 indexes of living conditions: housing and neighbourhood strain | Standard mortality ratios and correlations for association measures | Mortality—All injuries | Significant correlation between income inequality and mortality (r = 0.70, p ≤ 0.001) and housing strain and mortality (r = 0.46, p = 0.017) but not significantly between neighbourhood strain and mortality (r = 0.24, p = 0.239); very small age-specific differences |
| Within countries | |||||||
| All injuries: | |||||||
| Bagher et al., 2016 [47] | Case-control, 2011–2013 | Malmö, Sweden, 10 districts | 3 age groups (all ages, 25+ years, 18+ years) | Five measures: -education, 3 levels -income, 3 levels and capital income -recipient of household social assistance | Odds ratios (OR) | Hospitalisation for major trauma (New Injury Severity Score > 15 or death at trauma scene sent for autopsy) | Increased odds of major trauma in relation to no income in 18+ years (OR = 1.6, CI: 1.0–2.4) and social assistance in all ages (OR = 2.3, CI: 1.3–4.1) No increased odds of major trauma in relation to low vs. medium/high education (OR = 1.3, CI: 0.8–2.2) |
| Corfield et al., 2016 [48] | Cohort, 2011–2012 | Scotland | Adults 16+ years in 8 age categories, stratified by sex | Area level deprivation (Scottish Index of Multiple Deprivation), 10 deciles | Incidence of injury rate ratios (IRRs) and odds ratios (OR) | In-hospital case fatality and emergency department attendances for trauma | In-hospital injury case fatality: odds not associated with socioeconomic deprivation when adjusted for age and sex Emergency department attendances for injuries: increased with increasing deprivation with patients in most deprived decile having a 2.5-fold higher incidence of trauma vs. patients in least deprived decile (IRR = 0.43, CI: 0.32–0.58 least deprived vs. IRR = 189.2, CI: 180.6–197.8 most deprived) |
| Falkstedt et al., 2013 [49] | Cohort, 1991–2008 | Sweden | Adults 40–57 years, males only | Three measures: -Education, 5 levels -Occupation, 5 classes -Income, 5 quintiles | Relative index of inequality (RII) | Mortality | Lower scores of intelligence and lower psychological functioning associated with higher injury mortality Socioeconomic inequalities in injury mortality by education, occupational class and income attenuated with 46% (CI: 28–65%), 52% (CI: 35–68%) and 38% (CI: 24–50%) respectively after adjusting for both individual psychosocial functioning and intelligence |
| Zoni et al., 2017 [50] | Cross-sectional, 2012 | Madrid, Spain | All ages in 4 age groups (<15, 15–44, 45–74, >75), stratified by sex | Area level deprivation, 5 quintiles | Incidence of injury rate ratios (IRR) | Mortality | Statistically significant higher injury mortality incidence with increasing deprivation in all age groups; largest differences for women 15–44 (IRR = 1.52, CI: 1.49–1.55) and men aged <15 (IRR = 1.49, CI: 1.45–1.52) |
| Road traffic injuries: | |||||||
| Hughes et al., 2014 [51] | Ecological, 2010–2011 | England | Children 0–14 years | Area level deprivation (Index of Multiple Deprivation), 5 quintiles | Adjusted odds ratios (AOR) | Emergency department attendances for road traffic injuries | Approximately 3-fold higher odds of emergency department attendances in those from most deprived vs. least deprived (AOR = 2.77, p < 0.001) and relationship similar after adjusting for age and sex |
| Pirdavani et al., 2017 [52] | Ecological, 2010–2012 | Flanders, Belgium | Adults, stratified by sex | Income (average household aggregated to area), 2 levels | Parameter estimates with standard error, z-value | Mortality and injury casualties, 3 types | Negative association between income level and casualties with significance varying based on road user type and sex: significant predictor of male car driver injury crashes but not for female car drivers; significant predictor of both male and female car passenger injury crashes; not significant predictor of male or female pedestrian and cyclist injury crashes |
| Rok-Simon et al., 2017 [53] | Cross-sectional survey, 2015 | Slovenia | Adults, stratified by sex | 3 measures: - Parental education, 4 levels - Family material welfare, 3 levels - SES of area of residence (income tax base per capita at municipality), 3 levels | Odd ratios (OR) | Non-use of child car seat | Measures associated with higher odds of non-use of child car seat: -parental education for both men and women when comparing vocational/less to university (OR = 4.08, CI: 2.18–7.62 mother and OR = 2.60, CI: 1.40–4.83 father) -SES of area of residence area, poor (OR = 1.72, CI: 1.10–2.71) or medium (OR = 2.37, CI: 1.47–3.82) vs. good Measures not associated: family material welfare |
| Steinbach et al., 2014 [54] | Ecological, 2000–2009 | London, England, 33 boroughs | Children 5–9 and 10–14 years | 2 measures: -Area level deprivation (Index of Multiple Deprivation), 10 quintiles -Ethnicity, 3 categories | Incidence of injury rate ratios (IRR) accounting for exposure | Pedestrian injuries (casualties and collisions) | Increase in injuries with increasing deciles of deprivation for ‘Whites’ and ‘Asians’ after adjusting for the road environment, but no difference in rates for ‘Black’ children at all hours Morning commute: controlling for the road environment substantially reduced rate ratios for ‘White’, ‘Asian’ children and tendency for decreased rates with decreasing levels of deprivation for ‘Black’ children |
| Falls: | |||||||
| Ahmad Kiadaliri et al., 2018 [55] | Cohort, 1998–2014 | Skåne region, Sweden | Adults 50–75 years, stratified by sex | Education, 3 levels | Slope and relative indices of inequality (SII/RII), | Mortality from falls | Both SII and RII reveal statistically significant educational inequalities in falls mortality in men in favour of well educated (SII 15.5, RII 2.19); 34% falls deaths in men attributable to lower education, but not in women |
| Burns and poisonings: | |||||||
| Baker et al., 2016 [56] | Cohort, 1998–2011 | England | Children 0–24 years in 5 age categories | Area level deprivation (Index of Multiple Deprivation), 5 quintiles | Adjusted incidence rate ratios (aIRR) | Mortality and hospitalisations from poisonings and burns | Positive association between deprivation and poisoning (aIRR = 2.12, CI: 1.68–2.69) and deprivation and burns (aIRR = 1.53, CI: 1.40–1.68) incidence after adjusting for age and sex; steepest socioeconomic gradient found in poisonings among ages 20–24 (aIRR = 2.63, CI: 2.24–3.09) |
| Hughes et al., 2014 [51] | Ecological, 2010–2011 | England | Children 0–14 years | Area level deprivation, Index of Multiple Deprivation, 5 quintiles | Adjusted odds ratios (AOR) | Emergency department attendances for poisonings and burns | Higher odds of emergency department attendances for children from most deprived areas compared to least deprived areas for poisonings (AOR 2.84) and burns (AOR 2.14) p < 0.001 after adjusting for age and sex |
| Zoni et al., 2017 [50] | Cross-sectional, 2012 | Madrid, Spain | All ages in four age groups (<15, 15–44, 45–74, >75), stratified by sex | Area level deprivation, 5 quintiles | Incidence of injury rate ratios (IRR) | Primary care consultations for poisonings and burns | Poisonings: IRR higher for all ages in the lowest vs. highest SES with largest differences in girls less than 15 years (IRR = 2.08, CI: 1.48–2.94) and in men 45–74 (IRR = 1.80, CI: 1.34–2.41) Burns: IRR higher for all ages in the lowest vs. highest SES with largest differences for girls less than 15 years (IRR = 1.89, CI: 1.65–2.18) and men 15–44 (IRR = 1.73, CI: 1.56–1.92) |
© 2019 by the authors. Licensee MDPI, Basel, Switzerland. This article is an open access article distributed under the terms and conditions of the Creative Commons Attribution (CC BY) license (http://creativecommons.org/licenses/by/4.0/).
Share and Cite
Sengoelge, M.; Leithaus, M.; Braubach, M.; Laflamme, L. Are There Changes in Inequalities in Injuries? A Review of Evidence in the WHO European Region. Int. J. Environ. Res. Public Health 2019, 16, 653. https://doi.org/10.3390/ijerph16040653
Sengoelge M, Leithaus M, Braubach M, Laflamme L. Are There Changes in Inequalities in Injuries? A Review of Evidence in the WHO European Region. International Journal of Environmental Research and Public Health. 2019; 16(4):653. https://doi.org/10.3390/ijerph16040653
Chicago/Turabian StyleSengoelge, Mathilde, Merel Leithaus, Matthias Braubach, and Lucie Laflamme. 2019. "Are There Changes in Inequalities in Injuries? A Review of Evidence in the WHO European Region" International Journal of Environmental Research and Public Health 16, no. 4: 653. https://doi.org/10.3390/ijerph16040653