Active (Opt-In) Consent Underestimates Mean BMI-z and the Prevalence of Overweight and Obesity Compared to Passive (Opt-Out) Consent. Evidence from the Healthy Together Victoria and Childhood Obesity Study

 , , ,
, , ,
Abstract
:1. Introduction
2. Methods
2.1. Setting and Study Design
2.2. School Sampling and Participant Recruitment
2.3. Measures
2.4. Data Analysis
3. Results
4. Discussion
4.1. Strengths and Weaknesses of the Study
4.2. Implications for Policy and Practice
5. Conclusions
Acknowledgments
Disclaimer
Author Contributions
Conflicts of Interest
References
- Roberto, C.A.; Swinburn, B.; Hawkes, C.; Huang, T.T.; Costa, S.A.; Ashe, M.; Zwicker, L.; Cawley, J.H.; Brownell, K.D. Patchy progress on obesity prevention: Emerging examples, entrenched barriers, and new thinking. Lancet 2015, 385, 2400–2409. [Google Scholar] [CrossRef]
- Ng, M.; Fleming, T.; Robinson, M.; Thomson, B.; Graetz, N.; Margono, C.; Mullany, E.C.; Biryukov, S.; Abbafati, C.; Abera, S.F.; et al. Global, regional, and national prevalence of overweight and obesity in children and adults during 1980–2013: A systematic analysis for the Global Burden of Disease Study 2013. Lancet 2014, 384, 766–781. [Google Scholar] [CrossRef]
- Australian Bureau of Statistics. 4364.0.55.001—National Health Survey: First Results, 2014–15. Canberra, Australian Capital Teritory: Commonwealth of Australia; Australian Bureau of Statistics: Canberra, Australia, 2016.
- Han, J.C.; Lawlor, D.A.; Kimm, S. Childhood obesity. Lancet 2010, 375, 1737–1748. [Google Scholar] [CrossRef]
- Lakshman, R.; Elks, C.E.; Ong, K.K. Childhood obesity. Circulation 2012, 126, 1770–1779. [Google Scholar] [CrossRef] [PubMed]
- Stubbs, J.M.; Achat, H.M. Individual rights over public good? The future of anthropometric monitoring of school children in the fight against obesity. Med. J. Aust. 2009, 190, 140–142. [Google Scholar] [PubMed]
- Lacy, K.E.; Nichols, M.S.; de Silva, A.M.; Allender, S.E.; Swinburn, B.A.; Leslie, E.R.; Jones, L.V.; Kremer, P.J. Critical design features for establishing a childhood obesity monitoring program in Australia. Aust. J. Prim. Health 2015, 21, 369–372. [Google Scholar] [CrossRef] [PubMed]
- Phillips, A.W.; Reddy, S.; Durning, S.J. Improving response rates and evaluating nonresponse bias in surveys: AMEE Guide No. 102. Med. Teach. 2016, 38, 217–228. [Google Scholar] [CrossRef] [PubMed]
- Tigges, B.B. Parental consent and adolescent risk behavior research. J. Nurs. Scholarsh. 2003, 35, 283–289. [Google Scholar] [CrossRef] [PubMed]
- Health & Social Care Information Centre. National Child Measurment Programme: England, 2014/15 School Year; Contract No.: 27th October; Health & Social Care Information Centre: Leeds, UK, 2015.
- Booth, M.L.; Okely, A.D.; Denney-Wilson, E. Validation and application of a novel method of measuring non-response bias in school-based surveys of paediatric overweight and obesity. Int. J. Pediatr. Obes. 2011, 6, e87–e93. [Google Scholar] [CrossRef] [PubMed]
- Crosbie, A.; Eichner, J.; Moore, W. Body mass index screening and volunteer bias. Ann. Epidemiol. 2008, 18, 602–604. [Google Scholar] [CrossRef] [PubMed]
- Strugnell, C.; Millar, L.; Churchill, A.; Jacka, F.; Bell, C.; Malakellis, M.; Swinburn, B.; Allender, S. Healthy together Victoria and childhood obesity-a methodology for measuring changes in childhood obesity in response to a community-based, whole of system cluster randomized control trial. Arch. Public Health 2016, 74, 16. [Google Scholar] [CrossRef] [PubMed]
- Australian Bureau of Statistics. Census of Population and Housing: Socio-Economic Indexes for Areas (SEIFA), Australia, 2011; Commonwealth of Australia, Australian Bureau of Statistics: Canberra, Australia, 2013.
- Australian Curriculum AaRA. My School Sydney, New South Wales: ACARA; 2016. Available online: https://www.myschool.edu.au (accessed on 9 November 2016).
- De Onis, M.; Onyango, A.W.; Borghi, E.; Siyam, A.; Nishida, C.; Siekmann, J. Development of a WHO growth reference for school-aged children and adolescents. Bull. World Health Organ. 2007, 85, 660–667. [Google Scholar] [CrossRef] [PubMed]
- Committee on Evaluating Progress of Obesity Prevention Effort, Food and Nutrition Board, Institute of Medicine. Evaluating Obesity Prevention Efforts: A Plan for Measuring Progress; Green, L.W., Simm, L., Breiner, H., Eds.; National Academies Press: Washington, DC, USA, 2013; p. 240. [Google Scholar]
- Rodgers, R.; Faure, K.; Chabrol, H. Gender Differences in Parental Influences on Adolescent Body Dissatisfaction and Disordered Eating. Sex Roles 2009, 61, 837–849. [Google Scholar] [CrossRef]
- BMRB Social Research. Research Into Parental Attitudes Towards Routine Measurement of Children’s Height and Weight. Available online: http://webarchive.nationalarchives.gov.uk/20130107105354/http://www.dh.gov.uk/en/Publicationsandstatistics/Publications/PublicationsPolicyAndGuidance/DH_080600 (accessed on 9 November 2016).
- Mellor, J.M.; Rapoport, R.B.; Maliniak, D. The impact of child obesity on active parental consent in school-based survey research on healthy eating and physical activity. Eval. Rev. 2008, 32, 298–312. [Google Scholar] [CrossRef] [PubMed]
- Townsend, N.; Rutter, H.; Foster, C. Variations in data collection can influence outcome measures of BMI measuring programmes. Int. J. Pediatr. Obes. 2011, 6, 491–498. [Google Scholar] [CrossRef] [PubMed]
- Ruggieri, D.G.; Bass, S.B. A comprehensive review of school-based body mass index screening programs and their implications for school health: Do the controversies accurately reflect the research? J. Sch. Health 2015, 85, 61–72. [Google Scholar] [CrossRef] [PubMed]
- Millar, L.; Kremer, P.; de Silva-Sanigorski, A.; McCabe, M.; Mavoa, H.; Moodie, M.; Utter, J.; Bell, C.; Malakellis, M.; Mathews, L.; et al. Reduction in overweight and obesity from a 3 year community-based intervention in Australia: The “It’s Your Move!” project. Obes Rev. 2011, 12, 20–28. [Google Scholar] [CrossRef] [PubMed]
- Sanigorski, A.M.; Bell, A.C.; Kremer, P.J.; Cuttler, R.; Swinburn, B.A. Reducing unhealthy weight gain in children through community capacity-building: Results of a quasi-experimental intervention program, Be Active Eat Well. Int. J. Obes. 2008, 32, 1060–1067. [Google Scholar] [CrossRef] [PubMed]


| Opt-In | Opt-Out | ||
| Invited Schools, n | 156 | 147 | |
| Participating schools, n (response rate) | 38 (24.4%) | 47 (32.0%) | p = 0.14 a |
| Eligible students (Grade 4 & 6), n | 2357 | 2959 | |
| Participating children, n (response rate) | 856 (36.3%) | 2557 (84.4%) | p < 0.0001 a |
| Participating children per school | |||
| Mean (SD) | 22.5 (15.5) | 54.4 (48.1) | p = 0.0005 b |
| Minimum—Maximum | 3—65 | 2—212 | |
| Enrolled children with anthropometric data | Opt-In n (%) | Opt-Out n (%) | Opt-In/Opt-Out |
| Total | 813 | 2419 | 34% |
| Boys | 380 (47) | 1228 (51) | 31% |
| Girls | 433 (53) | 1191 (49) | 36% |
| Boys Grade 4 | 194 (51) | 636 (52) | 31% |
| Grade 6 | 186 (49) | 592 (48) | 31% |
| Girls Grade 4 | 233 (54) | 611 (51) | 38% |
| Grade 6 | 200 (46) | 580 (49) | 34% |
| Boys Major cities | 191 (50) | 667 (54) | 29% |
| Inner regional | 127 (33) | 445 (36) | 29% |
| Outer regional | 62 (16) | 116 (9) | 53% |
| Girls Major cities | 204 (47) | 620 (52) | 33% |
| Inner regional | 173 (40) | 468 (39) | 37% |
| Outer regional | 56 (13) | 103 (9) | 54% |
| Opt-In (n = 38) | Opt-Out (n = 47) | ||
|---|---|---|---|
| Mean (SD) | p-value ¥ | ||
| Index of Community Socio-Educational Advantage (ICSEA) | 989 (46) | 980 (60) | 0.48 |
| Socio-Economic Index for Areas (SEIFA) | 968 (54) | 960 (54) | 0.51 |
| Enrolment Grade 4 | 37 (34) | 39 (37) | 0.80 |
| Enrolment Grade 6 | 34 (28) | 38 (35) | 0.60 |
| Enrolment (total) | 272 (238) | 342 (385) | 0.31 |
| No. (%) | p-value # | ||
| Government school | 31 (82) | 38 (81) | 0.98 |
| Location | 1.00 | ||
| Major cities | 14 (37) | 18 (38) | |
| Inner Regional | 16 (42) | 20 (43) | |
| Outer Regional | 8 (21) | 9 (19) | |
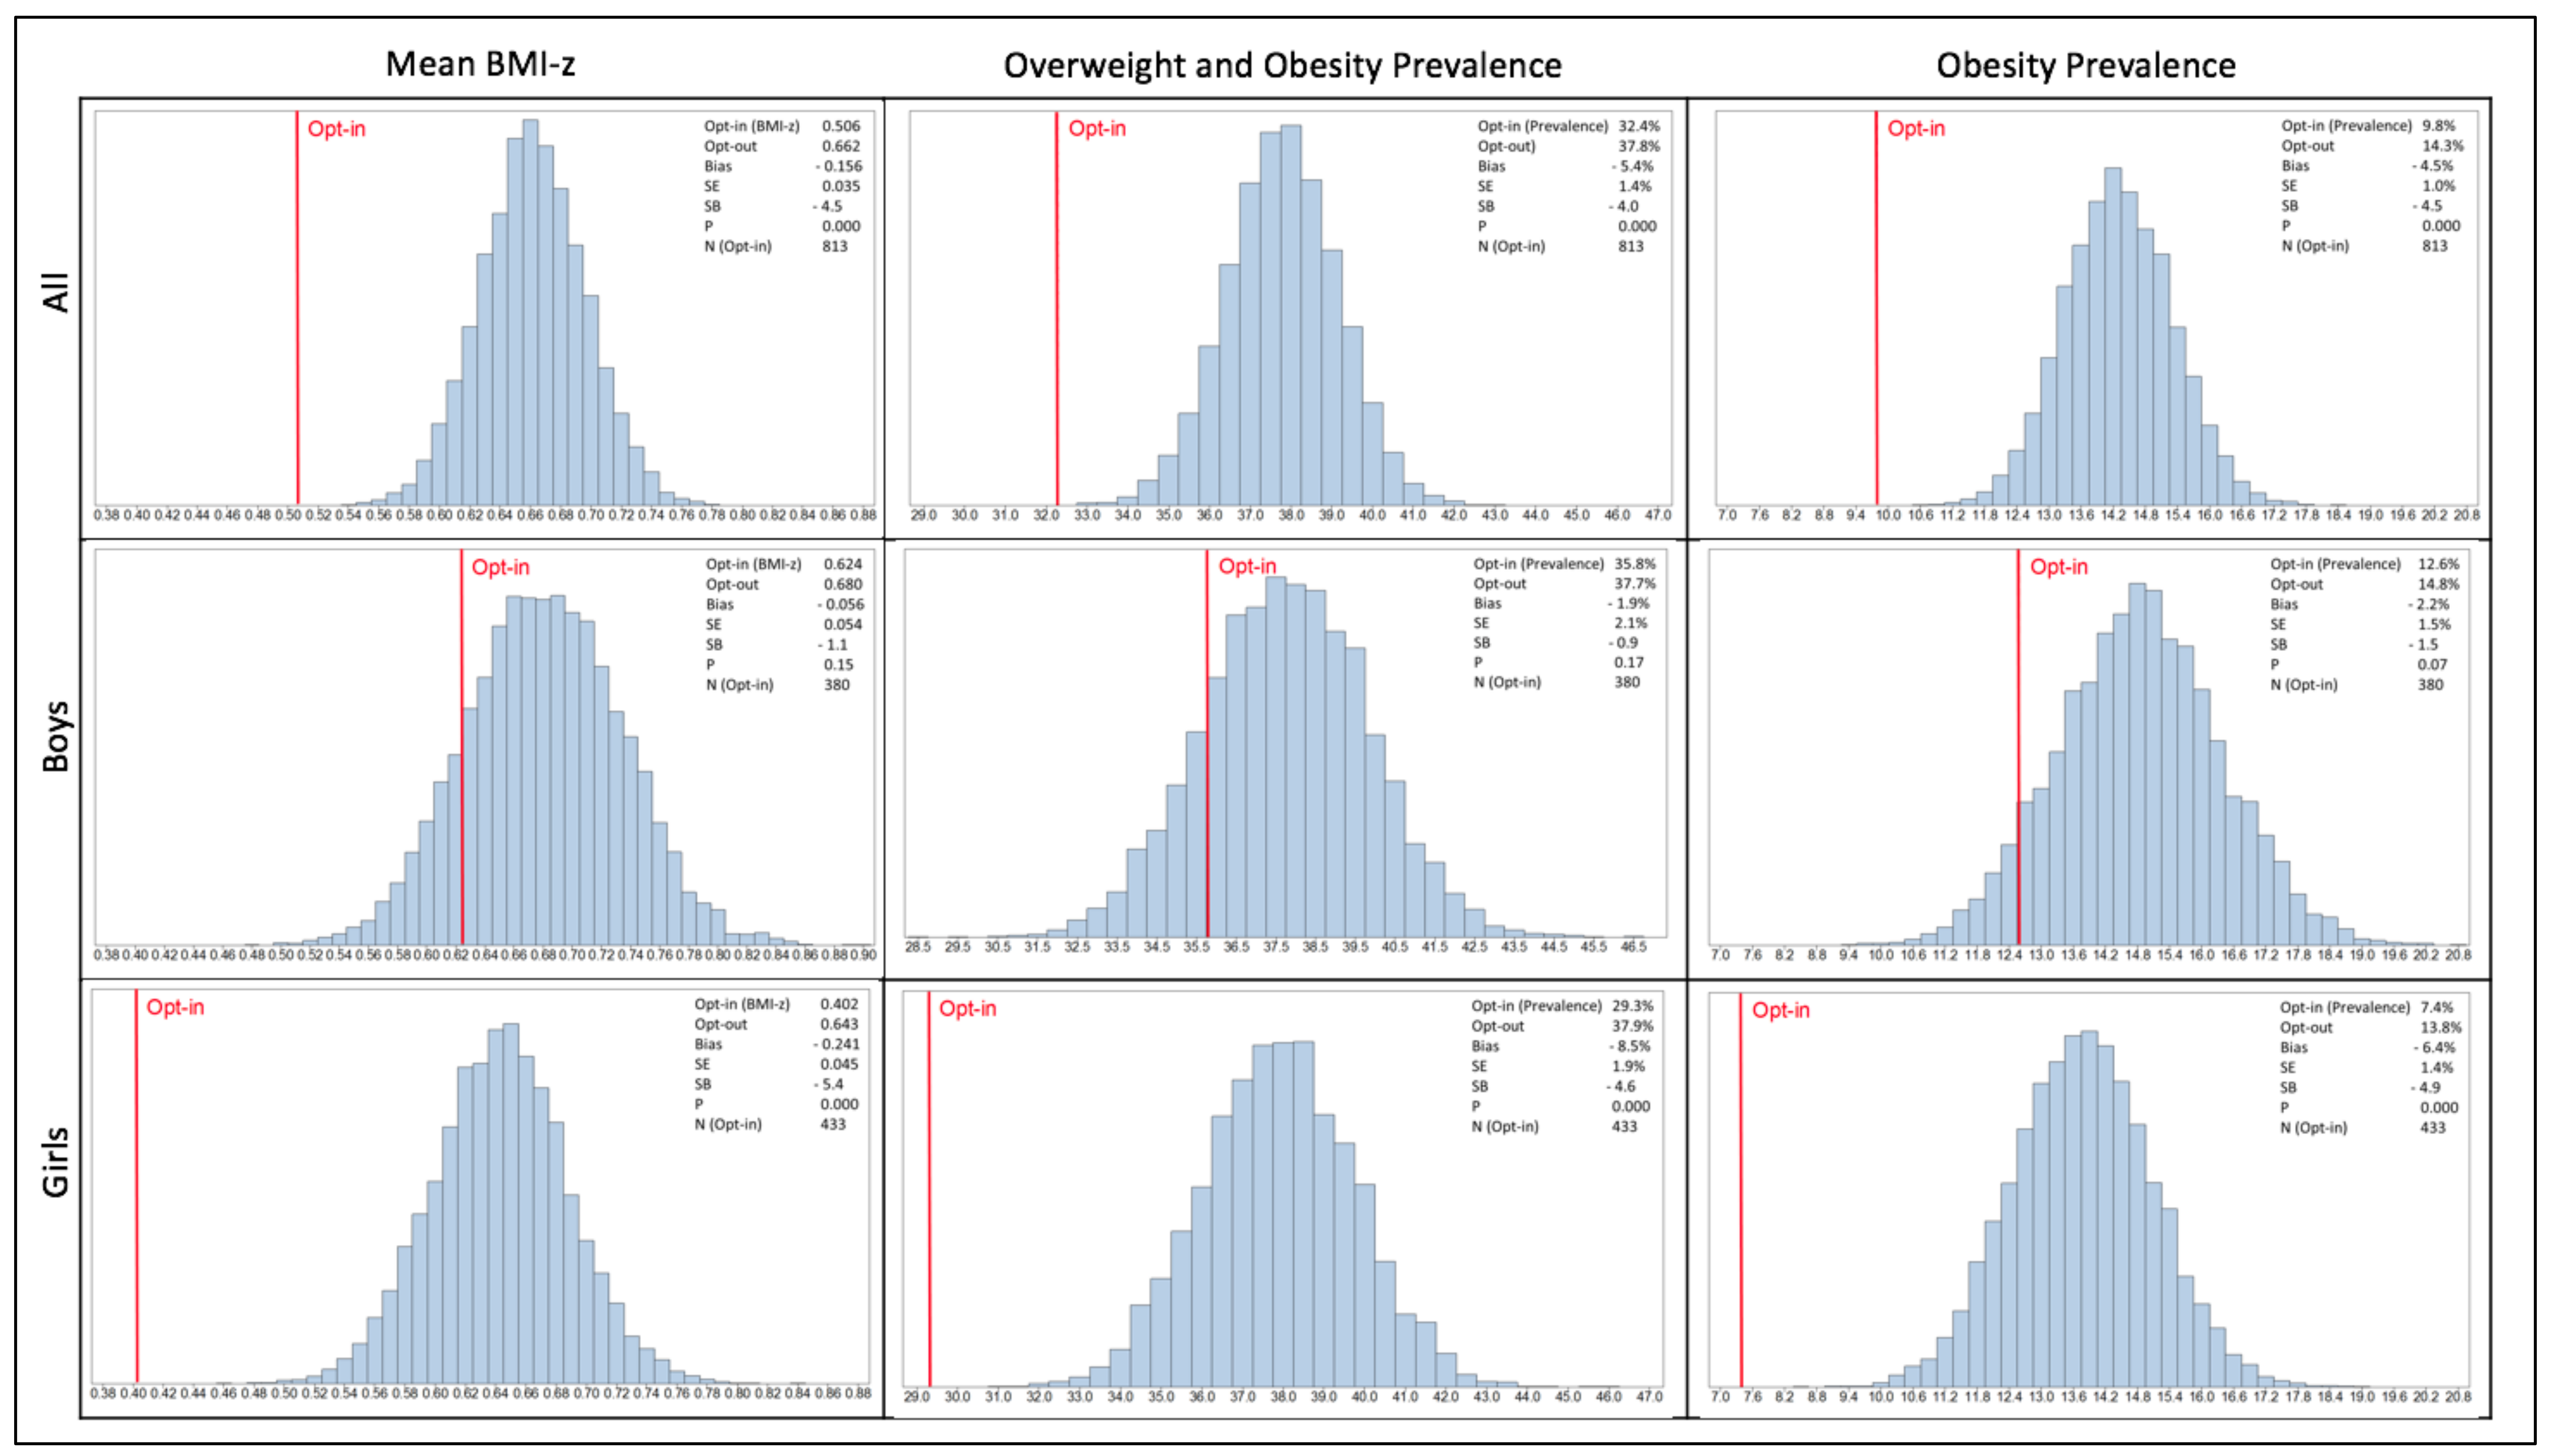
| BMI-z Score Mean | Overweight and Obesity Prevalence | Obesity Prevalence | |||||||||||||||||
|---|---|---|---|---|---|---|---|---|---|---|---|---|---|---|---|---|---|---|---|
| Opt-In | Opt-Out | Bias | SE | Std Bias | p | Opt-In | Opt-Out | Bias | SE | Std Bias | p | Opt-In | Opt-Out | Bias | SE | Std Bias | p | ||
| All | 0.506 | 0.662 | −0.156 | 0.035 | −4.5 | <0.0001 | 32.4 | 37.8 | −5.4 | 1.36 | −4.0 | <0.0001 | 9.8 | 14.3 | −4.5 | 1.00 | −4.5 | <0.0001 | |
| Boys | 0.624 | 0.680 | −0.056 | 0.054 | −1.1 | 0.15 | 35.8 | 37.7 | −1.9 | 2.07 | −0.9 | 0.17 | 12.6 | 14.8 | −2.2 | 1.53 | −1.4 | 0.070 | |
| Girls | 0.402 | 0.643 | −0.241 | 0.045 | −5.4 | <0.0001 | 29.3 | 37.9 | −8.5 | 1.86 | −4.6 | <0.0001 | 7.4 | 13.8 | −6.4 | 1.31 | −4.9 | <0.0001 | |
| Boys | Grade 4th | 0.704 | 0.728 | −0.024 | 0.077 | −0.3 | 0.38 | 39.2 | 38.1 | 1.1 | 2.9 | 0.4 | 0.35 | 14.4 | 15.6 | −1.1 | 2.19 | −0.5 | 0.31 |
| Grade 6th | 0.541 | 0.628 | −0.088 | 0.074 | −1.2 | 0.12 | 32.3 | 37.3 | −5.1 | 2.96 | −1.7 | 0.050 | 10.8 | 14 | −3.3 | 2.10 | −1.6 | 0.054 | |
| Girls | Grade 4th | 0.379 | 0.734 | −0.355 | 0.061 | −5.9 | <0.0001 | 27.9 | 40.8 | −12.9 | 2.56 | −5.0 | <0.0001 | 7.7 | 16 | −8.3 | 1.86 | −4.5 | <0.0001 |
| Grade 6th | 0.428 | 0.547 | −0.119 | 0.066 | −1.8 | 0.039 | 31.0 | 34.8 | −3.8 | 2.65 | −1.4 | 0.077 | 7 | 11.4 | −4.4 | 1.84 | −2.4 | 0.0076 | |
| Boys | Major cities | 0.720 | 0.609 | 0.111 | 0.082 | 1.4 | 0.086 | 42.4 | 35.8 | 6.6 | 3.07 | 2.1 | 0.017 | 14.1 | 13.8 | 0.3 | 2.18 | 0.1 | 0.43 |
| Inner regional | 0.547 | 0.745 | −0.197 | 0.084 | −2.4 | 0.0088 | 29.1 | 39.6 | −10.4 | 3.56 | −2.9 | 0.0015 | 11.8 | 15.1 | −3.3 | 2.62 | −1.3 | 0.098 | |
| Outer regional | 0.487 | 0.841 | −0.354 | 0.102 | −3.5 | 0.0001 | 29 | 41.4 | −12.4 | 3.84 | −3.2 | 0.0012 | 9.7 | 19.8 | −10.1 | 3.25 | −3.1 | 0.0012 | |
| Girls | Major cities | 0.369 | 0.580 | −0.212 | 0.066 | −3.2 | 0.0003 | 29.4 | 38.1 | −8.7 | 2.8 | −3.1 | 0.0007 | 5.9 | 11.5 | −5.6 | 1.82 | −3.1 | 0.0007 |
| Inner regional | 0.482 | 0.743 | −0.261 | 0.071 | −3.7 | <0.0001 | 31.2 | 39.1 | −7.9 | 2.9 | −2.7 | 0.003 | 10.4 | 17.1 | −6.7 | 2.28 | −2.9 | 0.0012 | |
| Outer regional | 0.276 | 0.567 | −0.291 | 0.094 | −3.1 | 0.0004 | 23.2 | 31.1 | −7.9 | 4.43 | −1.8 | 0.029 | 3.6 | 12.6 | −9.1 | 3.13 | −2.9 | 0.0008 | |
© 2018 by the authors. Licensee MDPI, Basel, Switzerland. This article is an open access article distributed under the terms and conditions of the Creative Commons Attribution (CC BY) license (http://creativecommons.org/licenses/by/4.0/).
Share and Cite
Strugnell, C.; Orellana, L.; Hayward, J.; Millar, L.; Swinburn, B.; Allender, S. Active (Opt-In) Consent Underestimates Mean BMI-z and the Prevalence of Overweight and Obesity Compared to Passive (Opt-Out) Consent. Evidence from the Healthy Together Victoria and Childhood Obesity Study. Int. J. Environ. Res. Public Health 2018, 15, 747. https://doi.org/10.3390/ijerph15040747
Strugnell C, Orellana L, Hayward J, Millar L, Swinburn B, Allender S. Active (Opt-In) Consent Underestimates Mean BMI-z and the Prevalence of Overweight and Obesity Compared to Passive (Opt-Out) Consent. Evidence from the Healthy Together Victoria and Childhood Obesity Study. International Journal of Environmental Research and Public Health. 2018; 15(4):747. https://doi.org/10.3390/ijerph15040747
Chicago/Turabian StyleStrugnell, Claudia, Liliana Orellana, Joshua Hayward, Lynne Millar, Boyd Swinburn, and Steven Allender. 2018. "Active (Opt-In) Consent Underestimates Mean BMI-z and the Prevalence of Overweight and Obesity Compared to Passive (Opt-Out) Consent. Evidence from the Healthy Together Victoria and Childhood Obesity Study" International Journal of Environmental Research and Public Health 15, no. 4: 747. https://doi.org/10.3390/ijerph15040747