
Metabolic Syndrome and Serum Liver Enzymes in the General Chinese Population


Abstract
:1. Introduction
2. Materials and Methods
2.1. Study Population
2.2. Data Collection
2.3. Blood Pressure Measurements
2.4. Anthropometric Measurements
2.5. Biochemical Measurements
2.6. Elevated Liver Enzymes Definition
2.7. Metabolic Syndrome Criteria
2.8. Statistical Analysis
3. Results
4. Discussion
5. Conclusions
Acknowledgments
Author Contributions
Conflicts of Interest
Abbreviations
| CNY | China Yuan |
| CVD | cardiovascular disease |
| SBP | systolic blood pressure |
| DBP | diastolic blood pressure |
| WC | waist circumference |
| BMI | body mass index |
| TC | total cholesterol |
| TG | triacylglycerol |
| HDL-C | high-density lipoprotein cholesterol |
| LDL-C | low-density lipoprotein cholesterol |
| FPG | fasting plasma glucose |
| ALT | alanine aminotransferase |
| AST | aspartate aminotransferase |
| GGT | gamma-glutamyl transferase |
References
- Alberti, K.G.; Zimmet, P.; Shaw, J. The metabolic syndrome—A new worldwide definition. Lancet (Lond. Engl.) 2005, 366, 1059–1062. [Google Scholar] [CrossRef]
- Lorenzo, C.; Okoloise, M.; Williams, K.; Stern, M.P.; Haffner, S.M. The metabolic syndrome as predictor of type 2 diabetes: The San Antonio heart study. Diabetes Care 2003, 26, 3153–3159. [Google Scholar] [CrossRef] [PubMed]
- Sattar, N.; Gaw, A.; Scherbakova, O.; Ford, I.; O’Reilly, D.S.; Haffner, S.M.; Isles, C.; Macfarlane, P.W.; Packard, C.J.; Cobbe, S.M.; et al. Metabolic syndrome with and without C-reactive protein as a predictor of coronary heart disease and diabetes in the West of Scotland Coronary Prevention Study. Circulation 2003, 108, 414–419. [Google Scholar] [CrossRef] [PubMed]
- McNeill, A.M.; Rosamond, W.D.; Girman, C.J.; Golden, S.H.; Schmidt, M.I.; East, H.E.; Ballantyne, C.M.; Heiss, G. The metabolic syndrome and 11-year risk of incident cardiovascular disease in the atherosclerosis risk in communities study. Diabetes Care 2005, 28, 385–390. [Google Scholar] [CrossRef] [PubMed]
- Higashiyama, A.; Okamura, T.; Ono, Y.; Watanabe, M.; Kokubo, Y.; Okayama, A. Risk of smoking and metabolic syndrome for incidence of cardiovascular disease comparison of relative contribution in urban Japanese population: The Suita study. Circ. J. 2009, 73, 2258–2263. [Google Scholar] [CrossRef] [PubMed]
- Hanley, A.J.; Williams, K.; Festa, A.; Wagenknecht, L.E.; D’Agostino, R.B., Jr.; Kempf, J.; Zinman, B.; Haffner, S.M. Elevations in markers of liver injury and risk of type 2 diabetes: The insulin resistance atherosclerosis study. Diabetes 2004, 53, 2623–2632. [Google Scholar] [CrossRef] [PubMed]
- Lee, D.H.; Silventoinen, K.; Jacobs, D.R., Jr.; Jousilahti, P.; Tuomileto, J. γ-Glutamyltransferase, obesity, and the risk of type 2 diabetes: Observational cohort study among 20,158 middle-aged men and women. J. Clin. Endocrinol. Metab. 2004, 89, 5410–5414. [Google Scholar] [CrossRef] [PubMed]
- Westerbacka, J.; Corner, A.; Tiikkainen, M.; Tamminen, M.; Vehkavaara, S.; Hakkinen, A.M.; Fredriksson, J.; Yki-Jarvinen, H. Women and men have similar amounts of liver and intra-abdominal fat, despite more subcutaneous fat in women: Implications for sex differences in markers of cardiovascular risk. Diabetologia 2004, 47, 1360–1369. [Google Scholar] [CrossRef] [PubMed]
- Schindhelm, R.K.; Diamant, M.; Dekker, J.M.; Tushuizen, M.E.; Teerlink, T.; Heine, R.J. Alanine aminotransferase as a marker of non-alcoholic fatty liver disease in relation to type 2 diabetes mellitus and cardiovascular disease. Diabetes Metab. Rese. Rev. 2006, 22, 437–443. [Google Scholar] [CrossRef] [PubMed]
- Angelico, F.; del Ben, M.; Conti, R.; Francioso, S.; Feole, K.; Maccioni, D.; Antonini, T.M.; Alessandri, C. Non-alcoholic fatty liver syndrome: A hepatic consequence of common metabolic diseases. J. Gastroenterol. Hepatol. 2003, 18, 588–594. [Google Scholar] [CrossRef] [PubMed]
- Cortez-Pinto, H.; Camilo, M.E.; Baptista, A.; de Oliveira, A.G.; de Moura, M.C. Non-alcoholic fatty liver: Another feature of the metabolic syndrome? Clin. Nutr. (Edinb. Scotl.) 1999, 18, 353–358. [Google Scholar] [CrossRef]
- Marceau, P.; Biron, S.; Hould, F.S.; Marceau, S.; Simard, S.; Thung, S.N.; Kral, J.G. Liver pathology and the metabolic syndrome X in severe obesity. J. Clin. Endocrinol. Metab. 1999, 84, 1513–1517. [Google Scholar] [CrossRef] [PubMed]
- Pagano, G.; Pacini, G.; Musso, G.; Gambino, R.; Mecca, F.; Depetris, N.; Cassader, M.; David, E.; Cavallo-Perin, P.; Rizzetto, M. Nonalcoholic steatohepatitis, insulin resistance, and metabolic syndrome: Further evidence for an etiologic association. Hepatology (Baltim. Md.) 2002, 35, 367–372. [Google Scholar] [CrossRef] [PubMed]
- Marchesini, G.; Forlani, G. NASH: From liver diseases to metabolic disorders and back to clinical hepatology. Hepatology (Baltim. Md.) 2002, 35, 497–499. [Google Scholar] [CrossRef] [PubMed]
- Oh, S.Y.; Cho, Y.K.; Kang, M.S.; Yoo, T.W.; Park, J.H.; Kim, H.J.; Park, D.I.; Sohn, C.I.; Jeon, W.K.; Kim, B.I.; et al. The association between increased alanine aminotransferase activity and metabolic factors in nonalcoholic fatty liver disease. Metabolism 2006, 55, 1604–1609. [Google Scholar] [CrossRef] [PubMed]
- Jeong, S.K.; Nam, H.S.; Rhee, J.A.; Shin, J.H.; Kim, J.M.; Cho, K.H. Metabolic syndrome and ALT: A community study in adult Koreans. Int. J. Obes. Relat. Metab. Disord. 2004, 28, 1033–1038. [Google Scholar] [CrossRef] [PubMed]
- Hanley, A.J.; Williams, K.; Festa, A.; Wagenknecht, L.E.; D’Agostino, R.B., Jr.; Haffner, S.M. Liver markers and development of the metabolic syndrome: The insulin resistance atherosclerosis study. Diabetes 2005, 54, 3140–3147. [Google Scholar] [CrossRef] [PubMed]
- Prati, D.; Taioli, E.; Zanella, A.; della Torre, E.; Butelli, S.; del Vecchio, E.; Vianello, L.; Zanuso, F.; Mozzi, F.; Milani, S.; et al. Updated definitions of healthy ranges for serum alanine aminotransferase levels. Ann. Intern. Med. 2002, 137, 1–10. [Google Scholar] [CrossRef] [PubMed]
- Mofrad, P.; Contos, M.J.; Haque, M.; Sargeant, C.; Fisher, R.A.; Luketic, V.A.; Sterling, R.K.; Shiffman, M.L.; Stravitz, R.T.; Sanyal, A.J. Clinical and histologic spectrum of nonalcoholic fatty liver disease associated with normal ALT values. Hepatology (Baltim. Md.) 2003, 37, 1286–1292. [Google Scholar] [CrossRef] [PubMed]
- Kim, H.C.; Nam, C.M.; Jee, S.H.; Han, K.H.; Oh, D.K.; Suh, I. Normal serum aminotransferase concentration and risk of mortality from liver diseases: Prospective cohort study. BMJ (Clin. Res. Ed.) 2004, 328, 983. [Google Scholar] [CrossRef] [PubMed]
- O’Brien, E.; Petrie, J.; Littler, W.; de Swiet, M.; Padfield, P.L.; Altman, D.G.; Bland, M.; Coats, A.; Atkins, N. An outline of the revised British Hypertension Society protocol for the evaluation of blood pressure measuring devices. J. Hypertens. 1993, 11, 677–679. [Google Scholar] [CrossRef] [PubMed]
- Alberti, K.G.; Eckel, R.H.; Grundy, S.M.; Zimmet, P.Z.; Cleeman, J.I.; Donato, K.A.; Fruchart, J.C.; James, W.P.; Loria, C.M.; Smith, S.C., Jr.; et al. Harmonizing the metabolic syndrome: A joint interim statement of the International Diabetes Federation Task Force on Epidemiology and Prevention; National Heart, Lung, and Blood Institute; American Heart Association; World Heart Federation; International Atherosclerosis Society; and International Association for the Study of Obesity. Circulation 2009, 120, 1640–1645. [Google Scholar] [PubMed]
- Meisinger, C.; Doring, A.; Schneider, A.; Lowel, H. Serum gamma-glutamyltransferase is a predictor of incident coronary events in apparently healthy men from the general population. Atherosclerosis 2006, 189, 297–302. [Google Scholar] [CrossRef] [PubMed]
- Lee, D.S.; Evans, J.C.; Robins, S.J.; Wilson, P.W.; Albano, I.; Fox, C.S.; Wang, T.J.; Benjamin, E.J.; D’Agostino, R.B.; Vasan, R.S. Gamma glutamyl transferase and metabolic syndrome, cardiovascular disease, and mortality risk: The Framingham Heart Study. Arterioscler. Thromb. Vasc. Biol. 2007, 27, 127–133. [Google Scholar] [CrossRef] [PubMed]
- Schindhelm, R.K.; Dekker, J.M.; Nijpels, G.; Bouter, L.M.; Stehouwer, C.D.; Heine, R.J.; Diamant, M. Alanine aminotransferase predicts coronary heart disease events: A 10-year follow-up of the Hoorn Study. Atherosclerosis 2007, 191, 391–396. [Google Scholar] [CrossRef] [PubMed]
- Wannamethee, S.G.; Shaper, A.G.; Lennon, L.; Whincup, P.H. Hepatic enzymes, the metabolic syndrome, and the risk of type 2 diabetes in older men. Diabetes Care 2005, 28, 2913–2918. [Google Scholar] [CrossRef] [PubMed]
- Marchesini, G.; Avagnina, S.; Barantani, E.G.; Ciccarone, A.M.; Corica, F.; Dall’Aglio, E.; Dalle Grave, R.; Morpurgo, P.S.; Tomasi, F.; Vitacolonna, E. Aminotransferase and gamma-glutamyltranspeptidase levels in obesity are associated with insulin resistance and the metabolic syndrome. J. Endocrinol. Investig. 2005, 28, 333–339. [Google Scholar] [CrossRef]
- Choi, K.M.; Lee, K.W.; Kim, H.Y.; Seo, J.A.; Kim, S.G.; Kim, N.H.; Choi, D.S.; Baik, S.H. Association among serum ferritin, alanine aminotransferase levels, and metabolic syndrome in Korean postmenopausal women. Metabolism 2005, 54, 1510–1514. [Google Scholar] [CrossRef] [PubMed]
- Park, H.S.; Han, J.H.; Choi, K.M.; Kim, S.M. Relation between elevated serum alanine aminotransferase and metabolic syndrome in Korean adolescents. Am. J. Clin. Nutr. 2005, 82, 1046–1051. [Google Scholar] [PubMed]
- Kim, H.C.; Choi, S.H.; Shin, H.W.; Cheong, J.Y.; Lee, K.W.; Lee, H.C.; Huh, K.B.; Kim, D.J. Severity of ultrasonographic liver steatosis and metabolic syndrome in Korean men and women. World J. Gastroenterol. 2005, 11, 5314–5321. [Google Scholar] [CrossRef] [PubMed]
- Wedemeyer, H.; Hofmann, W.P.; Lueth, S.; Malinski, P.; Thimme, R.; Tacke, F.; Wiegand, J. ALT screening for chronic liver diseases: Scrutinizing the evidence. Z. Gastroenterol. 2010, 48, 46–55. [Google Scholar] [CrossRef] [PubMed]
- Matsubara, K.; Matsuzawa, Y.; Jiao, S.; Takama, T.; Kubo, M.; Tarui, S. Relationship between hypertriglyceridemia and uric acid production in primary gout. Metabolism 1989, 38, 698–701. [Google Scholar] [CrossRef]
- Villegas, R.; Xiang, Y.B.; Elasy, T.; Cai, Q.; Xu, W.; Li, H.; Fazio, S.; Linton, M.F.; Raiford, D.; Zheng, W.; et al. Liver enzymes, type 2 diabetes, and metabolic syndrome in middle-aged, urban Chinese men. Metab. Syndr. Relat. Disord. 2011, 9, 305–311. [Google Scholar] [CrossRef] [PubMed]
- Tiikkainen, M.; Bergholm, R.; Vehkavaara, S.; Rissanen, A.; Hakkinen, A.M.; Tamminen, M.; Teramo, K.; Yki-Jarvinen, H. Effects of identical weight loss on body composition and features of insulin resistance in obese women with high and low liver fat content. Diabetes 2003, 52, 701–707. [Google Scholar] [CrossRef] [PubMed]
- Uemura, H.; Katsuura-Kamano, S.; Yamaguchi, M.; Sawachika, F.; Arisawa, K. Serum hepatic enzyme activity and alcohol drinking status in relation to the prevalence of metabolic syndrome in the general Japanese population. PLoS ONE 2014, 9, e95981. [Google Scholar] [CrossRef] [PubMed]
- Oda, E.; Kawai, R.; Watanabe, K.; Sukumaran, V. Prevalence of metabolic syndrome increases with the increase in blood levels of gamma glutamyltransferase and alanine aminotransferase in Japanese men and women. Intern. Med. (Tokyo Jpn.) 2009, 48, 1343–1350. [Google Scholar] [CrossRef]
- Oh, H.J.; Kim, T.H.; Sohn, Y.W.; Kim, Y.S.; Oh, Y.R.; Cho, E.Y.; Shim, S.Y.; Shin, S.R.; Han, A.L.; Yoon, S.J.; et al. Association of serum alanine aminotransferase and gamma-glutamyltransferase levels within the reference range with metabolic syndrome and nonalcoholic fatty liver disease. Korean J. Hepatol. 2011, 17, 27–36. [Google Scholar] [CrossRef] [PubMed]
- Clark, J.M.; Brancati, F.L.; Diehl, A.M. The prevalence and etiology of elevated aminotransferase levels in the United States. Am. J. Gastroenterol. 2003, 98, 960–967. [Google Scholar] [CrossRef] [PubMed]
- Daniel, S.; Ben-Menachem, T.; Vasudevan, G.; Ma, C.K.; Blumenkehl, M. Prospective evaluation of unexplained chronic liver transaminase abnormalities in asymptomatic and symptomatic patients. Am. J. Gastroenterol. 1999, 94, 3010–3014. [Google Scholar] [CrossRef] [PubMed]
- Marchesini, G.; Brizi, M.; Bianchi, G.; Tomassetti, S.; Bugianesi, E.; Lenzi, M.; McCullough, A.J.; Natale, S.; Forlani, G.; Melchionda, N. Nonalcoholic fatty liver disease: A feature of the metabolic syndrome. Diabetes 2001, 50, 1844–1850. [Google Scholar] [CrossRef] [PubMed]
- Angelico, F.; del Ben, M.; Conti, R.; Francioso, S.; Feole, K.; Fiorello, S.; Cavallo, M.G.; Zalunardo, B.; Lirussi, F.; Alessandri, C.; et al. Insulin resistance, the metabolic syndrome, and nonalcoholic fatty liver disease. J. Clin. Endocrinol. Metab. 2005, 90, 1578–1582. [Google Scholar] [CrossRef] [PubMed]
- Fan, J.G.; Saibara, T.; Chitturi, S.; Kim, B.I.; Sung, J.J.; Chutaputti, A. What are the risk factors and settings for non-alcoholic fatty liver disease in Asia-Pacific? J. Gastroenterol. Hepatol. 2007, 22, 794–800. [Google Scholar] [CrossRef] [PubMed]


| Variables | Mets | Non-Mets | p-Value | Total |
|---|---|---|---|---|
| (n = 4849) | (n = 6724) | (n = 11,573) | ||
| Age, year | 55.5 ± 10.2 | 52.7 ± 10.6 | <0.001 * | 53.8 ± 10.6 |
| Male, % | 2003 (41.3) | 3355 (49.9) | <0.001 * | 5357 (46.3) |
| Race (Han), % | 4616 (95.2) | 6361 (94.6) | 0.136 | 10,968 (94.8) |
| Current smoking status, % | 1508 (31.1) | 2589 (38.5) | <0.001 * | 4086 (35.3) |
| Current drinking status, % | 975 (20.1) | 1647 (24.5) | <0.001 * | 2617 (22.6) |
| Education, % | <0.001 * | |||
| Primary school or below | 2643 (54.5) | 3127 (46.5) | 5763 (49.8) | |
| Middle school | 1750 (36.1) | 2965 (44.1) | 4717 (40.8) | |
| High school or above | 456 (9.4) | 632 (9.4) | 1093 (9.4) | |
| Physical activity, % | <0.001 * | |||
| Low | 1673 (34.5) | 1768 (26.3) | 3441 (29.7) | |
| Moderate | 2871 (59.2) | 4606 (68.5) | 7479 (64.7) | |
| High | 305 (6.3) | 350 (5.2) | 653 (5.6) | |
| Family income, CNY/year, % | 0.249 | |||
| ≤5000 | 635 (13.1) | 807 (12.0) | 1441 (12.5) | |
| 5000–20,000 | 2619 (54.0) | 3685 (54.8) | 6306 (54.5) | |
| >20,000 | 1595 (32.9) | 2232 (33.2) | 3826 (33.0) | |
| History of CVD, % | 946 (19.5) | 800 (11.9) | <0.001 * | 1712 (15.1) |
| SBP, mm Hg | 150.6 ± 22.6 | 135.6 ± 22.0 | <0.001 * | 141.8 ± 23.5 |
| DBP, mm Hg | 86.1 ± 11.6 | 79.2 ± 11.0 | <0.001 * | 82.1 ± 11.8 |
| WC, cm | 88.5 ± 8.3 | 78.1 ± 8.4 | <0.001 * | 82.4 ± 9.8 |
| BMI, kg/m2 | 26.8 ± 3.4 | 23.4 ± 3.2 | <0.001 * | 24.8 ± 3.7 |
| TC, mmol/L | 5.5 ± 1.2 | 5.1 ± 1.0 | <0.001 * | 5.2 ± 1.1 |
| TG, mmol/L | 2.3 ± 1.9 | 1.1 ± 0.8 | <0.001 * | 1.6 ± 1.5 |
| HDL-C, mmol/L | 1.2 ± 0.3 | 1.5 ± 0.4 | <0.001 * | 1.4 ± 0.4 |
| LDL-C, mmol/L | 3.1 ± 0.9 | 2.9 ± 0.8 | <0.001 * | 2.9 ± 0.8 |
| FPG, mmol/L | 6.5 ± 2.1 | 5.5 ± 1.0 | <0.001 * | 5.9 ± 1.6 |
| ALT, U/L | 25.3 ± 18.0 | 20.4 ± 18.5 | <0.001 * | 22.5 ± 18.4 |
| AST, U/L | 22.6 ± 11.7 | 21.8 ± 12.2 | 0.001 # | 22.1 ± 12.0 |
| Variables | Normal ALT | Elevated ALT | p-Value | |||
|---|---|---|---|---|---|---|
| Quartile 1 | Quartile 2 | Quartile 3 | Quartile 4 | |||
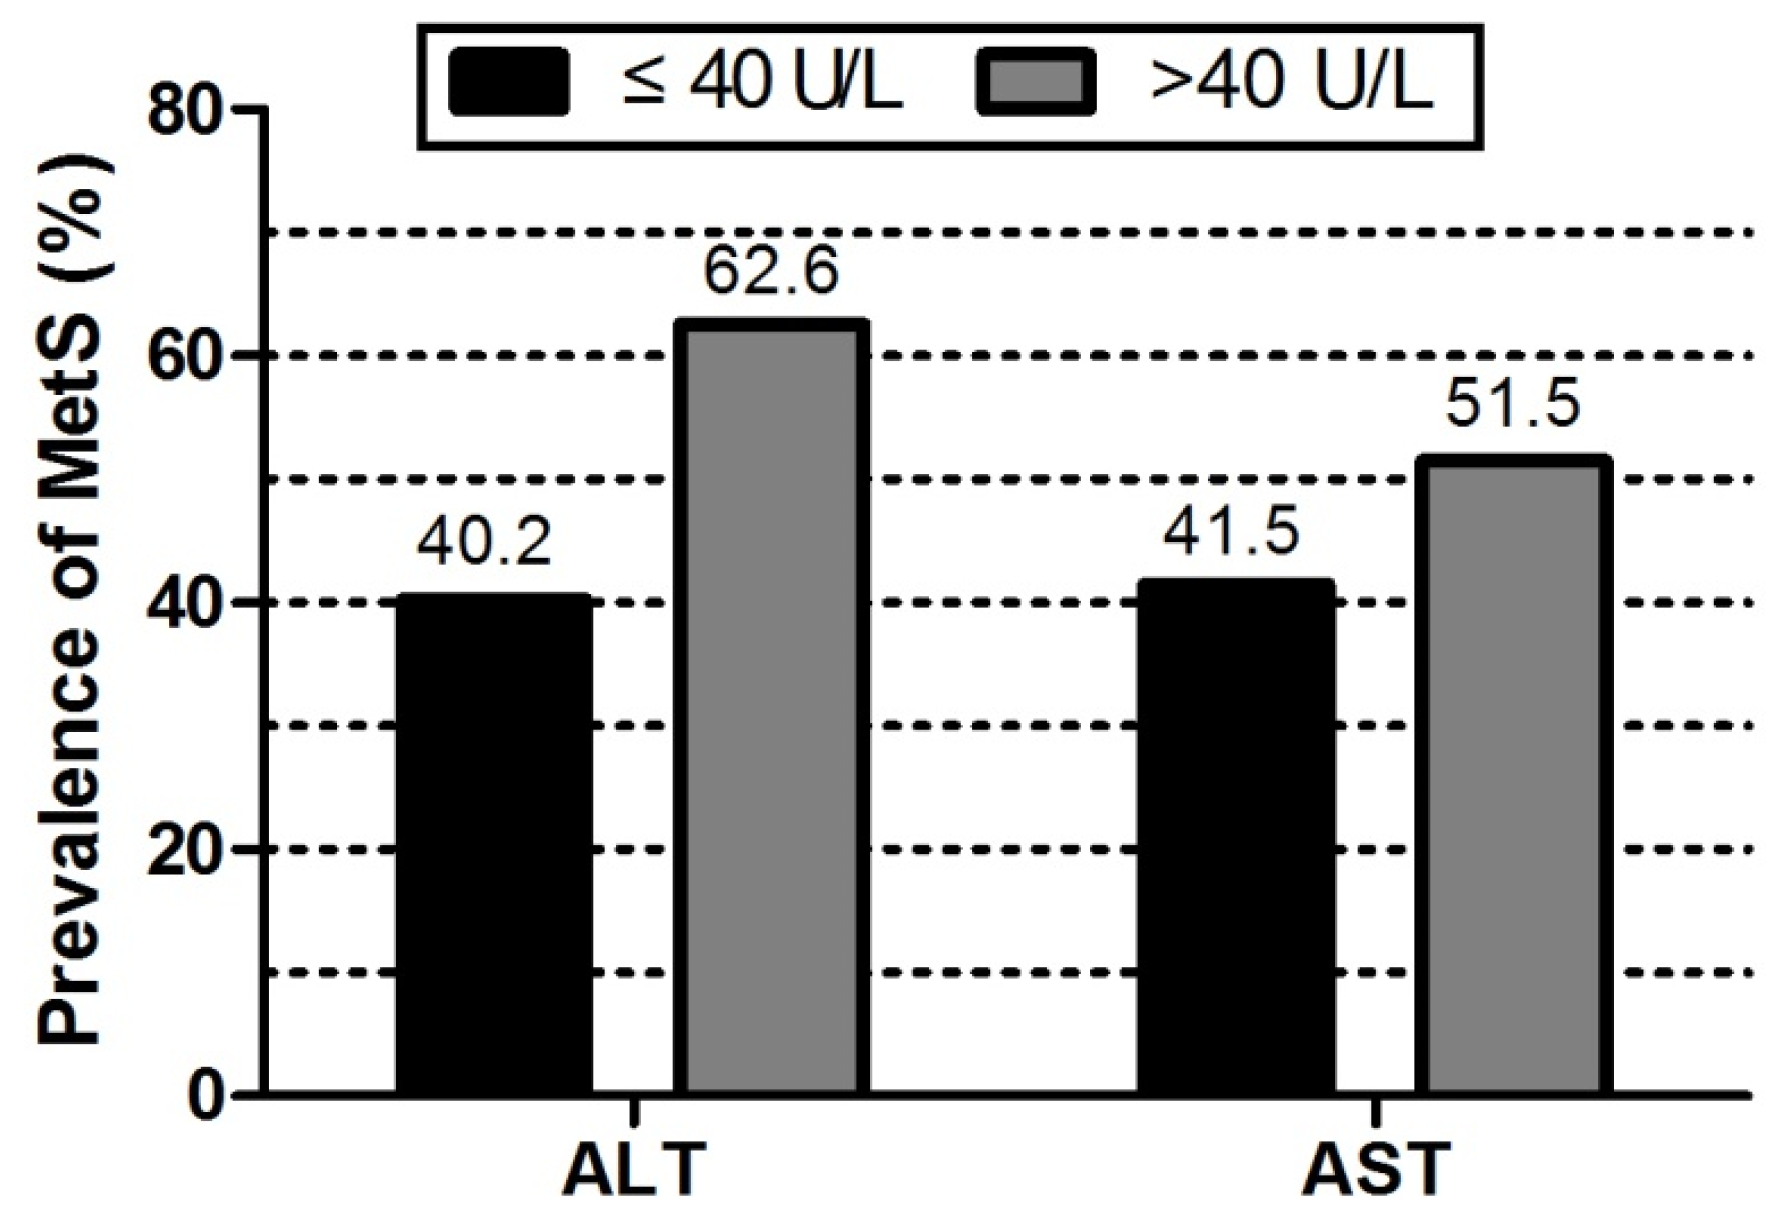
| Metabolic syndrome, % | 979 (30.9) | 780 (36.1) | 1149 (42.5) | 1376 (52.4) | 536 (62.6) | <0.001 * |
| ALT, U/L | 11.4 ± 2.2 | 15.9 ± 0.9 | 20.2 ± 1.7 | 29.5 ± 4.7 | 65.6 ± 43.4 | <0.001 * |
| Age, year | 54.8 ± 11.9 | 54.3 ± 10.8 | 54.1 ± 9.8 | 52.9 ± 9.5 | 51.0 ± 9.4 | <0.001 * |
| Male, % | 1028 (32.2) | 864 (39.9) | 1348 (49.6) | 1554 (58.9) | 563 (65.5) | <0.001 * |
| Race (Han), % | 3056 (95.8) | 2049 (94.5) | 2551 (93.9) | 2492 (94.5) | 820 (95.3) | 0.020 # |
| Current smoking status, % | 1026 (32.2) | 732 (33.8) | 994 (36.6) | 1005 (38.1) | 329 (38.3) | <0.001 * |
| Current drinking status, % | 497 (15.6) | 423 (19.5) | 681 (25.1) | 732 (27.7) | 284 (33.0) | <0.001 * |
| High school or above, % | 280 (8.8) | 180 (8.3) | 257 (9.5) | 280 (10.6) | 96 (11.2) | <0.001 * |
| High Physical activity, % | 177 (5.5) | 128 (5.9) | 142 (5.2) | 162 (6.1) | 44 (5.1) | <0.001 * |
| Family income >20,000 CNY/year, % | 1057 (33.1) | 662 (30.5) | 893 (32.9) | 870 (33.0) | 344 (40.0) | <0.001 * |
| History of CVD, % | 474 (15.2) | 320 (15.1) | 398 (14.9) | 410 (15.8) | 110 (13.1) | 0.440 |
| SBP, mmHg | 138.5 ± 23.9 | 141.6 ± 23.8 | 142.7 ± 23.6 | 143.9 ± 22.5 | 144.8 ± 22.1 | <0.001 * |
| DBP, mmHg | 79.7 ± 11.5 | 81.2 ± 11.8 | 82.3 ± 11.6 | 84.0 ± 11.6 | 85.9 ± 12.0 | <0.001 * |
| WC, cm | 78.7 ± 8.9 | 80.9 ± 9.0 | 83.1 ± 9.5 | 85.8 ± 9.7 | 88.0 ± 10.1 | <0.001 * |
| BMI, kg/m2 | 23.5 ± 3.2 | 24.4 ± 3.5 | 25.0 ± 3.5 | 25.9 ± 3.7 | 26.7 ± 4.2 | <0.001 * |
| TC, mmol/L | 5.1 ± 1.0 | 5.1 ± 1.1 | 5.3 ± 1.1 | 5.4 ± 1.1 | 5.5 ± 1.3 | <0.001 * |
| TG, mmol/L | 1.3 ± 1.0 | 1.4 ± 1.1 | 1.6 ± 1.4 | 2.0 ± 1.8 | 2.3 ± 2.1 | <0.001 * |
| HDL-C, mmol/L | 1.4 ± 0.4 | 1.4 ± 0.4 | 1.4 ± 0.4 | 1.4 ± 0.4 | 1.3 ± 0.4 | <0.001 * |
| LDL-C, mmol/L | 2.8 ± 0.8 | 2.9 ± 0.8 | 2.9 ± 0.8 | 3.0 ± 0.9 | 3.1 ± 0.9 | <0.001 * |
| FPG, mmol/L | 5.7 ± 1.5 | 5.8 ± 1.7 | 5.9 ± 1.5 | 6.1 ± 1.6 | 6.1 ± 1.8 | <0.001 * |
| Variables | Normal AST | Elevated AST | p-Value | |||
|---|---|---|---|---|---|---|
| Quartile 1 | Quartile 2 | Quartile 3 | Quartile 4 | |||
| Metabolic syndrome, % | 1384 (41.5) | 1150 (39.8) | 848 (39.6) | 1229 (44.9) | 209 (51.5) | <0.001 * |
| AST, U/L | 15.2 ± 1.7 | 18.9 ± 0.8 | 21.8 ± 0.9 | 28.0 ± 4.0 | 64.6 ± 37.6 | <0.001 * |
| Age, year | 52.2 ± 10.7 | 54.3 ± 10.7 | 55.0 ± 10.4 | 54.6 ± 10.3 | 52.4 ± 10.0 | <0.001 * |
| Male, % | 1157 (34.4) | 1218 (42.0) | 1057 (49.1) | 1642 (59.6) | 283 (69.5) | <0.001 * |
| Race (Han), % | 3232 (96.2) | 2764 (95.3) | 2025 (94.0) | 2572 (93.4) | 375 (92.1) | <0.001 * |
| Current smoking status, % | 1059 (31.5) | 999 (34.5) | 773 (35.9) | 1060 (38.5) | 195 (47.9) | <0.001 * |
| Current drinking status, % | 449 (13.4) | 565 (19.5) | 491 (22.8) | 926 (33.6) | 186 (45.7) | <0.001 * |
| High school or above, % | 326 (9.7) | 260 (9.0) | 205 (9.5) | 264 (9.6) | 38 (9.3) | 0.094 |
| High Physical activity, % | 199 (5.9) | 156 (5.4) | 136 (6.3) | 146 (5.3) | 16 (3.9) | 0.001 # |
| Family income>20,000 CNY/year, % | 1250 (37.2) | 958 (33.0) | 664 (30.8) | 820 (29.8) | 134 (32.9) | <0.001 * |
| History of CVD, % | 484 (14.7) | 461 (16.2) | 312 (14.8) | 410 (15.2) | 45 (11.4) | 0.103 |
| SBP, mm Hg | 136.7 ± 22.2 | 140.7 ± 23.0 | 144.1 ± 23.9 | 146.6 ± 22.7 | 146.4 ± 23.8 | <0.001 * |
| DBP, mm Hg | 80.3 ± 11.4 | 81.4 ± 11.6 | 82.5 ± 11.7 | 83.9 ± 11.9 | 86.2 ± 12.4 | <0.001 * |
| WC, cm | 81.3 ± 9.4 | 81.7 ± 9.4 | 82.5 ± 10.1 | 84.1 ± 10.2 | 84.9 ± 10.4 | <0.001 * |
| BMI, kg/m2 | 24.5 ± 3.4 | 24.6 ± 3.7 | 24.7 ± 3.6 | 25.3 ± 3.8 | 25.3 ± 4.6 | <0.001 * |
| TC, mmol/L | 5.1 ± 1.0 | 5.2 ± 1.0 | 5.3 ± 1.1 | 5.4 ± 1.1 | 5.4 ± 1.5 | <0.001 * |
| TG, mmol/L | 1.5 ± 1.2 | 1.5 ± 1.2 | 1.6 ± 1.4 | 1.8 ± 1.7 | 2.3 ± 2.1 | <0.001 * |
| HDL-C, mmol/L | 1.6 ± 0.6 | 1.4 ± 0.3 | 1.4 ± 0.4 | 1.5 ± 0.4 | 1.3 ± 0.3 | <0.001 * |
| LDL-C, mmol/L | 2.8 ± 0.8 | 2.9 ± 0.8 | 3.0 ± 0.8 | 2.9 ± 1.0 | 3.0 ± 0.9 | <0.001 * |
| FPG, mmol/L | 6.1 ± 2.1 | 5.8 ± 1.4 | 5.8 ± 1.4 | 5.8 ± 1.3 | 6.2 ± 1.9 | <0.001 * |
| Aminotransferase Levels | OR | 95% CI | p-Value |
|---|---|---|---|
| Normal ALT | |||
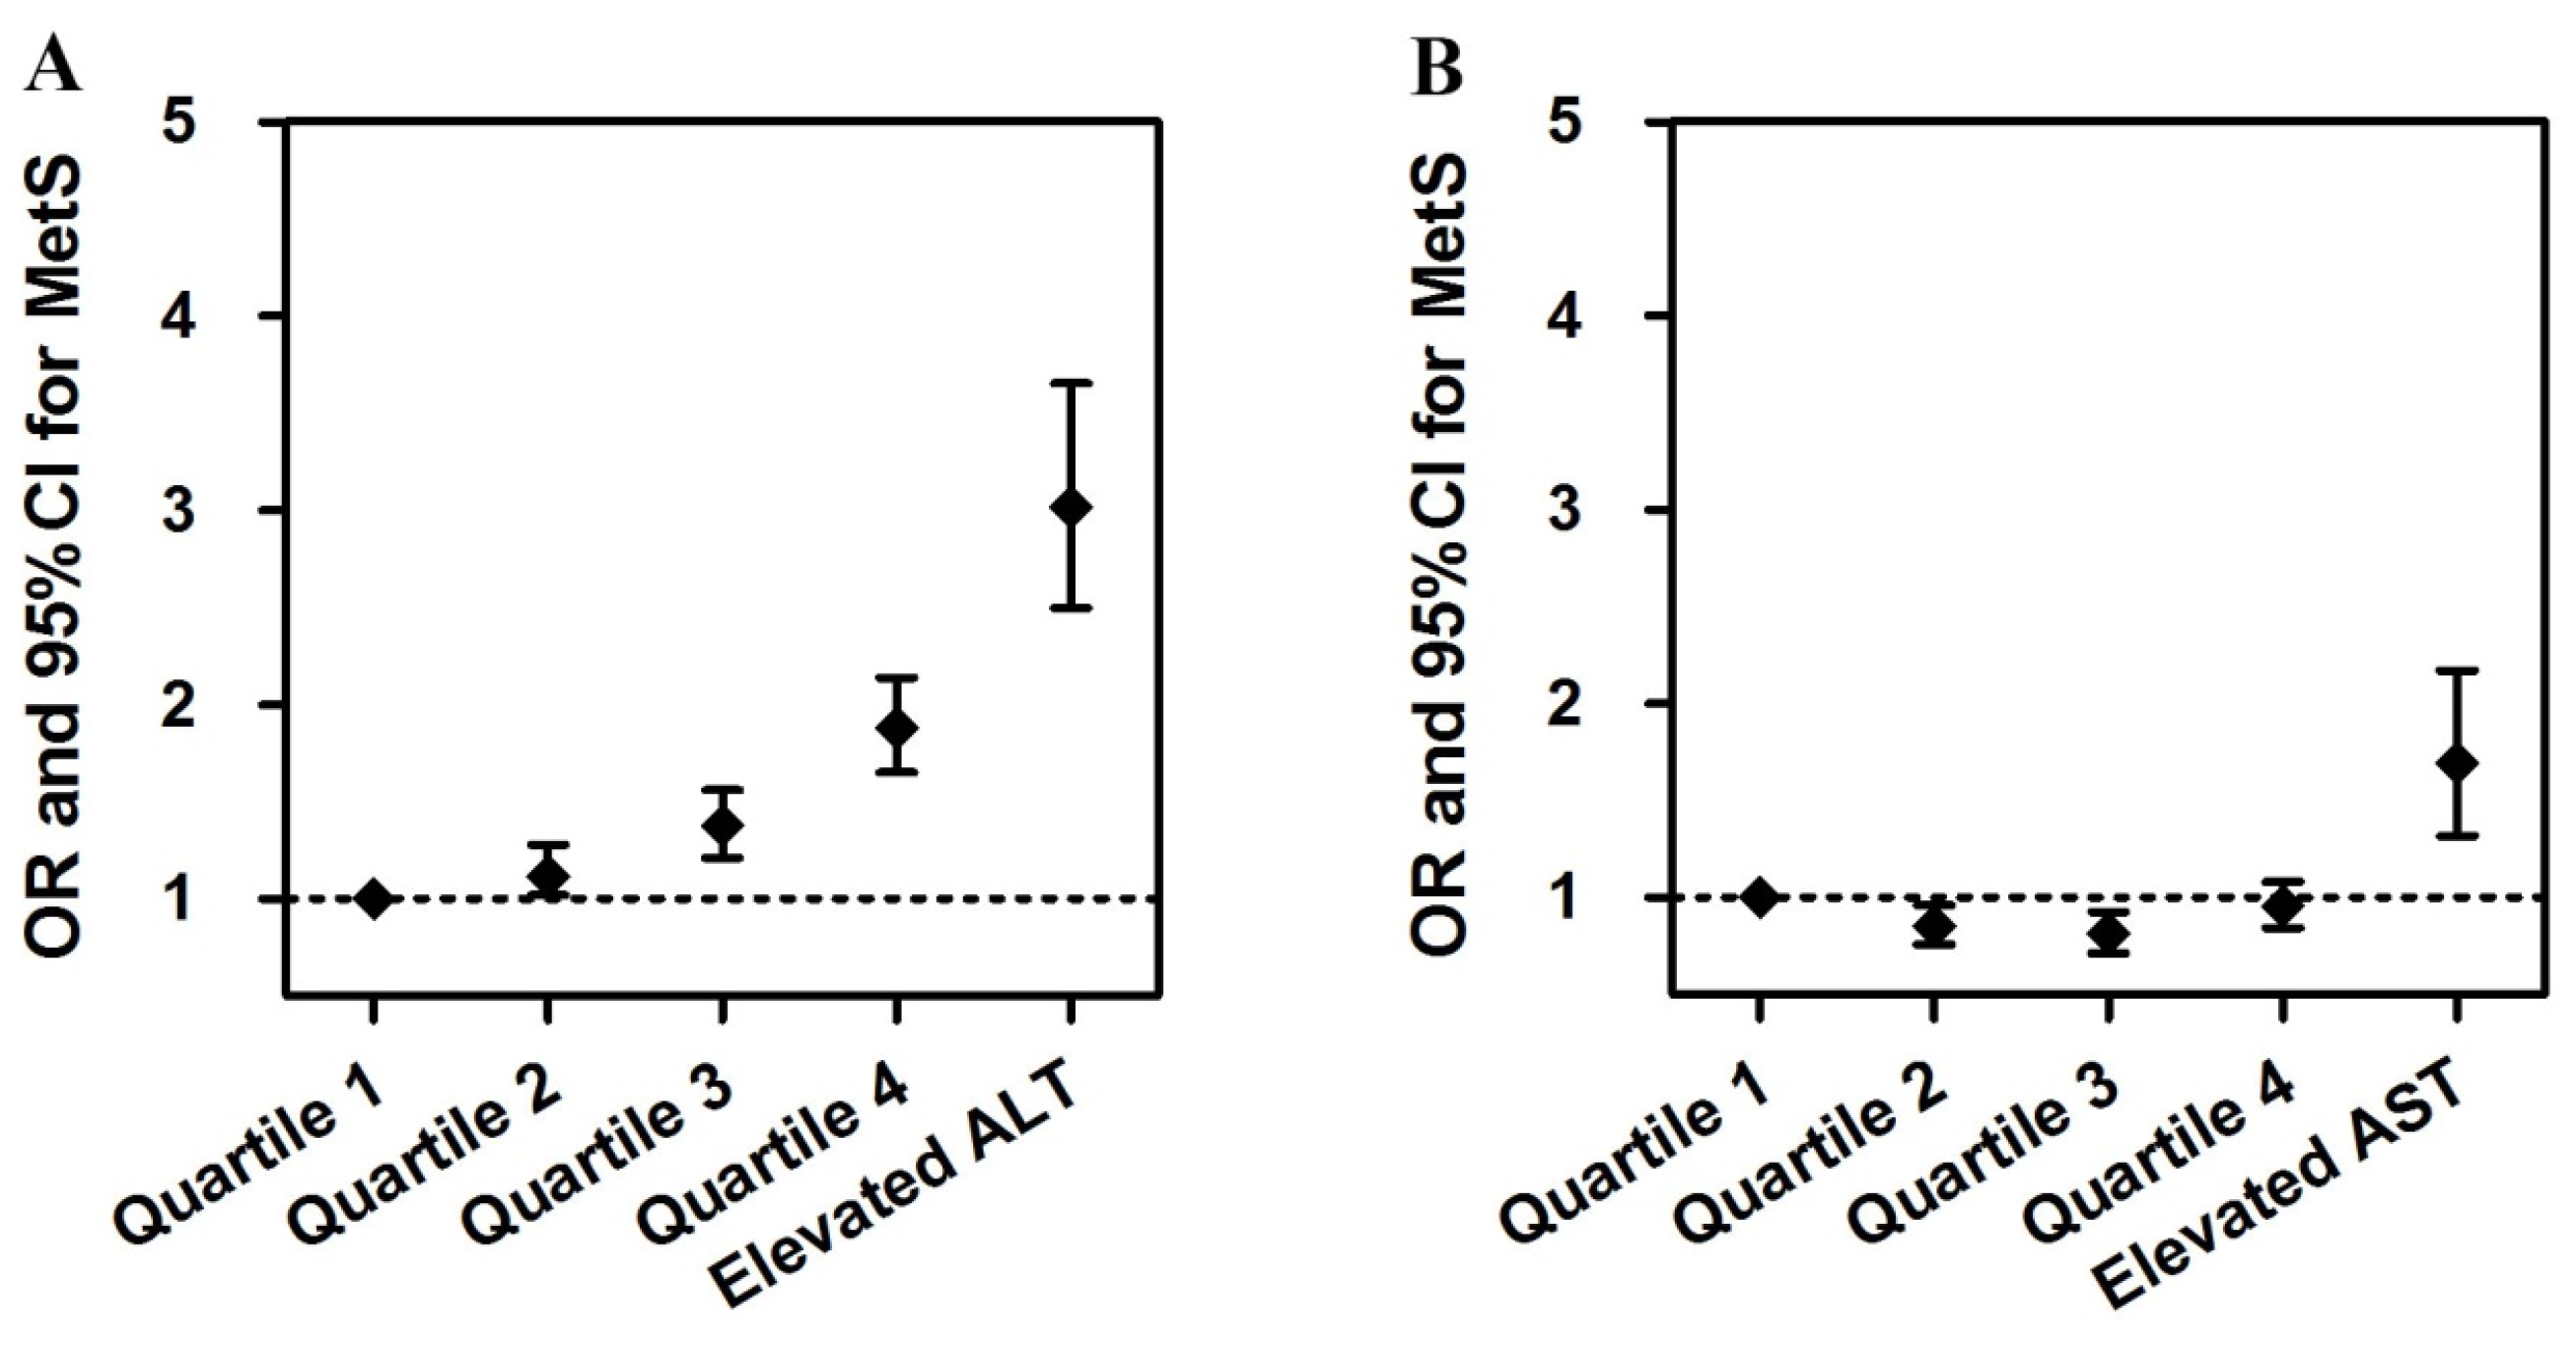
| Quartile 1 | 1 | —— | <0.001 * |
| Quartile 2 | 1.113 | 1.019–1.280 | 0.049 # |
| Quartile 3 | 1.375 | 1.212–1.560 | <0.001 * |
| Quartile 4 | 1.878 | 1.650–2.138 | <0.001 * |
| Elevated ALT | 3.020 | 2.496–3.653 | <0.001 * |
| Normal AST | |||
| Quartile 1 | 1 | —— | <0.001 * |
| Quartile 2 | 0.852 | 0.756–0.959 | 0.008 # |
| Quartile 3 | 0.813 | 0.713–0.926 | 0.002 # |
| Quartile 4 | 0.955 | 0.844–1.080 | 0.463 |
| Elevated AST | 1.689 | 1.314–2.171 | <0.001 * |
| Variables | ALT | AST | ||
|---|---|---|---|---|
| Pearson’s Coefficients | p-Value | Pearson’s Coefficients | p-Value | |
| BMI | 0.178 | <0.001 * | 0.038 | <0.001 * |
| WC | 0.201 | <0.001 * | 0.071 | <0.001 * |
| SBP | 0.047 | <0.001 * | 0.089 | <0.001 * |
| DBP | 0.111 | <0.001 * | 0.098 | <0.001 * |
| TG | 0.153 | <0.001 * | 0.09 | <0.001 * |
| HDL-C | −0.032 | 0.001 # | 0.139 | 0.223 |
| FPG | 0.055 | <0.001 * | 0.001 | 0.955 |
© 2016 by the authors; licensee MDPI, Basel, Switzerland. This article is an open access article distributed under the terms and conditions of the Creative Commons by Attribution (CC-BY) license (http://creativecommons.org/licenses/by/4.0/).
Share and Cite
Chen, S.; Guo, X.; Yu, S.; Zhou, Y.; Li, Z.; Sun, Y. Metabolic Syndrome and Serum Liver Enzymes in the General Chinese Population. Int. J. Environ. Res. Public Health 2016, 13, 223. https://doi.org/10.3390/ijerph13020223
Chen S, Guo X, Yu S, Zhou Y, Li Z, Sun Y. Metabolic Syndrome and Serum Liver Enzymes in the General Chinese Population. International Journal of Environmental Research and Public Health. 2016; 13(2):223. https://doi.org/10.3390/ijerph13020223
Chicago/Turabian StyleChen, Shuang, Xiaofan Guo, Shasha Yu, Ying Zhou, Zhao Li, and Yingxian Sun. 2016. "Metabolic Syndrome and Serum Liver Enzymes in the General Chinese Population" International Journal of Environmental Research and Public Health 13, no. 2: 223. https://doi.org/10.3390/ijerph13020223