
Ag Nanoparticles (Ag NM300K) in the Terrestrial Environment: Effects at Population and Cellular Level in Folsomia candida (Collembola)


Abstract
:1. Introduction
2. Experimental Section
2.1. Test Organism
2.2. Test Materials
2.3. Test Soil and Spiking
2.4. Test Procedure
2.4.1. Population Level—Standard Reproduction Test
2.4.2. Cellular Level—Oxidative Stress Biomarkers
2.5. Data analysis
3. Results
3.1. Materials Characterization
3.2. Biological Characterization
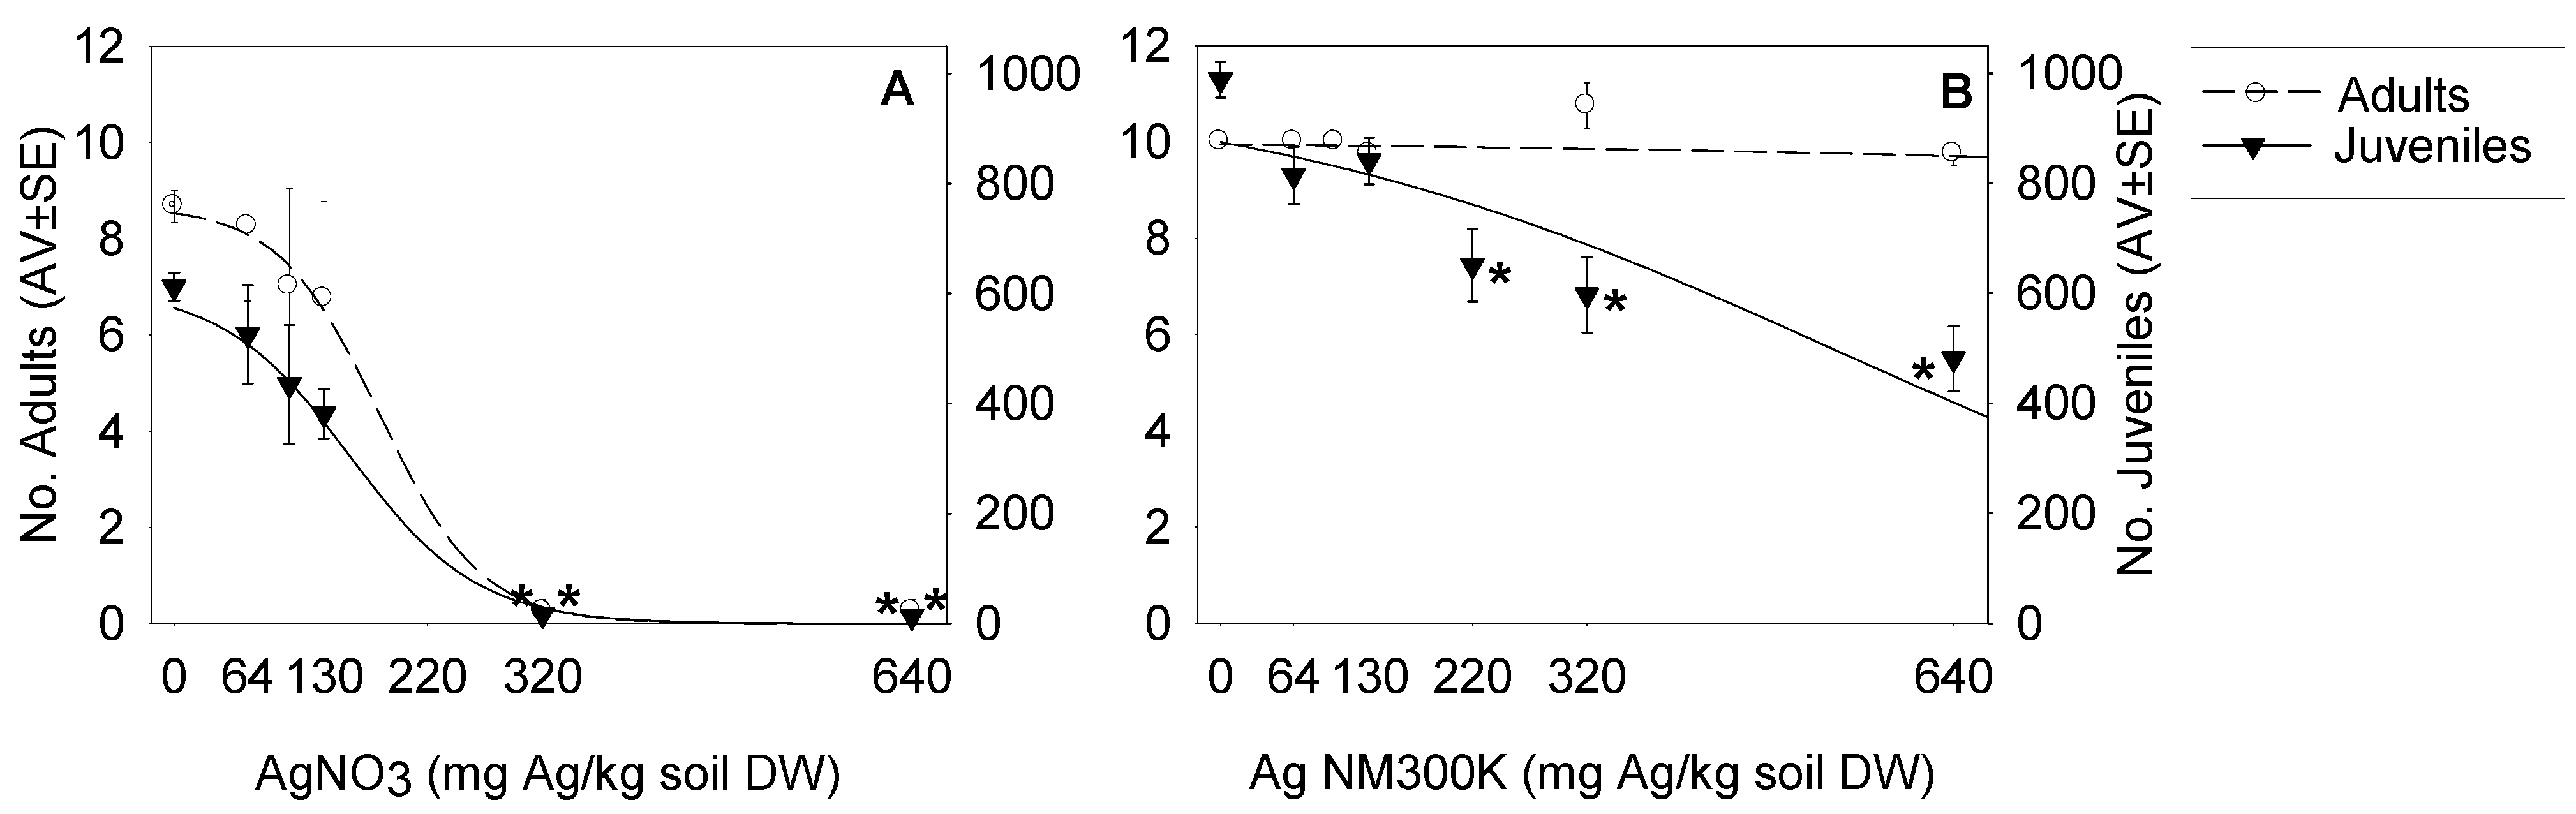
Population Level—Standard Reproduction Test


| Test Materials | EC10 (mg/kg) | EC20 (mg/kg) | EC50 (mg/kg) | EC80 (mg/kg) | Model and Parameters |
|---|---|---|---|---|---|
| Survival | |||||
| AgNO3 | 82 (20–162) | 118 (62–174) | 179 (77–280) | 240 (57–422) | Logistic 2 parameters (S:0.0057; Y0:8.7) |
| Ag NM300K | n.e. | n.e. | n.e. | n.e. | – |
| Reproduction | |||||
| AgNO3 | 31 (−35–97) | 76 (36–115) | 152 (108–196) | 228 (134–324) | Logistic 2 parameters (S:0.0045; Y0:610.0) |
| Ag NM300K | n.d. | 173 (70–277) | 540 (412–667) | 906 (653–1159) | Logistic 2 parameters (S:0.0009; Y0:988.3) |
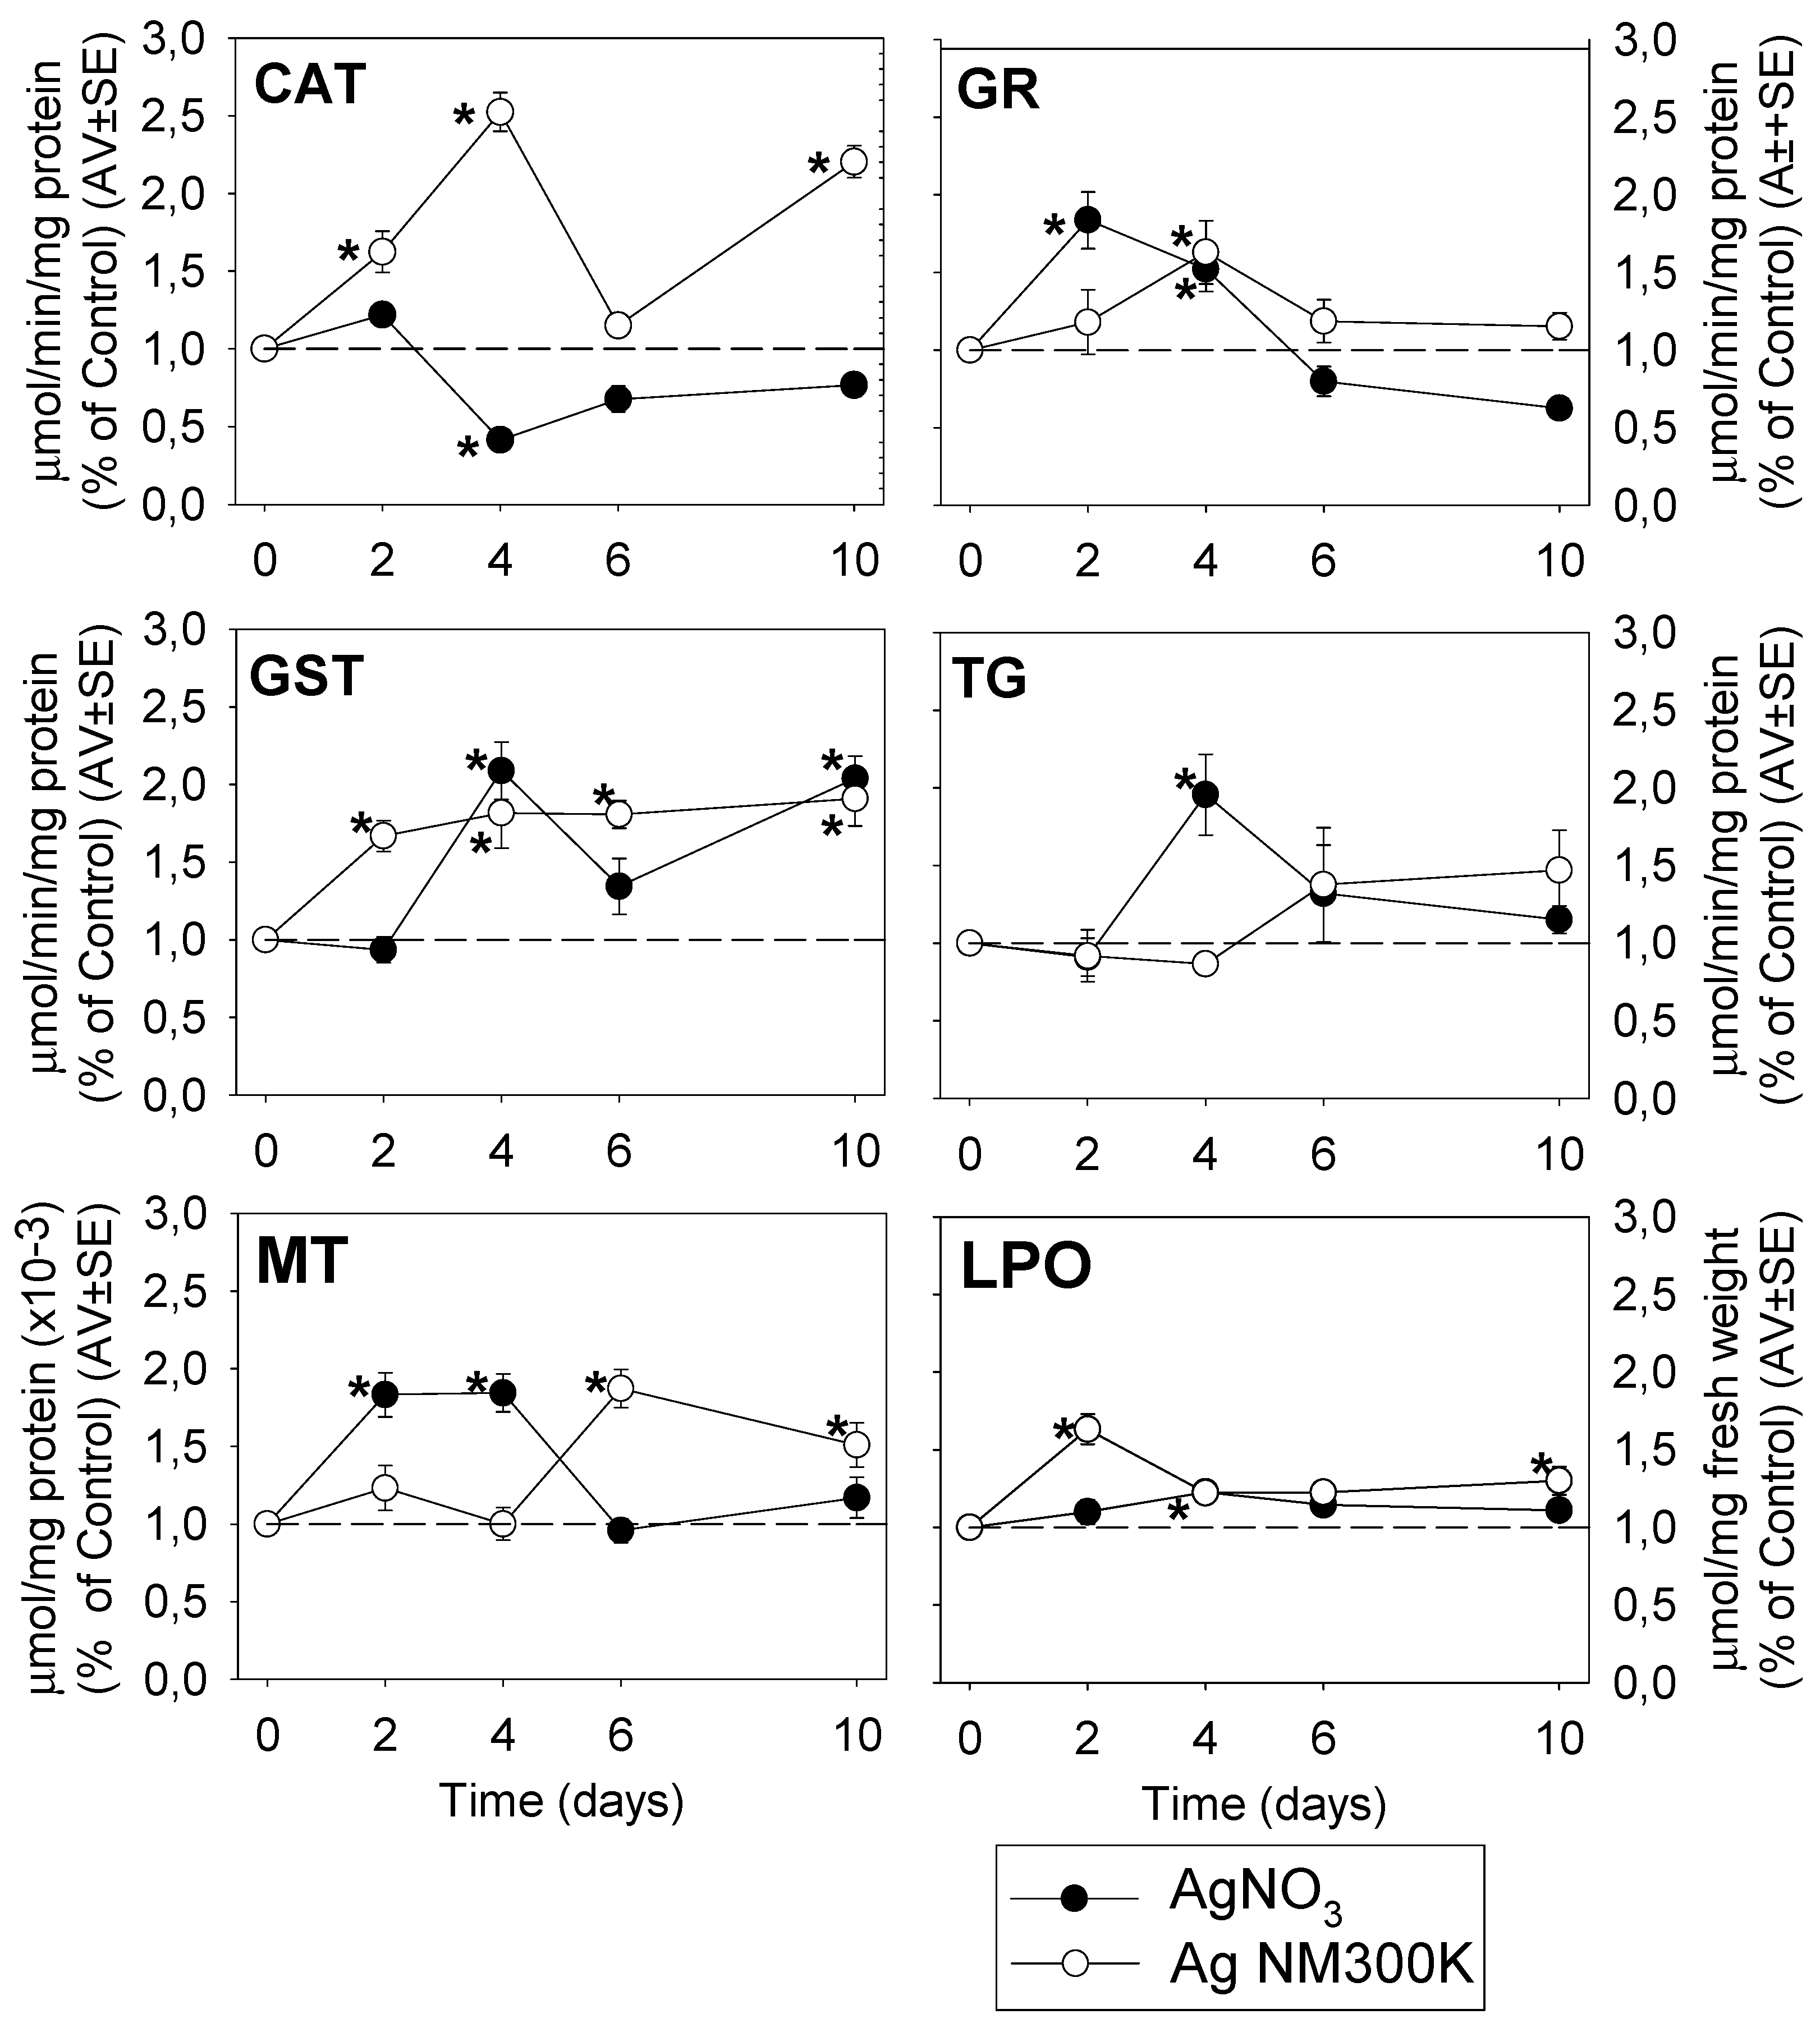
3.3. Cellular Level—Oxidative Stress Biomarkers
3.3.1. Univariate Analysis

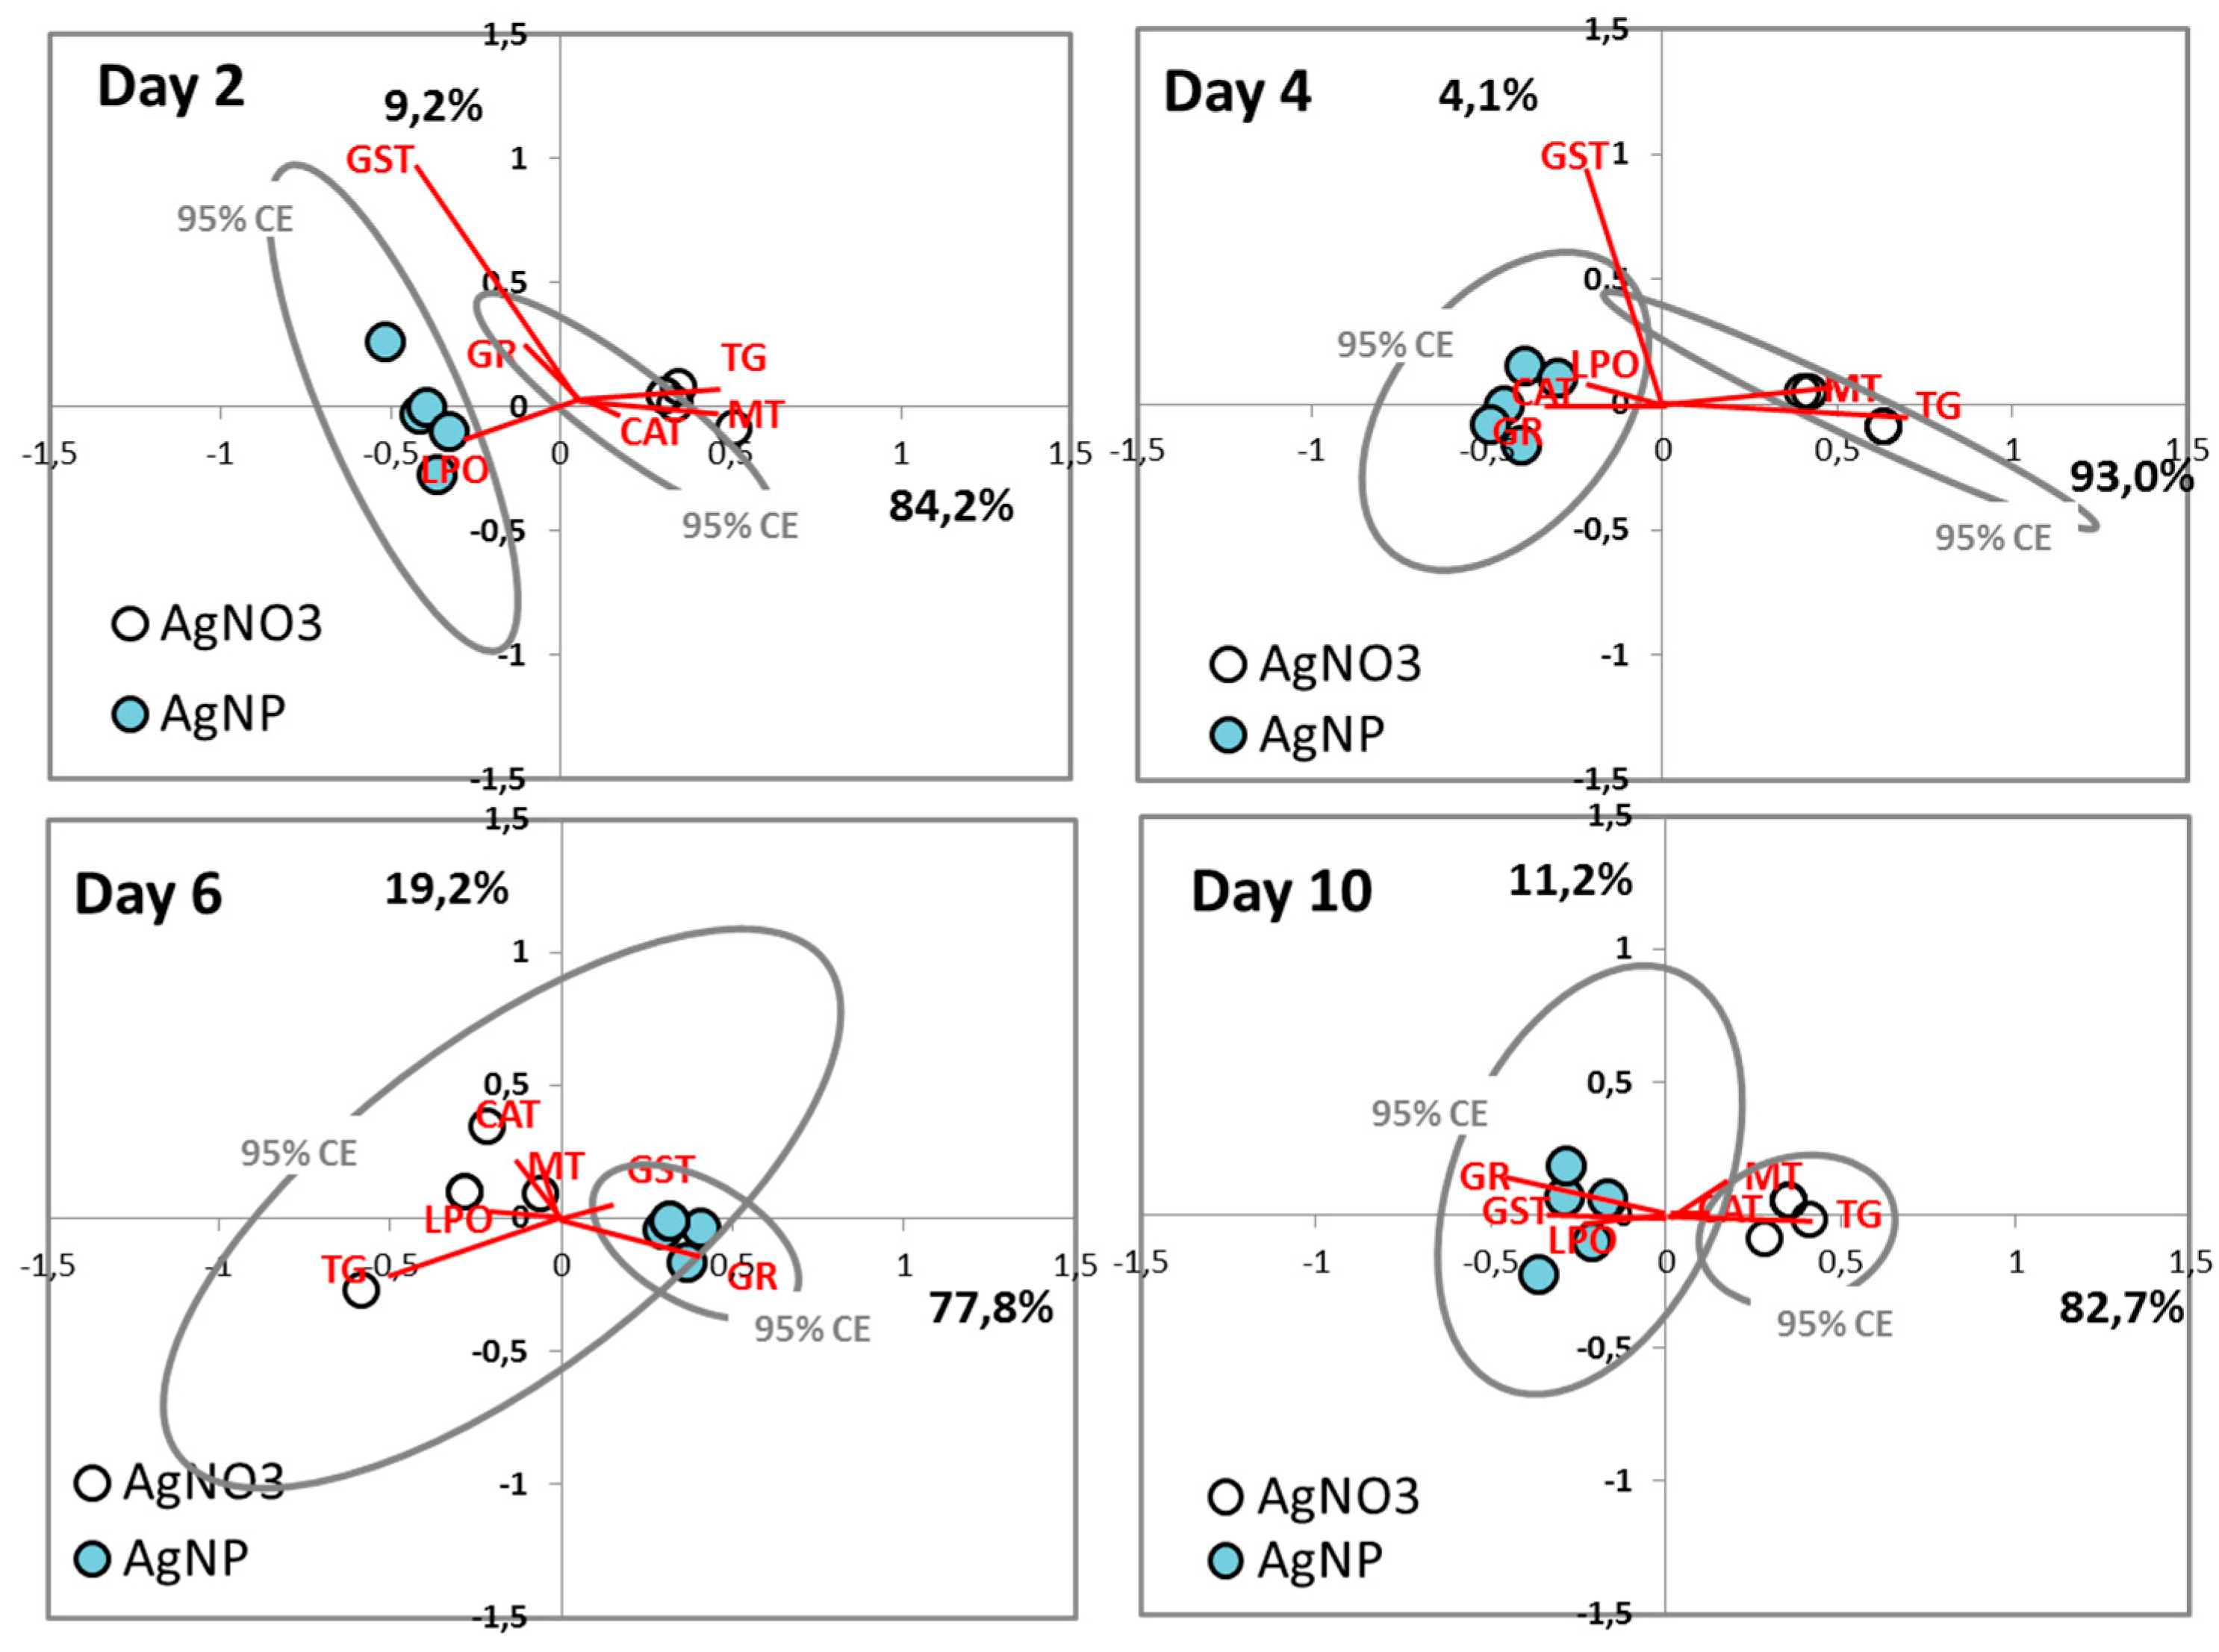
3.3.2. Multivariate Analysis

4. Discussion
4.1. Population Level
4.2. Cellular Level
4.2.1. AgNO3 Mechanisms
4.2.2. AgNP Mechanisms
4.2.3. Comparison of Ag Nano and Ag Salt Mechanisms
5. Conclusions
Acknowledgments
Author Contributions
Conflicts of Interest
References
- Gomes, S.I.L.; Hansen, D.; Scott-Fordsmand, J.J.; Amorim, M.J.B. Effects of silver nanoparticles to soil invertebrates: Oxidative stress biomarkers in Eisenia fetida. Environ. Pollut. 2015, 199, 49–55. [Google Scholar] [CrossRef] [PubMed]
- Scott-Fordsmand, J.J.; Pozzi-Mucelli, S.; Tran, L.; Aschberger, K.; Sabella, S.; Vogel, U.; Poland, C.; Balharry, D.; Fernandes, T.; Gottardo, S.; et al. A unified framework for nanosafety is needed. Nano Today 2014, 9, 546–549. [Google Scholar] [CrossRef]
- Hayashi, Y.; Engelmann, P.; Foldbjerg, R.; Szabó, M.; Somogyi, I.; Pollák, E.; Molnár, L.; Autrup, H.; Sutherland, D.S.; Scott-Fordsmand, J.; et al. Earthworms and Humans in vitro: Characterizing evolutionarily conserved stress and immune responses to silver nanoparticles. Environ. Sci. Technol. 2012, 46, 4166–4173. [Google Scholar] [CrossRef] [PubMed]
- Hayashi, Y.; Heckmann, L.-H.; Simonsen, V.; Scott-Fordsmand, J.J. Time-course profiling of molecular stress responses to silver nanoparticles in the earthworm Eisenia fetida. Ecotox. Environ. Safe. 2013, 98, 219–226. [Google Scholar] [CrossRef] [PubMed]
- Gomes, S.I.L.; Soares, A.M.V.M.; Scott-Fordsmand, J.J.; Amorim, M.J.B. Mechanisms of response to silver nanoparticles on Enchytraeus albidus (Oligochaeta): Survival, reproduction and gene expression profile. J. Hazard. Mater. 2013, 254–255, 336–344. [Google Scholar] [CrossRef] [PubMed]
- Schlich, K.; Klawonn, T.; Terytze, K.; Hund-Rinke, K. Effects of silver nanoparticles and silver nitrate in the earthworm reproduction test. Environ. Toxicol. Chem. 2013, 32, 181–188. [Google Scholar] [CrossRef] [PubMed]
- Tkalec, Ž.P.; Drobne, D.; Vogel-Mikuš, K.; Pongrac, P.; Regvar, M.; Štrus, J.; Pelicon, P.; Vavpetič, P.; Grlj, N.; Remškar, M. Micro-PIXE study of Ag in digestive glands of a nano-Ag fed arthropod (Porcellio scaber, Isopoda, Crustacea). Nucl. Instrum. Meth. B 2011, 269, 2286–2291. [Google Scholar]
- Waalewijn-Kool, P.L.; Klein, K.; Forniés, R.M.; van Gestel, C.A.M. Bioaccumulation and toxicity of silver nanoparticles and silver nitrate to the soil arthropod Folsomia candida. Ecotoxicology 2014, 23, 1629–1637. [Google Scholar] [CrossRef] [PubMed]
- Andrews, G.K. Regulation of metallothionein gene expression by oxidative stress and metal ions. Biochem. Pharmacol. 2000, 59, 95–104. [Google Scholar] [CrossRef]
- Valavanidis, A.; Vlahogianni, T.; Dassenakis, M.; Scoullos, M. Molecular biomarkers of oxidative stress in aquatic organisms in relation to toxic environmental pollutants. Ecotox. Environ. Safe. 2006, 64, 178–189. [Google Scholar] [CrossRef] [PubMed]
- Maria, V.L.; Ribeiro, M.J.; Amorim, M.J.B. Oxidative stress biomarkers and metallothionein in Folsomia candida—Responses to Cu and Cd. Environ. Res. 2014, 133, 164–169. [Google Scholar] [CrossRef] [PubMed]
- Gomes, S.I.L.; Novais, S.C.; Gravato, C.; Guilhermino, L.; Scott-Fordsmand, J.J.; Soares, A.M.V.M.; Amorim, M.J.B. Effect of Cu-nanoparticles versus one Cu-salt: Analysis of stress biomarkers response in Enchytraeus albidus (Oligochaeta). Nanotoxicology 2012, 6, 134–143. [Google Scholar] [CrossRef] [PubMed]
- Scott-Fordsmand, J.J.; Krogh, P.H. The influence of application form on the toxicity of nonylphenol to Folsomia fimetaria (Collembola: Isotomidae). Ecotox. Environ. Safe. 2004, 58, 294–299. [Google Scholar] [CrossRef]
- Amorim, M.J.B.; Römbke, J.; Scheffczyk, A.; Nogueira, A.J.A.; Soares, A.M.V.M. Effects of different soil types on the collembolans Folsomia candida and Hypogastrura assimilis using the herbicide phenmedipham. Arch. Environ. Con. Tox. 2005, 49, 343–352. [Google Scholar] [CrossRef]
- Nakamori, T.; Fujimori, A.; Kinoshita, K.; Ban-nai, T.; Kubota, Y.; Yoshida, S. mRNA expression of a cadmium-responsive gene is a sensitive biomarker of cadmium exposure in the soil collembolan Folsomia candida. Environ. Pollut. 2010, 158, 1689–1695. [Google Scholar] [CrossRef] [PubMed]
- Amorim, M.J.B.; Pereira, C.; Menezes-Oliveira, V.B.; Campos, B.; Soares, A.M.V.M.; Loureiro, S. Assessing single and joint effects of chemicals on the survival and reproduction of Folsomia candida (Collembola) in soil. Environ. Pollut. 2012, 160, 145–152. [Google Scholar] [CrossRef] [PubMed]
- Waalewijn-Kool, P.L.; Ortiz, M.D.; Lofts, S.; van Gestel, C.A.M. The effect of pH on the toxicity of ZnO nanoparticles to Folsomia candida in amended field soil. Environ. Toxicol. Chem. 2013, 32, 2349–2355. [Google Scholar] [CrossRef] [PubMed]
- Waalewijn-Kool, P.L.; Diez Ortiz, M.; van Straalen, N.M.; van Gestel, C.A.M. Sorption, dissolution and pH determine the long-term equilibration and toxicity of coated and uncoated ZnO nanoparticles in soil. Environ. Pollut. 2013, 178, 59–64. [Google Scholar] [CrossRef] [PubMed]
- Soil Quality—Inhibition of Reproduction of Collembola (Folsomia candida) by Soil Contaminants. Available online: http://www.iso.org/iso/catalogue_detail.htm?csnumber=57582 (accessed on 12 August 2015).
- Klein, C.L.; Stahlmecke, B.; Romazanov, J.; Kuhlbusch, T.A.J.; Van Doren, E.; De Temmerman, P.-J.; Mast, J.; Wick, P.; Krug, H.; Locoro, G.; et al. NM-Series of Representative Manufactured Nanomaterials NM-300 Silver Characterisation, Stability, Homogeneity; Publications Office of the European Union: Luxembourg, Luxembourg, 2011. [Google Scholar]
- Sigmaplot Overview. Available online: http://www.sigmaplot.com/products/sigmaplot/sigmaplot-details.php (accessed on 12 August 2015).
- Fecht, M.; Consulting, P.; Dhillon, R.; Consulting, D. SAS Enterprise Guide 5.1: A Powerful Environment for Programmers, Too! SAS Institute Inc.: Cary, NC, USA, 2012. [Google Scholar]
- Kool, P.L.; Ortiz, M.D.; van Gestel, C.A.M. Chronic toxicity of ZnO nanoparticles, non-nano ZnO and ZnCl2 to Folsomia candida (Collembola) in relation to bioavailability in soil. Environ. Pollut. 2011, 159, 2713–2719. [Google Scholar] [CrossRef] [PubMed]
- Heckmann, L.-H.; Hovgaard, M.B.; Sutherland, D.S.; Autrup, H.; Besenbacher, F.; Scott-Fordsmand, J.J. Limit-test toxicity screening of selected inorganic nanoparticles to the earthworm Eisenia fetida. Ecotoxicology 2010, 20, 226–233. [Google Scholar] [CrossRef] [PubMed]
- Shoults-Wilson, W.A.; Reinsch, B.C.; Tsyusko, O.V.; Bertsch, P.M.; Lowry, G.V.; Unrine, J.M. Effect of silver nanoparticle surface coating on bioaccumulation and reproductive toxicity in earthworms (Eisenia fetida). Nanotoxicology 2011, 5, 432–444. [Google Scholar] [CrossRef] [PubMed]
- Van der Ploeg, M.J.C.; Handy, R.D.; Waalewijn-Kool, P.L.; van den Berg, J.H.J.; Herrera Rivera, Z.E.; Bovenschen, J.; Molleman, B.; Baveco, J.M.; Tromp, P.; Peters, R.J.B.; et al. Effects of silver nanoparticles (NM-300K) on Lumbricus rubellus earthworms and particle characterization in relevant test matrices including soil: Silver nanoparticles affect Lumbricus rubellus earthworms. Environ. Toxicol. Chem. 2014, 33, 743–752. [Google Scholar] [CrossRef] [PubMed]
- Nair, P.M.G.; Park, S.Y.; Choi, J. Evaluation of the effect of silver nanoparticles and silver ions using stress responsive gene expression in Chironomus riparius. Chemosphere 2013, 92, 592–599. [Google Scholar] [CrossRef] [PubMed]
- Atli, G.; Alptekin, Ö.; Tükel, S.; Canli, M. Response of catalase activity to Ag+, Cd2+, Cr6+, Cu2+ and Zn2+ in five tissues of freshwater fish Oreochromis niloticus. Comp. Biochem. Phys. C 2006, 143, 218–224. [Google Scholar]
- Behra, R.; Sigg, L.; Clift, M.J.D.; Herzog, F.; Minghetti, M.; Johnston, B.; Petri-Fink, A.; Rothen-Rutishauser, B. Bioavailability of silver nanoparticles and ions: From a chemical and biochemical perspective. J. R. Soc. Interface 2013, 10, 20130396. [Google Scholar] [CrossRef] [PubMed]
- Leung, B.O.; Jalilehvand, F.; Mah, V.; Parvez, M.; Wu, Q. Silver(I) Complex Formation with Cysteine, Penicillamine, and Glutathione. Inorg. Chem. 2013, 52, 4593–4602. [Google Scholar] [CrossRef] [PubMed]
- Reidy, B.; Haase, A.; Luch, A.; Dawson, K.; Lynch, I. Mechanisms of Silver Nanoparticle Release, Transformation and Toxicity: A Critical Review of Current Knowledge and Recommendations for Future Studies and Applications. Materials 2013, 6, 2295–2350. [Google Scholar] [CrossRef]
- Hayes, J.D.; Flanagan, J.U.; Jowsey, I.R. Glutathione transferases. Annu. Rev. Pharmacol. Toxicol. 2005, 45, 51–88. [Google Scholar] [CrossRef] [PubMed]
- Hellou, J.; Ross, N.W.; Moon, T.W. Glutathione, glutathione S-transferase, and glutathione conjugates, complementary markers of oxidative stress in aquatic biota. Environ. Sci. Pollut. Res. 2012, 19, 2007–2023. [Google Scholar] [CrossRef] [PubMed]
- Brulle, F.; Mitta, G.; Leroux, R.; Lemière, S.; Leprêtre, A.; Vandenbulcke, F. The strong induction of metallothionein gene following cadmium exposure transiently affects the expression of many genes in Eisenia fetida: A trade-off mechanism? Comp. Biochem. Phys. C 2007, 144, 334–341. [Google Scholar] [CrossRef] [PubMed]
- Géret, F.; Jouan, A.; Turpin, V.; Bebianno, M.J.; Cosson, R.P. Influence of metal exposure on metallothionein synthesis and lipid peroxidation in two bivalve mollusks: the oyster (Crassostrea gigas) and the mussel (Mytilus edulis). Aquat. Living Resour. 2002, 15, 61–66. [Google Scholar] [CrossRef]
- Krug, H.F.; Wick, P. Nanotoxicology: An Interdisciplinary Challenge. Angew. Chem. Int. Ed. 2011, 50, 1260–1278. [Google Scholar] [CrossRef] [PubMed]
- Saptarshi, S.R.; Duschl, A.; Lopata, A.L. Interaction of Nanoparticles with Proteins: Relation to Bio-Reactivity of the nAnoparticle. Available online: http://www.biomedcentral.com/content/pdf/1477-3155-11-26.pdf (accessed on 12 August 2015).
- Hayashi, Y.; Miclaus, T.; Scavenius, C.; Kwiatkowska, K.; Sobota, A.; Engelmann, P.; Scott-Fordsmand, J.J.; Enghild, J.J.; Sutherland, D.S. Species Differences Take Shape at Nanoparticles: Protein Corona Made of the Native Repertoire Assists Cellular Interaction. Environ. Sci. Technol. 2013, 47, 14367–14375. [Google Scholar] [CrossRef] [PubMed]
- McShan, D.; Ray, P.C.; Yu, H. Molecular toxicity mechanism of nanosilver. J. Food Drug Anal. 2014, 22, 116–127. [Google Scholar] [CrossRef] [PubMed]
- Markovic, J.; García-Gimenez, J.L.; Gimeno, A.; Viña, J.; Pallardó, F.V. Role of glutathione in cell nucleus. Free Radical Res. 2010, 44, 721–733. [Google Scholar] [CrossRef] [PubMed]
- García-Giménez, J.L.; Markovic, J.; Dasí, F.; Queval, G.; Schnaubelt, D.; Foyer, C.H.; Pallardó, F.V. Nuclear glutathione. Biochim. Biophys. Acta 2013, 1830, 3304–3316. [Google Scholar] [CrossRef] [PubMed]
- Kittler, S.; Greulich, C.; Diendorf, J.; Köller, M.; Epple, M. Toxicity of Silver Nanoparticles Increases during Storage Because of Slow Dissolution under Release of Silver Ions. Chem. Mater. 2010, 22, 4548–4554. [Google Scholar] [CrossRef]
- Notter, D.A.; Mitrano, D.M.; Nowack, B. Are nanosized or dissolved metals more toxic in the environment? A meta-analysis: Are nanosized or dissolved metals more ecotoxic? Environ. Toxicol. Chem. 2014, 33, 2733–2739. [Google Scholar] [CrossRef] [PubMed]
- Kaveh, R.; Li, Y.-S.; Ranjbar, S.; Tehrani, R.; Brueck, C.L.; Van Aken, B. Changes in Arabidopsis thaliana Gene Expression in Response to Silver Nanoparticles and Silver Ions. Environ. Sci. Technol. 2013, 47, 10637–10644. [Google Scholar] [PubMed]
- Buffet, P.-E.; Zalouk-Vergnoux, A.; Châtel, A.; Berthet, B.; Métais, I.; Perrein-Ettajani, H.; Poirier, L.; Luna-Acosta, A.; Thomas-Guyon, H.; Risso-de Faverney, C.; et al. A marine mesocosm study on the environmental fate of silver nanoparticles and toxicity effects on two endobenthic species: The ragworm Hediste diversicolor and the bivalve mollusc Scrobicularia plana. Sci. Total Environ. 2014, 470–471, 1151–1159. [Google Scholar] [CrossRef] [PubMed]
© 2015 by the authors; licensee MDPI, Basel, Switzerland. This article is an open access article distributed under the terms and conditions of the Creative Commons Attribution license (http://creativecommons.org/licenses/by/4.0/).
Share and Cite
Mendes, L.A.; Maria, V.L.; Scott-Fordsmand, J.J.; Amorim, M.J.B. Ag Nanoparticles (Ag NM300K) in the Terrestrial Environment: Effects at Population and Cellular Level in Folsomia candida (Collembola). Int. J. Environ. Res. Public Health 2015, 12, 12530-12542. https://doi.org/10.3390/ijerph121012530
Mendes LA, Maria VL, Scott-Fordsmand JJ, Amorim MJB. Ag Nanoparticles (Ag NM300K) in the Terrestrial Environment: Effects at Population and Cellular Level in Folsomia candida (Collembola). International Journal of Environmental Research and Public Health. 2015; 12(10):12530-12542. https://doi.org/10.3390/ijerph121012530
Chicago/Turabian StyleMendes, Luís André, Vera L. Maria, Janeck J. Scott-Fordsmand, and Mónica J. B. Amorim. 2015. "Ag Nanoparticles (Ag NM300K) in the Terrestrial Environment: Effects at Population and Cellular Level in Folsomia candida (Collembola)" International Journal of Environmental Research and Public Health 12, no. 10: 12530-12542. https://doi.org/10.3390/ijerph121012530