Article

An Analysis of the Effects of Large Wildfires on the Hydrology of Three Small Catchments in Central Chile Using Tritium-Based Measurements and Hydrological Metrics

by
Francisco Balocchi
1,2,*,
Diego Rivera
3,4,
José Luis Arumi
4,5,
Uwe Morgenstern
6,
Donald A. White
7,8,
Richard P. Silberstein
8,9,10 and
Pablo Ramírez de Arellano
1
1
Bioforest SA, Camino a Coronel s/n km 15, Coronel 4190000, Chile
2
Water Resources and Energy for Agriculture PhD Program, Water Resources Department, Universidad de Concepción, Chillán 3812120, Chile
3
Centro de Sustentabilidad y Gestión Estratégica de Recursos (CiSGER), Facultad de Ingeniería, Universidad del Desarrollo, Santiago 7760609, Chile
4
CHRIAM Water Center ANID/FONDAP/15130015, Universidad de Concepción, Chillán 3812120, Chile
5
Department of Water Resources, Faculty of Agriculture Engineering, Universidad de Concepción, Chillán 3812120, Chile
6
Isotope Hydrology & Water Dating Lab, GNS Science, Lower Hutt 5040, New Zealand
7
Whitegum Forest and Natural Resources Pty. Ltd., Midland, WA 6056, Australia
8
School of Science, Edith Cowan University, Joondalup, WA 6027, Australia
9
Hydrological and Environmental Scientific Solutions Pty Ltd., Perth, WA 6872, Australia
10
School of Agriculture and Environment, University of Western Australia, Crawley, WA 6009, Australia
*
Author to whom correspondence should be addressed.
Hydrology 2022, 9(3), 45; https://doi.org/10.3390/hydrology9030045
Submission received: 14 February 2022 / Revised: 4 March 2022 / Accepted: 6 March 2022 / Published: 9 March 2022
(This article belongs to the Section Hydrological Measurements and Instrumentation)

Abstract

:
Wildfires are an important disturbance affecting catchments’ soil and hydrological processes within. Wildfires are predicted to increase in both frequency and severity under climate change. Here, we present measurements of tritium (3H) in surface water of three streams before and after the ‘las Máquinas’ megafire of January 2017 in central Chile and streamflow metrics. Mean transit times (MTTs) of water were calculated in three coastal catchments with the Mediterranean climate type, covered by native forest, a mixture of native forest and Pinus radiata D. Don, and P. radiata. Lumped parameter models (LPMs) were used to obtain MTTs. Tritium activities from 2012 to 2018 ranged from 0.597 to 0.927 Tritium Units (TU), with the lowest TU activity in 2018. These 3H concentrations indicated water ages from 5 to 30 years. Following the fire, peak flows and baseflow have increased in two catchments but decreased in the third. Even though we have seen changes in the hydrological responses within the three catchments, pre- and post-fire MTT values were not significantly different. Therefore, there is no conclusive evidence of hydrological changes at the groundwater level due to wildfire at this early stage. However, since the MTT ranges from 5 to 30 years, it is likely that more time is required for the changes in the hydrograph to be clearly reflected in the tritium signal even though there are noticeable changes in streamflow metrics such as runoff and baseflow. Within the following years from this study, a sampling schedule to continue to investigate both the long-term drought and the effect of wildfire on these catchments will be maintained.

1. Introduction

Management of the effect of fires on the supply of water to regional communities requires knowledge of their effect on forest structure, soils, and hydrogeology and on the local and regional water balance. In January of 2017, wildfires burned a few more than 550,000 hectares of mostly forested land in Central Chile [1]. The most intense and damaging fires occurred in the Maule Valley, east of the coastal city of Constitución, and have become known as the Las Máquinas fires. While they were historically severe, it is expected that climate change will further increase the frequency and intensity of wildfires in Central Chile [2,3]. These fires occurred principally in the coastal range of Central Chile. The Coastal mountains, while not particularly high, are a steep and rugged landscape that is forested and dotted with small, rural communities. The forests are a combination of commercial plantations of Pinus radiata and Eucalyptus spp. and the fragmented and vulnerable Roble-Hualo native forest which is named after the deciduous Nothofagus species that dominate the overstorey. The plantations provide employment for rural Chileans while the native forest has high conservation value. The water that flows to the Maule River is a regionally important supply of drinking water and irrigation and is important to the many rural communities in the ranges.
The effect of fire on water balance depends upon the combination of many factors, including the rainfall regime before and after the fire and the effects of the fire on vegetation and the soil micro- and macro-structure. Central Chile, where the fires occurred, has a Mediterranean climate with an annual dry season extending from November to March or April. The 8 months that preceded the fires were unusually dry, in particular between July and October. The lack of the winter rains and a very hot start in January created the risk of severe fire conditions [4]. The climatic conditions that increased the fire risk also created a dry catchment with historically low moisture storage [5]. The fires further changed the local controls on the water balance by causing a rapid change in leaf area and, therefore, transpiration and interception [6,7,8]. The combined effect of this period of drying, followed by a rapid reduction of cover may have caused complex and hard to predict changes in catchment storage and hydrology. Therefore, understanding these hydrological changes after fires is a key factor in water resources management [9].
One measure of the hydrological behavior within a catchment is the Mean Transit Time (MTT) of water. MTT is the average time of a water molecule traveling through a catchment, from when it enters the system to when it exits at any point in the stream as discharge [10]. Therefore, MTT integrates all the hydrologic processes in a single measure of catchment behavior. Tritium activity (TU, where 1 TU represents a 3H/1H ratio of 10−18) in water has been used to estimate the MTT of water in forested catchments worldwide (e.g., [11,12]). This has improved the understanding of how, and from which sources, the hydrological system is recharged (e.g., [13]). To date, tritium has not been used to investigate changes in MTT after a wildfire or in forested catchments in Mediterranean climate areas, such as drought-prone Central Chile. As noted above, fire destroys or damages the canopy, can change soil water repellency, and can open or close soil macropores. Combined, these changes may result in profound hydrologic change and affect the rate of groundwater recharge, streamflow, baseflow, and soil moisture storage [14]. Moreover, extremely dry conditions lead to decreasing stored groundwater and soil water [5] and interact with the fire in the affected catchment. How these hydrological processes interact to reach a new state depends on each catchment, but site monitoring, water age estimation, residence time, and hydrological models are all helpful to support observations and planning.
As well as affecting the vegetation, and therefore transpiration and throughfall, wildfire can also alter important soil properties that can have implications for the water cycle [15]. Commonly reported changes after a fire include an increase in peak flows and storm flows and a severe reduction in baseflow, baseflow recession, and low flow [16,17]. These changes in streamflow generation processes have been attributed to the formation of a hydrophobic layer [18] or soil sealing [19]. There have been a large number of investigations of the effect of fire on streamflow dynamics (e.g., [20,21]) that have applied a range of methods including cluster and regression analysis [22], runoff generation at hillslope scale [23], chemical analysis for groundwater interaction [24], geochemical and end-member mixing analysis [25], isotope mass balance methods [26], catchment runoff modelling (e.g., [27]), and paired catchment experiments [28,29].
While there have been many studies of the effects of fire on forest hydrology, to date, none of these have related the concentration of tritium to pre- and post-fire streamflow. McDonnell et al. [30] discussed the limitations of standard hydrography and hydrometric for understanding sub-soil hydrological processes. McDonnell and Beven [31] argued for the use of tracers in hydrology to complement hydrometrics and allow the more complete investigation of changes to hydrological processes caused by disturbances such as wildfire. Thus, this paper aims to (i) determine if we can detect changes of catchment groundwater water transit that may be ascribed to the impact of the fires, and (ii) unveil changes in hydrologic variables (i.e., runoff and baseflow). Within the area that was burnt in January 2017 in Central Chile [
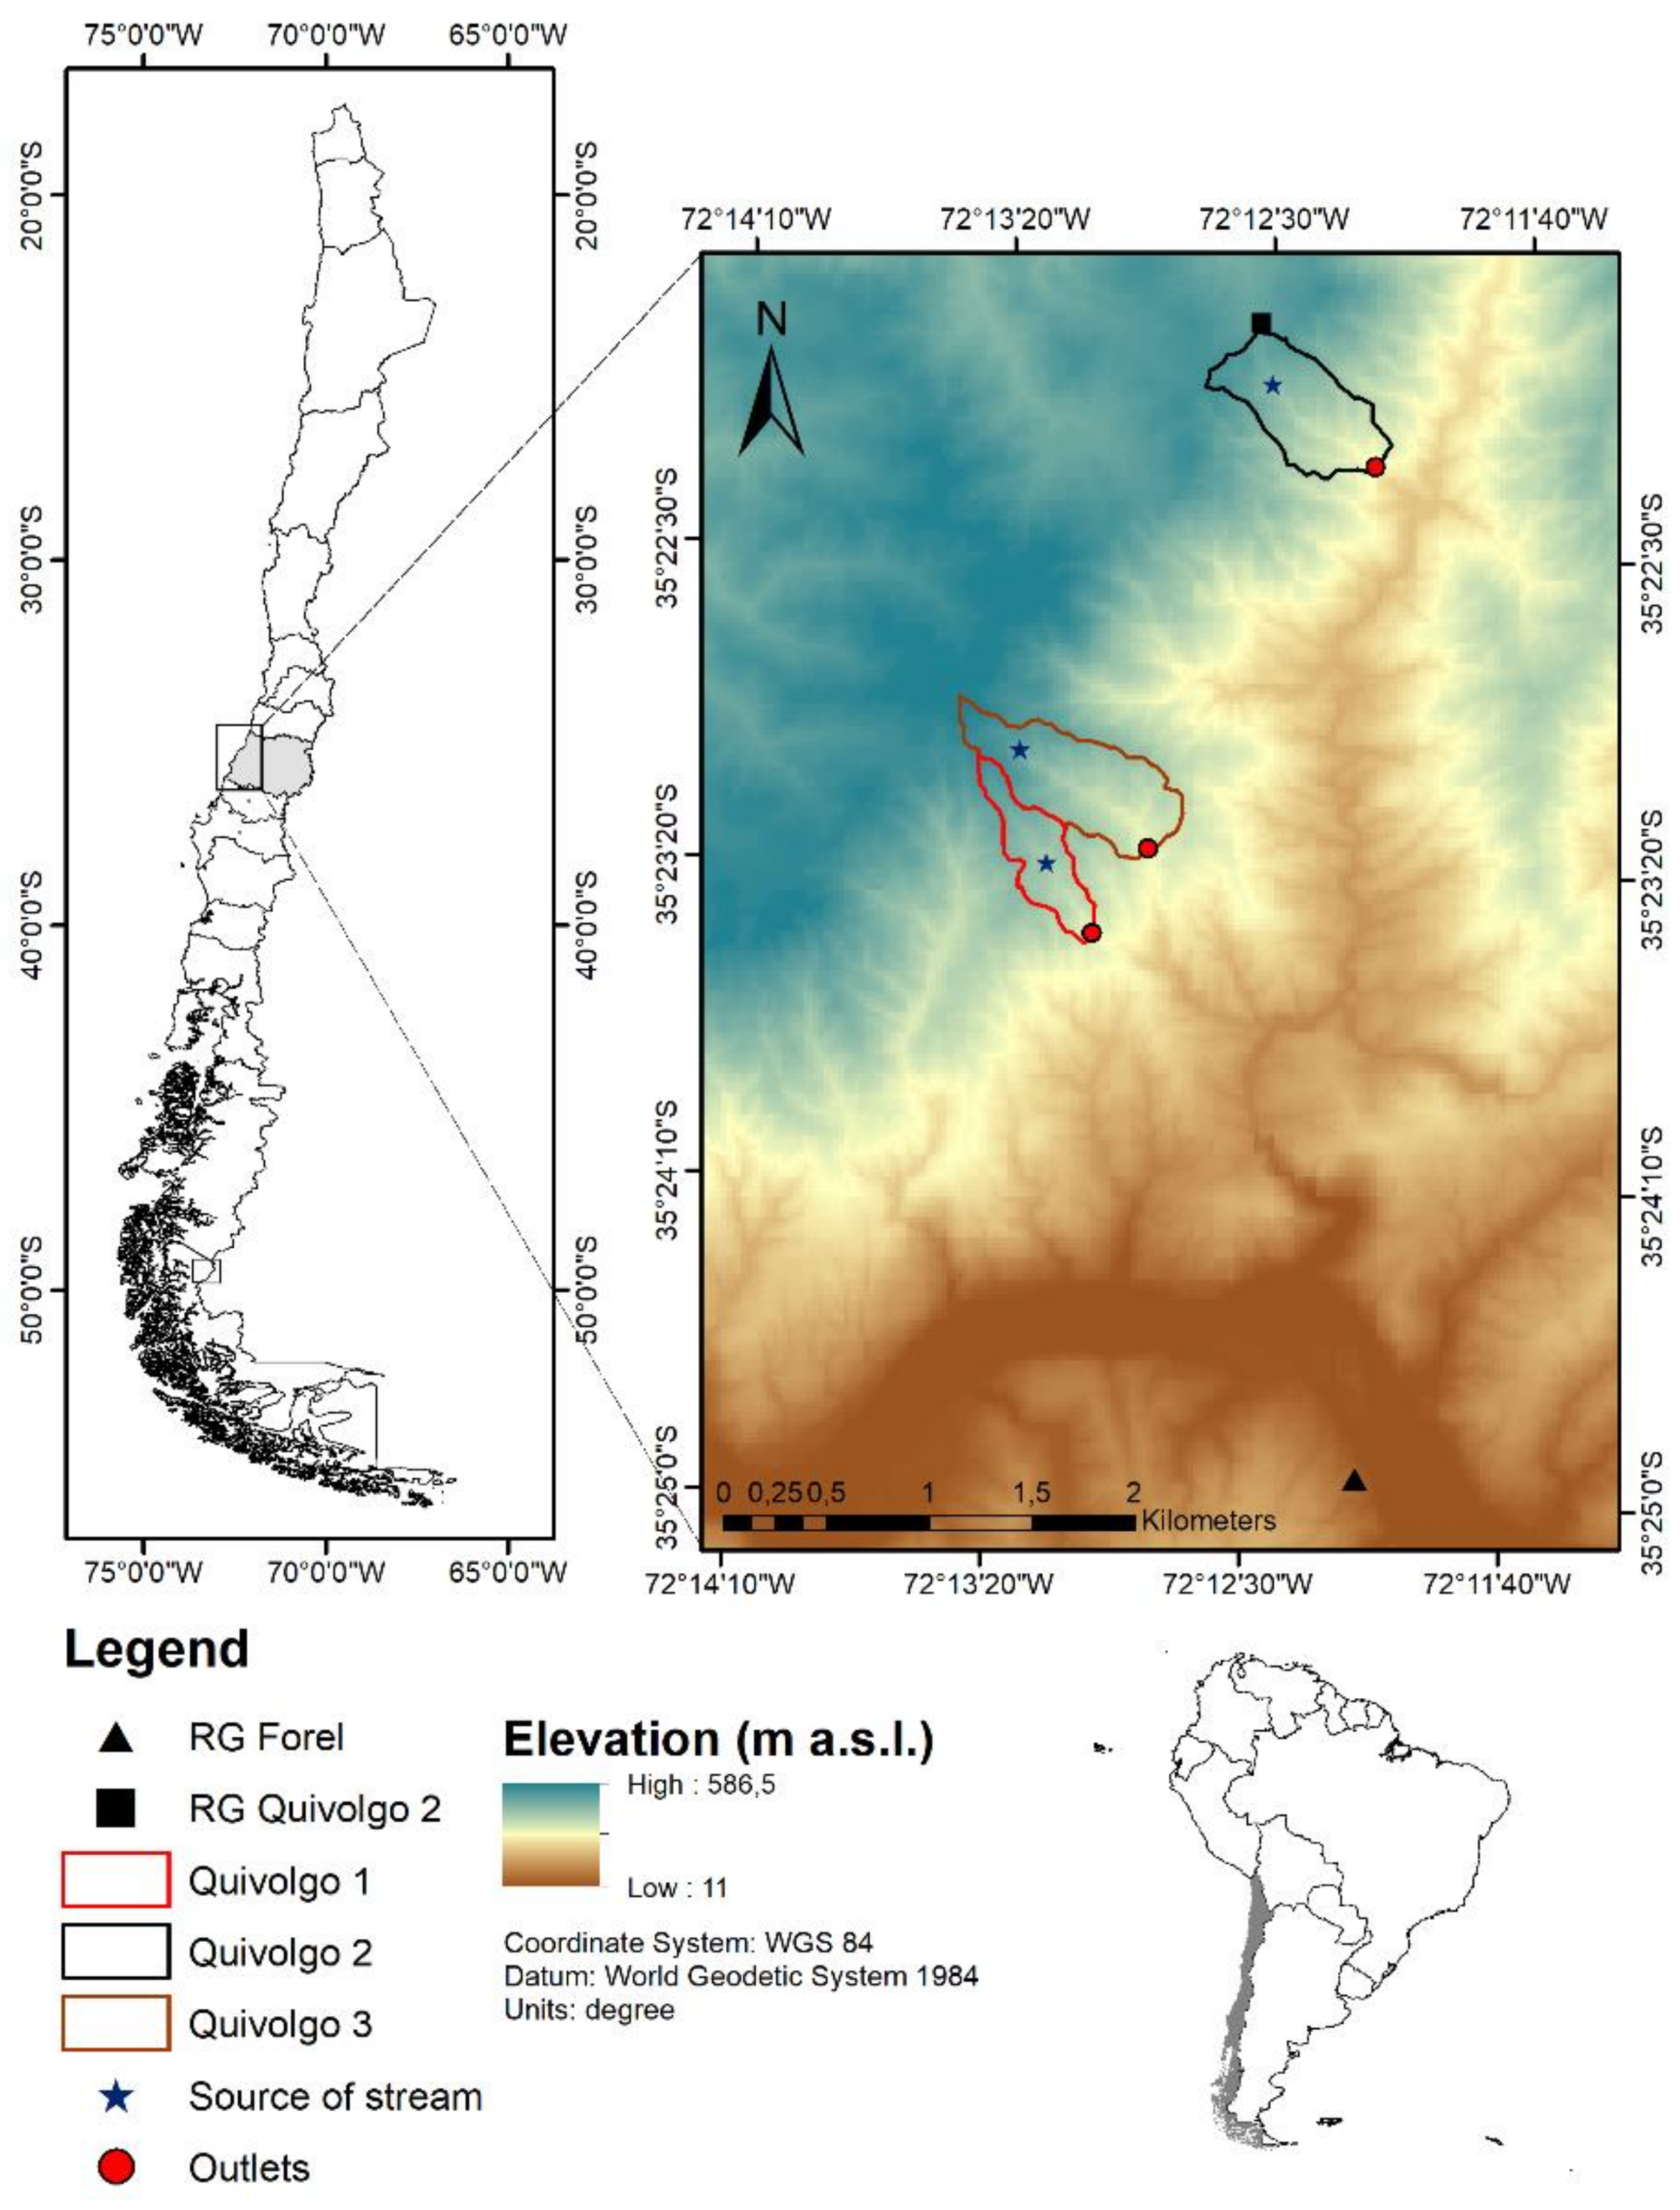
1], there are three experimental catchments where high and low baseflow tritium concentration of stream water has been monitored since 2009. All three catchments were completely burned by this high severity fire. This study reports tritium isotopic composition of water in the stream (high and low baseflow) and rain in these burnt catchments before and two years after the fire and uses these data to test the hypothesis that the MTT of water in these catchments is not affected by wildfire.

2. Materials and Methods

2.1. Study Sites Characteristics

The study site is in the locality of Quivolgo near the city of Constitución, in the Maule Region. All measurements were made in three small catchments located around 35°23′ S, 72°13′ W that flow to the Maule River (Figure 1). All catchments have similar geology and aspects so the main difference amongst them is their vegetation cover, size, and slopes. Catchment 1 (Q1) is covered by a Pinus radiata D. Don plantation that was established in 2003 and has an area of 0.1895 km2 and a mean slope of 22%. Catchment 2 (Q2) is covered by native forest with an overstorey of Nothogafus glauca (Phil.) Krasser and has an area of 0.3302 km2 with a mean slope of 51%. A complete description of the forest structure in Q2 can be found in [8]. Catchment 3 (Q3) is a mixed catchment covered by Pinus radiata (62%), planted in 2001, and native forest (34%) with N. glauca as the main species, and has an area of 0.4014 km2 and a mean slope of 44%. The P. radiata plantations on Q1 and Q3 were established at 700 trees ha−1 and were thinned at age six (2007 in Q1 and 2009 in Q3) to 450 trees ha−1 [32]. At the same time, the retained trees were pruned to a height of 2.1 m. The size, slope, channel length, and other characteristics of the three catchments are summarized in Table 1.
The geology of the catchments is mainly metamorphic bedrock [33], described as “Dollimo Complex” [34]. Soil texture, bulk density, and organic matter have been estimated from samples taken in ten soil pits dug in and around the catchments, with estimated average bulk density and organic matter presented in Table 1.
The climate of this part of Central Chile is Mediterranean-type characterized by a pronounced summer dry season and strongly winter-dominant rainfall [35]. The average annual rainfall from 2009 to the present was 951 mm. Rainfall in the year before the fire was the lowest recorded since 2009 (697 mm) and the year after the fire was the wettest since 2009 (1460 mm) [20]. The average maximum temperature in the hottest month was around 26 °C (January), the average minimum in the coldest month was 1.3 °C (July) and the average temperature was 12 °C [20].
Table 1. Characteristics of three investigated catchments in Quivolgo, Constitución, Chile.
Q1Q2Q3
Land coverP. radiataNative forestP. radiata/Native forest
Annual precipitation (mm) *966
Period of max rainfall *May–September
Maximum monthly rainfall (mm month−1) *283
Surface (km2)0.18950.33020.4014
Mean Altitude (m a.s.l)422395442
Mean slope (%)22.151.644.8
Catchment perimeter (km)2.502.543.10
Outlet altitude (m a.s.l.)305265306
Mean slope of stream (%)28.635.134.7
Length of main stream (km)1.111.101.33
Time of concentration (hrs.) **0.130.120.15
Type of climate *Temperate semi-oceanic
Clay content (%) ***394039
Silt content (%) ***363636
Sand content (%) ***252425
Organic matter (g g−1) ***1.2651.1351.265
Bulk density *** (g cm−3)1.3751.3651.375
Main textural class (USDA)Clay LoamClayClay Loam
* [36]. ** California Culvert Practice [37]. *** estimated from nearby soil pits as the average value.
The Las Máquinas fire in January 2017 burned all the forest cover in Q1, Q2, and Q3. All the pine trees in Q1 and Q3 were killed by the fire and were replaced by a carpet of seedlings before the end of 2017. The native forest in Q2 regenerated rapidly. All the native forest species have resprouted from the base and the N. glauca also regenerated from the crown [8]. Resprouts were evident less than two months after the fire.

2.2. Streamflow and Rainfall

Streamflow has been measured since 2009 in Q1 and Q2, and from May 2013 in Q3. A 90° v-notch weir was built in each of the catchment outlets. Water depth in the weir was measured every 5 min using a pressure transducer and streamflow was calculated using a rating curve calibrated for each weir. This calibration was checked using monthly manual flow and depth measurements. Due to weir and sensor damage caused by the wildfires, no flow data was recorded between January 2017 and February 2017. There are some flow gaps within the Q3 dataset due to weir repairs from May 2018 to July 2018, and a small gap in August 2017.
Rainfall was recorded using a rain gauge at the top of Q2, and a second gauge at the site of Forel, around 4 km southeast of the catchments (Figure 1). The gauge at the top of Q2 was used as the primary source. The relationship between the gauge at Q2 and the weather station at Forel was used to estimate rainfall at the catchments if data from either location was available. For the periods where neither the gauge at Q2 nor at Forel were operating, data obtained from nearby stations maintained by the General Directorate of Water (DGA) at Nirivilo was used to estimate rainfall at the catchments, using linear regression as in [20].

2.3. Tritium Sampling

Samples of water were collected from the streams in Q1, Q2, and Q3 on eight occasions between 2012 and 2018. After 2014, each stream was sampled, as proposed by [38], at a time of low baseflow (end of summer) and at a time of high baseflow (end of spring). Originally, the objective was to sample tritium concentration in baseflow at different land uses and follow up the MTT in small catchments. Therefore, prior to 2018, all samples were collected from the weir at the catchment outlet. This approach and subsequent data analysis assumed that streamflow originated from a single source [39]. In 2018, samples were also collected from the point where the streamflow started in the catchment headwaters (sampling points in Figure 1). This additional sample was taken with the aim of estimating the age of water sources along the stream. Sampling followed the Geological and Nuclear Sciences (GNS) procedure and used a Nalgene Narrow-Mouth Square HDPE 1L bottle. Tritium (3H) concentration of the samples was measured at the tritium and Water Dating Laboratory, Geological and Nuclear Sciences, New Zealand, according to [40].

2.4. Lumped Parameter Models for Estimating the Mean Transit Time (MTT) of Water

Several methodologies have been proposed to calculate the mean transit time (MTT) of water in catchments. Those that apply mixing and decay methods (e.g., [41]), such as lumped parameter models (LPMs) [42,43,44] have been widely used in hydrology studies [45,46]. Jurgens et al. [47] introduced some improvements to one of these LPMs (TRACERMODEL [48]) and created the TracerLPM Excel workbook. This has been used extensively [49,50,51] and was applied in this study. As there is no information regarding aquifer characteristics within the site, the exponential flow model (or exponential mixing model, EMM), the exponential-piston flow model (EPM), and the dispersion model (DM) were all used in order to compare MTTs obtained with different models [38]. These three models are the LPMs that are mostly applied to estimate mean transit times (e.g., [52]). A detailed explanation of each model can be found in [47]. As the EPM describes a mixture of exponential and piston flow portions within an aquifer, the TracerLMP software can define the proportion or contribution of the piston and exponential flow [47]. The EPM ratio is 1/f − 1, where f is the proportion of aquifer volume exhibiting exponential flow [53]. As the aquifer configuration is unknown, we performed the EPM modelling using f values of 0.7 and 0.8, which give EPM ratios of 0.43 and 0.25, respectively, following the work in [54].
Estimation of MTTs via LPMs requires the comparison of the tritium concentration in the stream (output) to rainfall (input). No continuous tritium rain record is available for Chile. However, tritium samples have been collected from Chilean rain stations sporadically and measured by the IAEA (IAEA and WMO, 2020). Chile and New Zealand receive rain from a similar Southern Ocean maritime climate. The tritium concentrations of Chilean and New Zealand rain are therefore expected to be similar. This is confirmed by the nearly identical records between Puerto Montt and Kaitoke, which both lie near the west coasts at similar latitudes. Figure 2 shows tritium concentrations in rain from the IAEA station Puerto Montt, Chile, in comparison to those from Kaitoke, New Zealand [40]. Moreover, results of rain samples collected between 2012 and 2014 near Constitución and Valdivia to refine the tritium input for local catchment studies are shown. The tritium concentrations between 1965 and 1975 at Puerto Montt and Kaitoke sites, during the period following the atmospheric nuclear weapons tests, match very well (R2 0.83). The records also match well in the later period, between 2003 and 2009, however with a slight bias due to natural effects such as solar activity (neutron flux), formation of clouds, and the evaporation contribution to precipitation (more details in [55]), clearly indicated by a few higher concentration data, but still with a good agreement (R2 0.77). Moreover, tritium concentrations of two rain samples collected in 2014 at Valdivia, at a similar latitude, match those of Kaitoke (insert Figure 2).
Due to their lower latitude, tritium concentrations of rain in catchments near Constitución are expected to be lower than at Kaitoke because tritium-rich atmospheric moisture originating from higher latitudes becomes increasingly diluted by low-tritium oceanic moisture on its way to lower latitudes. To determine a baseline tritium level in rain at Constitución, a scaling factor was determined for tritium levels between Constitución and Kaitoke. Four rain samples were collected at the study site (1.091 ± 0.028 TU in September 2012, 0.991 ± 0.027 in January 2013, 1.058 ± 0.028 in May 2014, and 1.124 ± 0.028 in June 2014), leading to a scaling factor of 0.62 following standard correlation procedures (e.g., [56]). The scaling factor, after applying to the Kaitoke rain TU activities, results in an estimate of the theoretical TU in the rain at the study site.

2.5. Data Analysis

The annual streamflow in the three catchments was determined for a period before and a period after the fires of January 2017. These intervals were 2010–2013 and 2017–2018 for Q1, 2010–2015 and 2017–2018 for Q2, and 2014–2016 and 2017 for Q3. For each catchment, annual runoff coefficients (RC, the ratio of streamflow to rainfall) and summer flows (between January and March) were calculated (e.g., [22]). We also estimated the annual average flow (mm, average from 2010 to 2016), the highest annual flow (mm), the lowest annual flow (mm), and the highest and lowest summer flow for each catchment.
The baseflow yield was calculated using the Recursive Digital Filter [57] passing forward, backward, and forward over the data with a filter of 0.925 for each full year of data. The results of each LPM were then compared with the hydrometrics results and rainfall intensity in 1 h versus instantaneous flow was also analyzed. Baseflow, Baseflow Index (BFI), and RC along with TU and MTTs were quantified and analyzed.
In order to compare water ages on each catchment and check if they have significant differences before and after a fire, the Scott and Knott hierarchical cluster analysis [58] was performed (p-value < 0.05) (hereafter referred to as SK test), using the ScottKnott R package.

3. Results

3.1. Rainfall and Streamflow

Average rainfall during the winter (June to August) for the 2010–2018 period was 579 mm and the driest winter was in 2016 (250 mm) while the wettest was in 2017 (832 mm). The average summer (Jan-Feb-Mar) rainfall was 25 mm, with the driest summer in 2017 and 2018 (5 and 4.8 mm, respectively) and the wettest in 2011 (53 mm). The six-month period immediately before the fire was unusually dry while the winter after the fire was much wetter than average (Figure 3).
In Q1 (P. radiata), annual, maximum, and minimum streamflow were similar before and after the fire while these measures of flow were greatly reduced in Q2 (native forest) and nearly doubled in Q3 (P. radiata) (Table 2). Of the three catchments, Q2 had the highest average annual flow (367 mm) and summer flow (64 mm) before the fires. After the fires, Q3 had the highest annual average flow (364 mm) and the highest summer flow (33 mm) (Table 2).
In the Q2 catchment, the lowest monthly flow before the fire was 9.7 mm in July 2016, and after the fire was 7.9 mm in December 2018. In contrast, for Q3 (P. radiata) the maximum flow was in the first year after fire (82 mm) and the highest summer flow was the second year after fires (62 mm). Moreover, for Q3, the maximum monthly flow before fires was in August 2014 (5 7 mm) and the minimum in April 2014 (0.4 mm). The minimum monthly flow was, interestingly, right after the fires in January 2017 (0.3 mm).

3.2. Runoff Coefficient (RC, the Ratio of Streamflow to Rainfall)

The average runoff coefficient (RC) after the fire in Q1 and Q2 is half of that before the fire (Table 3), while in Q3 after the fire, RC values are 60% greater than those observed before the fire. In Q1 (P. radiata), the RC decreased immediately after the fire but has since started to increase. After the fire, the RC in Q2 decreased and was similar to that of Q1.
To complement runoff coefficient results, we have selected some high rain intensities from before and after the fire (when available) and analyzed the instantaneous streamflow (L s−1) one hour before and after the selected rainfall event (Table 4). There was no flow over the gauging weir in Q1 in the year preceding the fires. In Q3 rainfall of similar intensity yielded more flow after than before the fires. In Q3, rainfall of similar intensity yielded 20 times more water than Q2 and twice that of Q1 (Table 5, Q + 1). Conversely, Q2 required more rainfall after the fire to yield a similar flow to that generated before the fire.

3.3. Baseflow

Baseflow index (BFI), the ratio of baseflow to annual flow, varied from 31 to 94% across the three catchments (Table 5). In Q1, the BFI was higher after the fire than before. In Q2, the ratio was similar before (86%) and after (93%) the fire. In Q3 the baseflow proportion before the fire ranged from 54 to 71% (mean 79%) but decreased after the fires.

3.4. Tritium Concentrations and the Age of Water

Streamflow was measured on the day when water samples were collected (Table 6), and tritium concentration is summarized in Table 6 and Table 7. In 2013 and May 2017, there was very little or no water flowing through the weir in Q1 (P. radiata). Of the three catchments, Q3 (P. radiata and Native Forest) had the highest monthly flow rate at the time of sampling after the fires. Flow rate at sampling was lower in all three catchments in the second year after fire than before the fire. No significant relationship was observed between monthly flow and either tritium concentration or Mean Transit Time (MTT).
In Q1 (P. radiata land cover) mean transit times varied from 5 to 15 years (Table 8) between 2012 and 2018. A slight increase in MTT from before to after fires was observed in Q1. Moreover, in Q1 the estimate for the MTT did not differ between samples collected at the stream source and the weir in 2018. In Q2 (native forest land cover), estimates of MTT ranged between 9.5 and 30 years (Table 8) and no change in MTT was evident from before to after the fire. In Q2, MTT from the stream source is about half of the age at the outlet in both sampling campaigns (summer/spring 2018) indicating groundwater contributions from deeper (longer) flow paths further down in the catchment. In Q3 (P. radiata and native forest land cover), MTT estimates ranged from 8 to 29 years (Table 8). As noted by using hydrological metrics, there was no noticeable pattern of change in MTT due to the fires in this catchment, and there was no significant difference in MTT between the water source and outlet.
For Q2, tritium analysis in 2018 indicated that the water at the stream source was about half the age of the water at the stream outlet. This indicates that water from longer flow paths enters the stream along its length [59]. Q1 had a similar MTT of 8.5 years at extremely low (March 2013 and May 2017) and at high flow. In 2018 the water was slightly older. Q2 had older water of about 18 years, except in October 2017 when it was younger than the 2018 samples.
Additionally, looking at mean MTT against the sampling month shows a decline in MTT from during the wet months and an increase in the dry season (Figure 4). Moreover, we see that MTT in Q2 has always been greater (around two times) than in Q1 and about 1.5 times that in Q3.
The Skott-Knott (SK) test showed no significant differences (p-value < 0.05) between water ages pre- and post-fire in all three catchments with all four LMP models (Table 8).
Within a catchment the was no clear relationship between the mean transit time and either BFI or RC (Figure 5). For example, in Q1 and Q3 when RC increased after the fire the mean MTT increased while in Q2 mean MTT did not change in the first year after fires. In the BFI in Q1, the more baseflow meant older water, but there is not a clear trend in BFI in Q2/Q3 with similar ages pre- and post-fire. However, there does seem to be a relationship between MTT and BFI across catchments, with catchments with more baseflow having a higher MTT, such as Q2.

4. Discussion and Conclusions

In this paper, we used a combination of streamflow, rainfall, and tritium data from three catchments to test whether the Mean Transit Time of water through these catchments was unaffected by the ‘Las Máquinas’ wildfire of late January 2017. This was proposed despite previously reported changes in the peak and low flows in at least one of the catchments [32]. This expectation was based on two pieces of evidence. Firstly, the pore flow pathways were not affected by the fire (e.g., [60]) and, secondly, the peak and low flows reflect the celerity of water travel while the MTT is determined more by the bulk velocity of water movement [31]. The data support this hypothesis and indicate that the effect of the fire on streamflow magnitude varied between the three catchments, but that MTT was fairly constant or even increased slightly. The poor relationship between measures of flow and the MTT of water for the Quivolgo catchments and the observation that MTT was not greatly changed after the fire suggests that, for these catchments, fire has affected storage and celerity but has not affected the velocity of water in these catchments. This change in the balance between celerity and velocity likely results from changes in infiltration, storage, and drainage in these catchments.
The megafire burned a significant amount of litter and humic soil within the N. glauca forest in the Quivolgo area [61]. These findings together with the fact that rainfall is not generating high peak flows in Q2 suggest that deep soil infiltration may have been enhanced within the first year after the fire. This enhancement may be due to soil cracking during the drought [62], particularly after the removal of the leaf cover, and/or to the rapid development of vacant old root channels as preferred infiltration pathways after the fire. (e.g., [63,64]). Additionally, according to [20], evapotranspiration from Q2 accounts for a small proportion of rainfall and, because streamflow has not increased, there is a high probability of this unaccounted water being stored deeper in the soil where it is mixing with stored water but not yet affecting the average water age.
The peak flow in Q2 after the fire was much lower than Q1 and Q3, and much lower than before the fires. In [20] it was shown that after evapotranspiration of native forest in Q2 was accounted for, the reduced streamflow still left a net unaccounted water balance of 915 mm in 2017 and 421 mm in 2018. This suggests that the system has changed to one in which flow has decreased, even though the rainfall increased. It is an unusual behavior but is not without precedent (e.g., [64,65]). In [20], it was hypothesized that before the fire, infiltration had been blocked by a combination of filled root channels and very dry soil, whereas after the fire these potential preferred pathways opened, increasing the infiltration to the deep fractured rock system.
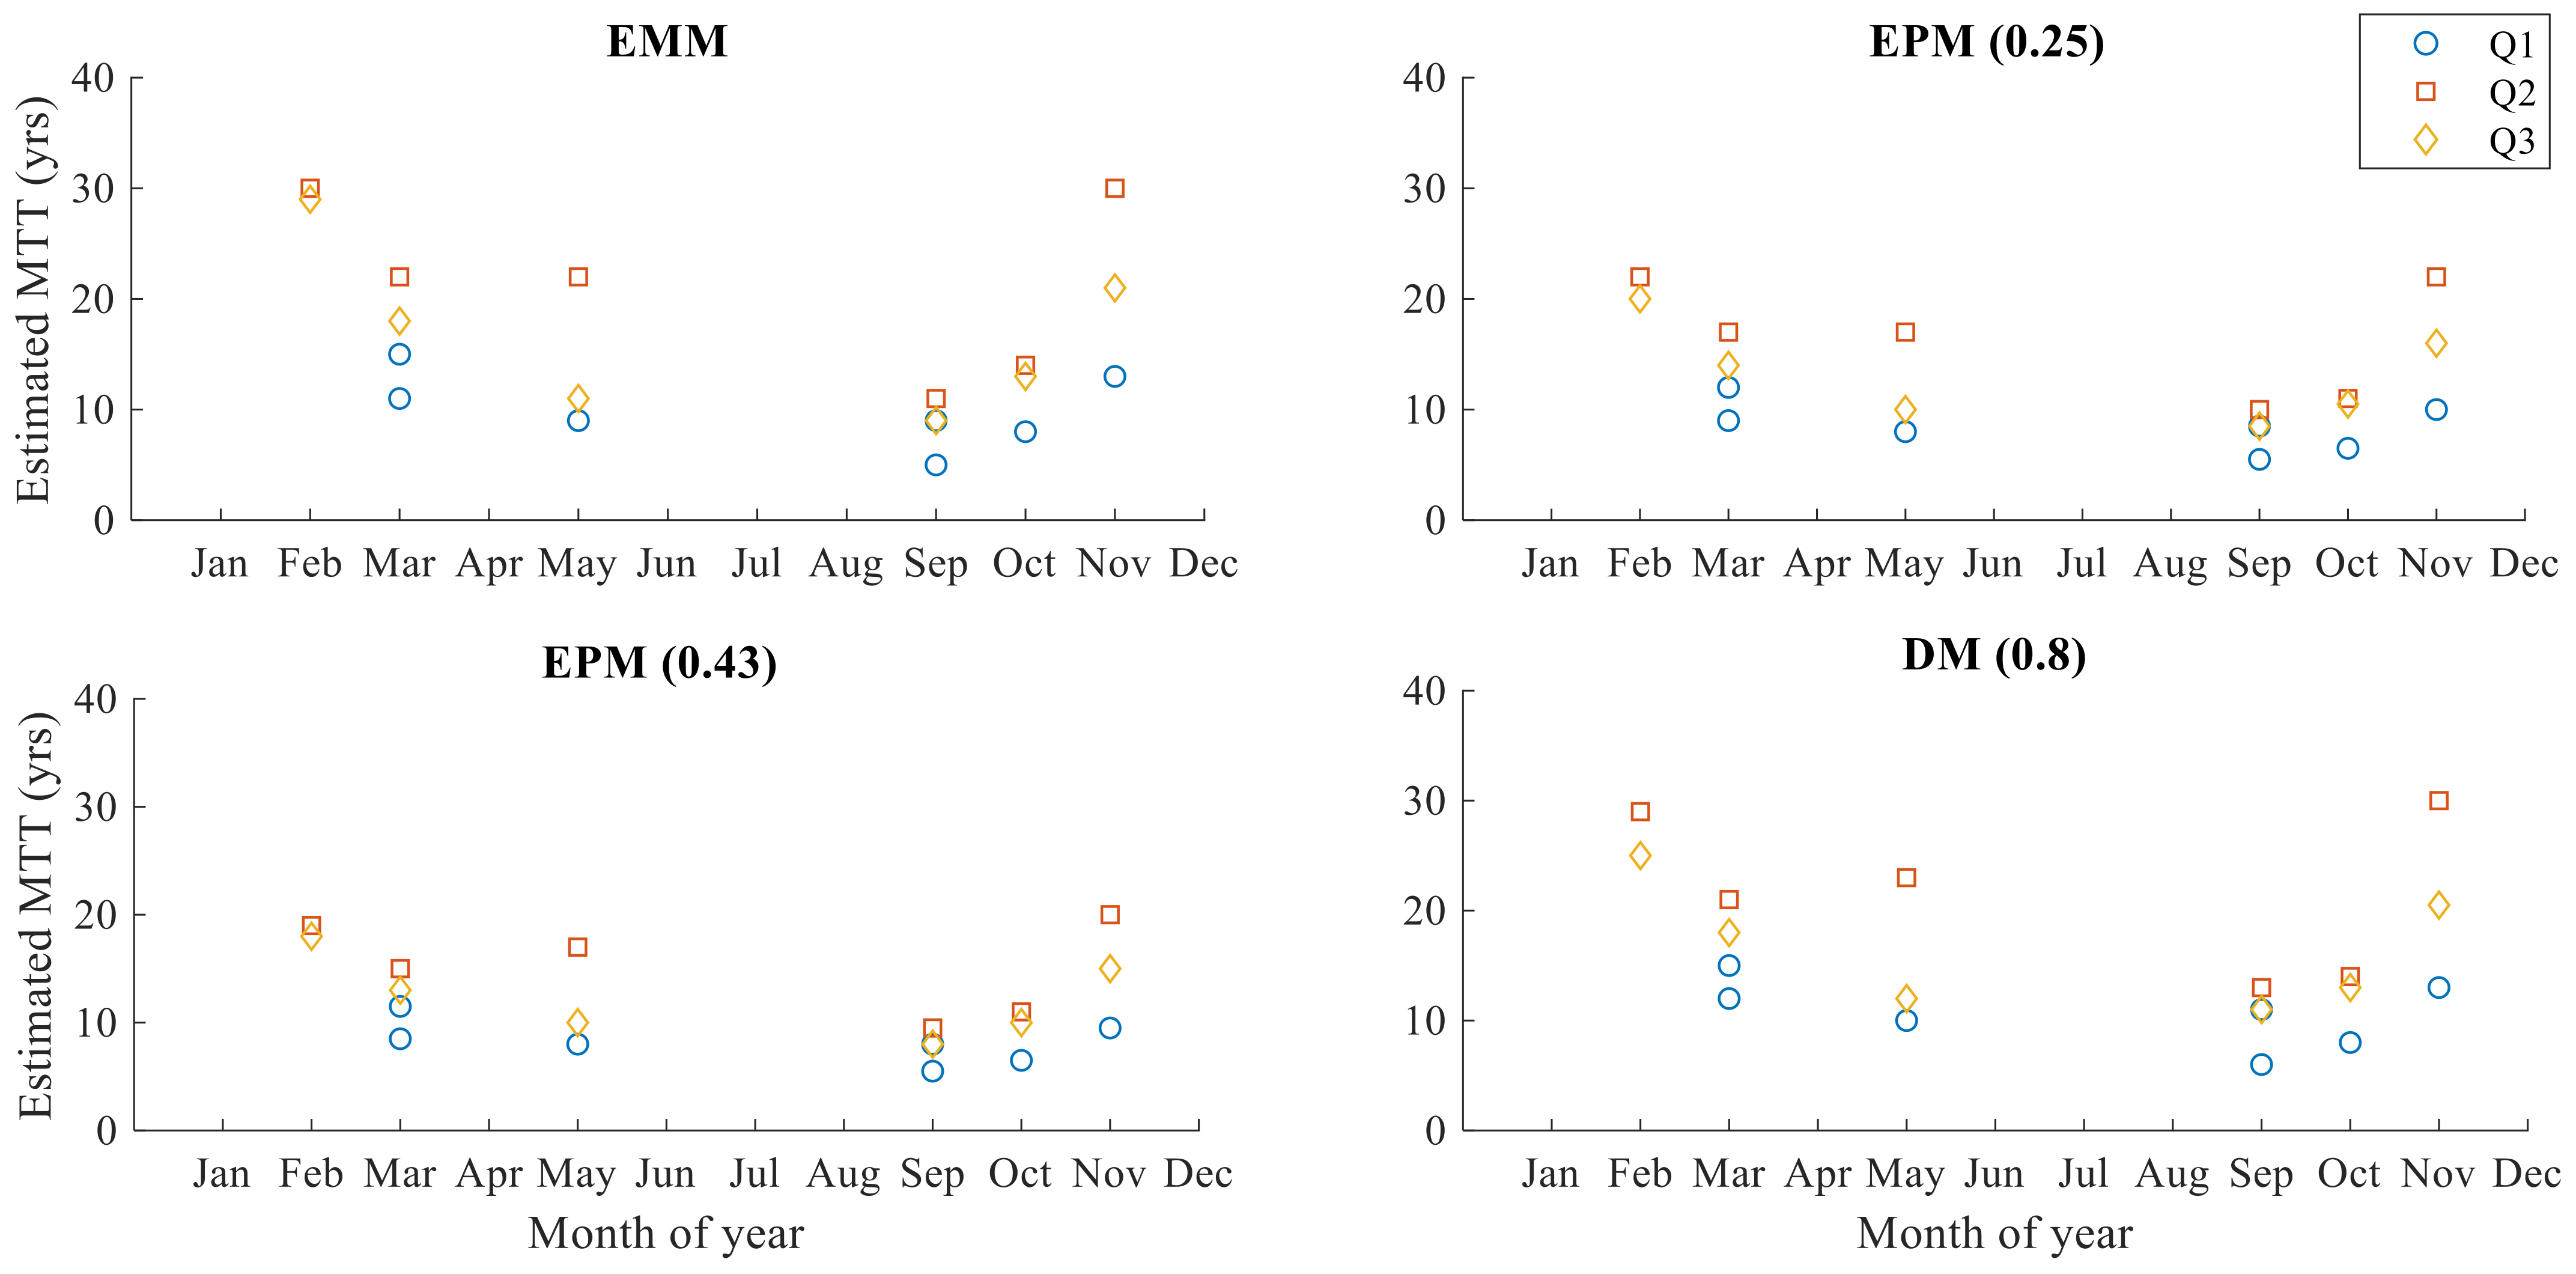
Runoff and water yield seem not to have an evident association with MTTs. In Q1, where runoff and water yield were not as high as Q2 before the fire, indeed virtually zero in 2015 and 2016, MTTs were shorter than the native forest. MTT in Q3 was similar to Q2 both before and after the fires (Table 6) and more than 50% greater than Q1. Stormflow response was greatest in Q3, before the fires, and was 1.5 times that of Q2. After the fires, when all catchments were flowing, the Q1 response to the storm was 300 times that of Q2, and Q3 was 155 times that of Q2. It may be that catchment volume and size is playing an important role in water age and streamflow. Q2 is the biggest catchment, followed by Q3, which is one explanation for why transit times are shortest in Q1 (the smallest catchment) and longest in Q2. However, it is out of our study scope, and in the future, we plan to explore catchment geomorphology effects on MTT.
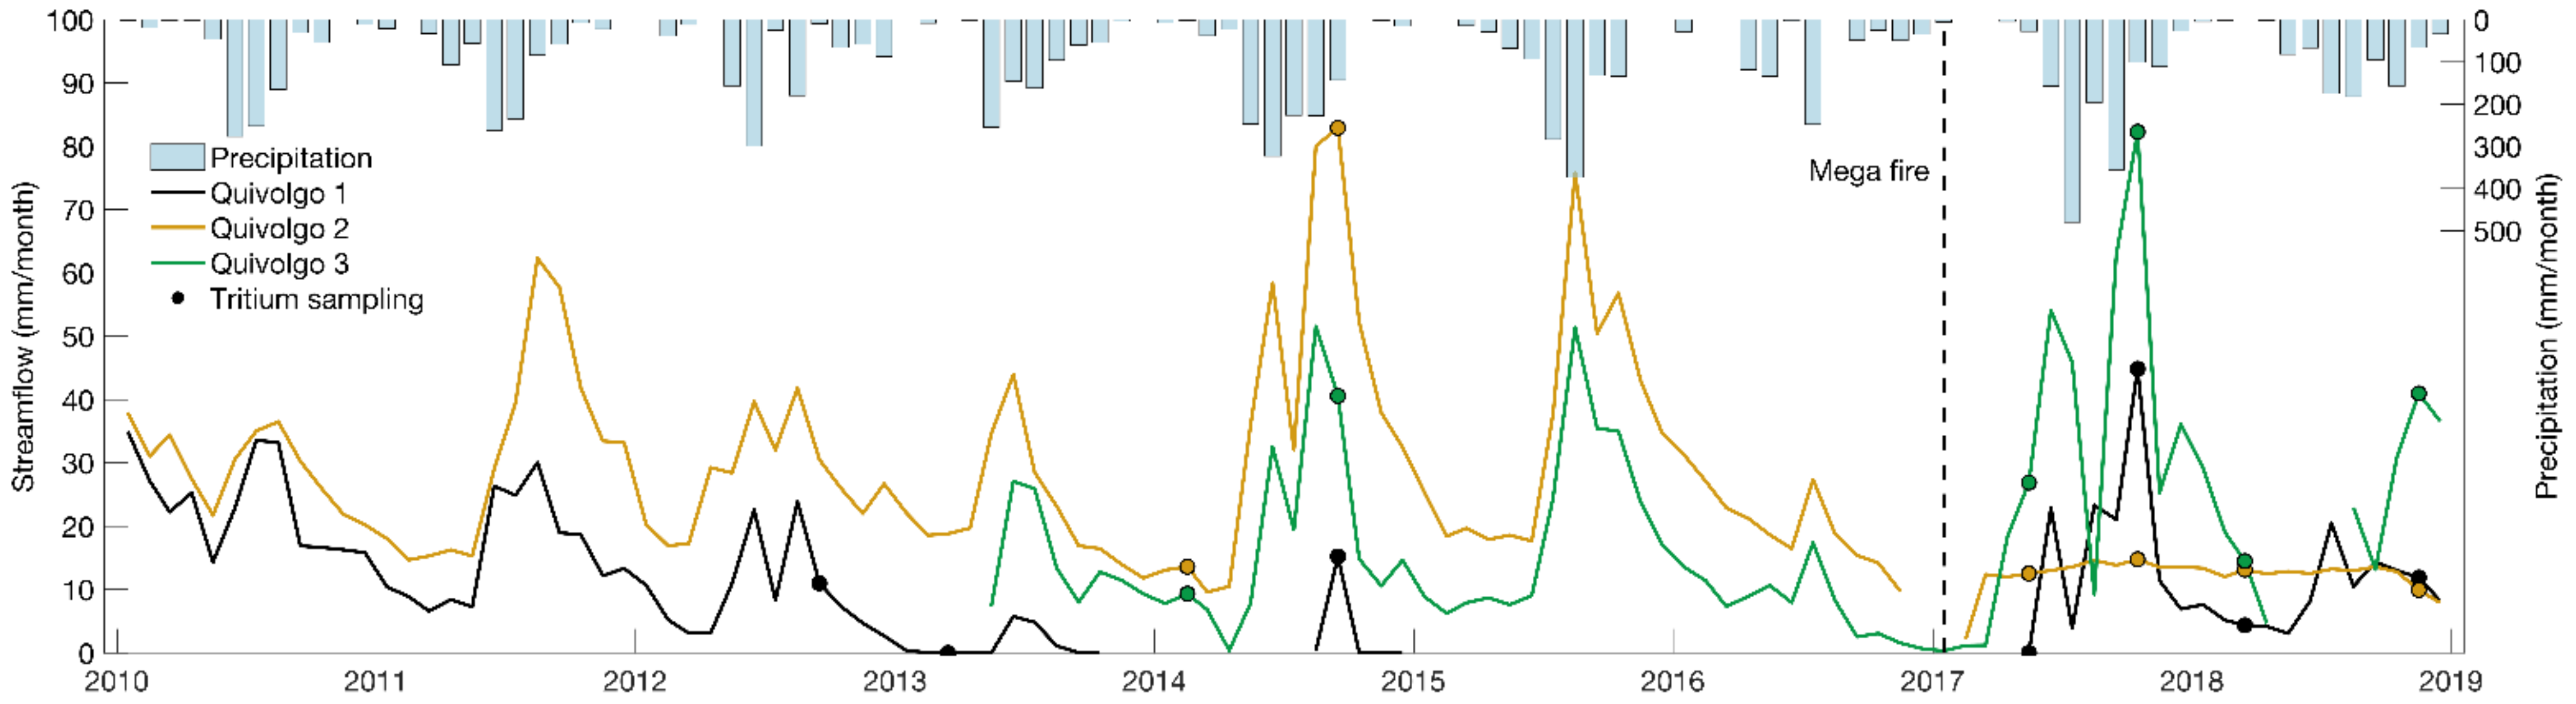
After the fires, MTT in Q1 increased. However, the native forest catchment, Q2, MTT seems unaffected, but runoff and water yield were reduced. In Q2, the lowest monthly streamflow in the 2009–2016 period was 9.6 mm in 2014. However, the lower monthly streamflow post-fires were 12.0 mm in February 2017, indeed stream flow seems less variable through the seasons. Precipitation occurs mainly in winter, when the main species (N. glauca) drops all its leaves, therefore, more water gets into the soil, there is lower evapotranspiration and, while we would expect more water to be stored in the soil [66], often this is also the period of highest streamflow.
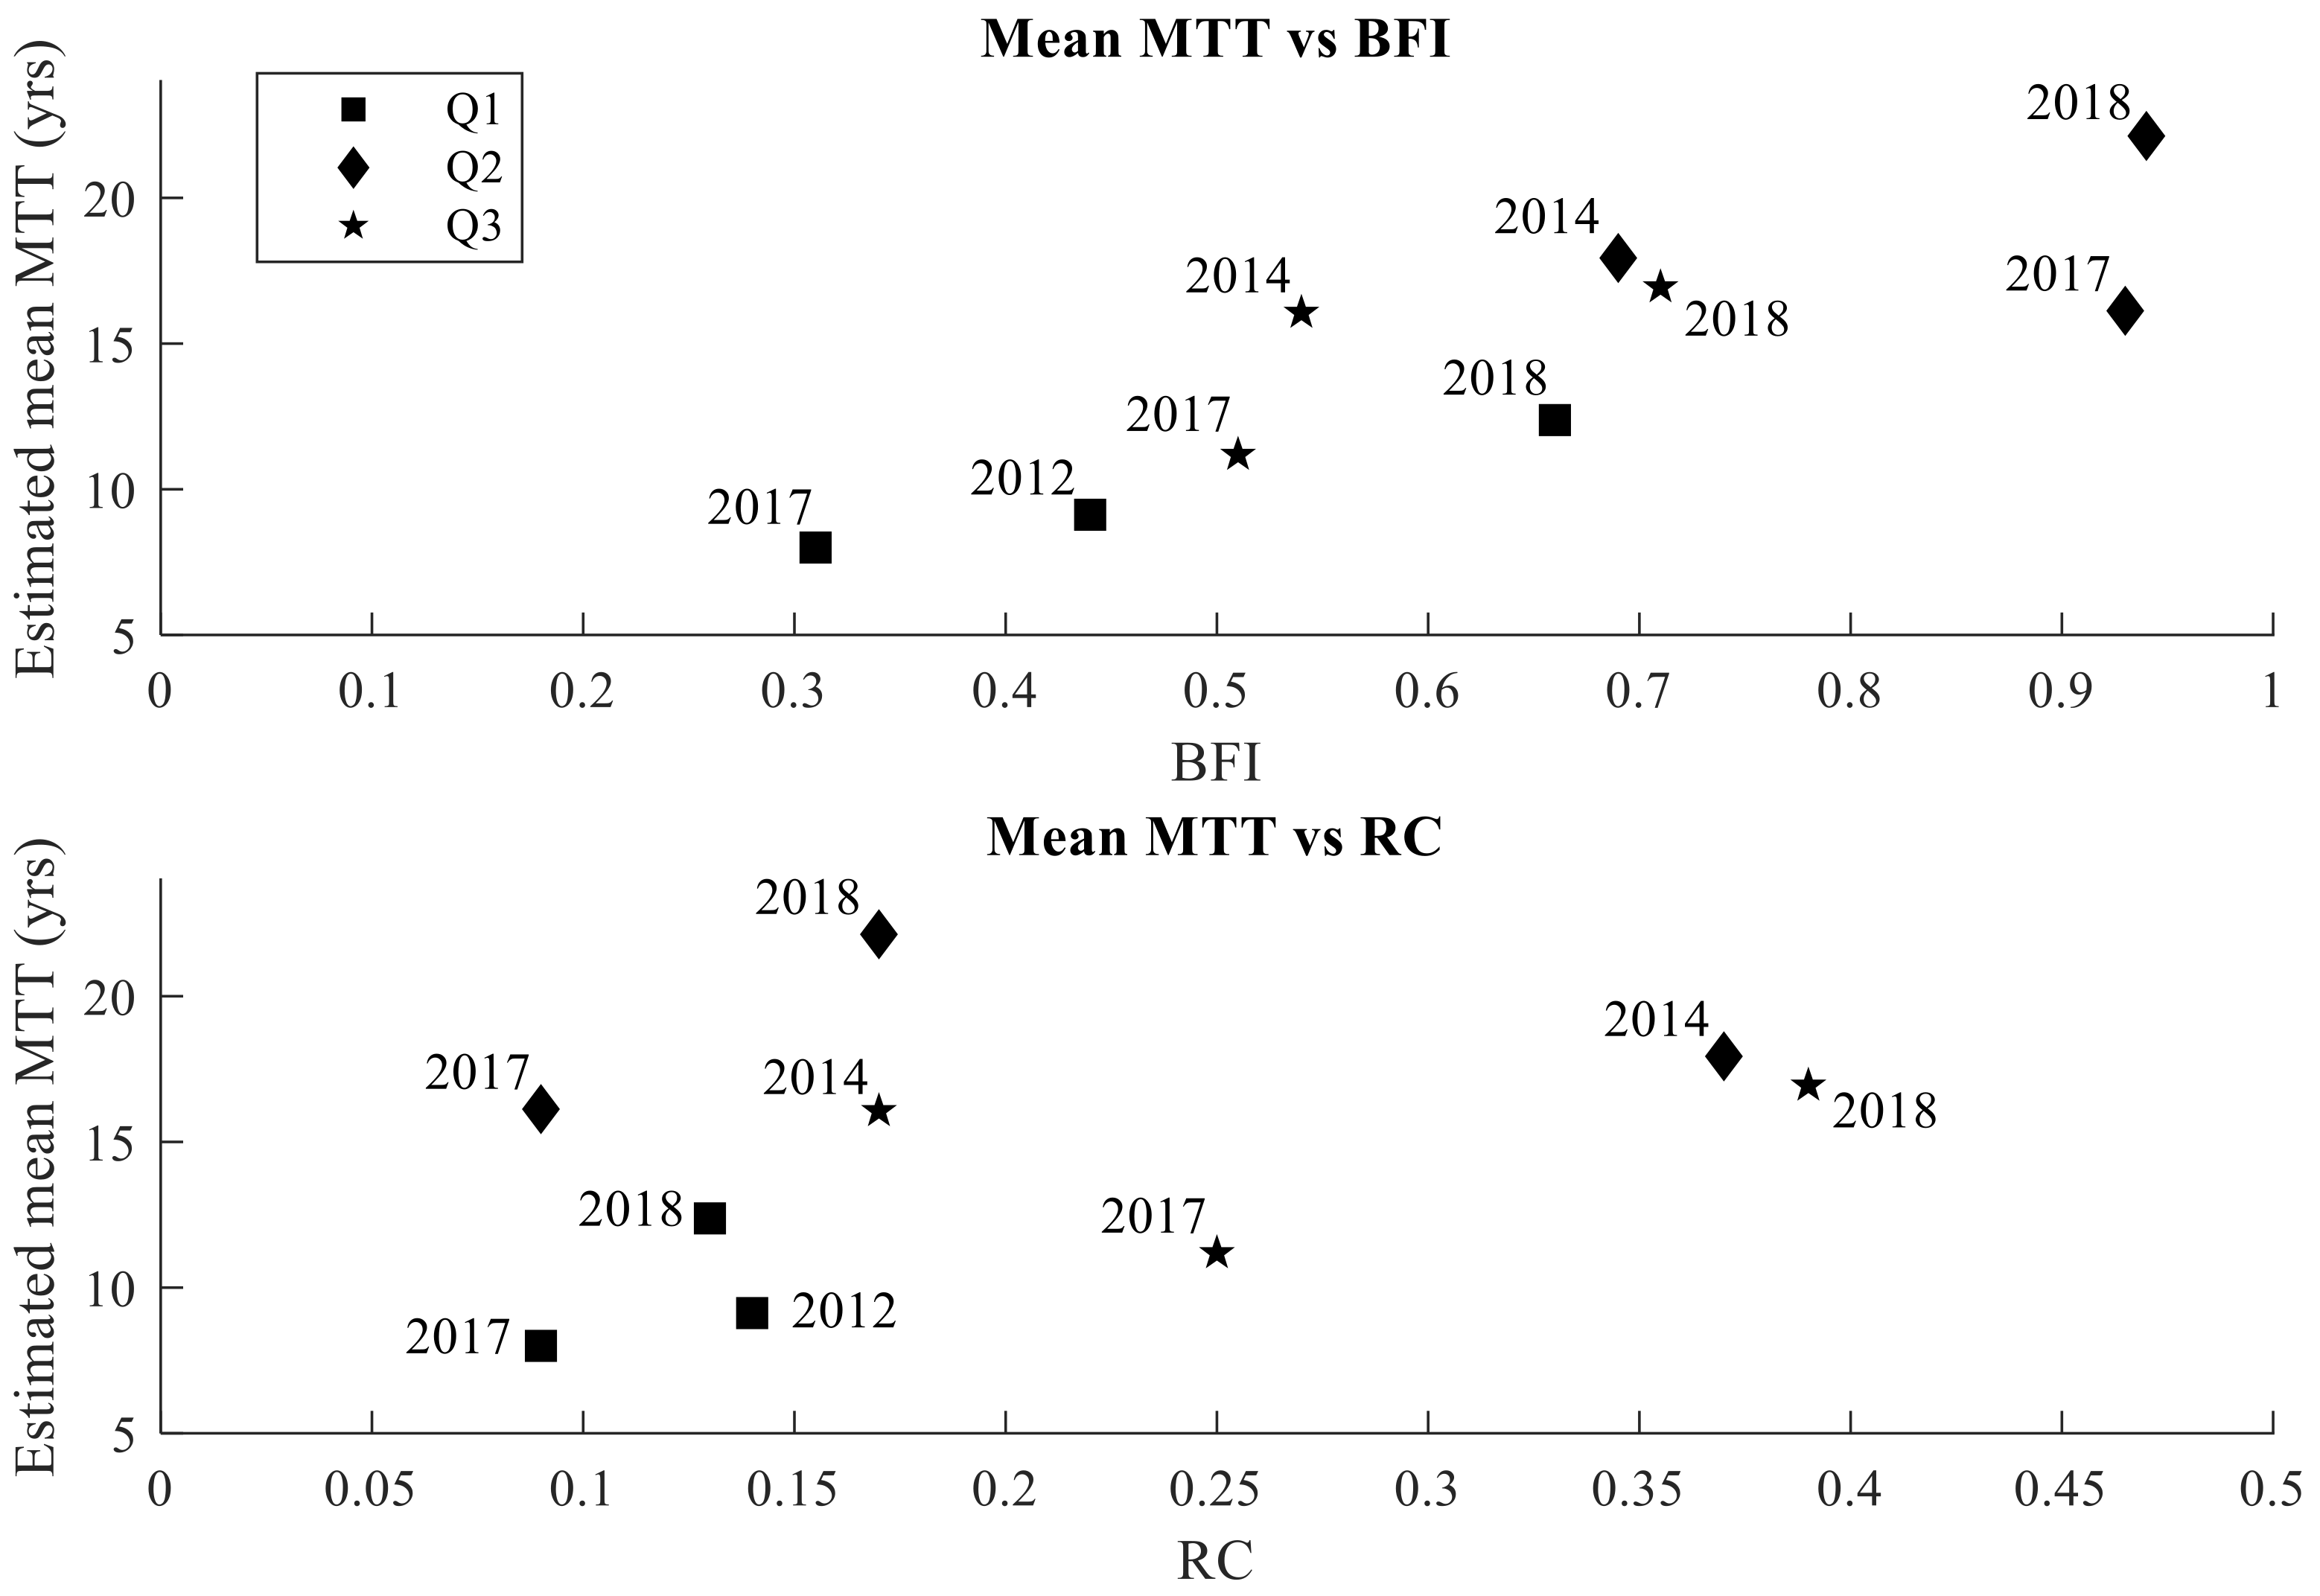
After fires, in Q1 and Q3, water ages increased which may be due to (1) more new water infiltrating deeper in the regolith and not passing through the soil matrix to the stream [67], or (2) new water entering the system pushing old water within the macropores to streamflow [68,69]. Thus, two different mechanisms could produce a similar result in the stream. Peak flows increase following a fire are often observed and usually ascribed to increased hydrophobicity and lower ET; in our case, this occurred in Q1 and Q3 but not Q2. For instance, Q3 BFI in 2015 and 2016 was 0.69 whereas in 2017 it was 0.51 which means half of the flow was surface runoff. Particularly in Q1, in the first-year post-fire surface runoff was almost 70% of the total flow, while in the second-year post-fire that surface flow dropped to only 34% of streamflow. However, in the first year after the fire, the Q1 catchment started to flow in May–June 2017 in a year with above the average rainfall (1400 mm), and some soil disturbing phenomena such as hydrophobicity, soil sealing, hyper-dry conditions, could also explain the high runoff. Nonetheless, the second-year post-fire BFI increased suggesting new water displacing older water to the stream.
An earlier study at these sites in 2015 [70] found transit times between 9 and 15 years (Q1 and Q2). In Q1 we have not found a significant difference in MTTs over time, however, this catchment went dry for a period, and we might expect older water in the stream. However, there is still little difference between MTTs before and after fires.
With almost 20 ha of native forest, Q3 seems to behave similarly to Q2, as we can see in the similar MTTs in summer 2014 and no statistically significant differences between these two catchments. This might be due to the similarities in the native forest composition and cover in Q3 and Q2, particularly in the wet zones near the streams. Moreover, in the spring of 2014 within all catchments, MTTs were at their lowest in the study period. In this pre-fire sampling, 1250 mm of rain had fallen in that year, the second wettest after the 2017 rainfall and it is possible that such an amount of water has mixed with older water decreasing mean water age.
When comparing source and outlet samples, the mature native forest (Q2) catchment had the greatest differences in MTTs, while Q1 and Q3 had no significant differences. In Q2, water sampled at the outlet had almost double the age of samples from the stream source in all LPMs results, despite the samples taken no more than 600 m apart. In 2018, the source sample MTT is about 8.5–11 years old, but the sample at the outlet is about 22–15 years old (Table 6). In Q1, we could not identify a difference between the age of source and outlet samples. A mixing process might be occurring in the soil, where new water is being mixed with the old due to an increase in infiltration rates. However, there could also be a bias of the methods with a probability of underestimating the water age due to limitations of the LPMs [71].
Cartwright and Morgenstern [39] found that the MTT differences between catchments can be related to the pattern of evapotranspiration. However, in this study, it was not possible to measure evapotranspiration after the fire within the pine catchments and was possible only in the native forest [20]. After fires, both Q1 and Q3 have increasing runoff (Table 3), and water is getting older probably because after the initial increase in surface runoff component (BFI reducing) new water is entering the soil matrix displacing older water as seepage to the stream. In Q2, water flowing out at the source is around half the age of the stream water at the outlet, which could reflect longer flow paths in this catchment, a more complex groundwater flow entering along the stream at different points, or simply more subsurface flow entering the stream. Different water ages in samples from source and outlet introduce uncertainties in the calculations of MTTs [72].
Wildfires are a well-known disturbance that affects the hydrologic cycle. With an expectation of more fires in the future [73], how these fires affect the hydrology of a site will be of increasing concern, especially in drier zones such as the Mediterranean coastal zone of Chile. Age tracers, such as tritium, can help us understand how water moves within the different flow pathways within a catchment [74]. After 10 years of drought and with a mega-fire in 2017, MTTs have not materially changed. Sampling both the source and at the outlet, showed essentially no difference in MTT in Q1, a little difference in Q3, and a significant difference in Q2. Within the following years from this study, a sampling schedule to continue to investigate both the long-term drought and the effect of wildfire in these catchments will be maintained.
Finally, to improve our knowledge of our sites and in conjunction with hydrometrics and tritium sampling, a geophysical sampling schedule (e.g., electrical resistivity or seismic waves) and boreholes should be performed in order to check water table fluctuations and their relationship with water age and other hydrologic variables. Moreover, a sampling schedule for other isotope sampling (i.e., deuterium and oxygen-18) and a continuum tritium sampling in water and rain schedule (days or monthly) to increase MTT parameterization within sites should be performed in the future.

Author Contributions

Conceptualization, F.B.; methodology, F.B., D.R., J.L.A., U.M., D.A.W., R.P.S. and P.R.d.A.; software, F.B. and U.M.; formal analysis, F.B.; investigation, F.B.; writing—original draft preparation, F.B. and P.R.d.A.; writing—review and editing, F.B., D.R., J.L.A., U.M., D.A.W., R.P.S. and P.R.d.A.; visualization, F.B.; supervision, J.L.A. and P.R.d.A. All authors have read and agreed to the published version of the manuscript.

Funding

This research received no external funding.

Institutional Review Board Statement

Not applicable.

Informed Consent Statement

Not applicable.

Data Availability Statement

The data presented in this study are available on request from the corresponding author.

Acknowledgments

We would like to thank the Chilean National Agency for Research and Development (Agencia Nacional de Investigación y Desarrollo de Chile, ANID) through project ANID/FONDAP/15130015 and to the doctoral scholarship ANID-PFCHA/Doctorado Nacional/2021-21210861 for the support of the lead author (F.B.). The authors wish to express their thanks to Pedro Hervé-Fernández and his helpful comments for improving this document.

Conflicts of Interest

The authors declare no conflict of interest.

References

  1. de la Barrera, F.; Barraza, F.; Favier, P.; Ruiz, V.; Quense, J. Megafires in Chile 2017: Monitoring multiscale environmental impacts of burned ecosystems. Sci. Total Environ. 2018, 637–638, 1526–1536. [Google Scholar] [CrossRef] [PubMed]
  2. Westerling, A.L. Increasing western US forest wildfire activity: Sensitivity to changes in the timing of spring. Philos. Trans. R. Soc. B Biol. Sci. 2016, 371, 20150178. [Google Scholar] [CrossRef] [PubMed]
  3. Dupuy, J.-L.; Fargeon, H.; Martin-StPaul, N.; Pimont, F.; Ruffault, J.; Guijarro, M.; Hernando, C.; Madrigal, J.; Fernandes, P. Climate change impact on future wildfire danger and activity in southern Europe: A review. Ann. For. Sci. 2020, 77, 35. [Google Scholar] [CrossRef]
  4. Bozkurt, D.; Rojas, M.; Boisier, J.P.; Valdivieso, J. Climate change impacts on hydroclimatic regimes and extremes over Andean basins in central Chile. Hydrol. Earth Syst. Sci. Discuss. 2017, preprint. [Google Scholar]
  5. Garreaud, R.; Alvarez-Garreton, C.; Barichivich, J.; Boisier, J.P.; Christie, D.A.; Galleguillos, M.; LeQuesne, C.; McPhee, J.; Zambrano-Bigiarini, M. The 2010–2015 mega drought in Central Chile: Impacts on regional. Hydrol. Earth Syst. Sci. 2017, 21, 6307–6327. [Google Scholar] [CrossRef] [Green Version]
  6. Shakesby, R.A.; Doerr, S.H. Wildfire as a hydrological and geomorphological agent. Earth-Sci. Rev. 2006, 74, 269–307. [Google Scholar] [CrossRef]
  7. Nolan, R.H.; Lane, P.N.J.; Benyon, R.G.; Bradstock, R.A.; Mitchell, P.J. Trends in evapotranspiration and streamflow following wildfire in resprouting eucalypt forests. J. Hydrol. 2015, 524, 614–624. [Google Scholar] [CrossRef]
  8. White, D.A.; Balocchi-Contreras, F.; Silberstein, R.P.; Ramírez de Arellano, P. The effect of wildfire on the structure and water balance of a high conservation value Hualo (Nothofagus glauca (Phil.) Krasser) forest in central Chile. For. Ecol. Manag. 2020, 47, 118219. [Google Scholar] [CrossRef]
  9. Batelis, S.-C.; Nalbantis, I. Potential Effects of Forest Fires on Streamflow in the Enipeas River Basin, Thessaly, Greece. Environ. Process. 2014, 1, 73–85. [Google Scholar] [CrossRef] [Green Version]
  10. Bethke, C.M.; Johnson, T.M. Groundwater Age and Groundwater Age Dating. Annu. Rev. Earth Planet. Sci. 2008, 36, 121–152. [Google Scholar] [CrossRef] [Green Version]
  11. Stewart, M.K.; Fahey, B.D. Runoff generating processes in adjacent tussock grassland and pine plantation catchments as indicated by mean transit time estimation using tritium. Hydrol. Earth Syst. Sci. 2010, 14, 1021–1032. [Google Scholar] [CrossRef] [Green Version]
  12. Dean, J.F.; Webb, J.A.; Jacobsen, G.E.; Chisari, R.; Dresel, P.E. A groundwater recharge perspective on locating tree plantations within low-rainfall catchments to limit water resource losses. Hydrol. Earth Syst. Sci. 2015, 19, 1107–1123. [Google Scholar] [CrossRef] [Green Version]
  13. Cartwright, I.; Atkinson, A.P.; Gilfedder, B.S.; Hofmann, H.; Cendón, D.I.; Morgenstern, U. Using geochemistry to understand water sources and transit times in headwater streams of a temperate rainforest. Appl. Geochem. 2018, 99, 1–12. [Google Scholar] [CrossRef]
  14. Bart, R.R. A regional estimate of postfire streamflow change in California. Water Resour. Res. 2016, 52, 1465–1478. [Google Scholar] [CrossRef] [Green Version]
  15. Shu-Ren, Y. Effects of fire disturbance on forest hydrology. J. For. Res. 2003, 14, 331–334. [Google Scholar] [CrossRef]
  16. Scott, D.F.; Schulze, R.E. The Hydrological Effects of a Wildfire in a Eucalypt Afforested Catchment. S. Afr. For. J. 1992, 160, 67–74. [Google Scholar] [CrossRef]
  17. Bart, R.R.; Tague, C.L. The impact of wildfire on baseflow recession rates in California. Hydrol. Process. 2017, 31, 1662–1673. [Google Scholar] [CrossRef]
  18. Flint, L.E.; Underwood, E.C.; Flint, A.L.; Hollander, A.D. Characterizing the Influence of Fire on Hydrology in Southern California. Nat. Areas J. 2019, 39, 108–121. [Google Scholar] [CrossRef]
  19. Larsen, I.J.; MacDonald, L.H.; Brown, E.; Rough, D.; Welsh, M.J.; Pietraszek, J.H.; Libohova, Z.; Benavides-Solorio, J.D.; Schaffrath, K. Causes of post-fire runoff and erosion: Water repellency, cover, or soil sealing? Soil Sci. Soc. Am. J. 2009, 73, 1393–1407. [Google Scholar] [CrossRef] [Green Version]
  20. Balocchi, F.; Flores, N.; Neary, D.; White, D.A.; Silberstein, R.; Ramírez de Arellano, P. The effect of the ‘Las Maquinas’ wildfire of 2017 on the hydrologic balance of a high conservation value Hualo (Nothofagus glauca (Phil.) Krasser) forest in central Chile. For. Ecol. Manag. 2020, 477, 118482. [Google Scholar] [CrossRef]
  21. Bart, R.; Hope, A. Streamflow response to fire in large catchments of a Mediterranean-climate region using paired-catchment experiments. J. Hydrol. 2010, 388, 370–378. [Google Scholar] [CrossRef]
  22. Saxe, S.; Hogue, T.S.; Hay, L. Characterization and evaluation of controls on post-fire streamflow response across western US watersheds. Hydrol. Earth Syst. Sci. 2018, 22, 1221–1237. [Google Scholar] [CrossRef] [Green Version]
  23. Lane, P.N.; Sheridan, G.J.; Noske, P.J.; Sherwin, C.B.; Costenaro, J.L.; Nyman, P.; Smith, H.G. Fire effects on forest hydrology: Lessons from a multi-scale catchment experiment in SE Australia. IAHS Publ. 2012, 353, 137–143. [Google Scholar]
  24. Silberstein, R.P.; Dawes, W.R.; Bastow, T.P.; Byrne, J.; Smart, N.F. Evaluation of changes in post-fire recharge under native woodland using hydrological measurements, modelling and remote sensing. J. Hydrol. 2013, 489, 1–15. [Google Scholar] [CrossRef]
  25. Jung, H.Y.; Hogue, T.S.; Rademacher, L.K.; Meixner, T. Impact of wildfire on source water contributions in Devil Creek, CA: Evidence from end-member mixing analysis. Hydrol. Process. 2008, 23, 183–200. [Google Scholar] [CrossRef]
  26. Gibson, J.; Prepas, E.; McEachern, P. Quantitative comparison of lake throughflow, residency, and catchment runoff using stable isotopes: Modelling and results from a regional survey of Boreal lakes. J. Hydrol. 2002, 262, 128–144. [Google Scholar] [CrossRef]
  27. Seibert, J.; McDonnell, J.J.; Woodsmith, R.D. Effects of wildfire on catchment runoff response: A modelling approach to detect changes in snow-dominated forested catchments. Hydrol. Res. 2010, 41, 378–390. [Google Scholar] [CrossRef] [Green Version]
  28. Loáiciga, H.A.; Pedreros, D.; Roberts, D. Wildfire-streamflow interactions in a chaparral watershed. Adv. Environ. Res. 2001, 5, 295–305. [Google Scholar] [CrossRef]
  29. Brown, A.E.; Zhang, L.; McMahon, T.A.; Western, A.W.; Vertessy, R.A. A review of paired catchment studies for determining changes in water yield resulting from alterations in vegetation. J. Hydrol. 2005, 310, 28–61. [Google Scholar] [CrossRef]
  30. McDonnell, J.J.; Evaristo, J.; Bladon, K.D.; Buttle, J.; Creed, I.F.; Dymond, S.F.; Grant, G.; Iroume, A.; Jackson, C.R.; Jones, J.A.; et al. Water sustainability and watershed storage. Nat. Sustain. 2018, 1, 378–379. [Google Scholar] [CrossRef]
  31. McDonnell, J.J.; Beven, K. Debates—The future of hydrological sciences: A (common) path forward? A call to action aimed at understanding velocities, celerities, and residence time distributions of the headwater hydrograph. Water Resour. Res. 2014, 50, 5342–5350. [Google Scholar] [CrossRef]
  32. Balocchi, F.; White, D.A.; Silberstein, R.P.; Ramírez de Arellano, P. Forestal Arauco experimental research catchments; daily rainfall-runoff for 10 catchments with different forest types in Central-Southern Chile. Hydrol. Process. 2021, 35. [Google Scholar] [CrossRef]
  33. Honorato, P. Manual de Edafología; Alfaomega: Mexico City, Mexico, 2000; 267p. (In Spanish) [Google Scholar]
  34. Gana, P.; Hervé, F. Geologia del Basamento Cristalino en la Cordillera de la Costa entre los Rios Mataquito y Maule, VII Region. Andean Geol. 1983, 19–20, 37–56. [Google Scholar] [CrossRef]
  35. Armestro, J.; Arroyo, M.; Hinojosa, F. The Mediterranean Environment of Central Chile. In The Physical Geography of South America; Veblen, T., Young, K., Orme, A., Eds.; Oxford University Press: Oxford, UK, 2015; pp. 184–199. [Google Scholar]
  36. Balocchi, F.; Flores, N.; Arumí, J.L.; Iroumé, A.; White, D.A.; Silberstein, R.P.; Ramírez de Arellano, P. Comparison of streamflow recession between plantations and native forests in small catchments in Central-Southern Chile. Hydrol. Process. 2021, 35, e14182. [Google Scholar] [CrossRef]
  37. Li, M.-H.; Chibber, P. Overland Flow Time of Concentration on Very Flat Terrains. Transp. Res. Rec. J. Transp. Res. Board 2008, 2060, 133–140. [Google Scholar] [CrossRef] [Green Version]
  38. Stewart, M.K.; Morgenstern, U. Importance of tritium-based transit times in hydrological systems. WIREs Water 2016, 3, 145–154. [Google Scholar] [CrossRef]
  39. Cartwright, I.; Morgenstern, U. Contrasting transit times of water from peatlands and eucalypt forests in the Australian Alps determined by tritium: Implications for vulnerability and the source of water in upland catchments. Hydrol. Earth Syst. Sci. 2016, 20, 4757–4773. [Google Scholar] [CrossRef] [Green Version]
  40. Morgenstern, U.; Taylor, C.B. Ultra low-level tritium measurement using electrolytic enrichment and LSC. Isot. Environ. Heal. Stud. 2009, 45, 96–117. [Google Scholar] [CrossRef]
  41. Amin, I.E.; Campana, M.E. A general lumped parameter model for the interpretation of tracer data and transit time calculation in hydrologic systems. J. Hydrol. 1996, 179, 1–21. [Google Scholar] [CrossRef]
  42. Małoszewski, P. Lumped-parameter models as a tool for determining the hydrological parameters of some groundwater systems based on isotope data. IAHS Publ. 2000, 262, 271–276. [Google Scholar]
  43. Małoszewski, P.; Zuber, A. Determining the turnover time of groundwater systems with the aid of environmental tracers: 1. Models and their applicability. J. Hydrol. 1982, 57, 207–231. [Google Scholar] [CrossRef]
  44. Zuber, A.; Witczak, S.; Rozanski, K.; Sliwka, I.; Opoka, M.; Mochalski, P.; Kuc, T.; Karlikowska, J.; Kania, J.; Jackowicz-Korczyński, M.; et al. Groundwater dating with 3H and SF6 in relation to mixing patterns, transport modelling and hydrochemistry. Hydrol. Process. 2005, 19, 2247–2275. [Google Scholar] [CrossRef]
  45. Timbe, E.; Windhorst, D.; Crespo, P.; Frede, H.-G.; Feyen, J.; Breuer, L. Understanding uncertainties when inferring mean transit times of water trough tracer-based lumped-parameter models in Andean tropical montane cloud forest catchments. Hydrol. Earth Syst. Sci. 2014, 18, 1503–1523. [Google Scholar] [CrossRef] [Green Version]
  46. Cartwright, I.; Morgenstern, U. Transit times from rainfall to baseflow in headwater catchments estimated using tritium: The Ovens River, Australia. Hydrol. Earth Syst. Sci. 2015, 19, 3771–3785. [Google Scholar] [CrossRef] [Green Version]
  47. Jurgens, B.C.; Bohlke, J.K.; Eberts, S.M. TracerLPM (Version 1): An Excel® Workbook for Interpreting Groundwater Age Distributions from Environmental Tracer Data; US Geological Survey Techniques and Methods Report 4-F3; US Geological Survey: Reston, VA, USA, 2012.
  48. Böhlke, J.K. Tracermodel1-Excel Workbook for Calculation and Presentation of Environmental Tracer Data for Simple Groundwater Mixtures: Use of Chlorofluorocarbons in Hydrology—A Guidebook; Section III. 10.3.; International Atomic Energy Agency: Vienna, Austria, 2006; pp. 239–243. [Google Scholar]
  49. Tamez-Meléndez, C.; Hernández-Antonio, A.; Gaona-Zanella, P.C.; Ornelas-Soto, N.; Mahlknecht, J. Isotope signatures and hydrochemistry as tools in assessing groundwater occurrence and dynamics in a coastal arid aquifer. Environ. Earth Sci. 2016, 75, 1–17. [Google Scholar] [CrossRef] [Green Version]
  50. Lapworth, D.J.; MacDonald, A.M.; Krishan, G.; Rao, M.S.; Gooddy, D.C.; Darling, W.G. Groundwater recharge and age-depth profiles of intensively exploited groundwater resources in northwest India. Geophys. Res. Lett. 2015, 42, 7554–7562. [Google Scholar] [CrossRef] [Green Version]
  51. Chatterjee, S.; Sinha, U.K.; Ansari, A.; Mohokar, H.V.; Dash, A. Application of lumped parameter model to estimate mean transit time (MTT) of the thermal water using environmental tracer (3H): Insight from uttarakhand geothermal area (India). Appl. Geochem. 2018, 94, 1–10. [Google Scholar] [CrossRef]
  52. McGuire, K.J.; McDonnell, J.J. A review and evaluation of catchment transit time modeling. J. Hydrol. 2006, 330, 543–563. [Google Scholar] [CrossRef]
  53. Howcroft, W.; Cartwright, I.; Morgenstern, U. Mean transit times in headwater catchments: Insights from the Otway Ranges, Australia. Hydrol. Earth Syst. Sci. 2018, 22, 635–653. [Google Scholar] [CrossRef] [Green Version]
  54. Morgenstern, U.; Stewart, M.K.; Stenger, R. Dating of streamwater using tritium in a post nuclear bomb pulse world: Continuous variation of mean transit time with streamflow. Hydrol. Earth Syst. Sci. 2010, 14, 2289–2301. [Google Scholar] [CrossRef] [Green Version]
  55. Palcsu, L.; Morgenstern, U.; Sültenfuss, J.; Koltai, G.; László, E.; Temovski, M.; Major, Z.; Nagy, J.T.; Papp, L.; Varlam, C.; et al. Modulation of Cosmogenic Tritium in Meteoric Precipitation by the 11-year Cycle of Solar Magnetic Field Activity. Sci. Rep. 2018, 8, 12813. [Google Scholar] [CrossRef] [PubMed]
  56. Gusyev, M.A.; Morgenstern, U.; Stewart, M.K.; Yamazaki, Y.; Kashiwaya, K.; Nishihara, T.; Kuribayashi, D.; Sawano, H.; Iwami, Y. Application of tritium in precipitation and baseflow in Japan: A case study of groundwater transit times and storage in Hokkaido watersheds. Hydrol. Earth Syst. Sci. 2016, 20, 3043–3058. [Google Scholar] [CrossRef] [Green Version]
  57. Nathan, R.J.; McMahon, T.A. Evaluation of automated techniques for base flow and recession analyses. Water Resour. Res. 1990, 26, 1465–1473. [Google Scholar] [CrossRef]
  58. Scott, A.J.; Knott, M. A Cluster Analysis Method for Grouping Means in the Analysis of Variance. Biometrics 1974, 30, 507–512. [Google Scholar] [CrossRef] [Green Version]
  59. Bradbury, K.R. Tritium as an Indicator of Ground-Water Age in Central Wisconsin. Groundwater 1991, 29, 398–404. [Google Scholar] [CrossRef]
  60. Imeson, A.; Verstraten, J.; van Mulligen, E.; Sevink, J. The effects of fire and water repellency on infiltration and runoff under Mediterranean type forest. Catena 1992, 19, 345–361. [Google Scholar] [CrossRef]
  61. Rosales-Rodríguez, J.A.; Esquivel-Segura, E.A.; Acevedo-Tapia, M.A.; González-Ortega, M.; Cartes-Rodríguez, E. Situación pre y post-incendio, de un ecosistema del tipo forestal Roble-Hualo, Región del Maule, Chile. Rev. For. Mesoam. Kurú 2019, 16, 55–68. [Google Scholar] [CrossRef]
  62. Prat, P.C.; Ledesma, A.; Lakshmikantha, M.R. Size effect in the cracking of drying soil. In Fracture of Nano and Engineering Materials and Structures; Springer: Dordrecht, The Netherlands, 2006; pp. 1373–1374. [Google Scholar]
  63. Cardenas, M.B.; Kanarek, M.R. Soil moisture variation and dynamics across a wildfire burn boundary in a loblolly pine (Pinus taeda) forest. J. Hydrol. 2014, 519, 490–502. [Google Scholar] [CrossRef]
  64. Giambastiani, B.M.S.; Greggio, N.; Nobili, G.; Dinelli, E.; Antonellini, M. Forest fire effects on groundwater in a coastal aquifer (Ravenna, Italy). Hydrol. Process. 2018, 32, 2377–2389. [Google Scholar] [CrossRef]
  65. Wieting, C.; Ebel, B.A.; Singha, K. Quantifying the effects of wildfire on changes in soil properties by surface burning of soils from the Boulder Creek Critical Zone Observatory. J. Hydrol. Reg. Stud. 2017, 13, 43–57. [Google Scholar] [CrossRef]
  66. Tashie, A.; Scaife, C.I.; Band, L.E. Transpiration and subsurface controls of streamflow recession characteristics. Hydrol. Process. 2019, 33, 2561–2575. [Google Scholar] [CrossRef]
  67. Scott, D.F.; Van Wyk, D.B. The effects of wildfire on soil wettability and hydrological behaviour of an afforested catchment. J. Hydrol. 1990, 121, 239–256. [Google Scholar] [CrossRef]
  68. McDonnell, J.J. A Rationale for Old Water Discharge Through Macropores in a Steep, Humid Catchment. Water Resour. Res. 1990, 26, 2821–2832. [Google Scholar] [CrossRef]
  69. Weiler, M.; McDonnell, J.J. Conceptualizing lateral preferential flow and flow networks and simulating the effects on gauged and ungauged hillslopes. Water Resour. Res. 2007, 43, W03403. [Google Scholar] [CrossRef] [Green Version]
  70. Bustamante-Ortega, R.; Morgenstern, U.; Ramirez de Arellano, P. Transit time of water discharges from catchments in coastal mountain of Chile. EGU Gen. Assem. Conf. Abstr. 2015, 17, 8100. [Google Scholar]
  71. Stewart, M.K.; Morgenstern, U.; Gusyev, M.A.; Małoszewski, P. Aggregation effects on tritium-based mean transit times and young water fractions in spatially heterogeneous catchments and groundwater systems. Hydrol. Earth Syst. Sci. 2017, 21, 4615–4627. [Google Scholar] [CrossRef] [Green Version]
  72. Kirchner, J.W. Aggregation in environmental systems—Part 1: Seasonal tracer cycles quantify young water fractions, but not mean transit times, in spatially heterogeneous catchments. Hydrol. Earth Syst. Sci. 2016, 20, 279–297. [Google Scholar] [CrossRef] [Green Version]
  73. Carvalho, A.; Flannigan, M.D.; Logan, K.A.; Gowman, L.M.; Miranda, A.I.; Borrego, C. The impact of spatial resolution on area burned and fire occurrence projections in Portugal under climate change. Clim. Chang. 2010, 98, 177. [Google Scholar] [CrossRef]
  74. Price, R.M.; Top, Z.; Happell, J.D.; Swart, P.K. Use of tritium and helium to define groundwater flow conditions in Everglades National Park. Water Resour. Res. 2003, 39, 1267. [Google Scholar] [CrossRef]
Figure 1. Catchment location and sampling points within the study site. RG: rain gauge.
Hydrology 09 00045 g001
Figure 2. Tritium concentration of Chilean rain compared to rain from Kaitoke, New Zealand. Insert shows data with higher resolution for the last 20 years up to ≈ 6 TU. Also listed in the legend are the altitudes of the rain collection stations.
Hydrology 09 00045 g002
Figure 3. A time course of monthly streamflow (in mm) for the three study catchments between 2010 and 2018. The dates of water sampling for tritium analysis are indicated by colored dots. Note that the stream in Q1 (P. radiata plantation) ceased to flow in November 2013 and recommenced in August of 2014. Flow ceased again in October 2014 and did not recommence until the first winter (May–June 2017) after the fires.
Hydrology 09 00045 g003
Figure 4. Mean transit times by month for each of the four models.
Hydrology 09 00045 g004
Figure 5. Baseflow Index (BFI) and Runoff Coefficient (RC) versus Mean MTT and TU. Mean MTT was calculated averaging the two samples of 2017 and 2018 as a baseflow annual MTT. For Q1, we took as pre-fire the 2012 samples; for Q2/Q3 the 2014 pre-fire samples were averaging as pre-fire MTT.
Hydrology 09 00045 g005
Table 2. Streamflow characterization within the experimental catchments at Quivolgo (average values pre- and post-fire).
Q1Q2Q3
CatchmentsBeforeAfterBeforeAfterBeforeAfter
Annual average flow (mm)147.8122.6367.3141.4181.8363.7
March low flow (mm)04.3719.712.77.37.8
* Average summer flow (mm)32.417.163.826.526.432.7
** Runoff coefficient0.210.100.370.120.170.28
* January to March flow. ** Sum of streamflow when is available to the sum of the rainfall when streamflow is available. Q1 streamflow available from 2010–2013 and 2017–2018, for Q2 from 2010–2015 and 2017–2018, and for Q3 2014–2016 and 2017 for Q3. Specifically, Q2 2016 flow is complete until December and the 2017 flow started in February due to the wildfire: Q3 2014 flow does not include October-November, 2017 August, and 2018 from April-July due to weir reparation. Q2 is a complete set of daily streamflow data from 2010 to 2018.
Table 3. Annual runoff coefficients pre- and post-fire (January 2017).
Pre-FirePost-Fire
Catchment201020112012201320142015201620172018
Q1 PR0.320.210.14incincn/dn/d0.090.13
Q2 NF0.410.420.360.340.370.370.340.090.17
Q3 PRMn/dn/dn/dn/d0.170.210.140.250.39 *
NF: native forest, PR: radiata pine, PRM; mix radiata pine and NF. Inc: incomplete dataset, n/d: no data. * January to April period.
Table 4. Rainfall intensity in 1 h (I) and instantaneous streamflow yield (L s−1) pre- and post-fire (when data were available).
DateI (mm h−1)Q1Q2Q3
Qt−1Qt+1Qt−1Qt+1Qt−1Qt+1
Pre-fire16 August 20168.8--2.503.211.381.98
16 October 20164.6--1.982.310.901.46
31 October 20164.2--1.541.830.291.14
Post-fire15 June201718.8--2.162.2845.2275.19
10 April 201714.43.7822.762.142.0813.7639.04
22 June 20171423.1140.242.292.5669.7779.62
Qt1: streamflow 1 h before; Qt+1: streamflow 1 h after.
Table 5. Proportion of baseflow over total flow within each catchment.
Q1Q2 **Q3 ***
YearBFIBaseflow (mm)BFIBaseflow (mm)BFIBaseflow (mm)
20100.55154.80.88269.6n/dn/d
20110.56103.30.77277.4n/dn/d
20120.4449.80.81251.7n/dn/d
2013n/dn/d0.83202.9n/dn/d
2014n/dn/d0.69305.60.54117.3
2015n/dn/d0.83321.70.69162.2
2016n/dn/d0.85190.80.6964.0
20170.31 *41.20.93127.50.51185.9
20180.6673.40.94136.60.71149.7
n/d: no data: * Q1 started to flow again in June 2017 after fires: ** Q2 2016 flow is complete until December and 2017 flow started in February due to the wildfire: *** Q3 2014 flow does not include October-November, 2017 August, and 2018 from April-July due to weir reparation.
Table 6. Monthly flow (mm) at the time of sample collection for tritium analysis in the three Quivolgo catchments.
Date of SamplingQ1Q2Q3
7 September 201211.0--
4 March 20130.0--
17 February 2014-13.69.3
15 September 201415.282.940.6
18 May 20170.012.526.9
17 October 201744.914.882.3
6 March 20184.413.114.5
21 November 201811.99.941.0
Table 7. Tritium concentrations (TU) at sampling dates in three experimental catchments at Quivolgo and lab analysis dates.
Stream Sampling DateQ1 Stream PRQ2 Stream NFQ3 Stream PRMLab Analysis Date
TU
7 September 20120.831 ± 0.026--1 June 2013 *
4 March 20130.801 ± 0.025--1 June 2013 *
17 February 2014-0.597 ± 0.0200.613 ± 0.01823 March 2015
15 September 20140.927 ± 0.0270.779 ± 0.0220.819 ± 0.02223 March 2015
18 May20170.784 ± 0.0290.615 ± 0.0270.754 ± 0.02922 July 2019
17 October 20170.818 ± 0.0290.704 ± 0.0270.726 ± 0.02722 July 2019
6 March20180.689 ± 0.0290.614 ± 0.0210.652 ± 0.02122 July2019
21 November 20180.727 ± 0.0230.540 ± 0.0250.621 ± 0.0268 June 2020
Source sampling dateQ1 source PRQ2 source NFQ3 source PRMLab analysis date
TU
6 March 20180.708 ± 0.0270.766 ± 0.0230.624 ± 0.02122 July 2019
21 November20180.792 ± 0.0240.689 ± 0.0230.615 ± 0.0268 June 2020
NF: native forest, PR: radiata pine, PRM; mix radiata pine and NF. * An approximate date due to precluded lab database.
Table 8. Mean transit time (years) for all catchments by each of the models.
Stream Sampling DateQ1 Stream PR
MTT (Years)EMMEPM (0.25)EPM (0.43)DM (0.8)
7 September 20129 a8.5 a8 a11 a
4 March 201311 a9 a8.5 a12 a
17 February 2014----
15 September 20145 a5.5 a5.5 a6 a
18 May 20179 a8 a8 a10 a
17 October 20178 a6.5 a6.5 a8 a
6 March 201815 a12 a11.5 a15 a
21 November 201813 a10 a9.5 a13 a
6 March 2018 *13.51110.514
21 November 2018 *9.587.59.5
Stream sampling dateQ2 stream NF
MTT (years)EMMEPM (0.25)EPM (0.43)DM (0.8)
17 February 201430 a22 a19 a29 a
15 September 201411 a10 a9.5 a13 a
18 May 201722 a17 a17 a23 a
17 October 201714 a11 a11 a14 a
6 March 201822 a17 a15 a21 a
21 November 201830 a22 a20 a30 a
6 March 2018 *1098.511
21 November 2018 *15111115
Stream sampling dateQ3 stream PRM
MTT (years)EMMEPM (0.25)EPM (0.43)DM (0.8)
17 February 201429 a20 a18 a25 a
15 September 20149 a8.5 a8 a11 a
18 May 201711 a10 a10 a12 a
17 October 201713 a10.5 a10 a13 a
6 March 201818 a14 a13 a18 a
21 November 201821 a16 a15 a20.5 a
6 March 2018 *21161521
21 November 2018 *21.5151621
NF: native forest, PR: radiata pine, PRM; mix radiata pine and NF. *: Sample at the source of headwater. a/b: The same letter means no significant difference within MTT per model and per catchment.
Publisher’s Note: MDPI stays neutral with regard to jurisdictional claims in published maps and institutional affiliations.

