Hydrological Response of Natural Mediterranean Watersheds to Forest Fires
by
 , , and
Konstantinos X. Soulis
1,* ,
,
Konstantina Amalia Generali
1, 
Christina Papadaki
2 ,
,
Christos Theodoropoulos
2 and
and
Emmanouil Psomiadis
1
1
Department of Natural Resources Management and Agricultural Engineering, Agricultural University of Athens, 75 Iera Odos st., 11855 Athens, Greece
2
Hellenic Centre for Marine Research, Institute of Marine Biological Resources and Inland Waters, 46.7 km Athens-Sounio Ave., 19013 Anavyssos, Greece
*
Author to whom correspondence should be addressed.
Hydrology 2021, 8(1), 15; https://doi.org/10.3390/hydrology8010015
Submission received: 24 December 2020
/
Revised: 14 January 2021
/
Accepted: 20 January 2021
/
Published: 22 January 2021
(This article belongs to the Special Issue Impacts of Land Use Changes on Hydrological Processes and Modelling)
Abstract
:Fires are common in forested Mediterranean-climate watersheds. Forest fires cause abrupt land use/cover (LULC) changes affecting soil properties and hydrological processes within and across watersheds. A major forest fire in Attica, Greece, that affected the Lykorrema stream experimental watershed provided the opportunity for an in-depth study of the impact of forest fires on the hydrological balance of natural Mediterranean watersheds. To this end, detailed hydrometeorological data recorded for five years before and for five years after the fire incidence were utilized. SWAT model was also used to consider the potential influence of meteorological conditions temporal variability on the results of the analysis. Specifically, SWAT model was parameterized calibrated and validated for the pre-fire and the post-fire conditions using the corresponding detailed hydrometeorological data for the respective periods. Then the two versions of the model were applied for the entire period providing comprehensive time series for all the flows and storages in the studied watershed. In this way, the post-fire LULC and soil properties changes were the only influencing factors driving the alterations in the hydrological balance allowing an impartial comparison. The obtained results highlighted the considerable impact of forest fires on the watersheds’ hydrological functioning. Specifically, the maximum direct runoff depths and the maximum flow rates were substantially higher in the post-fire conditions. In contrast, actual evapotranspiration was reduced, when the effect of fire was considered. The obtained results indicate that the altered post-fire LULC and soil properties are major drivers of the watershed’s hydrological balance changes. SWAT model performed sufficiently well for both the pre- and post-fire conditions and provided a deeper insight into the impact of forest fires on the hydrological functioning of natural Mediterranean watersheds.
1. Introduction
One of the most common hazards of the forested watersheds in the Mediterranean basin is forest fires. Anthropogenic activities are considered as a driving force of wildfires, however, the lack of forest monitoring and climate change play also a significant role [1,2,3]. In 2018 the Intergovernmental Panel on Climate Change (IPCC) reported that human-induced warming has already increased to 1 °C above pre-industrial levels. Studies have shown that with increasing warming pattern the burnt area is also expected to increase [4].
Forest fires have numerous severe outcomes. Alterations in vegetation cover, soil properties disturbance, changes in the hydrological behavior of watersheds as well as probable life and property loss are some of the results of a forest fire [5]. Loss in vegetation cover has a direct impact in the hydrological response of a watershed with increased overland flow caused by the reduction of infiltration as well as through decreased evapotranspiration [6,7,8,9,10,11,12,13,14,15]. The hydrological response of an area can be also indirectly affected by the disturbances of the soil properties of the area. The destruction of the top soil organic matter that leads to the destabilization of the soil structure and the increased ground coverage from ash may exacerbate the impacts of water repellency [1,16,17]. This phenomenon leads to the reduction of infiltration and subsequently to the increase of overland flow [1,18]. The decrease of evapotranspiration may also result in increased groundwater recharge [19,20,21].
The effect of forest fires on the hydrological behavior of a certain area is obvious for around one to two years after the fire event [1,18,22]. However, several studies have revealed that the impact of the forest fires in the hydrological behavior can be apparent even five to seven years after the fire incident [1,6,18,23,24]. The required time period for the hydrological processes of a watershed to return to pre-fire conditions is strongly dependent on the rate by which the vegetation cover is restored. In more detail, the amount of time needed for full runoff restoration depends on the different recovery rates of each species existing before the fire in the area [25,26,27]. However, influencing factors of the hydrological process restoration rate are the meteorological and hydrological conditions of the area as well as the erodibility of the soils and the steepness of the slopes [23,28,29]. The results of Wine et al. [30] indicated that Mediterranean ecoregion divisions may present relatively fast post-fire recovery rates.
In a post-fire regime, the difference in the water balance can be the result of land use changes or/and of climatic interferences that may occur across a range of time scales [21,30,31,32]. Several studies have been conducted in order to determine how forest fires affect the hydrology of natural river basins. As an example, Zhou et al. [18] in their study concluded that the hydrological behavior of the studied watershed in southeast Australia was severely altered because of wildfires. More specifically, for the first 15 years after the fire event the streamflow of the watershed increased. This resulted from the decrease in evapotranspiration and soil infiltration. Another study that draws the same conclusions regarding the effect of forest fires is the one conducted by Pereira et al. [13]. In the period after the fire incident, the peak runoff resulting from heavy rainfall is higher than in the pre-fire period as well as the runoff during the dry periods is lower than in the pre-fire period. However, they concluded that the average increase in daily runoff was around 5% on average and 20% at most.
Generally, the analysis of the effect of forest fires on the hydrological response of natural watersheds is very challenging. The main difficulties are: a) the lack of detailed hydrometeorological data for adequate periods for both the pre-fire and the post-fire periods and b) the effect of meteorological conditions variability that makes the two periods not directly comparable as the postfire recovery period is much shorter than the typical 30 years reference period [18,33]. Additionally, the effects of climate variability could be confused for wildfire effects. Lagged watershed responses may also complicate any further analysis [21,30]. For this reason, hydrological modeling is routinely used to evaluate the effect of forest fires on the hydrological response of natural watersheds and to assess the associated hydrological risks (e.g. [12,13,14,15,18,34,35,36,37,38,39,40,41,42,43,44,45,46]. However, in most relevant studies, model parameterization for the post-fire conditions is made arbitrary depending on the fire severity or the expected land cover changes, instead of calibrating and validating the model based on actual hydrological observations for the pre-fire and post-fire periods [18].
Earth Observation (EO) satellites provide multitemporal, high-resolution data, with systematic revisit and synoptic view of the earth surface in local, regional, and national scale. Therefore, they consist of an accurate mean to ideally map the LULC temporal changes before and after fire events [47,48].
A major forest fire in Attica, Greece, which occurred in August 2009 and affected the Lykorrema stream experimental watershed [1,17,33,48,49,50,51,52,53] provided the opportunity to study the effect of forest fires on the hydrological balance of natural watersheds utilizing detailed hydrometeorological data obtained both before and after the fire incidence. A preliminary assessment carried out by Soulis et al. [1] in the same study area soon after the forest fire, revealed an apparent increment of direct runoff depths and peak flow discharges. In this study, hydrological modeling and detailed hydrological and meteorological data that are available for the study area for the time period between 2004 and 2014 covering almost equally the pre-fire and post-fire conditions are utilized to make an in-depth investigation of the impact of forest fires on the hydrological processes and the hydrological balance of natural Mediterranean watersheds. In order to investigate the effect of the post-fire land use changes as the only influencing factor of the alterations in the water balance, the soil water assessment tool (SWAT) model was used. Specifically, SWAT model was calibrated and validated for the pre-fire and the post-fire conditions using the corresponding detailed hydrometeorological data for both periods. Then the two versions of the model were executed for the entire period providing comprehensive time series for all the flows and storages in the studied watershed. In this way, the post fire land use and soil properties changes were the only influencing factors of the alterations in the water balance allowing an impartial comparison. In this way it was made possible to consider the influence of meteorological conditions variability in the pre-fire and the post-fire period, to provide a deeper insight on the forest fire impact on the hydrological processes and to quantify its effect on the hydrological balance components.
2. Materials and Methods
2.1. Study Area and Input Data
The study was executed based on the small-scale natural Mediterranean experimental watershed of Lykorema stream. The watershed lays in the east side of Pedeli Mountain in Attica, Greece (coordinates: UL 23°53′33″ E–38°04′13″ N, LR 23°56′00″ E–38°02′28″ N) and it covers an area of 7.84 km2 (Figure 1). The elevation of the watershed ranges between 950 m.a.s.l and 280 m.a.s.l with an average elevation of 560 m.a.s.l. The average slope of the basin is 36%, while overall the watershed is characterized by a relatively sharp relief.
The climate of Attica, where the basin is located, is characterized as Mediterranean with mild, wet winters and hot, dry summers. The biggest part of precipitation falls in the autumn–spring period in liquid state, with average rainfall for the study period (2004–2014) being around 668 mm. The average maximum temperature of 31.3 °C occurs during July while the average minimum temperature of 3.4 °C occurs in January. The average annual temperature for the study time period was 16.3 °C. Because of the small size of the studied headwater watershed, its steep relief and the limited contribution of groundwater flow from deep aquifers, the watershed responds promptly to rainfall inputs [53].
The dominating geological formation of the watershed is schists covering 96% of the area, while the rest is covered by marbles. The geological formations of the basin are strongly tectonically fractured with eroded upper layers [54]. Soulis et al. [17,53] executed a detailed study of the soil characteristics of the watershed including an analysis of the spatial and temporal variability of hydraulic conductivity during the study period [17]. In general, it is described that the basin is mainly covered by coarse soils while smaller parts with medium texture soils, both with high hydraulic conductivities (Figure 1). Soil hydraulic conductivity in the studied watershed was profoundly decreased after the effect of the forest fire of 2009, but the measurements seven years after the incidence were similar to the pre-fire period [17].
The Lykorema stream experimental watershed is operated by the Agricultural University of Athens and it is instrumented and systemically studied since September 2004. The hydro-meteorological network that covers the area is relatively dense. It includes one hydrometric station at the outlet of the basin and it encloses five rain gauges, four temperature-relative humidity recorders, and one full meteorological station with a soil moisture sensor array (Figure 1). The hydrometric station in the outlet of the basin consisted of a sharp crested-weir accompanied by a digital water-level recorder. Soon after the fire of 2009, the station was expanded with a larger broad-crested weir, in order to cover the higher flow rates and the increased sediment movements. Furthermore, a digital water-level recorder was installed at the middle of a long rectangular culvert just before the weir to secure the measurement of any unexpectedly high peak flows. More details about the hydrometeorological network and the calibration of the hydrometric stations are provided by Soulis and Dercas [49] and Soulis [33].
The meteorological input for the study was provided by four rain gauges and one full meteorological station, which measured the data for rainfall, temperature, wind speed, relative humidity, and solar radiation. All stations are distributed within the watershed, perform measurements with 10 minutes temporal step and were provided by the Agricultural University of Athens (AUA) and the National Technical University of Athens (NTUA). A quality check of the meteorological data was performed including the analysis of the correlation between nearby stations and the identification of gaps and obviously erroneous values, such as unrealistic values or values beyond specific thresholds, considering also the metadata about malfunctions in the monitoring network. Missing data and erroneous values within the meteorological time series were reproduced via spatial interpolation from the available data of the nearest station. The temporal step of the dataset used in this study is daily and it covers the time period between 2001 and 2014.
Lykorema stream watershed was selected for this study, as it experienced a major wildfire incident in 2009 during the operation of the experimental watershed. This wildfire affected the larger part of the watershed (Figure 1) and provided the opportunity for an in-depth study of the impact of forest fires on the hydrological balance of natural Mediterranean watersheds utilizing the detailed hydrometeorological data obtained for adequate time before and after the fire incidence.
The land cover classification for the conditions before and after the wildfire of 2009 was performed with the assistance of remote sensing and extensive field surveys. More specifically, images from Landsat-5 Thematic Mapper satellite system were acquired through the Earth Explorer system of the United States Geological Survey (https://earthexplorer.usgs.gov/) [48]. The Maximum Likelihood classification technique was applied using ground control points collected from the field survey. The boundaries of the obtained classes were refined using very high-resolution orthophoto maps delivering a highly accurate LULC map.
Consequently, the watershed was covered mainly by a mixed vegetation cover consisting of young pine trees, pasture, and a few scattered tufts of old trees. A small part of the basin was covered by bare rock, as well as from a network of forest roads [50,53]. After the fire incident of 2009, almost 87% of the basin area was affected, because of the flammable land cover and the weather conditions at the time. However, because of the topography of the basin, consisting of steep slopes, there are parts of the basin that remained unburnt or semi-burnt [33].
2.2. Model
Hydrological modeling is routinely used to evaluate the effect of forest fires on the hydrological response of natural watersheds [18,34,35,36,37,38,39,40,41,42,43]. In this study, the soil and water assessment tool (SWAT) was used to quantify the effect of forest fires on the various hydrological balance components taking into consideration the potential influence of the different meteorological conditions prevailing the period before and after the fire incident on the results of the current analysis. Specifically, the most recent version of ArcSWAT 2012 interface (https://swat.tamu.edu/software/arcswat/) for ArcGIS 10.5.l (ESRI) was used and all geospatial analysis was also made in the later GIS software platform.
SWAT is a process-based semi-distributed, conceptual and continuous hydrological model which is developed to predict the impacts of land management practices on the environment variables in large complex watersheds with varying soils, land use, and management conditions over long periods of time [55]. It was selected because it is a robust, well-established, public domain model that can be used for this purpose and that is very well suited in the case of natural mountainous watersheds. SWAT model has been applied successfully in many relevant studies [56,57,58,59,60,61,62,63].
SWAT divides the basin into several subbasins to achieve better simulation of the physical processes in the watershed. The use of subbasins is of great benefit particularly in watershed areas that are dominated by different land uses soil types and hydrological behavior. Furthermore, SWAT divides the watershed into hydrological response units (HRUs), which are lumped areas within the watershed with the same land use, soil type, and slope. The model simulates all hydrological processes in HRU level. In order to get accurate predictions on the studied process, SWAT first investigates the water balance of the studied area. Water balance is the driving force of all the processes in the watershed area [55].
2.2.1. Model Setup
The SWAT model was set up with two different configurations during this study. In the first case, the model configured based on the information of the watershed before the fire incident (Oct 2004–Aug 2009) and in the second case regarding the basin’s information after the fire (Aug 2009–Dec 2014). For both set-ups, the same digital elevation model (DEM) was occupied. The DEM was generated using the corresponding 1/5000 scale topographic diagrams of the Hellenic Military Geographical Service and has a spatial resolution of 5 m × 5 m. Moreover, the flow direction and flow accumulation were computed for both set-ups with the same threshold, which resulted in the division of the whole area into 69 subbasins. As a next step land use, soil and slope maps were imported to the model, which were required for the formation of the HRUs. Each model had different land use and soil maps corresponding to the pre-fire and the post-fire conditions. This whole procedure resulted in the formation of 244 HRUs. Furthermore, the meteorological information of each period was imported to the two models. In both models Penman-Monteith equation [64,65] was selected as the reference evapotranspiration calculation method, while surface runoff and infiltration were calculated through the SCS-CN methodology [33,48,51,52,66]. Lastly in both models the first 3 years were used for model warm up, while the model output was provided in daily time step.
One important aspect of the whole model setup procedure was the assignment of the land use properties of the Lykorema watershed to the corresponding land uses of the USA region. SWAT provides a table of properties for different land use types [55]. Knowing the land use properties of our watershed we assigned each land use type to the corresponding type of the SWAT table. This way it was made certain that the land use input was prepared exactly as the model needed it. Regarding the soil properties, it was needed to enrich the SWAT soil table with three new soil classes that were representing the soil classes of the Lykorema watershed. Based on the detailed information over the Lykorema watershed’s soils obtained in previous studies [17,53], the sufficient enrichment of the SWAT table was performed.
2.2.2. Sensitivity Analysis, Calibration, and Validation
Sensitivity analysis, calibration, and validation were carried out with the assistance of the SWAT Calibration and Uncertainty Procedures (SWAT-CUP) software. SWAT-CUP (https://swat.tamu.edu/software/swat-cup/) is a calibration tool fully compatible with the output file format of SWAT, thus is easy to implement when using SWAT as the hydrological model. For this study SUFI-2 [67] was selected as the calibration algorithm. SUFI-2 serves as a combination of the calibration and the uncertainty analysis and thus parameter uncertainty is considered for all sources of uncertainty, like conceptual model, driving variable or measured data.
The first step was to perform a sensitivity analysis for both models. Sensitivity analysis (SA) aims to identify the key parameters that affect model performance and it plays important roles in model parameterization, calibration, optimization, and uncertainty quantification [68]. In our study, the one-at-a-time sensitivity analysis method was used. Through sensitivity analysis model parameters affecting the surface runoff, the groundwater, the baseflow, the evapotranspiration, the soil properties, and the response of the basin were tested. As a result, the group of sensitive parameters were identified for the calibration procedure.
An important fact is that the curve number (CN) was not included in the sensitivity analysis and the calibration procedure, even if it is a key influencing parameter for the model. Specifically, for the CN parameter the spatially distributed CN values that were directly estimated using measured rainfall and runoff data by Soulis [33] for the studied watershed for the pre-fire and the postfire conditions using the Soulis and Valiantzas method the [51,52] were utilized to reduce the number of calibration parameters. For each soil and land cover complex of the watershed, the corresponding CN number was assigned as described in the study of Soulis [33].
After defining the sensitive parameters for the model, the next step was the model calibration. For both models, three years were used as the calibration period. For this time period, the parameters that resulted from the sensitivity analysis were occupied and were assigned with physical ranges. For the execution of the calibration, several iterations of 2000 simulation runs each were performed until adequate model performance to be achieved. It should be noted that three different calibration approaches were attempted and compared in this study to facilitate a more representative comparison between the pre-fire and post-fire conditions. In the first attempt, the two model configurations were calibrated independently. In the second attempt, the pre-fire configuration of the model was initially calibrated. Then the post-fire model was calibrated using the parameter values that were specified for the pre-fire configuration and allowing as free parameters only those that could be possibly affected by the forest fire (e.g., soil hydraulic conductivity and parameters related with the vegetation cover) and only for the affected parts of the watershed. As it was explained above the CN values of the affected areas were also changed accordingly. In the third attempt, the postfire configuration of the model was initially calibrated. Then the pre-fire configuration of the model was tested with the parameter values that were specified for the post-fire configuration. The most suitable calibration approach was selected by comparing the performance achieved by each one of them and considering as well their ability to provide representative results for the two examined scenarios. As it is explained in detail in Section 3, the most representative model configurations were obtained with the second approach.
The next step was the model validation to verify the ability of the models to adequately describe the pre-fire and post-fire hydrological functioning [69]. In order to execute the model validation, the parameter values that were specified during the calibration procedure were occupied. Each model was run for two years and the assessment of the model performance was performed.
Model performance, during the calibration and validation procedures, was evaluated statistically based on the Nash–Sutcliffe efficiency and the modified Nash–Sutcliffe efficiency (NSE and MNSE, −∞ to +1, values close to +1 indicate better model performance) and the percent bias (PBIAS, indicator of under- or over-estimation, values close to 0 indicate better model performance). The performance was considered satisfactory if NSE > 0.5 and PBIAS < ±25% [70].
2.2.3. Model Application and Data Analysis
The main goal of this study is to investigate the impact of forest fires on the hydrological balance of natural watersheds. The study utilizes 10 years of detailed hydrometeorological data, 5 before and 5 after the fire incident, as well as detailed field and physiographic data. However, impartial comparison of the hydrological balance for the two periods is not feasible as the weather conditions for these short time periods before and after the fire vary making it very difficult to differentiate the effect of the forest fire from the effect of weather conditions variability.
Accordingly, in order to study the effect of the post-fire changes as the only influencing factor of the alterations in the water balance, the two configurations of SWAT model that were calibrated and validated for the pre-fire and the post-fire periods were applied from 2001 to 2014 covering the entire study period (2004–2014) and three additional years as the warmup period (2001–2003). In this way, it was made possible to make an impartial comparison of the hydrological balance for the two periods considering the influence of the weather conditions variability in the pre-fire and the post-fire period and additionally to provide a deeper insight on the forest fire impact on the hydrological processes and to quantify its effect on the hydrological balance components.
The obtained 10-year data series for the main hydrological balance components (discharge, surface, lateral and groundwater flow, actual evapotranspiration, and percolation) were statistically analyzed and compared in daily, monthly, and annual time steps. The flow duration curves (FDC) for the two simulated data series and the observed data were created and compared as well. FDC is a plot of discharge versus the percentage of time that each particular discharge is equaled or exceeded (exceedance probability).
3. Results
3.1. Model Calibration and Validation
To obtain a general overview of the behavior of the two model configurations, the initial model performance without calibration was examined. Both the pre-fire model and post-fire model configurations performed poorly without calibration. Specifically, they show significant overestimation of the high flows and underestimation of baseflow. This information provided a solid ground to further parametrize the models in a sensible way during the calibration procedure.
Next step was the sensitivity analysis. Numerous parameters, which could potentially affect the direct runoff response and the base flow (e.g. surface, lateral and groundwater flow, deep percolation, and evapotranspiration processes), were tested. As stated before, a one-at-a-time sensitivity analysis was performed in order to detect the effect of each parameter alone, without the influence of any other. The sensitivity analysis produced identical sensitive parameters for both models. The parameters that were specified to be used in the calibration procedure are presented in Table 1.
However, during the model calibration procedure, it was observed that the addition of some additional parameters could improve the model performance, such as depth to the impermeable layer (DEP_IMP), and delay of the lateral flow (LAT_TIME). It was also observed that the calibration of the soil hydraulic properties parameters independently for each soil type achieved superior performance than their calibration in lumped form.
The calibration of the CN parameter was also attempted to examine if the adjustment of the CN values directly estimated by rainfall and runoff measurements [33] could provide a noticeable improvement in the models’ performance. The obtained results indicated that the optimum calibrated values of the CN parameter for each soil-cover complex slightly changed (less than ±1). Any improvements in model performance were also negligible.
For the pre-fire configuration of the model, the available period for calibration and validation was from Oct 2004 until the fire event in Aug 2009. This time period included almost 5 hydrological years, of which the first 2 years were wet and the last 2 years were very dry. Therefore, the hydrological years 2004–2005, 2007–2008, and 2008–2009 were used for the calibration and the hydrological years 2005–2006 and 2006–2007 for validation in order to include at least one wet year for both calibration and validation and to increase the homogeneity between the two periods. For the post-fire model configuration, the available time period for calibration and validation was from Oct 2009 until Dec 2014, covering almost 5.5 hydrological years. In this case, the distribution of wet and dry years was better compared to the pre-fire period. Therefore, for simplicity, the first 3.5 hydrological years were randomly selected as the calibration period, while the remaining 2 as validation period.
The model performance, for calibration and validation, and its suitability for the purposes of this study were evaluated both quantitatively based on the performance metrics and qualitatively based on a graphical representation of the simulated versus the observed discharge. The model performance metrics obtained with the three approaches described in the methodology section are presented in Table 2.
As can be seen in this table the obtained NSE values for the independent calibration and the corresponding validation of the pre-fire model configuration can be considered as satisfactory. The obtained PBIAS values were also sufficient while the MNSE values were only acceptable indicating that estimation of the low flows was the most challenging. It can be also seen that using the calibrated parameters from the post-fire configuration the performance of the model is not acceptable; however, it is interesting that it is not very far from that. As regards the post-fire configuration, the performance achieved for the independent calibration is very good while performance achieved with the calibration of only the parameters that could possibly be affected by the forest fire and only for the affected parts of the watershed was only slightly inferior.
Based on the above results, the model configurations obtained with the second approach, i.e., the independent calibration of the pre-fire model and calibration of only the parameters affected by the forest fire for the affected parts of the watershed for the post-fire model, was selected for the investigation of the impact of forest fires on the hydrological balance of the studied watershed even if it obtained slightly inferior performance for the post-fire period.
The main parameters that varied in the post-fire version of the model were the saturated soil hydraulic conductivity (SOL_K, slightly reduced), the available water capacity of the soil layer (SOL_AWC, slightly reduced), the lateral flow travel time (LAT_TTIME, reduced), the soil evaporation compensation factor (ESCO, increased), the plant uptake compensation factor (EPCO, reduced), and the curve number (CN, increased) for the two soil types of the affected area. The new parameters values are related with reduced infiltration, faster lateral flow, and reduced evapotranspiration from deeper layers of the soil, which is following the expected behavior of the model for the post-fire conditions.
Using similar parameterization for both periods at least for the characteristics and the parts of the watershed that were not affected by the fire, may provide a better comparison between the two periods and a better insight on the changes of the hydrological processes due to the fire. Considering also that precipitation was higher during the post-fire period, the selected calibration approach verifies additionally the ability of the model that was calibrated for the pre-fire period to provide adequate predictions for the higher precipitation depths observed during the post-fire period. A graphical representation of the simulated daily discharge obtained by the selected calibration approach versus the observed discharge is provided in Figure 2.
As can be seen in the graphical representation of the simulated versus the observed discharge for the pre-fire period (Figure 2a), the simulated discharge follows closely enough the observed one; however, in some cases, the model was unable to reproduce the peak flows. In contrast, the model predicts more accurately the peak flows for the post-fire period (Figure 2b) and follows closely the observed hydrograph as well, resulting in superior performance for the post-fire period. Based on the quantitative and the qualitative evaluation it can be deduced that the two configurations of the model reproduce sufficiently the general patterns of discharge variation for the pre-fire and the post-fire conditions.
3.2. Hydrological Response
From the analysis of the observed rainfall-runoff data for the pre-fire and the post-fire periods, it can be deduced that the wildfire of August 2009 had a considerable effect on the hydrological response of the case study watershed. As can be seen in Figure 2, the observed daily peak discharges are much higher in the post-fire period. Specifically, the maximum observed daily discharges during the pre-fire and the post-fire periods were 0.54 and 4.94 m3/s correspondingly. At the same time, the maximum daily rainfall depths during the pre-fire and the post-fire periods were 111.4 and 149 mm correspondingly. In the same figure, it can be also seen that similar rainfall depths resulted in much higher discharges in the post-fire period. Increased discharges are observed during the entire studied post-fire period.
A similar picture is obtained when the maximum hourly discharges are considered (Figure 3). Specifically, the maximum peak discharge observed after the forest fire was 81.25 m3/s, which was almost 11.8 times higher than the maximum peak discharge observed before the fire (6.9 m3/s). This behavior is more obvious in Figure 3 where the peak hourly discharges for the events that took place in the pre-fire and the post-fire period are plotted in comparison with the total rainfall depth and the maximum hourly rainfall intensity for each event. As can be seen, even if there is substantial scatter, it is obvious that higher peak discharges are observed for similar rainfall depths and similar rainfall intensities. Soulis et al. [53] concluded that higher runoff values are not correlated with increased antecedent soil moisture; accordingly, higher peak discharges cannot be attributed solely to more wet initial conditions during the post-fire period.
However, the observed deviations of the weather conditions before and after the fire (Figure 2) hamper the comparison and make the deduction of safe conclusions very difficult. To this end, the model configurations corresponding to the pre-fire and the post-fire conditions were applied for the entire 10-years study period (Oct 2004–Dec 2014). Three and half additional years (2001–2004) were used as warmup period. The obtained results in daily time step are summarized in Table 3. As can be seen the maximum and the average daily discharges are profoundly higher in the post-fire conditions. In general, obvious differences are observed in higher flows; specifically, flows over the 5th percentile flow (flow equaled or exceeded at least 5% of the time). The statistics of the observed discharges for the entire period lay somewhere between the simulated flows for the two investigated scenarios. However, both model configurations seem to underestimate the lower flows.
A clearer picture is presented in the flow duration curves depicted in Figure 4. All depicted FDCs are generally steep which is reasonable for a small watershed in a Mediterranean climate. The FDC for the post-fire conditions (Figure 4b), though, is steeper indicating significant high flows for short periods of time and higher flow variability. The middle and lower parts of the FDCs corresponding to the simulated discharges for the two scenarios are very similar. The differences observed for very low flows are difficult to be explained as the magnitude of these flows is similar to possible flow measurements errors and is also lower than the model accuracy. The FDCs obtained from the analysis of the observed discharges before and after the fire incident indicate that discharges are generally higher in the post-fire period. However, this fact cannot be attributed to the effects of fire alone as the post-fire period was wetter than the pre-fire period (Table 4).
In Figure 5, the monthly runoff depth temporal distribution against the monthly precipitation depth is presented. As can be seen the simulated runoff depth with the pre-fire model configuration follows the observed one during the pre-fire period (until Aug 2009), but it is lower than that during the post-fire period (from Sep 2009). The opposite behavior is observed for the simulated runoff depth with the post-fire model configuration. This observation indicates that the two versions of the model describe sufficiently well the general pattern of the runoff response for the pre-fire and the post-fire conditions correspondingly. Compering the simulated monthly runoff depths for the two scenarios it can be observed that during the wet season runoff depths under the pre-fire conditions are obviously higher than the corresponding runoff depths under the post-fire conditions. During the dry season, simulated runoff depths are similar in both scenarios.
The use of SWAT in this study had the additional aim to provide information about wildfires effect on the hydrological processes and to quantify its effect on the various hydrological balance components. A summary of the water balance at an annual time step based on the model results for the pre-fire and the post-fire periods is presented in Table 4 and a graphical representation of the average annual values of the simulated water balance components is provided in Figure 6.
As can be seen in Figure 6, while the lateral flow is similar in both scenarios, surface flow is much higher in the post-fire conditions (almost three times higher). The groundwater flow is negligible in both cases. Accordingly, the higher water yield after the effect of fire is the result of the higher surface runoff during storm events. This fact explains the higher peak discharges during the post-fire period and the small differences in the low flows.
An additional interesting finding is the noticeably increased sediment yield (4.5 times higher) under the post fire conditions, especially during the wet years (Table 4), which is related to the increased surface flow. It should be noted though that the parameters related to soil erosion (soil erodibility factor) were not calibrated because of the lack of measured sediment data.
In Figure 6, the actual evapotranspiration is profoundly lower by about 29.5% in the post-fire conditions than in the pre-fire conditions. Under natural conditions, the watershed is mostly covered with bushes and trees typical to Mediterranean environments (Figure 7a) that have very deep roots and are able to extract water from the deeper soil layers or even the sallow aquifer formed in the tectonically fractured and eroded upper layers of the parent material [71]. The forest fire destroys the vegetation cover (Figure 7b) having as a result the reduction of actual evapotranspiration. The first years after the fire the watershed is covered by herbaceous vegetation during the wet period (Figure 7c); however, this type of vegetation cannot extract water from the deeper soil layers and they die during the dry period limiting the actual evapotranspiration. The lower actual evapotranspiration results in higher water yield by about 38.9% and higher percolation by about 29.4% (Figure 6 and Table 4).
Similar observations can be made in the temporal variation of the main hydrological balance components for the two examined scenarios that are illustrated in Figure 8 and Figure 9. A remarkable observation is that after the effect of the forest fire, runoff response is dominated by surface runoff mostly during wet years (Figure 8b). In dry years lateral flow is generally higher than surface flow as is also the case during the entire study period for the pre-fire conditions (Figure 8a).
Groundwater flow is negligible in all cases as the watershed is small with very sharp relief. The only exception is the last year of the study period for the post-fire conditions (Figure 8b). In this instance, noticeable groundwater flow is observed after a series of wet years and due to the decreased actual evapotranspiration. However, it should be considered that the parameters related with groundwater flow were not sensitive in the pre-fire period as the groundwater flow was negligible at that period, limiting thus the confidence in the resulted groundwater flow estimations for the post-fire period.
The temporal variation of the main hydrological balance components for the pre-fire and the post-fire conditions is illustrated in Figure 9. Interestingly, even if actual evapotranspiration is generally higher in the pre-fire scenario, the difference seems to be higher in dry years than in wet years (Figure 9a). This observation supports the assumption mentioned above that decreased evapotranspiration in the post-fire conditions could be the result of the replacement of xerophytic bushes and trees with herbaceous vegetation that is unable to extract water from deeper layers in dry years.
As it was expected, percolation is higher in wet years and especially in successive wet years. Moreover, the observed differences in percolation depths between the two scenarios also seem to be higher in dry years than in wet ones (Figure 9b) following the corresponding differences of evapotranspiration depths. A final observation is that the runoff hydrograph is sharper after the effect of the forest fire especially in wet years (Figure 9c) when surface runoff dominates the runoff response (Figure 8b). As a result, the simulated sediment yield is much higher in years characterized by surface runoff dominance (Table 4 and Figure 8b, hydrological years 2010–2011 and 2012–2013).
4. Discussion
The initial model performance indicated that, at least in this application, SWAT model is unable to describe the hydrological response of the watershed for both scenarios without calibration even if detailed soil, land covet, topographic and field data were used for its set-up. The lack of clear physical basis in models’ parameterization (i.e., need for calibration) is a major problem in ungauged basins [17,72,73,74,75], considering also that hydrological data are in many cases scarce. As also reported by Merheb et al. [75] watersheds show very heterogeneous responses over time and space, resulting in limitations in hydrological modelling and large uncertainties in predictions. Hydrological modeling is routinely used for the investigation of land use land cover changes and forest fires impact on hydrological response [12,13,14,15,18,34,35,36,37,38,39,40,41,42,43,44,45]. However, in most cases, because of the lack of observed hydrological data, especially for the post-fire period, the models are used without calibration and validation or with limited calibration. Accordingly, detailed hydro-meteorological data for an adequate period before and after a wildfire incident in a well-studied watershed are valuable for the investigation of the effect of forest fires. Though, similar datasets are rare as, in addition to the huge effort needed to secure the continuation of the measurements after the wildfire, the accidental occurrence of a wildfire is also required as it was the case in this study. For this reason, some researchers also exploit prescribed burning in similar studies [6,25,46,76].
SWAT model performed adequately well, especially in the post-fire conditions. Interestingly the calibration of the soil hydraulic properties parameters independently for each soil type achieved superior performance than their calibration in lumped form. The studied watershed is characterized by very high spatial variability [17] and for this reason, a fine discretization was used. As an example, Soulis and Valiantzas [51] suggested that the use of the SCS-CN method in lumped form may reduce the performance of the method in watersheds characterized by increased spatial variability. In this study, the spatially distributed CN parameter values that were directly estimated using measured rainfall and runoff data by Soulis [33] for the studied watershed were successfully used. In this manner, the number of calibration parameters was reduced. Further calibration of CN parameter did not provide any improvements in the model performance. Accordingly, using a method for the direct estimation of CN parameters, such as the method proposed by Soulis and Valiantzas [33,51,52], may provide a good alternative facilitating the calibration of hydrological models.
Temporal variability of weather conditions seems to create additional challenges in the model calibration. In particular, superior performance was achieved in wet years than in dry years in both model configurations. This observation may indicate that hydrological functioning may vary between wet and dry years as a result of corresponding changes in vegetation cover and soil properties. However, it should be also considered that high flows have a greater influence in the calibration objective functions than low flows. Tufekcioglu et al. [45] in their study, attributed the unsuccessful calibration of SWAT model, to the spatial and temporal variability, to the small size of the watershed, and the very high percolation. These conditions are very similar to the characteristics of the studied watershed in this study. Similar challenges are also reported by other researchers [12,77,78,79].
An additional challenge is that even after successful calibration of SWAT model, there is still a reservation on the ability of the model to accurately represent hydrological processes and quantify hydrological balance components as is typically the case for complex models involving numerous parameters [74]. The obtained results revealed that different sets of calibration parameters resulted in similar model performances revealing the increased uncertainty involved in the estimation of the parameters of the models. For this reason, in this study, it was decided to use the same basic model configuration for both scenarios and to separately calibrate only the parameters affected by the forest fire such as the soil hydraulic properties and evapotranspiration-related coefficients for the burned areas. Future research could focus on the utilization of additional data for the model calibration such as field or remotely sensed soil moisture variability observations.
Despite the above limitations, SWAT model is proven to be a valuable tool for distinguishing the effect of forest fires from the effect of weather conditions variability and for investigating the wildfire effect on the hydrological balance components. SWAT model has been also applied successfully in many relevant studies [12,14,56,57,58,59,60,61,62,63,80,81,82].
The results of the current analysis highlight the profound effect of the 2009 fire incident on the hydrological processes of the studied watershed. In most studies, the loss of vegetation cover is considered as a key factor for forest fires impact on hydrological response [6,7,8,9,10,11,12,13,14,15,18]. The post-fire alteration of soil hydraulic properties, and especially of soil hydraulic conductivity, is an additional important factor leading to reduced infiltration and increased overland flow [1,16,17,18,44]. However, it should be noted that reduced hydraulic conductivities are crucial at the short term but they are observed only at the upper few centimeters of the soil profile and only for a narrow period of time [1,17,44]. Soulis et al. [17] reported that the observed soil hydraulic conductivity values in the studied watershed were significantly reduced after the effect of the forest fire but seven years after the wildfire they were similar to the pre-fire period. Accordingly, the lasting effects of forest fires that are observed many years after the fire cannot be attributed to soil hydraulic properties alone. For example, Zhou et al. [18] found that for the first 15 years after a bushfire in southeast Australia there was a substantial increase in streamflow; this was attributed to initial decreases in evapotranspiration and soil infiltration rates resulting from the fires, followed by logging activity. Pereira et al. [13] also observed increased peak runoffs in the post-fire period and lower runoff during the dry periods in comparison to the pre-fire period. Other researchers also reported profound reductions in evapotranspiration and increases in water yield [6,7,8,9,10,11,18].
The obtained results agree with the previous studies showing a profound reduction of the actual evapotranspiration (29.5%) and increase in water yield (38.9%) and percolation (29.4%) in the post-fire conditions in comparison to the pre-fire conditions. Increase of groundwater recharge is also reported in previous studies [19,20,21]. The observed reduction of the actual evapotranspiration seems to have a dominant role in the alteration of the water balance. As can be seen in Figure 6, surface runoff is significantly increased due to the reduction of infiltration as a result of the wildfire; however, this increase is much smaller than the reduction of actual evapotranspiration. Nevertheless, even moderate increases of surface runoff can result in considerable increases in peak flows as they consider short periods of time during the storm events. As it was explained in Section 3, the decreased evapotranspiration in the post-fire conditions could be related to the destruction of the typical vegetation consisting of xerophytic bushes and trees with deep roots and adaptations allowing them to extract water from deep soil layers and sallow aquifers and its replacement by grasses and herbaceous vegetation that have not this ability. Poon and Kinoshita [15] draw similar conclusions; however, more research at smaller scales is required to investigate this assumption.
The post-fire vegetation recovery in the studied watershed was initiated soon after the fire. During the first autumn after the fire, the bigger part of the watershed was already covered with grasses, and some oak shrubs were started to regenerate. The following years, xerophytic bushes such as thymus, organum and cistus started to glow and progressively replacing grasses. However, the pine forest started to recover very slowly and only in small parts of the watershed. The gradual recovery of the vegetation denotes that forest fire impacts are expected to be time varying as suggested by Bart [83].
The runoff hydrograph is also much sharper with considerably higher peak discharges after the effect of the forest fire especially in wet years, when runoff response is dominated by surface runoff. This is in accordance with the findings of most relevant studies which attribute this behavior to lowered evapotranspiration, lowered infiltration, and increased and more rapid overland flow [1,16,18,44]. The comparison of the hydrological balance simulated for the two scenarios leads to a similar conclusion, i.e., that at least in larger time steps and in the long term the main driver is the decrease of evapotranspiration. The vast increase of peak discharges, however, cannot be attributed solely to the decrease of evapotranspiration, but it may be the combined result of many factors such as reduced soil hydraulic conductivities, fast surface and channel flow due to vegetation destruction, and increased initial soil moisture due to evapotranspiration reduction. Other disturbances such as grazing, soil disturbance during reforestation campaigns, forest logging, and other could also be involved [17,33]. The identification of the mechanisms behind the increased runoff and peak discharges is really challenging and further detailed research is required as it may provide a better insight on the hydrological response recovery process and the length of the post-fire recovery period as well as on the effectiveness of the various post-fire mitigation measures. The estimation of the length of the recovery period is also important as it defines the window of opportunity for the occurrence of a big storm in the burnt watershed with possibly catastrophic consequences. For example, in the studied watershed such a storm event occurred on 30 December 2012 resulting in the highest recorded daily discharge (4.94 m3/s, 7.8 times higher than the pre-fire period) and the highest recorded peak discharge (81.25 m3/s, an order higher than the pre-fire period). This event caused many damages in roads, bridges, and other infrastructures in the study region. The same storm could be less damaging in case that it has occurred before the fire incident or after the recovery period. In contrast, even higher peak discharges and more catastrophic damages could appear if a similar storm has occurred in the first winter after the fire. Candela et al. [34], in their study investigating the effects of forest fires on flood frequency curves in a Mediterranean watershed, concluded that flood frequency is greatly increased during the post-fire period. These results are in line with the results obtained in the present study (Figure 4). Nalbantis and Lymperopoulos [36] also investigated methods to assess flood frequency after forest fires in ungauged basins.
Additional research is also required to investigate the combined effects of ecological disturbances such as wildfires and climate change. Previous studies by Wine and Cadol [21] and Wine et al. [30] demonstrated that “at small spatial scales wildfire contribution to stream-flow is intermittent, whereas if a threshold of aerial extent continues to be exceeded at larger spatial scales this patchwork of wildfire histories integrates to sustained increases in streamflow due to wildfire effects that may rival or exceed projected climate change impacts.”
A final finding is the noticeable increase of sediment yield (4.5 times higher) under the post fire conditions. Increased erodibility and sediment transport can be the combined result of vegetation destruction and soil structure destabilization and increased surface flow. Several researchers reported considerable increase of sediment yield as well [7,8,11,12,25,26,27,29,43,47].
5. Conclusions
In this study, the impacts of forest fires on the hydrological response of natural Mediterranean watersheds was investigated using as an example a small experimental watershed. Detailed hydrometeorological data recorded for the adequate period before and after the fire incidence were used in conjunction with SWAT model to separate the effects of the wildfire from the effects of weather variability. The main findings of this study are the following:
- SWAT model was unable to describe the hydrological response of the watershed without extensive calibration for both the pre-fire and the post-fire conditions even if detailed soil, land covet, topographic, and field data were used for its set-up.
- Detailed hydro-meteorological data for an adequate period before and after a wildfire incident in a well-studied watershed are valuable for the investigation of the effect of forest fires.
- Despite the serious limitations, SWAT model was proven to be a valuable tool for the investigation of the forest fire effects on the hydrological response given that sufficient hydrometeorological data for the model calibration are available.
- A profound reduction of the actual evapotranspiration (29.5%) and increase in water yield (38.9%) and percolation (29.4%) in the post-fire conditions were observed.
- Runoff hydrograph is much sharper with considerably higher peak discharges after the effect of the forest fire especially in wet years when runoff response is dominated by surface runoff.
- The main drivers behind the alterations in hydrological response seem to be that of the vegetation cover change and the reduction of soil hydraulic conductivity; however, the involved mechanism are not clear and other disturbances should be also considered.
- A noticeable increase of sediment yield under the post fire conditions was observed.
Finally, even if the above findings provide additional information that may help to improve the current understanding on the effect of forest fires on hydrological response, the obtained results indicated that more research is still required in many aspects of this study. For instance, future research may focus on improving SWAT model parametrization and calibration considering the spatial and temporal variability in the watershed characteristics and weather conditions making use of additional data such as the constantly improving remotely sensed soil moisture spatial distribution. Additional research is also required to investigate the combined effects of ecological disturbances such as wildfires and climate change. The mechanisms behind the increased surface flow, peak discharges and sediment yield, and the post-fire recovery processes should be investigated in greater detail as well.
Author Contributions
Conceptualization, K.X.S.; methodology, K.X.S., K.A.G., C.P.; software, K.X.S., K.A.G.; validation, K.X.S., K.A.G.; formal analysis, K.X.S., K.A.G., E.P., C.P., C.T.; investigation, K.X.S., K.A.G., C.P.; resources, K.X.S.; data curation, K.X.S., K.A.G., E.P., C.P., C.T.; writing—original draft preparation, K.X.S., K.A.G., E.P., C.P., C.T.; writing—review and editing, K.X.S., K.A.G., E.P., C.P., C.T.; visualization, K.X.S., K.A.G.; supervision, K.X.S.; GIS and Remote sensing K.X.S., E.P.; Modeling K.X.S., K.A.G.; Field work K.X.S., K.A.G., C.P., C.T. All authors have read and agreed to the published version of the manuscript.
Funding
This research received no external funding.
Conflicts of Interest
The authors declare no conflict of interest.
References
- Soulis, K.X.; Dercas, N.; Valiantzas, J.D. Wildfires Impact on Hydrological Response—The Case of Lykorrema Experimental Watershed. Glob. Nest J. 2012, 14, 303–310. [Google Scholar]
- Marlon, J.R.; Bartlein, P.J.; Gavin, D.G.; Long, C.J.; Anderson, R.S.; Briles, C.E.; Brown, K.J.; Colombaroli, D.; Hallett, D.J.; Power, M.J.; et al. Long-Term Perspective on Wildfires in the Western USA. Proc. Natl. Acad. Sci. USA 2012, 109, E535–E543. [Google Scholar] [CrossRef] [PubMed] [Green Version]
- Balch, J.K.; Bradley, B.A.; Abatzoglou, J.T.; Chelsea Nagy, R.; Fusco, E.J.; Mahood, A.L. Human-Started Wildfires Expand the Fire Niche across the United States. Proc. Natl. Acad. Sci. USA 2017, 114, 2946–2951. [Google Scholar] [CrossRef] [PubMed] [Green Version]
- Turco, M.; Rosa-Cánovas, J.J.; Bedia, J.; Jerez, S.; Montávez, J.P.; Llasat, M.C.; Provenzale, A. Exacerbated Fires in Mediterranean Europe Due to Anthropogenic Warming Projected with Non-Stationary Climate-Fire Models. Nat. Commun. 2018, 9. [Google Scholar] [CrossRef] [PubMed]
- Rulli, M.C.; Rosso, R. Hydrologic Response of Upland Catchments to Wildfires. Adv. Water Resour. 2007, 30, 2072–2086. [Google Scholar] [CrossRef]
- Robichaud, P.R. Fire Effects on Infiltration Rates after Prescribed Fire in Northern Rocky Mountain Forests, USA. J. Hydrol. 2000, 231, 220–229. [Google Scholar] [CrossRef]
- Robichaud, P.R. Measurement of Post-Fire Hillslope Erosion to Evaluate and Model Rehabilitation Treatment Effectiveness and Recovery. Int. J. Wildland Fire 2005, 14, 475. [Google Scholar] [CrossRef] [Green Version]
- Prosser, I.P.; Williams, L. The Effect of Wildfire on Runoff and Erosion in Native Eucalyptus Forest. Hydrol. Process. 1998, 12, 251–265. [Google Scholar] [CrossRef]
- Pierson, F.B.; Robichaud, P.R.; Spaeth, K.E. Spatial and Temporal Effects of Wildfire on the Hydrology of a Steep Rangeland Watershed. Hydrol. Process. 2001, 15, 2905–2916. [Google Scholar] [CrossRef]
- Pierson, F.B.; Carlson, D.H.; Spaeth, K.E. Impacts of Wildfire on Soil Hydrological Properties of Steep Sagebrush-Steppe Rangeland. Int. J. Wildland Fire 2002, 11, 145–151. [Google Scholar] [CrossRef]
- Pierson, F.B.; Robichaud, P.R.; Moffet, C.A.; Spaeth, K.E.; Hardegree, S.P.; Clark, P.E.; Williams, C.J. Fire Effects on Rangeland Hydrology and Erosion in a Steep Sagebrush-dominated Landscape. Hydrol. Process. 2008, 22, 2916–2929. [Google Scholar] [CrossRef]
- Basso, M.; Vieira, D.C.S.; Ramos, T.B.; Mateus, M. Assessing the Adequacy of SWAT Model to Simulate Postfire Effects on the Watershed Hydrological Regime and Water Quality. Land Degrad. Dev. 2020, 31, 619–631. [Google Scholar] [CrossRef]
- Pereira, M.G.; Fernandes, L.S.; Carvalho, S.; Santos, R.B.; Caramelo, L.; Alencoão, A. Modelling the Impacts of Wildfires on Runoff at the River Basin Ecological Scale in a Changing Mediterranean Environment. Environ. Earth Sci. 2016, 75, 1–14. [Google Scholar] [CrossRef]
- Rodrigues, E.L.; Jacobi, C.M.; Figueira, J.E.C. Wildfires and Their Impact on the Water Supply of a Large Neotropical Metropolis: A Simulation Approach. Sci. Total Environ. 2019, 651, 1261–1271. [Google Scholar] [CrossRef]
- Poon, P.K.; Kinoshita, A.M. Spatial and Temporal Evapotranspiration Trends after Wildfire in Semi-Arid Landscapes. J. Hydrol. 2018, 559, 71–83. [Google Scholar] [CrossRef]
- Debano, L.F. The Role of Fire and Soil Heating on Water Repellency in Wildland Environments: A Review. J. Hydrol. 2000, 231, 195–206. [Google Scholar] [CrossRef]
- Soulis, K.X.; Londra, P.A.; Kargas, G. Characterizing Surface Soil Layer Saturated Hydraulic Conductivity in a Mediterranean Natural Watershed. Hydrol. Sci. J. 2020, 65, 2616–2629. [Google Scholar] [CrossRef]
- Zhou, Y.; Zhang, Y.; Vaze, J.; Lane, P.; Xu, S. Impact of Bushfire and Climate Variability on Streamflow from Forested Catchments in Southeast Australia. Hydrol. Sci. J. 2015, 60, 1340–1360. [Google Scholar] [CrossRef]
- Ebel, B.A. Simulated Unsaturated Flow Processes after Wildfire and Interactions with Slope Aspect. Water Resour. Res. 2013, 49, 8090–8107. [Google Scholar] [CrossRef]
- Kinoshita, A.M.; Hogue, T.S. Increased Dry Season Water Yield in Burned Watersheds in Southern California. Environ. Res. Lett. 2015, 10, 14003. [Google Scholar] [CrossRef]
- Wine, M.L.; Cadol, D. Hydrologic Effects of Large Southwestern USA Wildfires Significantly Increase Regional Water Supply: Fact or Fiction? Environ. Res. Lett. 2016, 11, 085006. [Google Scholar] [CrossRef]
- Lane, P.N.; Sheridan, G.J.; Noske, P.J.; Sherwin, C.B.; Costenaro, J.L.; Nyman, P.; Smith, H.G. Fire Effects on Forest Hydrology: Lessons from a Multi-Scale Catchment Experiment in SE Australia. Iahs Publ. 2012, 353, 137–143. [Google Scholar]
- Mayor, A.G.; Bautista, S.; Llovet, J.; Bellot, J. Post-Fire Hydrological and Erosional Responses of a Mediterranean Landscpe: Seven Years of Catchment-Scale Dynamics. Catena 2007, 71, 68–75. [Google Scholar] [CrossRef]
- Tan, K.; Flower, D.; Flowers, D. An Event Runoff Coefficient Approach for Assessing Changes in Short-Term Catchment Runoff Following Bushfires. In Proceedings of the 33rd hydrology and water resources symposium, Brisbane, Australia, 26 June–1 July 2011; pp. 1522–1529. [Google Scholar]
- Vega, J.A.; Fernández, C.; Fonturbel, T. Throughfall, Runoff and Soil Erosion after Prescribed Burning in Gorse Shrubland in Galicia (NW Spain). Land Degrad. Dev. 2005, 16, 37–51. [Google Scholar] [CrossRef]
- Marcos, E.; Tarrega, R.; Luis-Calabuig, E. Comparative Analysis of Runo and Sediment Yield with a Rainfall Simulator after Experimental Fire. Arid Soil Res. Rehabil. 2000, 14, 293–307. [Google Scholar] [CrossRef]
- De Luis, M.; González-Hidalgo, J.C.; Raventós, J. Effects of Fire and Torrential Rainfall on Erosion in a Mediterranean Gorse Community. Land Degrad. Dev. 2003, 14, 203–213. [Google Scholar] [CrossRef]
- Yassoglou, N. Desertification in a European Context; Publications Office of the EU: Brussels, Belgium, 1995. [Google Scholar]
- Inbar, M.; Tamir, M.; Wittenberg, L. Runoff and Erosion Processes after a Forest Fire in Mount Carmel, a Mediterranean Area. Geomorphology 1998, 24, 17–33. [Google Scholar] [CrossRef]
- Wine, M.L.; Cadol, D.; Makhnin, O. In Ecoregions across Western USA Streamflow Increases during Post-Wildfire Recovery. Environ. Res. Lett. 2018, 13, 14010. [Google Scholar] [CrossRef]
- Wang, X. Advances in Separating Effects of Climate Variability and Human Activity on Stream Discharge: An Overview. Adv. Water Resour. 2014, 71, 209–218. [Google Scholar] [CrossRef]
- Marhaento, H.; Booij, M.J.; Rientjes, T.H.M.; Hoekstra, A.Y. Attribution of Changes in the Water Balance of a Tropical Catchment to Land Use Change Using the SWAT Model. Hydrol. Process. 2017, 31, 2029–2040. [Google Scholar] [CrossRef]
- Soulis, K.X. Estimation of SCS Curve Number Variation Following Forest Fires. Hydrol. Sci. J. 2018, 63, 1332–1346. [Google Scholar] [CrossRef]
- Candela, A.; Aronica, G.; Santoro, M. Effects of Forest Fires on Flood Frequency Curves in a Mediterranean Catchment/Effets d’incendies de Forêt Sur Les Courbes de Fréquence de Crue Dans Un Bassin Versant Méditerranéen. Hydrol. Sci. J. 2005, 50. [Google Scholar] [CrossRef]
- Goodrich, D.C.; Canfield, H.E.; Burns, I.S.; Semmens, D.J.; Miller, S.N.; Hernandez, M.; Levick, L.R.; Guertin, D.P.; Kepner, W.G. Rapid Post-Fire Hydrologic Watershed Assessment Using the AGWA GIS-Based Hydrologic Modeling Tool. In Proceedings of the Managing Watersheds for Human and Natural Impacts, American Society of Civil Engineers, Reston, VA, USA, 13 July 2005; pp. 1–12. [Google Scholar]
- Nalbantis, I.; Lymperopoulos, S. Assessment of Flood Frequency after Forest Fires in Small Ungauged Basins Based on Uncertain Measurements. Hydrol. Sci. J. 2012, 57, 52–72. [Google Scholar] [CrossRef]
- Papathanasiou, C.; Makropoulos, C.; Mimikou, M. Hydrological Modelling for Flood Forecasting: Calibrating the Post-Fire Initial Conditions. J. Hydrol. 2015, 529, 1838–1850. [Google Scholar] [CrossRef]
- Papathanasiou, C.; Alonistioti, D.; Kasella, A.; Makropoulos, C.; Mimikou, M. The Impact of Forest Fires on the Vulnerability of Peri-Urban Catchments to Flood Events (the Case of the Eastern Attica Region). Glob. Nest J. 2012, 14, 294–302. [Google Scholar] [CrossRef]
- Versini, P.A.; Velasco, M.; Cabello, A.; Sempere-Torres, D. Hydrological Impact of Forest Fires and Climate Change in a Mediterranean Basin. Nat. Hazards 2013, 66, 609–628. [Google Scholar] [CrossRef]
- Batelis, S.C.; Nalbantis, I. Potential Effects of Forest Fires on Streamflow in the Enipeas River Basin, Thessaly, Greece. Environ. Process. 2014, 1, 73–85. [Google Scholar] [CrossRef] [Green Version]
- Leopardi, M.; Scorzini, A.R. Effects of Wildfires on Peak Discharges in Watersheds. IForest 2015, 8, 302–307. [Google Scholar] [CrossRef] [Green Version]
- Kochilakis, G.; Poursanidis, D.; Chrysoulakis, N.; Varella, V.; Kotroni, V.; Eftychidis, G.; Lagouvardos, K.; Papathanasiou, C.; Karavokyros, G.; Aivazoglou, M.; et al. A Web Based DSS for the Management of Floods and Wildfires (FLIRE) in Urban and Periurban Areas. Environ. Model. Softw. 2016, 86, 111–115. [Google Scholar] [CrossRef]
- Yochum, S.E.; Norman, J.B. Wildfire-Induced Flooding and Erosion Potential Modeling: Examples from Colorado: 2012 and 2013. In Proceedings of the 3rd Joint Federal Interagency Conference on Sedimentation and Hydrologic, Reno, Nevada, USA, 19–23 April 2015. [Google Scholar] [CrossRef]
- Ebel, B.A.; Moody, J.A. Parameter Estimation for Multiple Post-Wildfire Hydrologic Models. Hydrol. Process. 2020, 34, 4049–4066. [Google Scholar] [CrossRef]
- Tufekcioglu, M.; Yavuz, M.; Zaimes, G.N.; Dinc, M.; Koutalakis, P.; Tufekcioglu, A. Application of Soil Water Assessment Tool (SWAT) to Suppress Wildfire at Bayam Forest, Turkey. J. Environ. Biol. 2017, 38, 719–726. [Google Scholar] [CrossRef]
- Lucas-Borja, M.E.; Bombino, G.; Carrà, B.G.; D’Agostino, D.; Denisi, P.; Labate, A.; Plaza-Alvarez, P.A.; Zema, D.A. Modeling the Soil Response to Rainstorms after Wildfire and Prescribed Fire in Mediterranean Forests. Climate 2020, 8, 150. [Google Scholar] [CrossRef]
- Efthimiou, N.; Psomiadis, E.; Panagos, P. Fire Severity and Soil Erosion Susceptibility Mapping Using Multi-Temporal Earth Observation Data: The Case of Mati Fatal Wildfire in Eastern Attica, Greece. Catena 2020, 187, 104320. [Google Scholar] [CrossRef] [PubMed]
- Psomiadis, E.; Soulis, K.X.; Efthimiou, N. Using SCS-CN and Earth Observation for the Comparative Assessment of the Hydrological Effect of Gradual and Abrupt Spatiotemporal Land Cover Changes. Water 2020, 12, 1386. [Google Scholar] [CrossRef]
- Soulis, K.X.; Dercas, N. Field Calibration of Weirs Using Partial Volumetric Flow Measurements. J. Irrig. Drain. Eng. 2012, 138. [Google Scholar] [CrossRef]
- Soulis, K.X.; Dercas, N.; Papadaki, C. Effects of Forest Roads on the Hydrological Response of a Small-Scale Mountain Watershed in Greece. Hydrol. Process. 2015, 29. [Google Scholar] [CrossRef]
- Soulis, K.X.; Valiantzas, J.D. SCS-CN Parameter Determination Using Rainfall-Runoff Data in Heterogeneous Watersheds—The Two-CN System Approach. Hydrol. Earth Syst. Sci. 2012, 16, 1001–1015. [Google Scholar] [CrossRef] [Green Version]
- Soulis, K.X.; Valiantzas, J.D. Identification of the SCS-CN Parameter Spatial Distribution Using Rainfall-Runoff Data in Heterogeneous Watersheds. Water Resour. Manag. 2013, 27, 1737–1749. [Google Scholar] [CrossRef]
- Soulis, K.X.; Valiantzas, J.D.; Dercas, N.; Londra, P.A. Investigation of the Direct Runoff Generation Mechanism for the Analysis of the SCS-CN Method Applicability to a Partial Area Experimental Watershed. Hydrol. Earth Syst. Sci. 2009, 13, 605–615. [Google Scholar] [CrossRef] [Green Version]
- Baltas, E.A.; Dervos, N.A.; Mimikou, M.A. Technical Note: Determination of the SCS Initial Abstraction Ratio in an Experimental Watershed in Greece. Hydrol. Earth Syst. Sci. 2007, 11, 1825–1829. [Google Scholar] [CrossRef] [Green Version]
- Neitsch, S.L.; Arnold, J.G.; Kiniry, J.R.; Williams, J.R. College of Agriculture and Life Sciences Soil and Water Assessment Tool Theoretical Documentation Version 2009; Texas A&M University System: College Station, TX, USA, 2011. [Google Scholar]
- de Girolamo, A.M.; Barca, E.; Pappagallo, G.; lo Porto, A. Simulating Ecologically Relevant Hydrological Indicators in a Temporary River System. Agric. Water Manag. 2017, 180, 194–204. [Google Scholar] [CrossRef]
- Papadaki, C.; Soulis, K.; Bellos, V.; Ntoanidis, L.; Dimitriou, E. Estimation of a Suitable Range of Discharges for the Development of Instream Flow Recommendations. Environ. Process. 2020, 7, 703–721. [Google Scholar] [CrossRef]
- Papadaki, C.; Soulis, K.; Ntoanidis, L.; Zogaris, S.; Dercas, N.; Dimitriou, E. Comparative Assessment of Environmental Flow Estimation Methods in a Mediterranean Mountain River. Environ. Manag. 2017, 60, 280–292. [Google Scholar] [CrossRef] [PubMed]
- Papadaki, C.; Soulis, K.; Muñoz-Mas, R.; Martinez-Capel, F.; Zogaris, S.; Ntoanidis, L.; Dimitriou, E. Potential Impacts of Climate Change on Flow Regime and Fish Habitat in Mountain Rivers of the South-Western Balkans. Sci. Total Environ. 2016, 540, 418–428. [Google Scholar] [CrossRef] [Green Version]
- Loiselle, D.; Du, X.; Alessi, D.S.; Bladon, K.D.; Faramarzi, M. Projecting Impacts of Wildfire and Climate Change on Streamflow, Sediment, and Organic Carbon Yields in a Forested Watershed. J. Hydrol. 2020, 590, 125403. [Google Scholar] [CrossRef]
- Venkatesh, K.; Preethi, K.; Ramesh, H. Evaluating the Effects of Forest Fire on Water Balance Using Fire Susceptibility Maps. Ecol. Indic. 2020, 110, 105856. [Google Scholar] [CrossRef]
- Havel, A.; Tasdighi, A.; Arabi, M. Assessing the Hydrologic Response to Wildfires in Mountainous Regions. Hydrol. Earth Syst. Sci. 2018, 22, 2527–2550. [Google Scholar] [CrossRef] [Green Version]
- Wang, R.; Kalin, L. Modelling Effects of Land Use/Cover Changes under Limited Data. Ecohydrology 2011, 4, 265–276. [Google Scholar] [CrossRef]
- Allen, R.G.; Pereira, L.S.; Raes, D. Crop Evapotranspiration (Guidelines for Computing Crop Water Requirements). In FAO Irrigation and Drainage Paper No. 56; FAO: Rome, Italy, 1998. [Google Scholar]
- Herrnegger, M.; Nachtnebel, H.P.; Haiden, T. Evapotranspiration in High Alpine Catchments—An Important Part of the Water Balance! Hydrol. Res. 2012, 43, 460–475. [Google Scholar] [CrossRef] [Green Version]
- Steenhuis, T.S.; Winchell, M.; Rossing, J.; Zollweg, J.A.; Walter, M.F. SCS Runoff Equation Revisited for Variable-Source Runoff Areas. J. Irrig. Drain. Eng. 1995, 121, 234–238. [Google Scholar] [CrossRef]
- Abbaspour, K.C. SWAT-CUP SWAT Calibration and Uncertainty Programs—A User Manual; Eawag, Swiss Federal Institute of Aquatic Science and Technology: Dübendorf, Switzerland, 2015. [Google Scholar]
- Song, X.; Zhang, J.; Zhan, C.; Xuan, Y.; Ye, M.; Xu, C. Global Sensitivity Analysis in Hydrological Modeling: Review of Concepts, Methods, Theoretical Framework, and Applications. J. Hydrol. 2015, 523, 739–757. [Google Scholar] [CrossRef] [Green Version]
- Brath, A.; Montanari, A.; Moretti, G. Assessing the Effect on Flood Frequency of Land Use Change via Hydrological Simulation (with Uncertainty). J. Hydrol. 2006, 324, 141–153. [Google Scholar] [CrossRef]
- Moriasi, D.N.; Arnold, J.G.; van Liew, M.W.; Bingner, R.L.; Harmel, R.D.; Veith, T.L. Model Evaluation Guidelines for Systematic Quantification of Accuracy in Watershed Simulations. Trans. Asabe 2007, 50, 885–900. [Google Scholar] [CrossRef]
- Kokkinou, I.; Ntoulas, N.; Nektarios, P.A.; Varela, D. Response of Native Aromatic and Medicinal Plant Species to Water Stress on Adaptive Green Roof Systems. HortScience 2016, 51, 608–614. [Google Scholar] [CrossRef] [Green Version]
- Dingman Lawrence, S. Physical Hydrology, 2nd ed.; Prentice Hall: Upper Saddle River, NJ, USA, 2002; ISBN 9780130996954. [Google Scholar]
- Darracq, A.; Destouni, G.; Persson, K.; Prieto, C.; Jarsjö, J. Scale and Model Resolution Effects on the Distributions of Advective Solute Travel Times in Catchments. Hydrol. Process. 2010, 24, 1697–1710. [Google Scholar] [CrossRef]
- Beven, K.J. Preferential Flows and Travel Time Distributions: Defining Adequate Hypothesis Tests for Hydrological Process Models. Hydrol. Process. 2010, 24, 1537–1547. [Google Scholar] [CrossRef]
- Merheb, M.; Moussa, R.; Abdallah, C.; Colin, F.; Perrin, C.; Baghdadi, N. Hydrological Response Characteristics of Mediterranean Catchments at Different Time Scales: A Meta-Analysis. Hydrol. Sci. J. 2016, 61, 2520–2539. [Google Scholar] [CrossRef] [Green Version]
- Plaza-Álvarez, P.A.; Lucas-Borja, M.E.; Sagra, J.; Zema, D.A.; González-Romero, J.; Moya, D.; de las Heras, J. Changes in Soil Hydraulic Conductivity after Prescribed Fires in Mediterranean Pine Forests. J. Environ. Manag. 2019, 232, 1021–1027. [Google Scholar] [CrossRef]
- Guse, B.; Kiesel, J.; Pfannerstill, M.; Fohrer, N. Assessing Parameter Identifiability for Multiple Performance Criteria to Constrain Model Parameters. Hydrol. Sci. J. 2020, 65, 1158–1172. [Google Scholar] [CrossRef]
- Li, X.; Huang, S.; He, R.; Wang, G.; Tan, M.L.; Yang, X.; Zheng, Z. Impact of Temporal Rainfall Resolution on Daily Streamflow Simulations in a Large-Sized River Basin. Hydrol. Sci. J. 2020, 65, 2630–2645. [Google Scholar] [CrossRef]
- Franco, A.C.L.; de Oliveira, D.Y.; Bonumá, N.B. Comparison of Single-Site, Multi-Site and Multi-Variable SWAT Calibration Strategies. Hydrol. Sci. J. 2020, 65, 2376–2389. [Google Scholar] [CrossRef]
- Tarigan, S.; Stiegler, C.; Wiegand, K.; Knohl, A.; Murtilaksono, K. Relative Contribution of Evapotranspiration and Soil Compaction to the Fluctuation of Catchment Discharge: Case Study from a Plantation Landscape. Hydrol. Sci. J. 2020, 65, 1239–1248. [Google Scholar] [CrossRef]
- Larbi, I.; Obuobie, E.; Verhoef, A.; Julich, S.; Feger, K.H.; Bossa, A.Y.; Macdonald, D. Water Balance Components Estimation under Scenarios of Land Cover Change in the Vea Catchment, West Africa. Hydrol. Sci. J. 2020, 65, 2196–2209. [Google Scholar] [CrossRef]
- Pooralihossein, S.; Delavar, M. A Multi-Model Ensemble Approach for the Assessment of Climatic and Anthropogenic Impacts on River Flow Change. Hydrol. Sci. J. 2020, 65, 71–86. [Google Scholar] [CrossRef]
- Bart, R.R. A Regional Estimate of Postfire Streamflow Change in California. Water Resour. Res. 2016, 52, 1465–1478. [Google Scholar] [CrossRef] [Green Version]
Figure 1.
Map of the study area, where the topography, the soil, the land cover and the monitoring network are shown.
Figure 1.
Map of the study area, where the topography, the soil, the land cover and the monitoring network are shown.

Figure 2.
Graphical representation of the observed vs. the simulated daily discharge obtained by the most suitable (second) calibration approach for (a) the pre-fire period and (b) the post-fire period. The corresponding daily rainfall depths are also presented.
Figure 2.
Graphical representation of the observed vs. the simulated daily discharge obtained by the most suitable (second) calibration approach for (a) the pre-fire period and (b) the post-fire period. The corresponding daily rainfall depths are also presented.

Figure 3.
Peak hourly discharges for the events that took place in the pre-fire and the post-fire period in comparison with the (a) total rainfall depth and (b) the maximum hourly rainfall intensity for each event.
Figure 3.
Peak hourly discharges for the events that took place in the pre-fire and the post-fire period in comparison with the (a) total rainfall depth and (b) the maximum hourly rainfall intensity for each event.

Figure 4.
Flow duration curves calculated from the (a) daily observed discharges before and after the fire incident and (b) daily observed and simulated discharges for the entire period.
Figure 4.
Flow duration curves calculated from the (a) daily observed discharges before and after the fire incident and (b) daily observed and simulated discharges for the entire period.

Figure 5.
Monthly rainfall and runoff depth temporal distribution, observed and simulated for the two examined scenarios.
Figure 5.
Monthly rainfall and runoff depth temporal distribution, observed and simulated for the two examined scenarios.

Figure 6.
Graphical representation of the average annual values of the simulated water balance components for the two investigated scenarios. PREC: precipitation, REF_ET: reference evapotranspiration, SUR_Q: surface flow, LAT_Q: lateral flow, GW_Q: groundwater flow, PERCOLATE: percolation, ACT_ET: actual evapotranspiration, SED_YIELD: sediment yield.

Figure 7.
Illustration of characteristic examples of the vegetation cover changes due to forest fires; (a) before the forest fire, (b) just after the forest fire, (c) first years after the forest fire (wet period).
Figure 7.
Illustration of characteristic examples of the vegetation cover changes due to forest fires; (a) before the forest fire, (b) just after the forest fire, (c) first years after the forest fire (wet period).

Figure 8.
Temporal variation of the main components of the runoff response of the watershed for (a) the pre-fire and (b) the post-fire conditions.
Figure 8.
Temporal variation of the main components of the runoff response of the watershed for (a) the pre-fire and (b) the post-fire conditions.

Figure 9.
Temporal variation of the main hydrological balance components of the studied watershed for the pre-fire and the post-fire conditions; (a) actual evapotranspiration, (b) percolation, and (c) total runoff.
Figure 9.
Temporal variation of the main hydrological balance components of the studied watershed for the pre-fire and the post-fire conditions; (a) actual evapotranspiration, (b) percolation, and (c) total runoff.


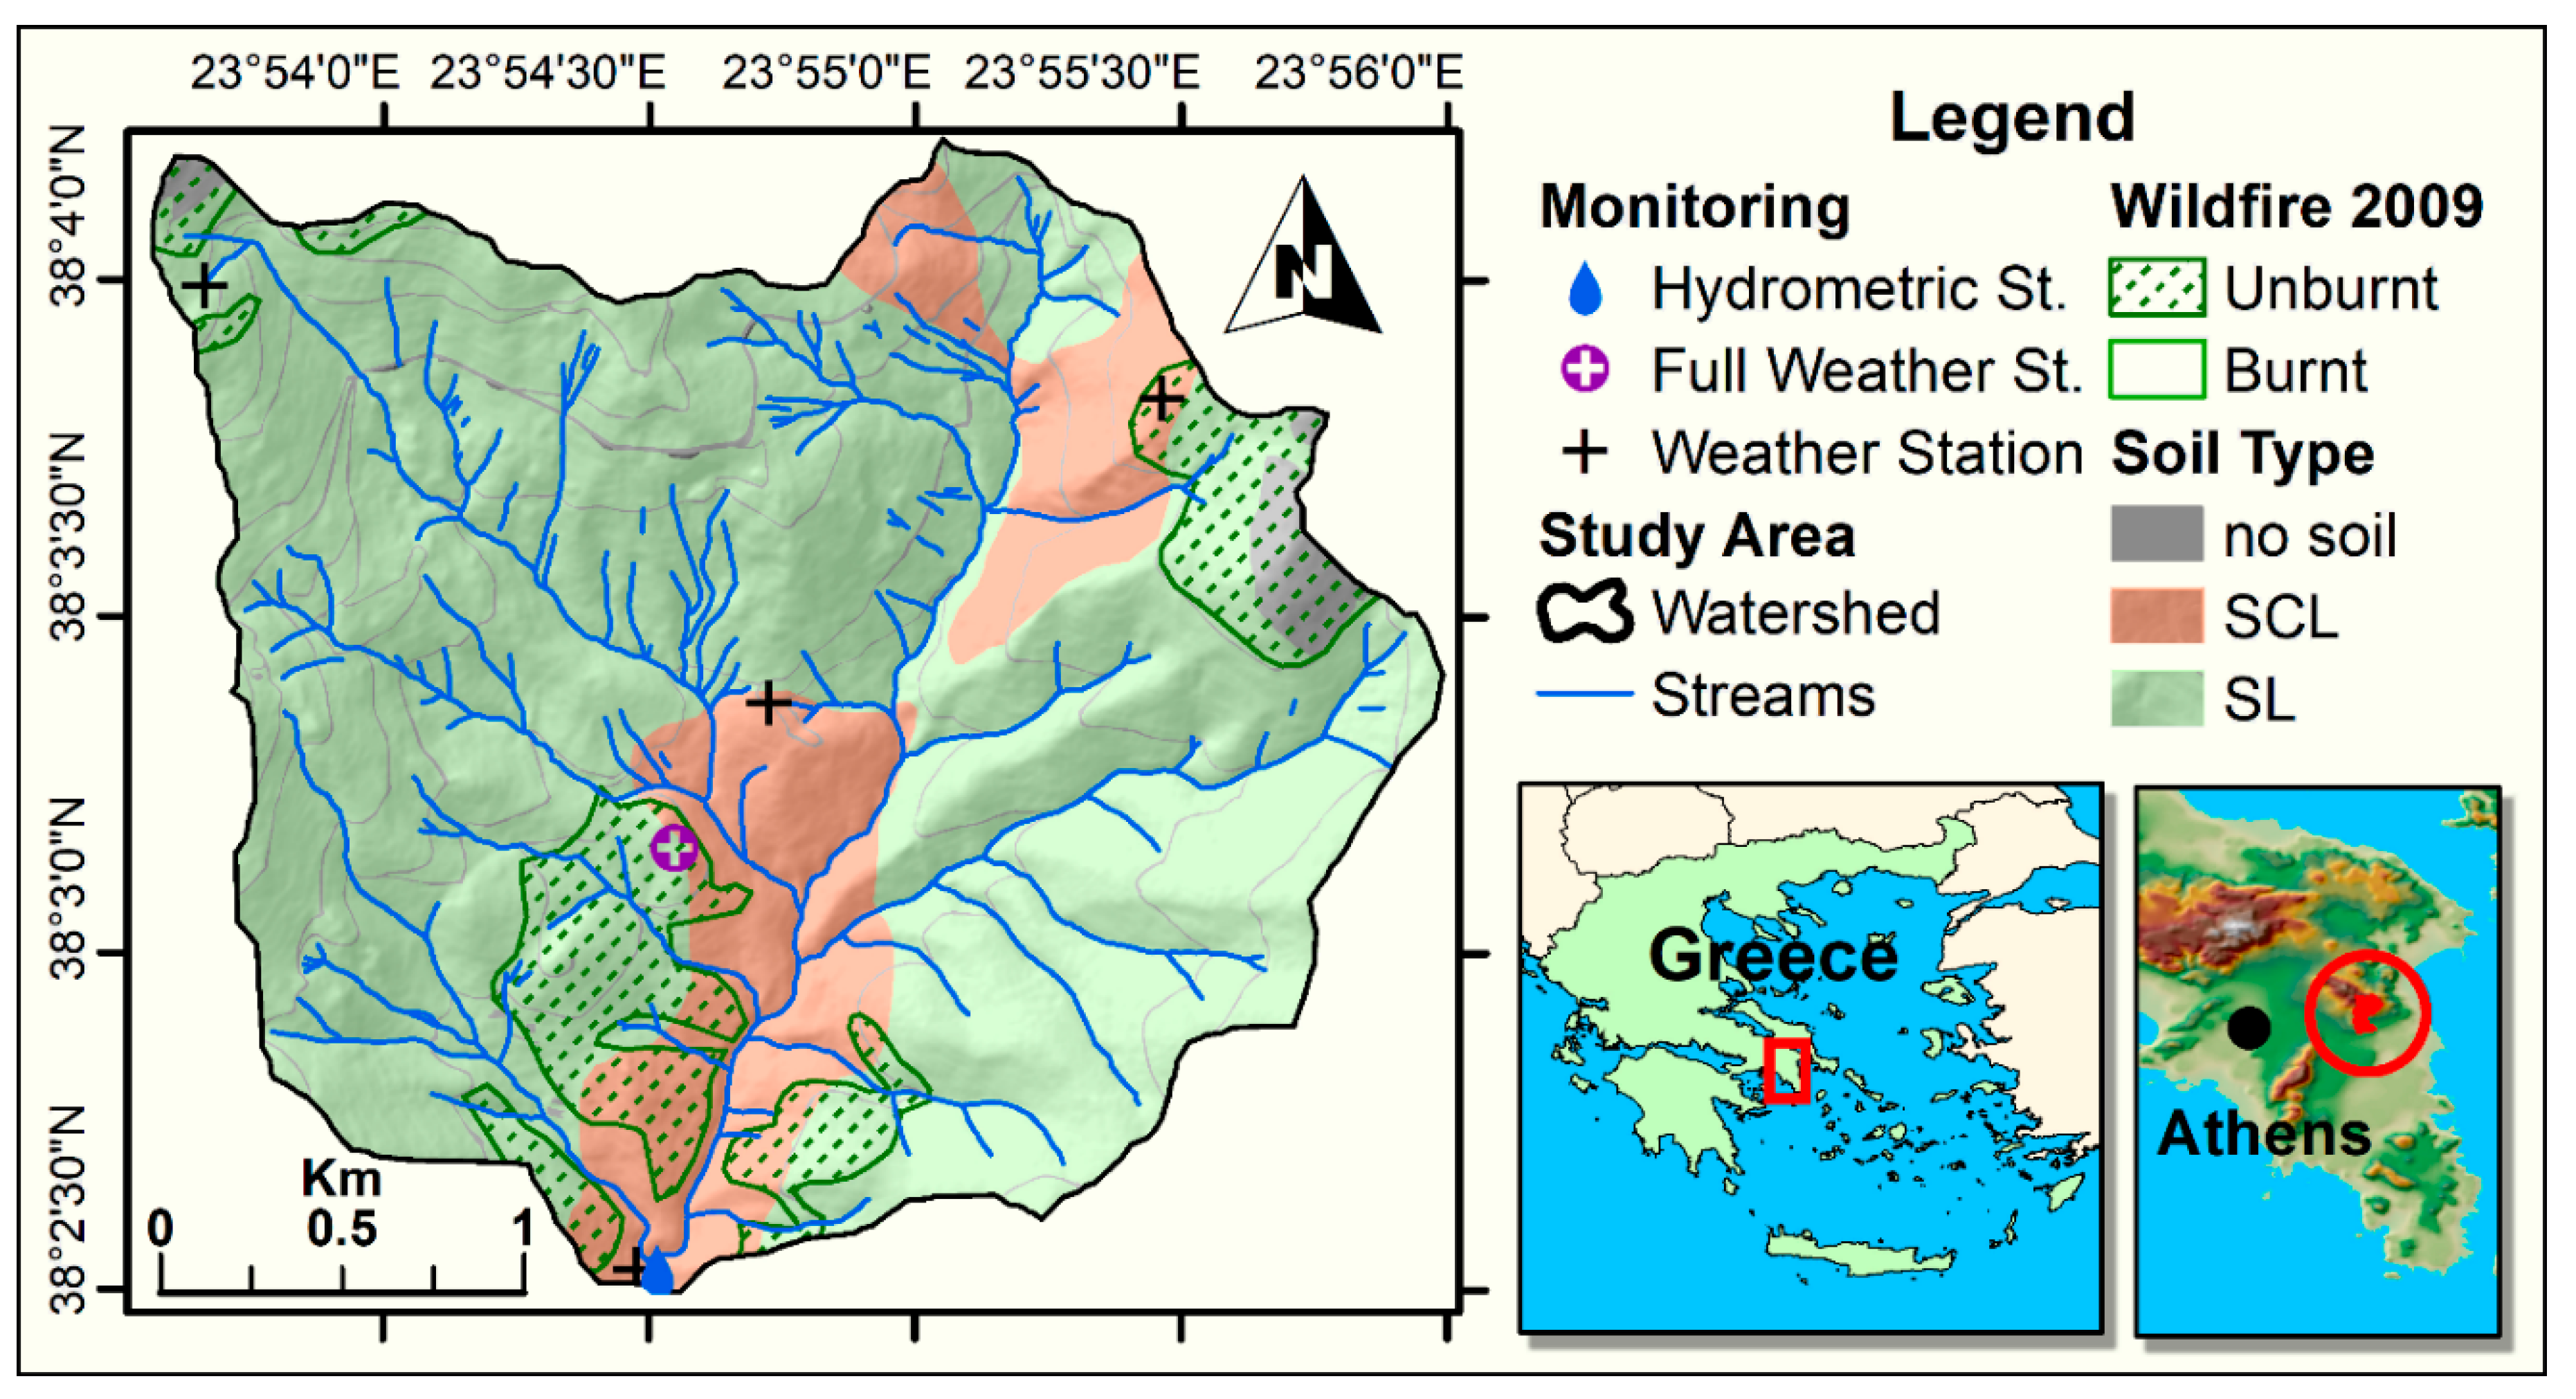
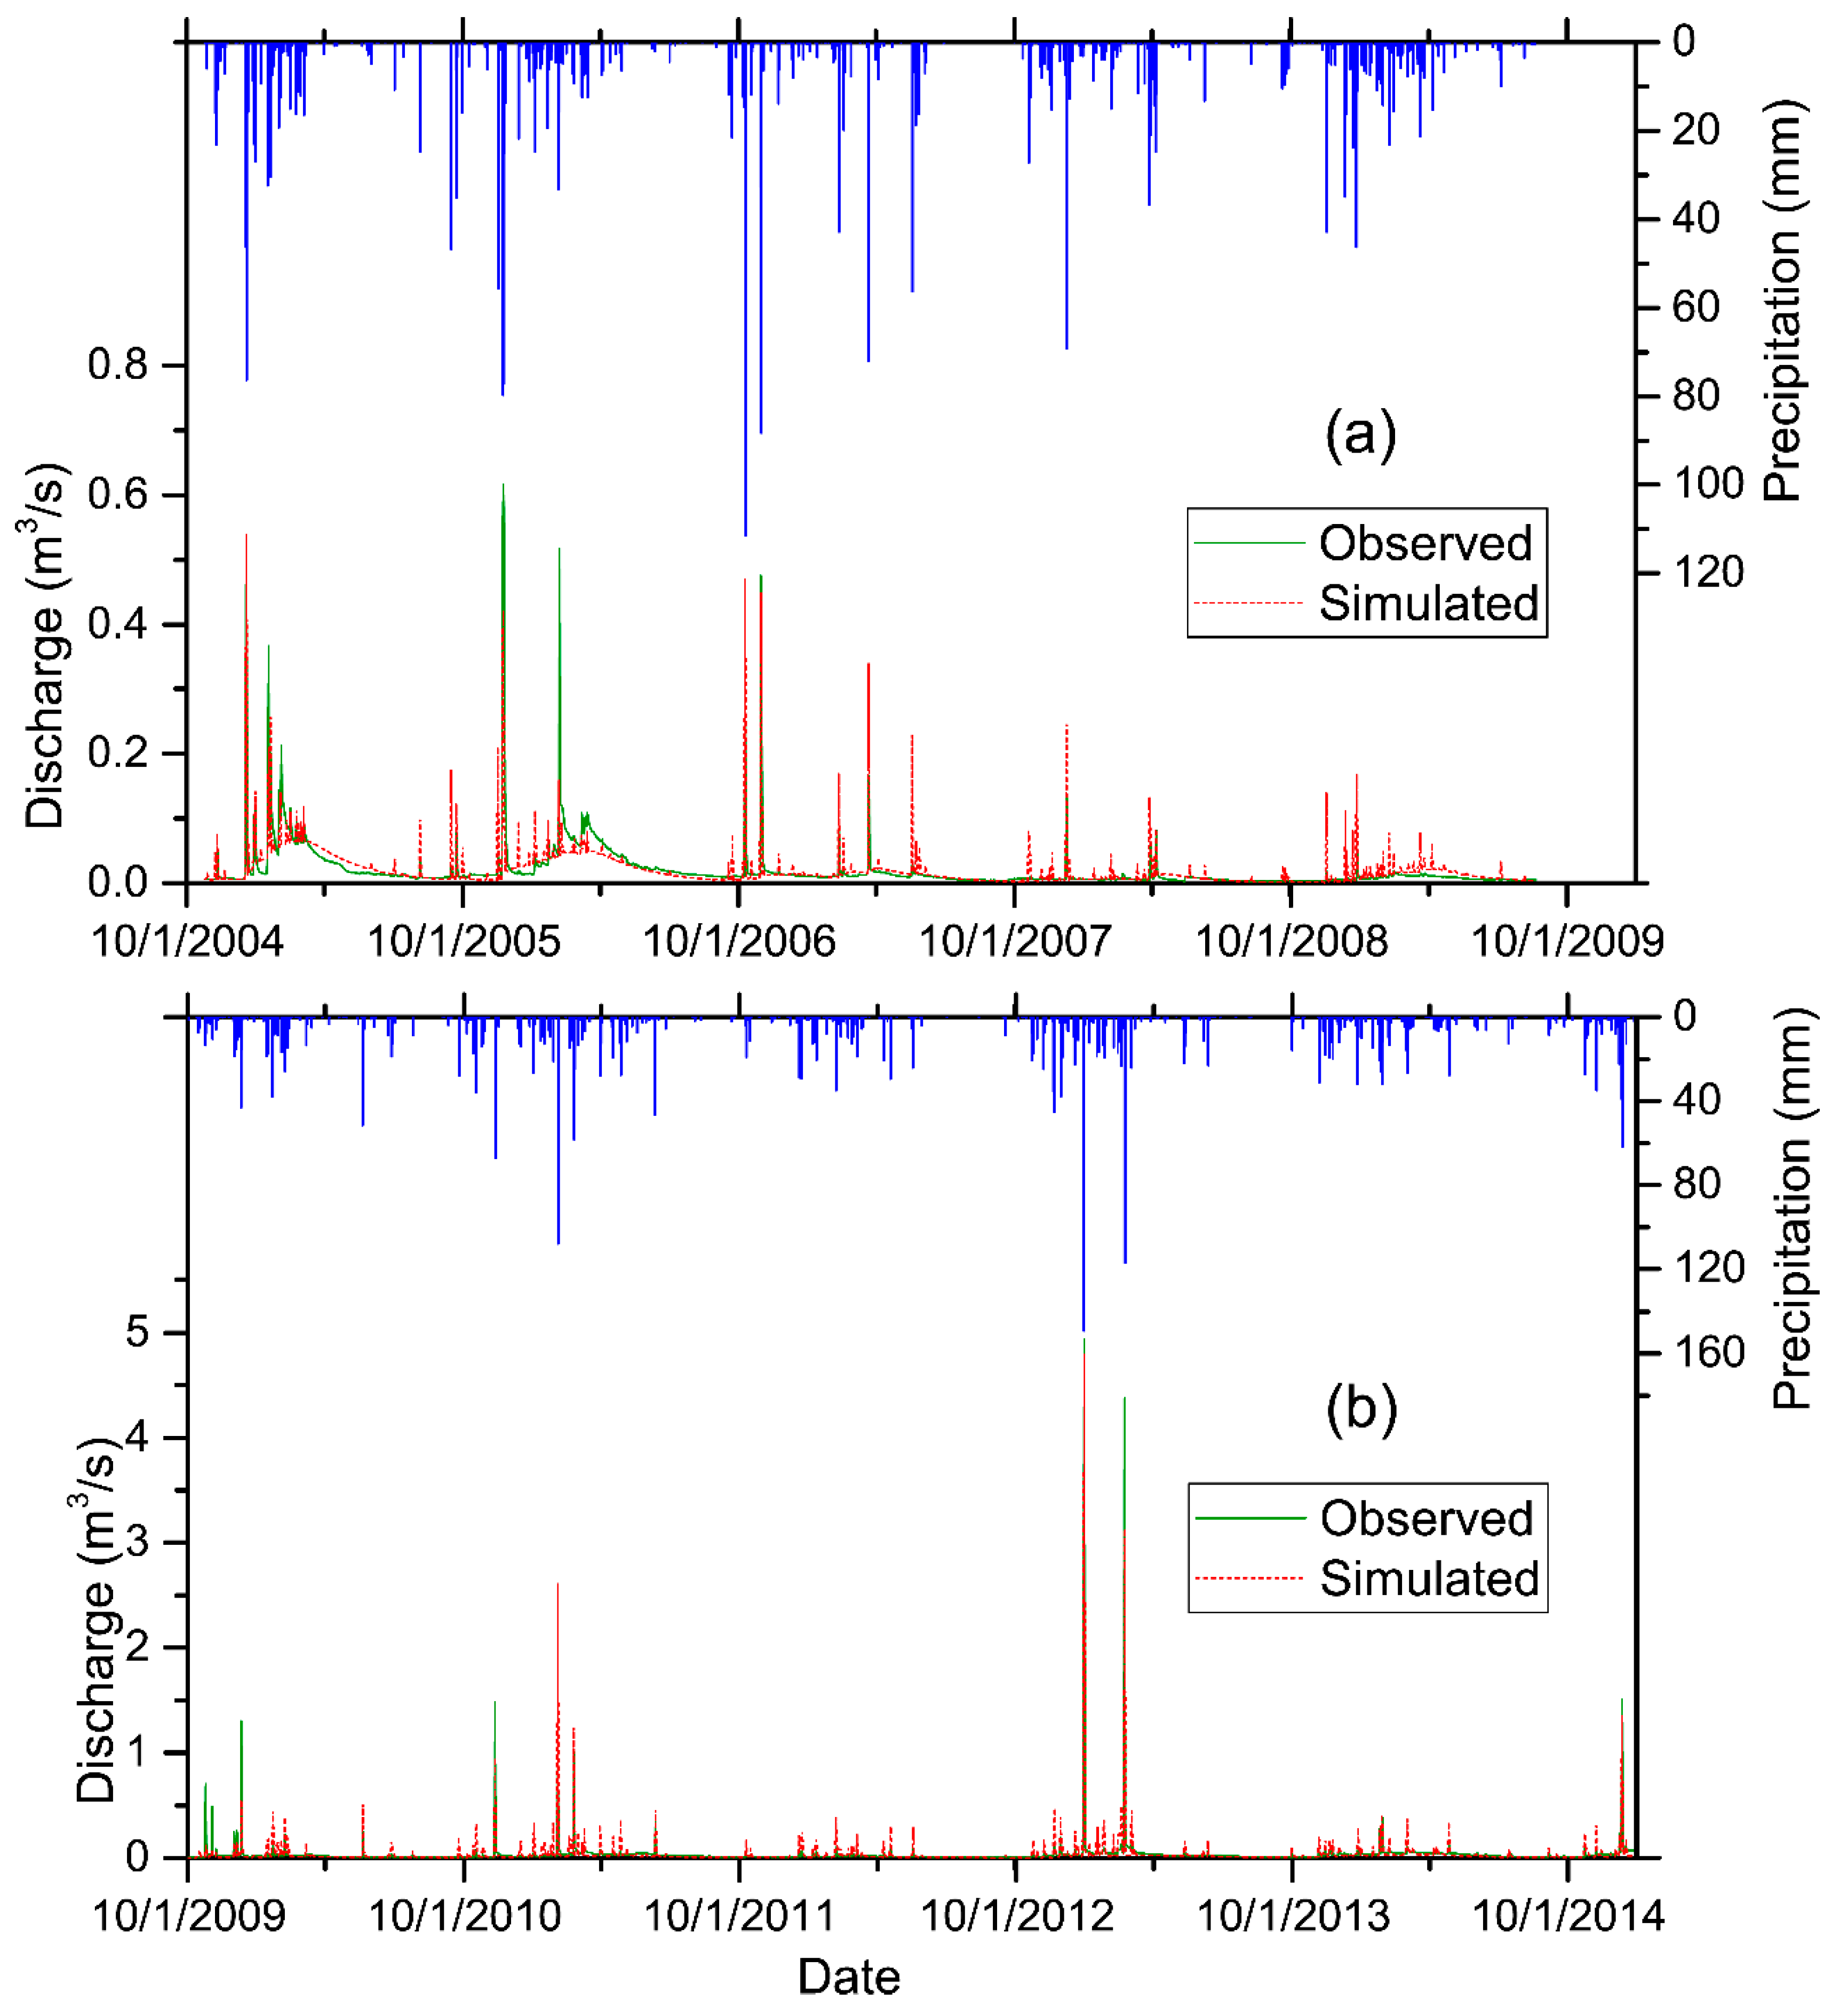
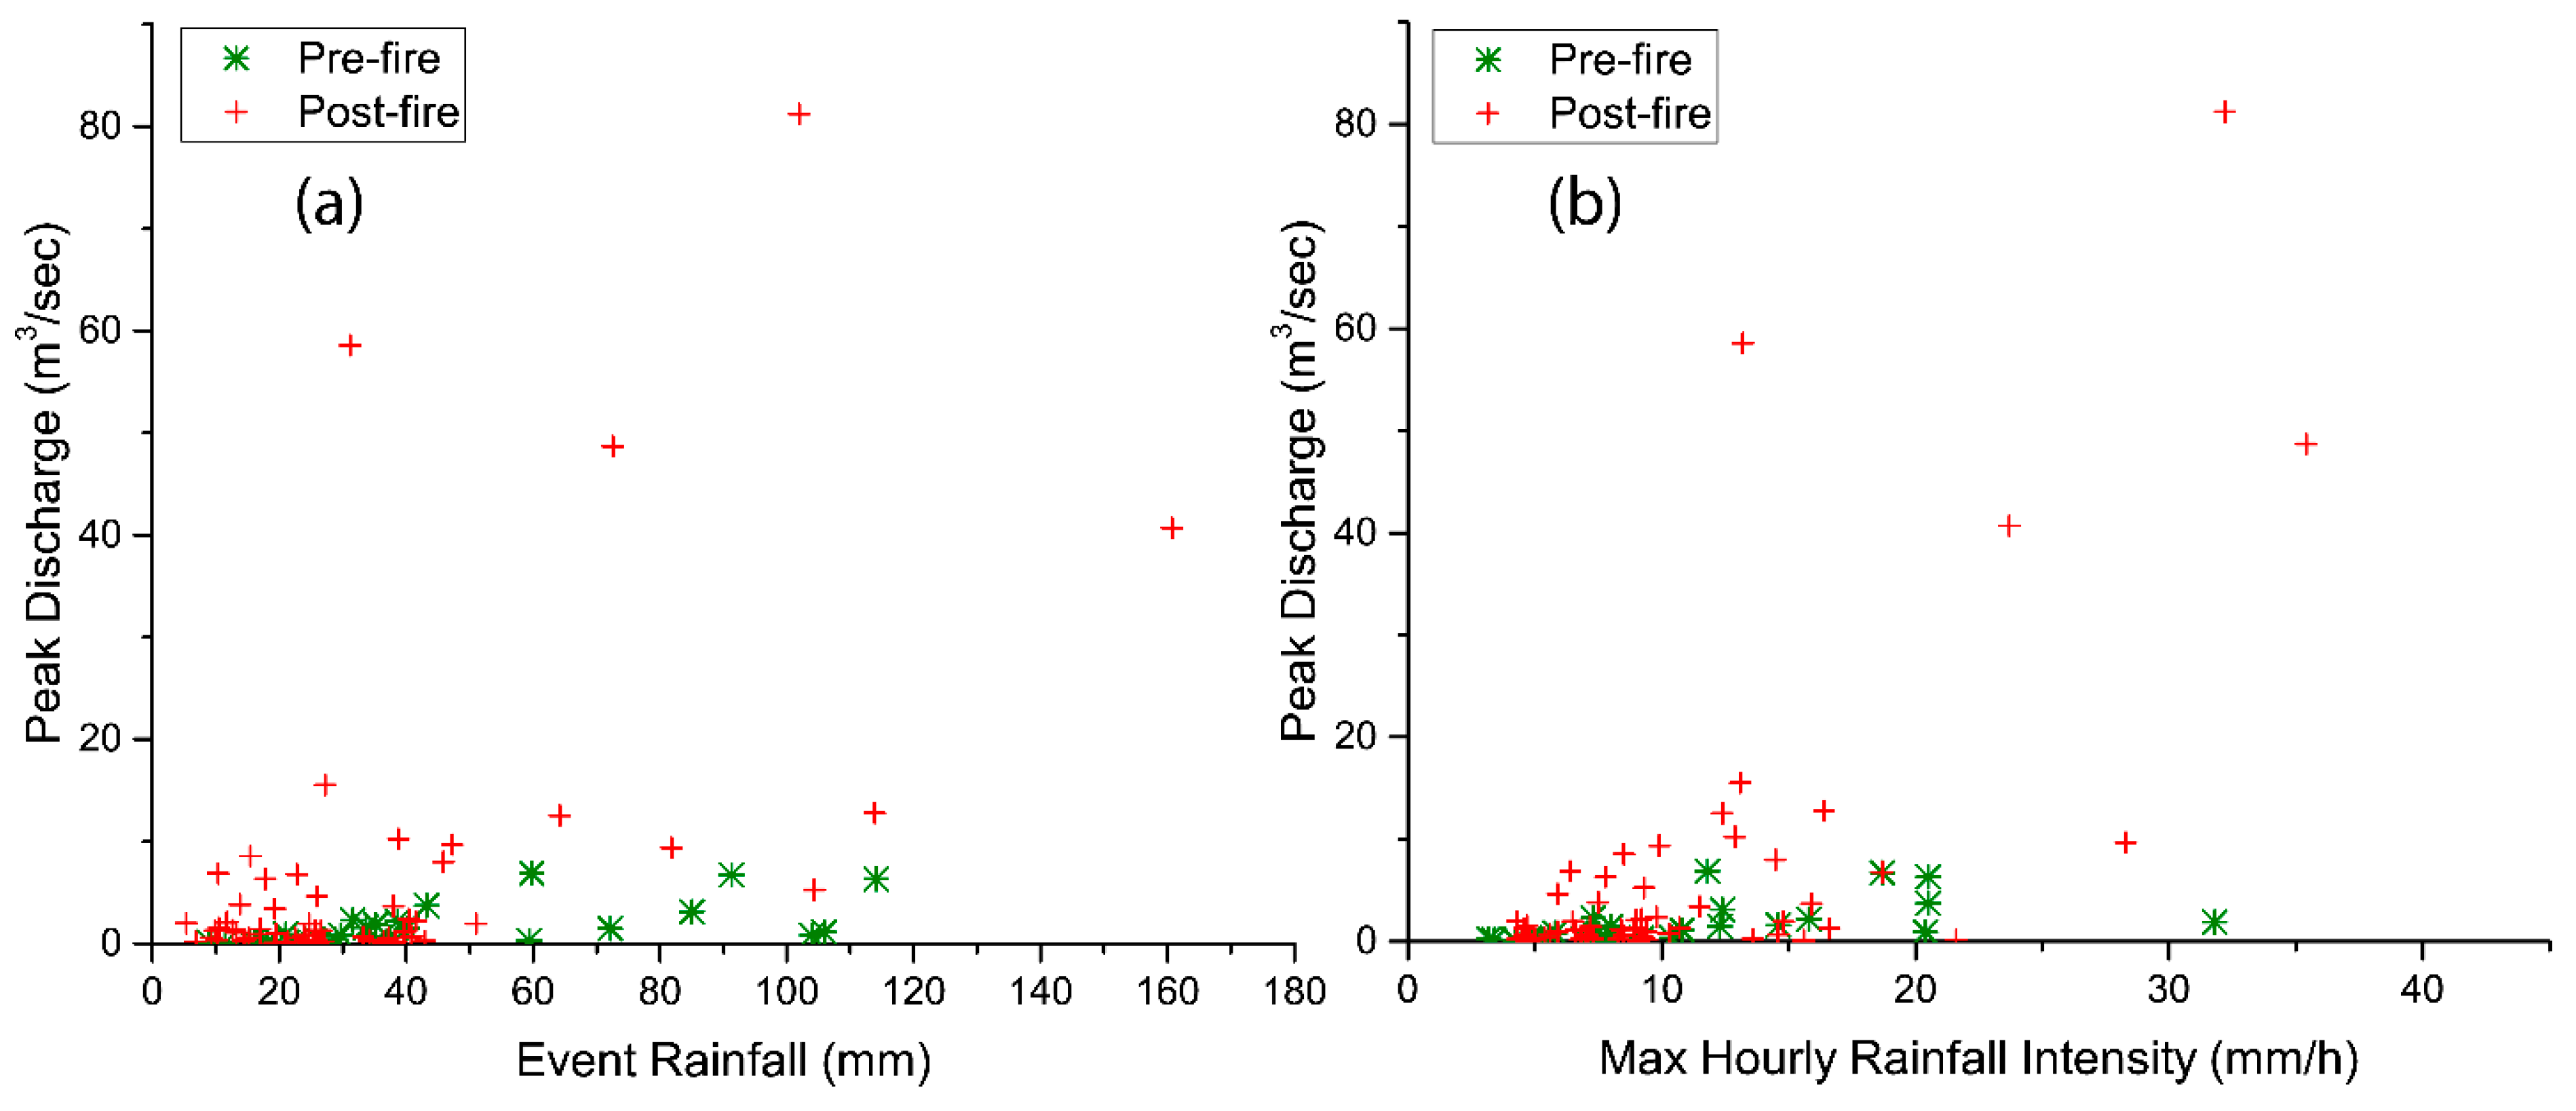
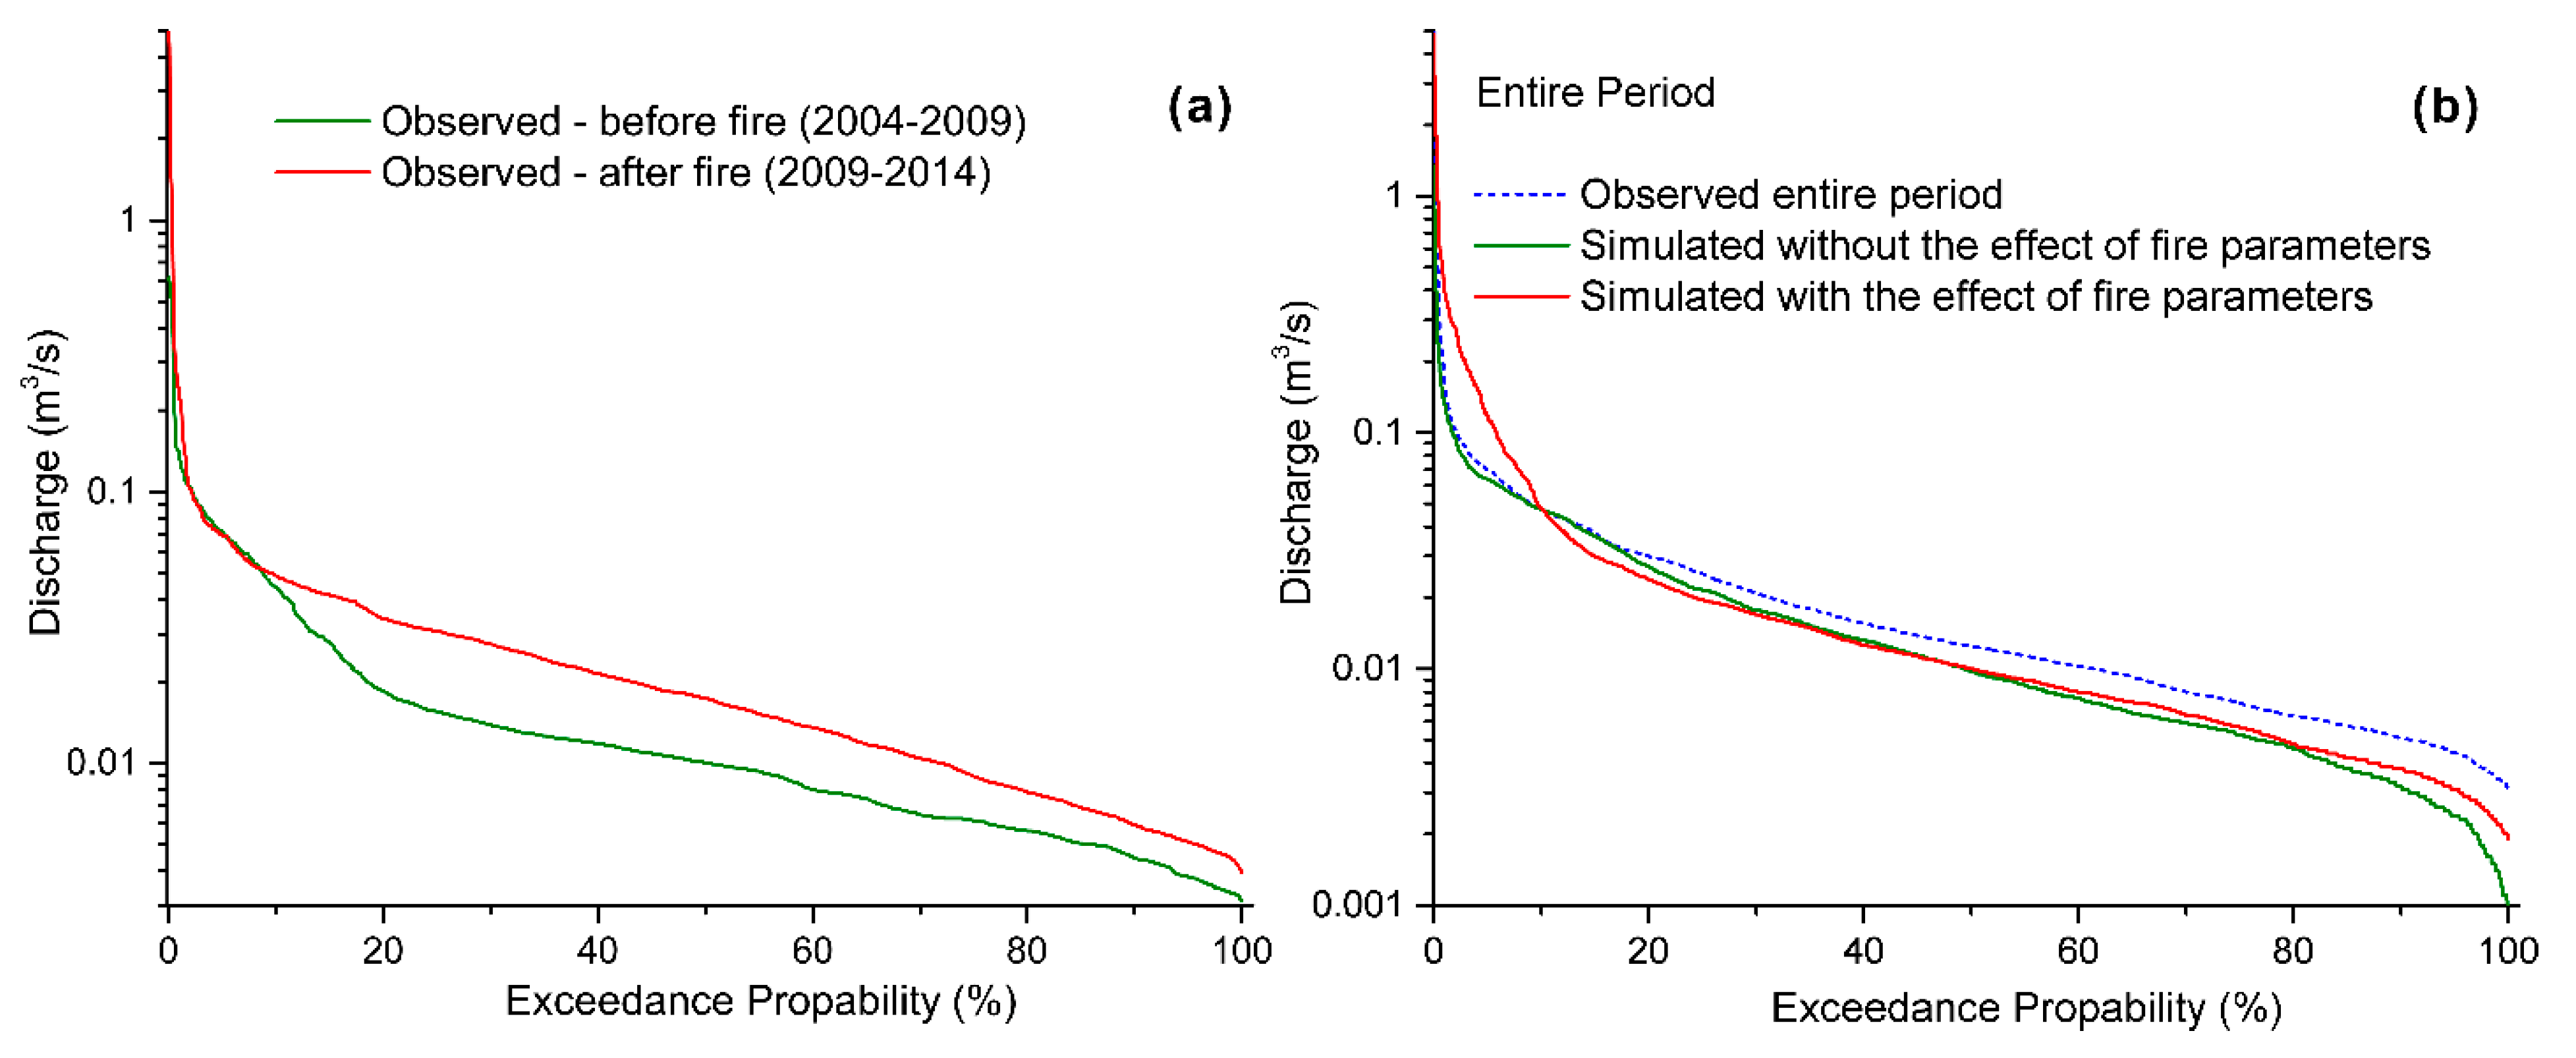
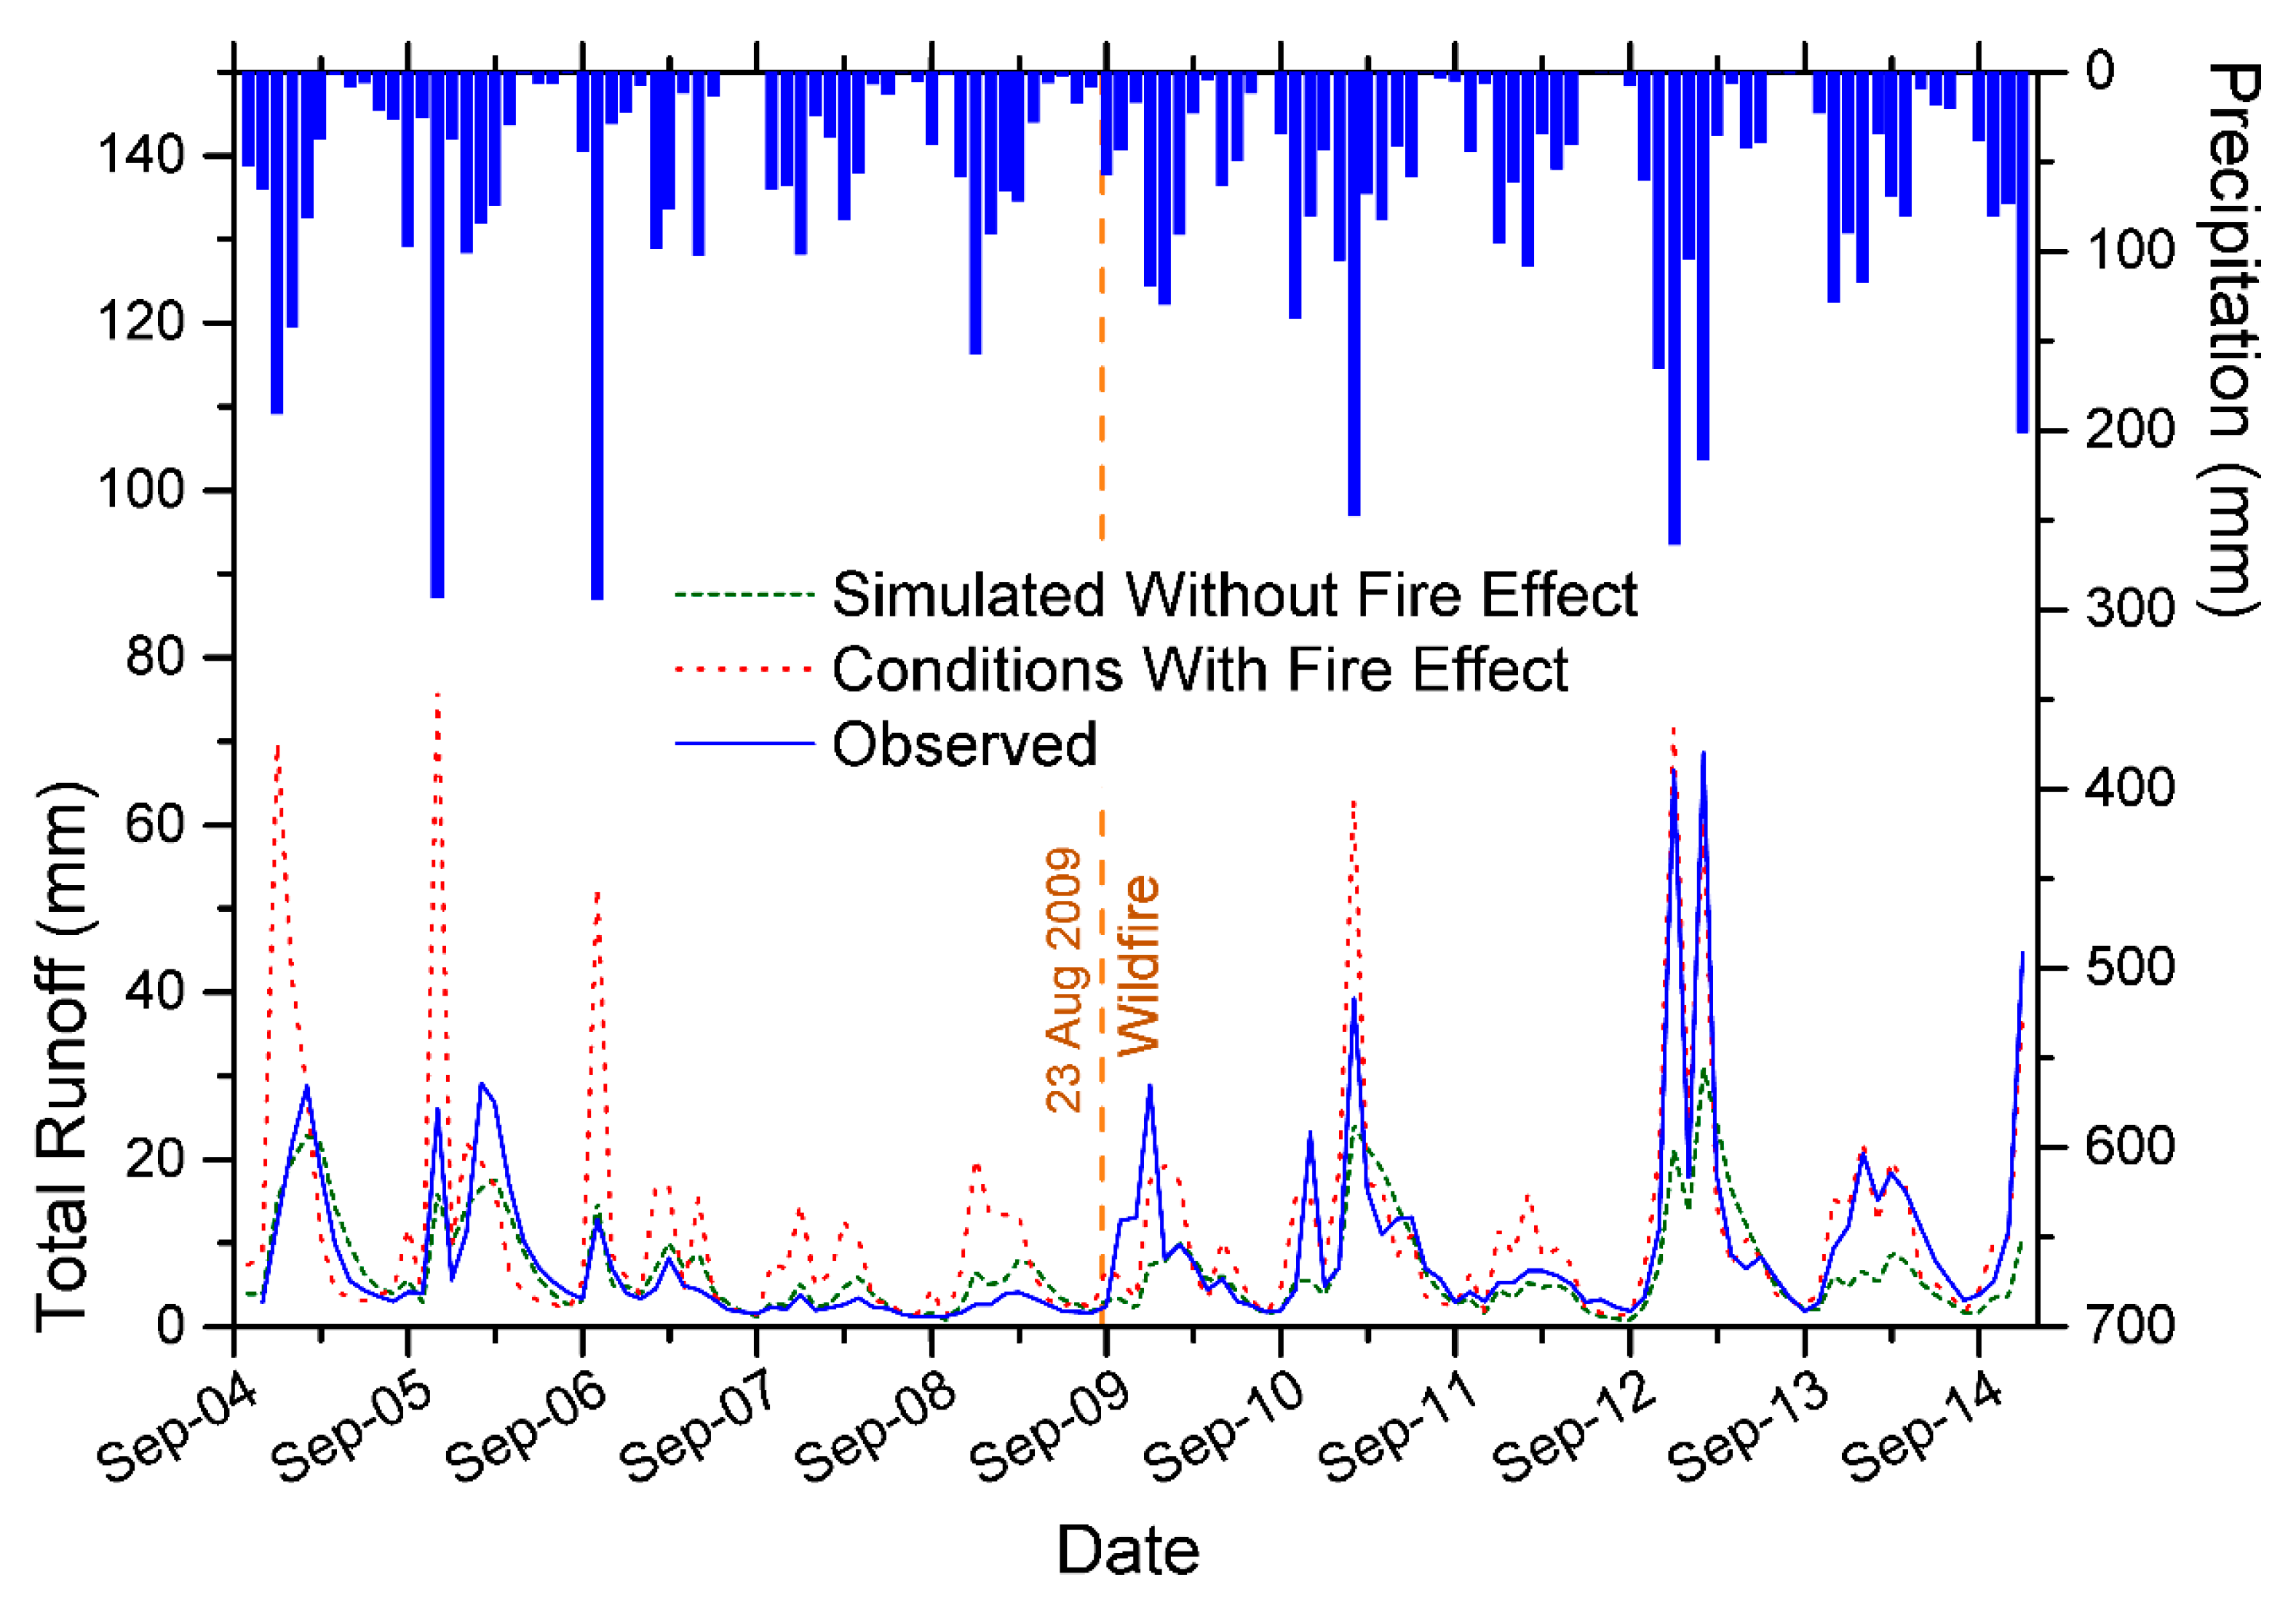
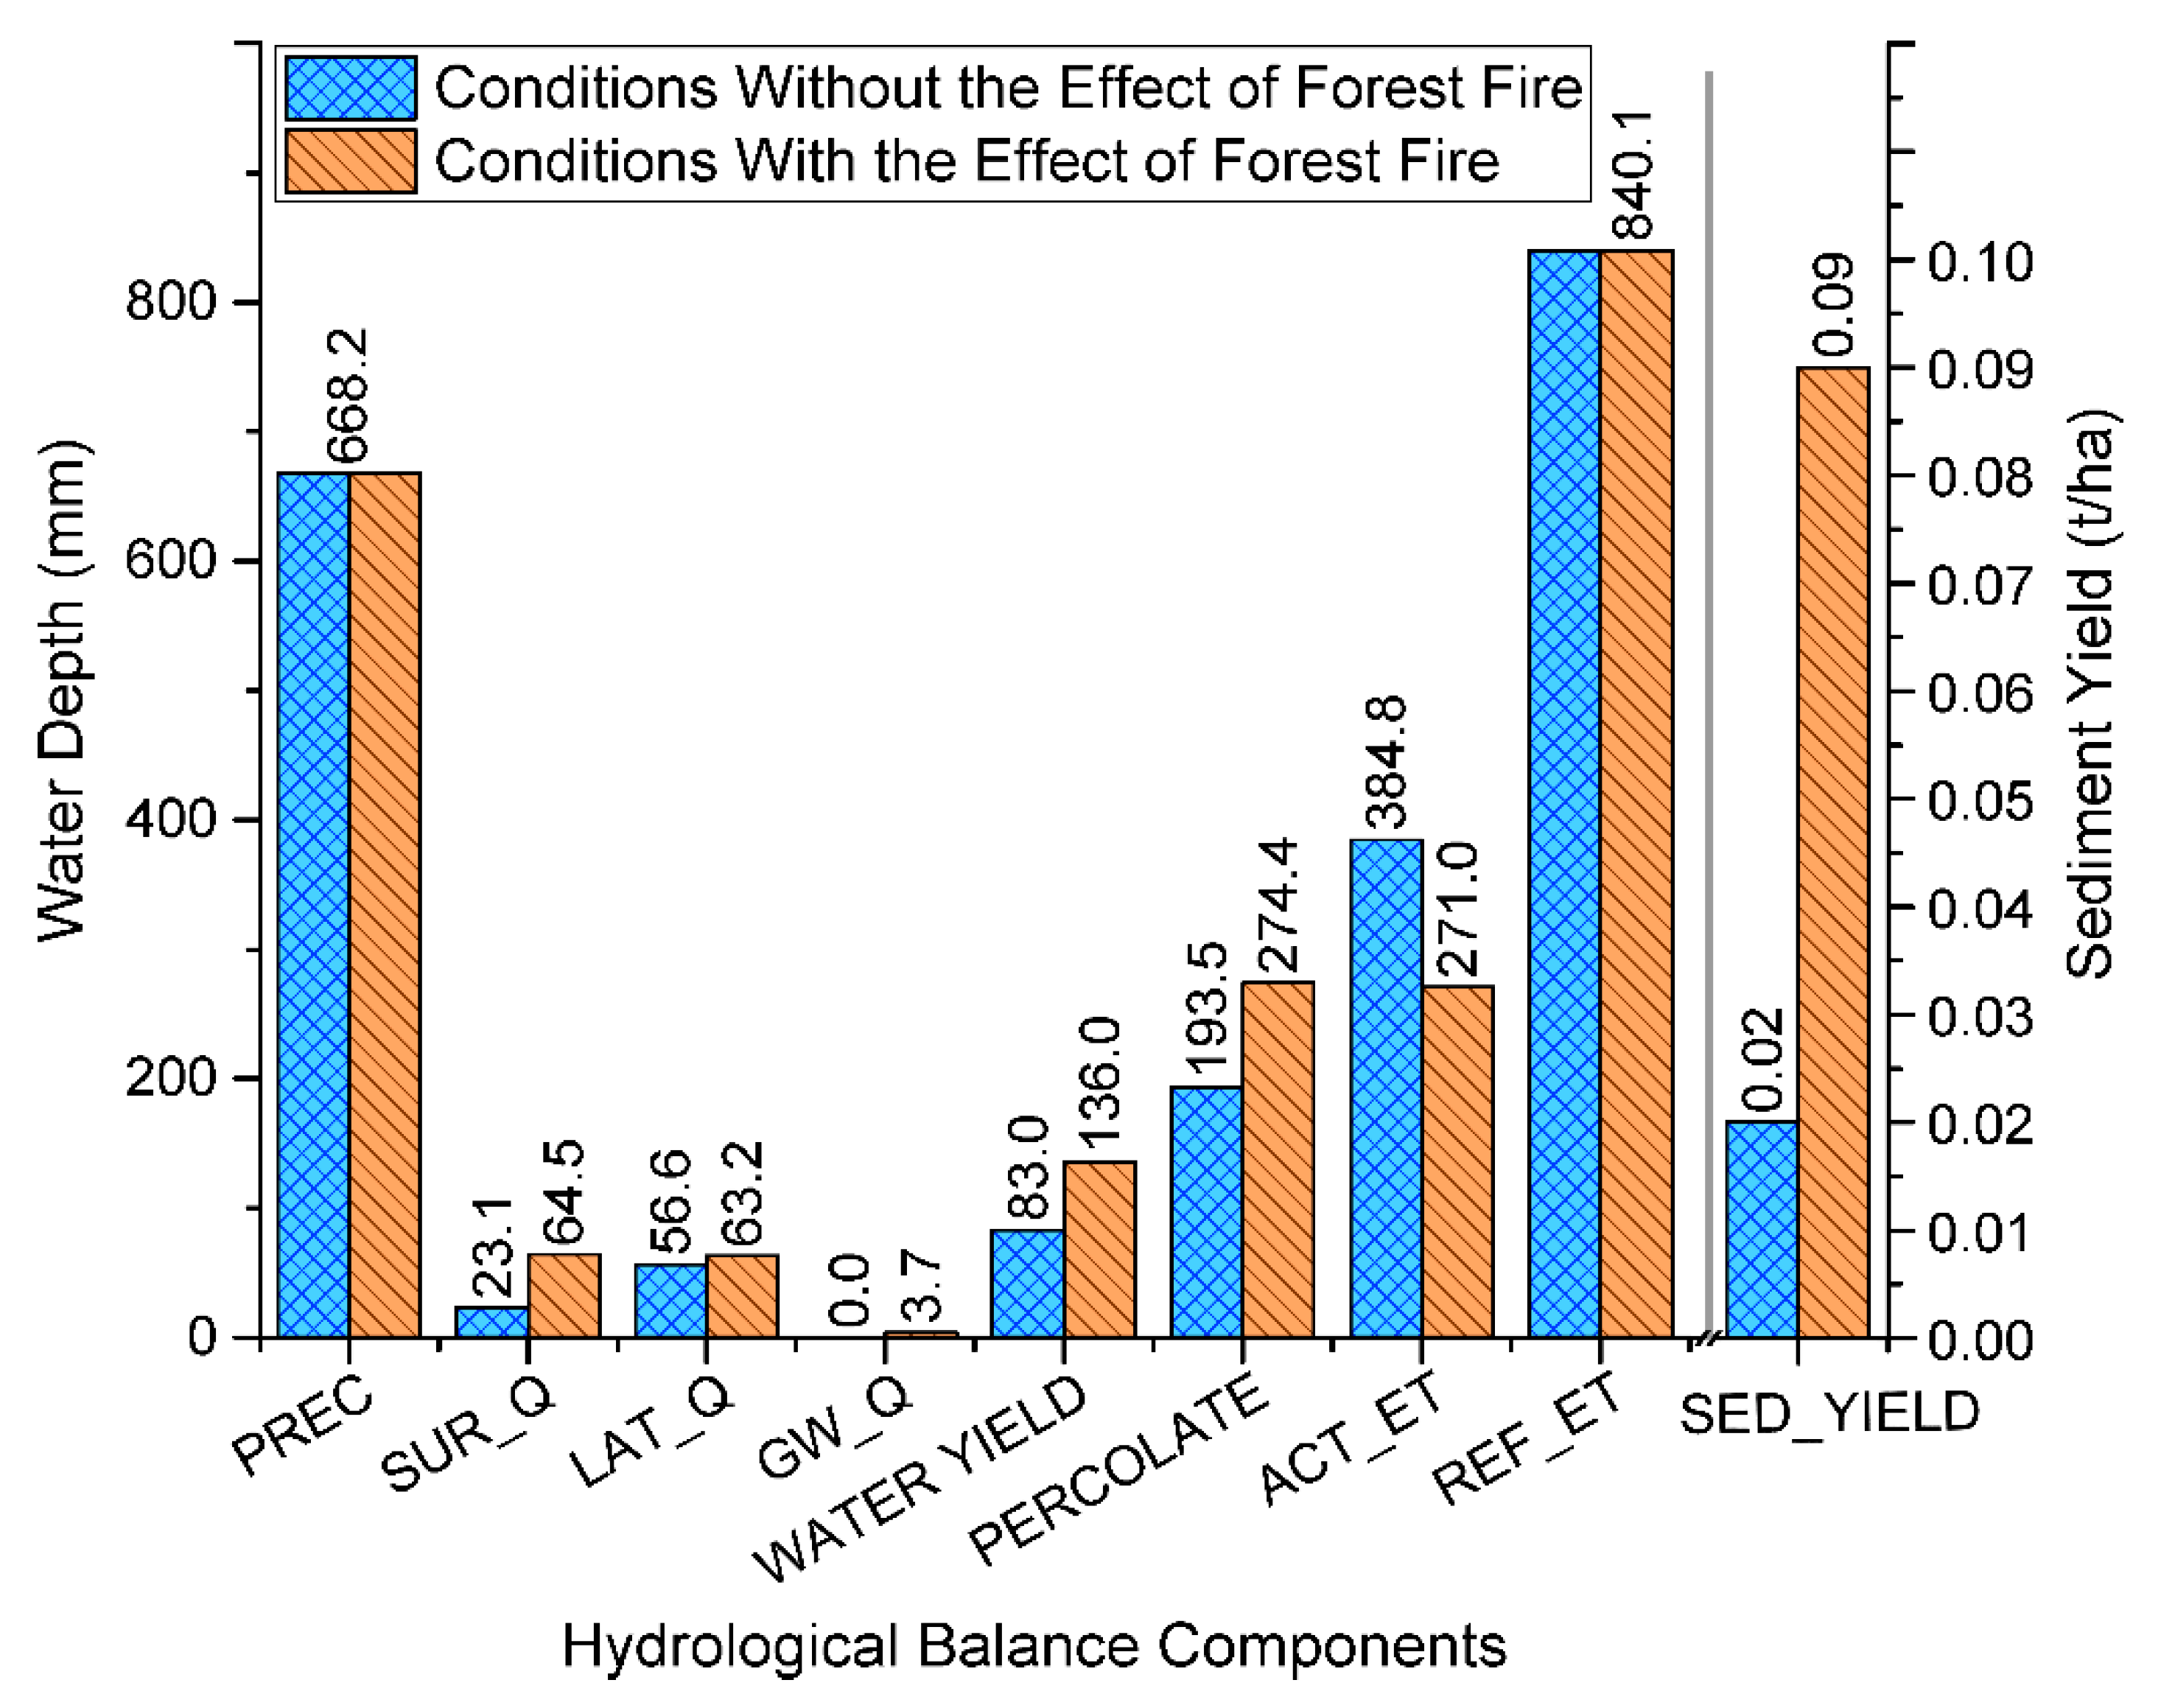
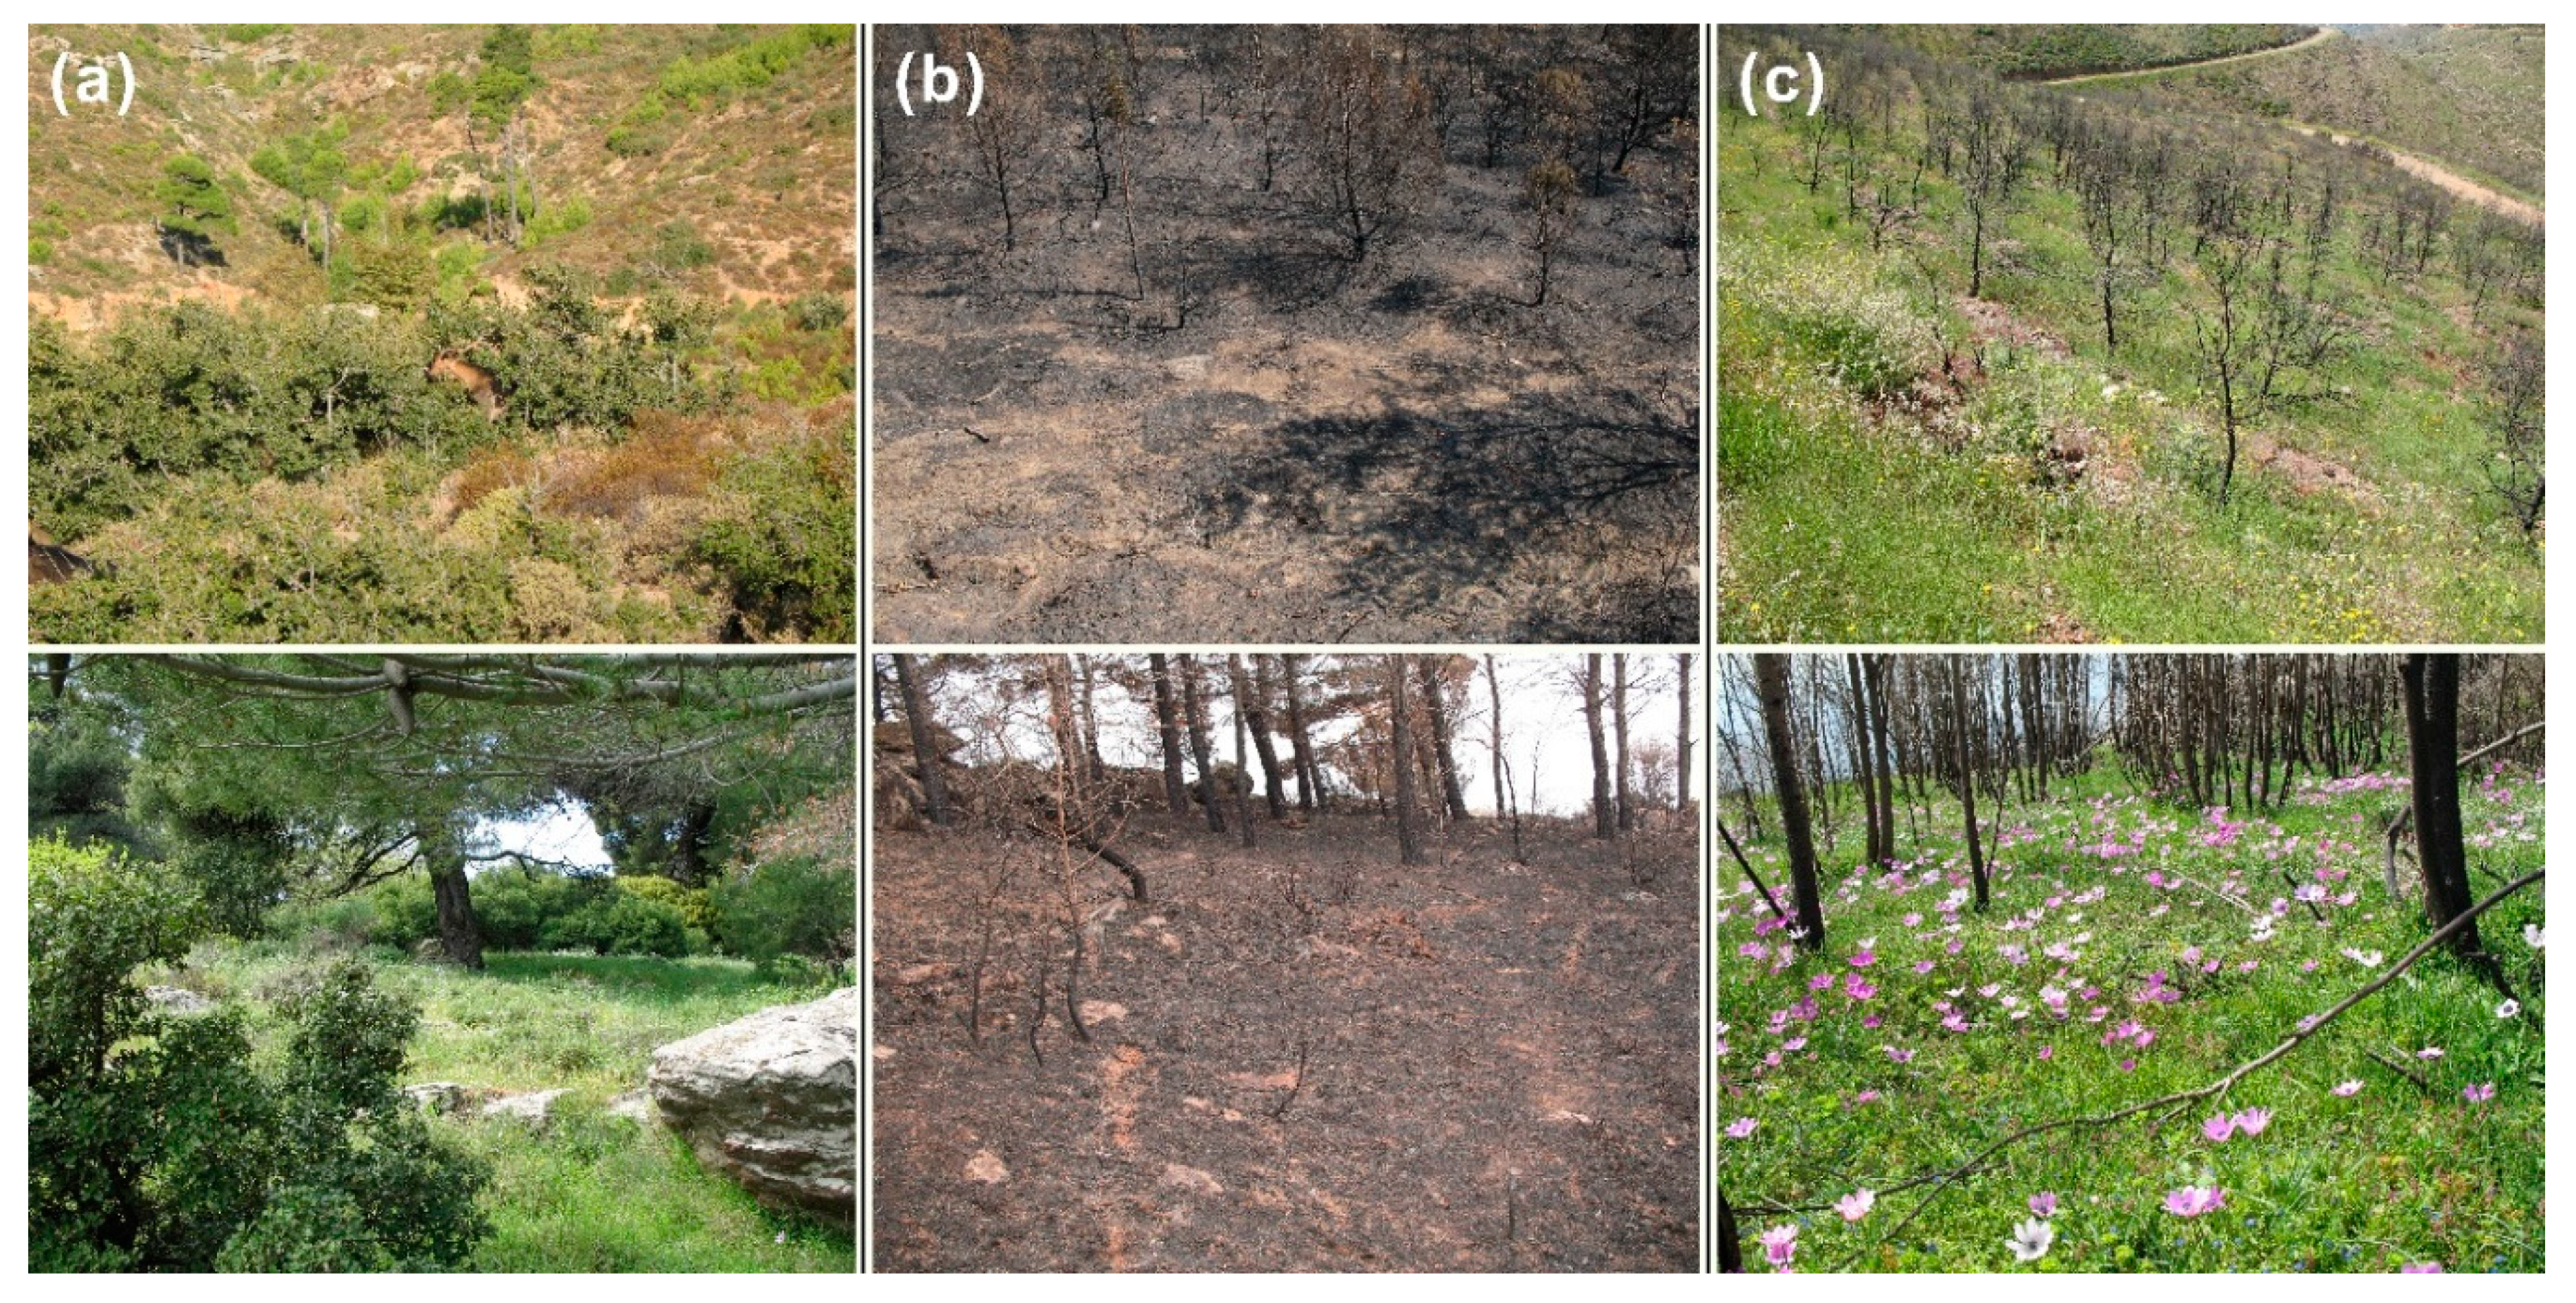
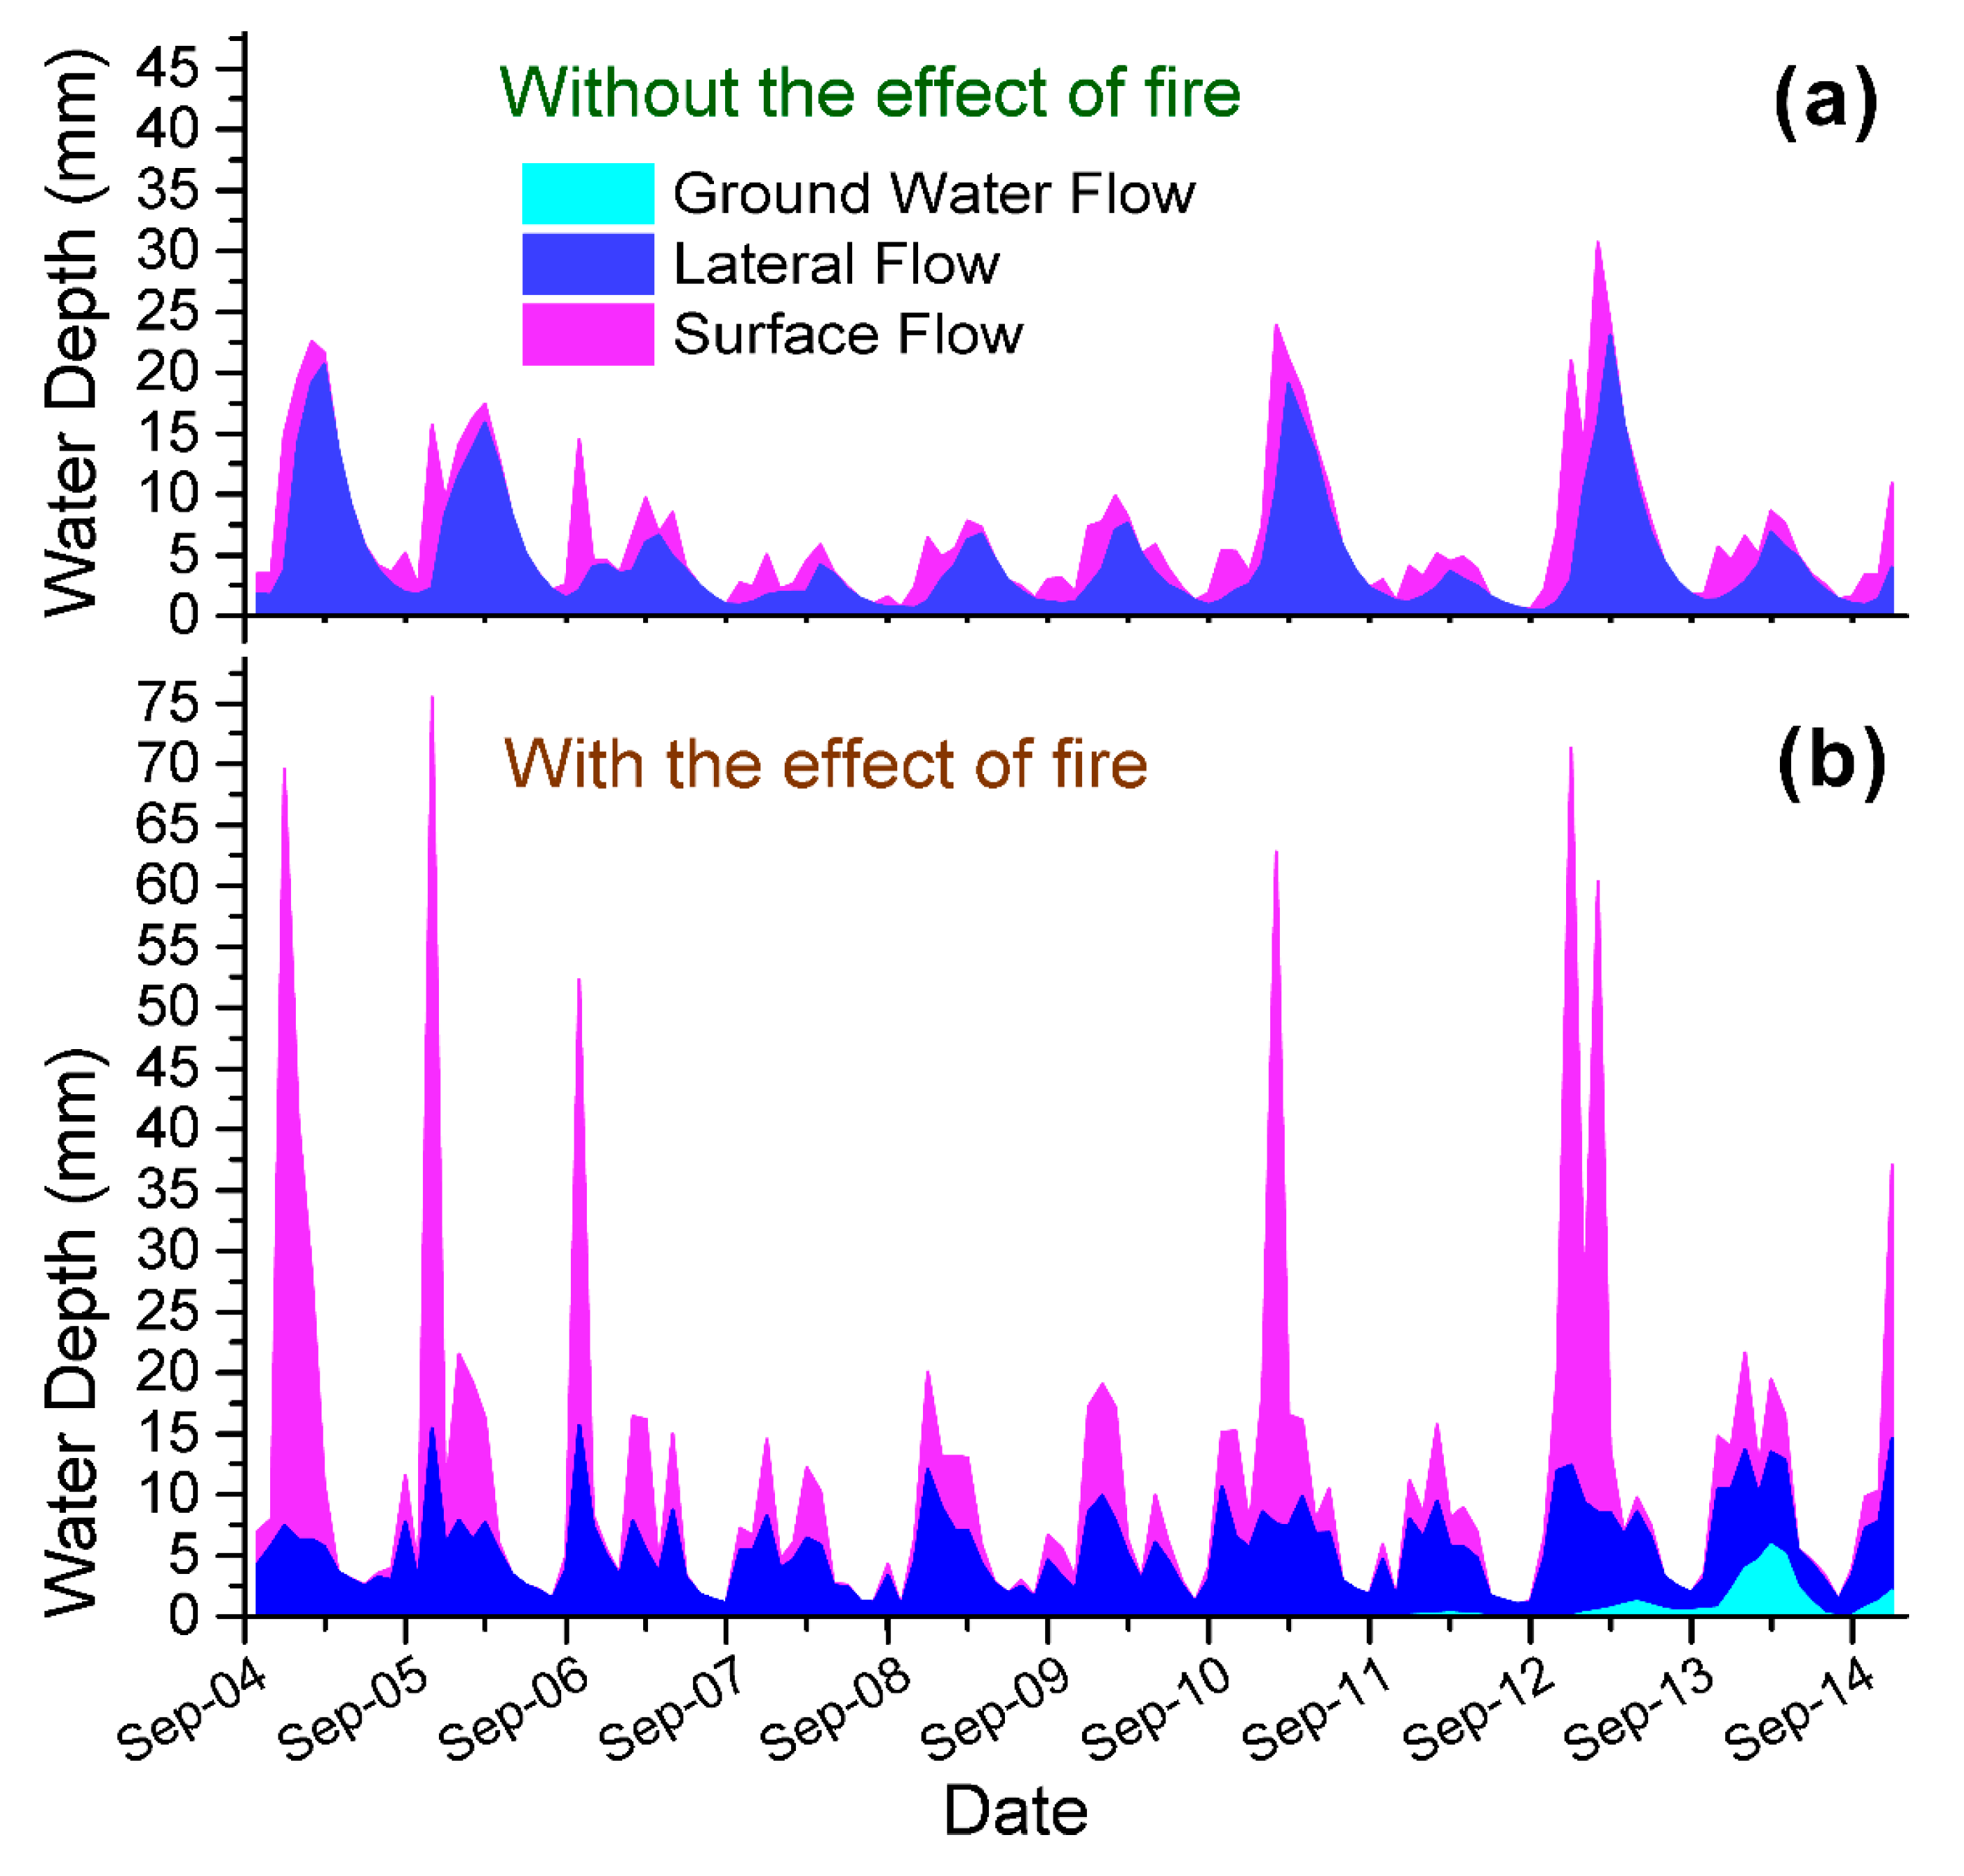
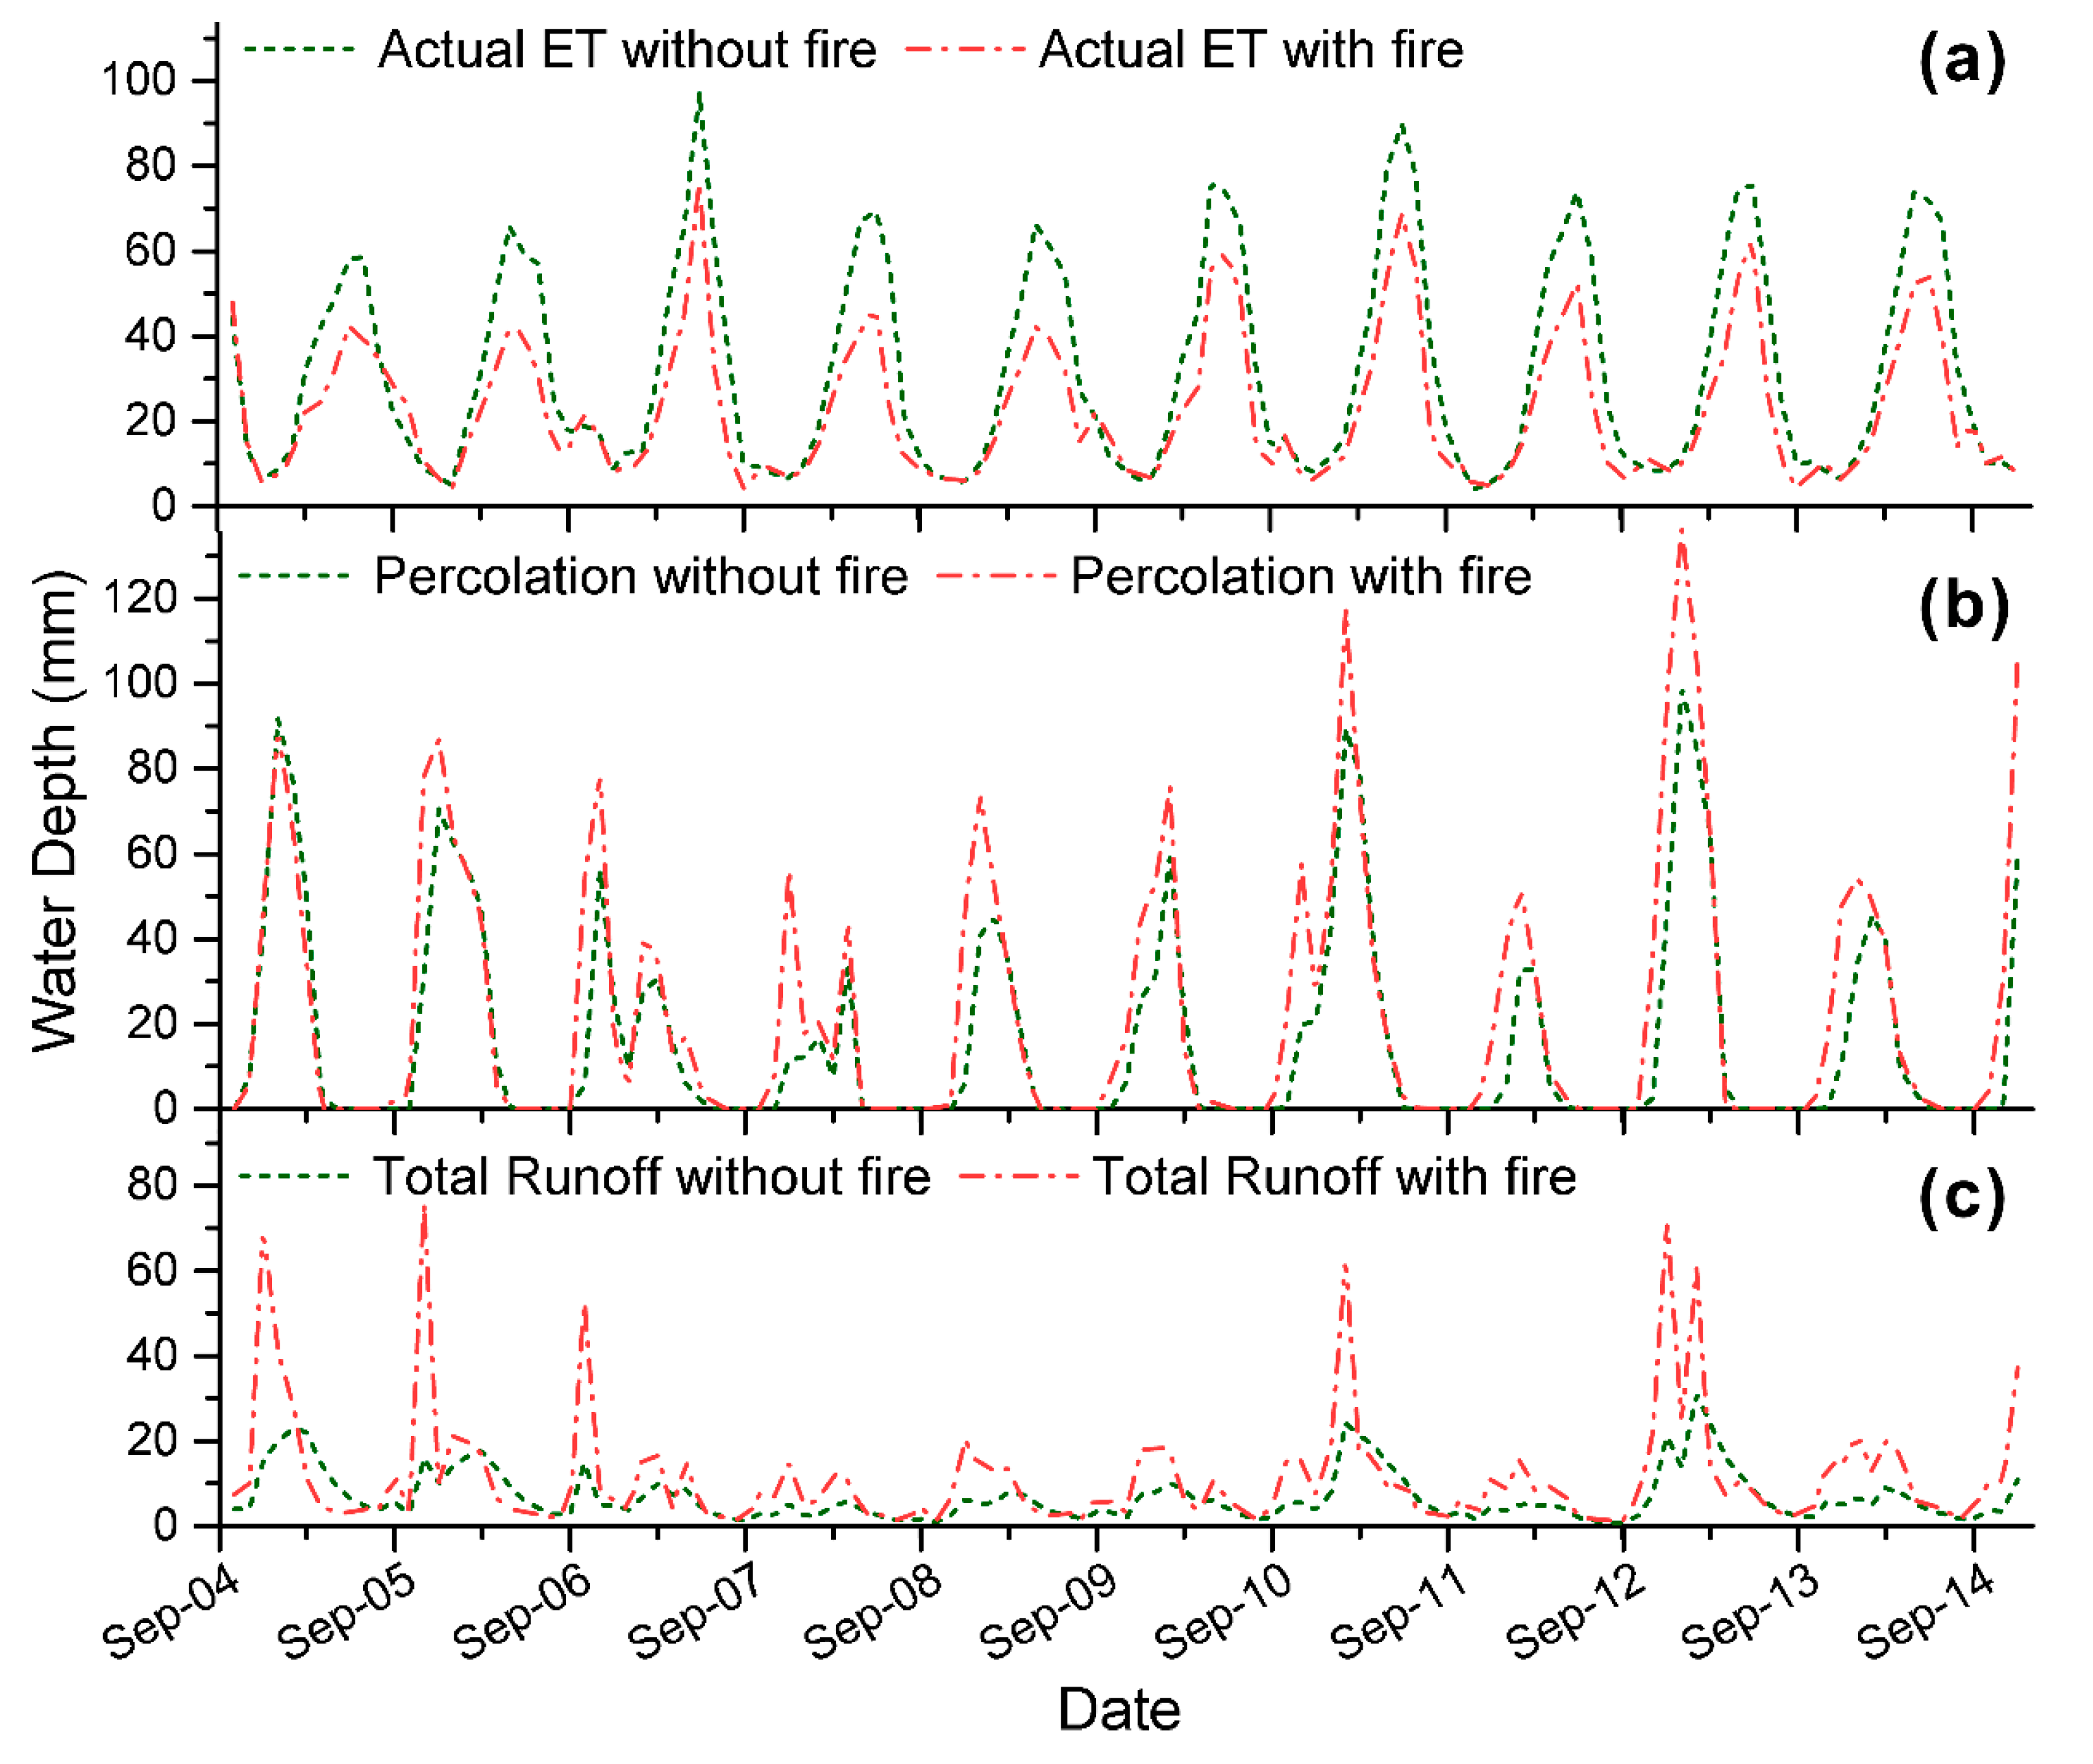
Table 1.
The more sensitive parameters of the model and their ranges as they resulted by the sensitivity analysis.
Table 1.
The more sensitive parameters of the model and their ranges as they resulted by the sensitivity analysis.
| Parameter Name | Parameter Description | Value Change Method | Range |
|---|---|---|---|
| ESCO | Soil evaporation compensation factor. | replace | (0, 1) |
| EPCO | Plant uptake compensation factor. | replace | (0, 1) |
| SOL_AWC | Available water capacity of the soil layer. | relative | (−0.5, 0.5) |
| SOL_K | Saturated hydraulic conductivity. | relative | (−0.5, 0.8) |
| SOL_Z | Depth from soil surface to bottom of layer | relative | (−0.5, 1.5) |
| ALPHA_BF | Baseflow alpha factor. | absolute | (−0.048, 0.95) |
| GDRAIN | Drain tile lag time. | absolute | (0, 100) |
| GW_DELAY | Groundwater delay. | absolute | (−10, 300) |
| GW_REVAP | Groundwater "revap" coefficient. | absolute | (−0.02, 0.18) |
| GWQMN | Threshold depth of water in the shallow aquifer required for return flow to occur. | absolute | (−500, 2000) |
| RCHRG_DP | Deep aquifer percolation fraction. | absolute | (−0.05, 0.95) |
| REVAPMN | Threshold depth of water in the shallow aquifer for “revap” to occur. | relative | (−0.6, 0.4) |
| LATTIME | Lateral flow travel time. | absolute | (0, 180) |
| CNCOEF | Plant ET curve number coefficient. | absolute | (−0.5, 1) |
Table 2.
Model performance metrics for the three calibration approaches, (a) independent calibration of both configurations, (b) independent calibration of the pre-fire model and calibration of only the parameters affected by the forest fire for the affected parts of the watershed (using pre-fire model calibrated parameters), (c) independent calibration of the post-fire model and use of the common parameters for the pre-fire model (using post-fire model calibrated parameters). NSE is the Nash–Sutcliffe efficiency MNSE is the modified Nash–Sutcliffe efficiency and PBIAS is the percent bias.
| Pre-Fire Model | Post-Fire Model | |||
|---|---|---|---|---|
| Independent Calibration (a,b) | Using Post-Fire Model Calibrated Parameters (c) | Independent Calibration (a) | Using Independent Pre-fire Model Calibrated Parameters (b) | |
| Calibration | ||||
| NSE | 0.63 | 0.47 | 0.84 | 0.82 |
| MNSE | 0.54 | 0.33 | 0.61 | 0.57 |
| PBIAS (%) | −2.8 | 17.6 | 4.8 | −5.6 |
| Validation | ||||
| NSE | 0.56 | 0.42 | 0.73 | 0.7 |
| MNSE | 0.51 | 0.28 | 0.57 | 0.53 |
| PBIAS (%) | −3.9 | 13.9 | 6.3 | −7.9 |
Table 3.
Statistics of the observed and the simulated daily discharges. Q1 to Q95 are the percentile flows, which are the flows equaled or exceeded at least at the corresponding percentage of the time.
Table 3.
Statistics of the observed and the simulated daily discharges. Q1 to Q95 are the percentile flows, which are the flows equaled or exceeded at least at the corresponding percentage of the time.
| Observed Entire Period | Observed Pre-Fire | Observed Post-Fire | Simulated Entire Period Pre-Fire Conditions | Simulated Entire Period Post-Fire Conditions | |
|---|---|---|---|---|---|
| Statistic | Discharge (m3/s) | ||||
| Average | 0.027 | 0.019 | 0.033 | 0.020 | 0.034 |
| Maximum | 4.942 | 0.616 | 4.942 | 1.343 | 4.801 |
| Minimum | 0.003 | 0.003 | 0.004 | 0.001 | 0.002 |
| Q95 | 0.004 | 0.004 | 0.005 | 0.002 | 0.003 |
| Q90 | 0.005 | 0.004 | 0.006 | 0.003 | 0.004 |
| Q75 | 0.007 | 0.006 | 0.009 | 0.005 | 0.006 |
| Median (Q50) | 0.013 | 0.010 | 0.017 | 0.010 | 0.010 |
| Q25 | 0.025 | 0.015 | 0.031 | 0.022 | 0.020 |
| Q10 | 0.047 | 0.045 | 0.049 | 0.047 | 0.048 |
| Q5 | 0.069 | 0.071 | 0.069 | 0.064 | 0.117 |
| Q1 | 0.154 | 0.130 | 0.219 | 0.132 | 0.388 |
Table 4.
Summary of the water balance components at an annual time step based on the model results for the two examined scenarios. PREC: precipitation, REF ET: reference evapotranspiration, PERC: percolation, ACT ET: actual evapotranspiration, SED YIELD: sediment yield.
Table 4.
Summary of the water balance components at an annual time step based on the model results for the two examined scenarios. PREC: precipitation, REF ET: reference evapotranspiration, PERC: percolation, ACT ET: actual evapotranspiration, SED YIELD: sediment yield.
| Conditions without the Effect of Forest Fire | Conditions with the Effect of Forest Fire | |||||||||
|---|---|---|---|---|---|---|---|---|---|---|
| Year | PREC | REF ET | PERC | ACT ET | WATER YIELD | SED YIELD | PERC | ACT ET | WATER YIELD | SED YIELD |
| mm | mm | mm | mm | mm | t/ha | mm | mm | mm | t/ha | |
| 2005 | 778.6 | 767.9 | 323.4 | 351.0 | 137.8 | 0.02 | 360.2 | 283.5 | 201.0 | 0.03 |
| 2006 | 692.5 | 824.1 | 263.7 | 372.3 | 111.0 | 0.02 | 319.4 | 259.0 | 149.6 | 0.03 |
| 2007 | 541.5 | 833.9 | 103.3 | 399.2 | 57.8 | 0.02 | 180.3 | 267.6 | 95.5 | 0.02 |
| 2008 | 484.0 | 883.1 | 76.4 | 354.4 | 36.6 | 0.01 | 143.0 | 231.2 | 75.5 | 0.02 |
| 2009 | 530.1 | 792.3 | 167.7 | 366.7 | 54.7 | 0.02 | 240.2 | 262.5 | 90.5 | 0.08 |
| 2010 | 669.0 | 872.6 | 155.6 | 402.5 | 62.9 | 0.02 | 249.7 | 290.5 | 111.0 | 0.02 |
| 2011 | 758.5 | 838.9 | 262.7 | 429.0 | 120.1 | 0.03 | 311.7 | 301.1 | 163.2 | 0.45 |
| 2012 | 796.0 | 878.2 | 124.8 | 374.4 | 58.1 | 0.02 | 266.2 | 249.2 | 154.8 | 0.05 |
| 2013 | 687.1 | 881.6 | 264.7 | 384.2 | 129.0 | 0.02 | 374.2 | 267.1 | 168.2 | 0.17 |
| 2014 | 744.3 | 828.6 | 192.9 | 414.2 | 62.2 | 0.02 | 298.6 | 298.8 | 150.3 | 0.03 |
| Per Year | 668.2 | 840.1 | 193.5 | 384.8 | 83.0 | 0.02 | 274.4 | 271.0 | 136.0 | 0.09 |
Publisher’s Note: MDPI stays neutral with regard to jurisdictional claims in published maps and institutional affiliations. |
© 2021 by the authors. Licensee MDPI, Basel, Switzerland. This article is an open access article distributed under the terms and conditions of the Creative Commons Attribution (CC BY) license (http://creativecommons.org/licenses/by/4.0/).
Share and Cite
MDPI and ACS Style
Soulis, K.X.; Generali, K.A.; Papadaki, C.; Theodoropoulos, C.; Psomiadis, E. Hydrological Response of Natural Mediterranean Watersheds to Forest Fires. Hydrology 2021, 8, 15. https://doi.org/10.3390/hydrology8010015
AMA Style
Soulis KX, Generali KA, Papadaki C, Theodoropoulos C, Psomiadis E. Hydrological Response of Natural Mediterranean Watersheds to Forest Fires. Hydrology. 2021; 8(1):15. https://doi.org/10.3390/hydrology8010015
Chicago/Turabian StyleSoulis, Konstantinos X., Konstantina Amalia Generali, Christina Papadaki, Christos Theodoropoulos, and Emmanouil Psomiadis. 2021. "Hydrological Response of Natural Mediterranean Watersheds to Forest Fires" Hydrology 8, no. 1: 15. https://doi.org/10.3390/hydrology8010015
Note that from the first issue of 2016, this journal uses article numbers instead of page numbers. See further details here.