Article

Characterization of Water Level Variability of the Main Ethiopian Rift Valley Lakes

by
Mulugeta Dadi Belete
1,2,3,*,
Bernd Diekkrüger
1 and
Jackson Roehrig
2
1
Department of Geography, University of Bonn, Bonn 53115, Germany
2
Institute for Technology and Water Resources Management in the Tropics and Subtropics, Cologne University of Applied Sciences, Köln 50678, Germany
3
Institute of Technology, School of Water Resources Engineering, Hawassa University, Hawassa, Ethiopia
*
Author to whom correspondence should be addressed.
Hydrology 2016, 3(1), 1; https://doi.org/10.3390/hydrology3010001
Submission received: 26 October 2015 / Revised: 18 December 2015 / Accepted: 21 December 2015 / Published: 25 December 2015

Abstract

:
In this paper, the water level fluctuations of eight Ethiopian Rift Valley lakes were analyzed for their hydrological stability in terms of water level dynamics and their controlling factors. Long-term water balances and morphological nature of the lakes were used as bases for the analyses. Pettit’s homogeneity test and Mann–Kendall trend analysis were applied to test temporal variations of the lake levels. It is found that the hydrological stability of most of the Ethiopian Rift Valley lakes is sensitive to climate variability. In terms of monotonic trends, Lake Ziway, Hawassa, Abaya and Beseka experienced significant increasing trend, while Ziway, Langano and Chamo do not. In addition, homogeneity test revealed that Lake Hawassa and Abaya showed significant upward shift around 1991/1992, which was likely caused by climate anomalies such as the El Niño / Southern Oscillation (ENSO) phenomena. Lake Abiyata is depicted by its significant decreasing monotonic trend and downward regime shift around 1984/1985, which is likely related to the extended water abstraction for industrial consumption.

1. Introduction

Water level variability of a given lake results from water exchange characteristics within its watershed [1]. Lake levels fluctuate naturally in response to climatic and hydrological factors within natural amplitudes [2] as far as they are undisturbed by external forces such as climate anomalies or anthropogenic factors. Scheffer and Carpenter [3] also remark that the usual state of affairs in nature is to fluctuate around some stable average. The seasonal and annual water level fluctuation of lakes is a common phenomenon in every lake. Such fluctuations are usually due to the differences between precipitation and evaporation at specific season [4]. These dynamics are controlled by the balance between inputs and outputs of water, which are in turn controlled by the hydrological processes [5]. These natural fluctuations are inherent feature of lake ecosystems and essential for the survival and well-being of many species that have evolved to suit their life cycle to those fluctuations [6].
In the Main Ethiopian Rift Valley region, no increasing/decreasing precipitation trend for the last 50 years [7] has been detected. This kept the level of some lakes constant, with little or no change [8] but some of the lakes in the region experienced either an increasing or decreasing trend [7,9,10]. These fluctuations are disturbing stability of the ecosystems and seriously impacting the lives of many animals and plants around the lakes [11]. Studying the characteristics of lake level variability in the region is relevant for providing insight into the similarity or dissimilarity of the variability among the lakes in the basin. Therefore, this study aims at characterizing the lake level variability of Ethiopian Rift Valley lakes and assessing the dominant processes controlling the lake level variability.

2. Methodology

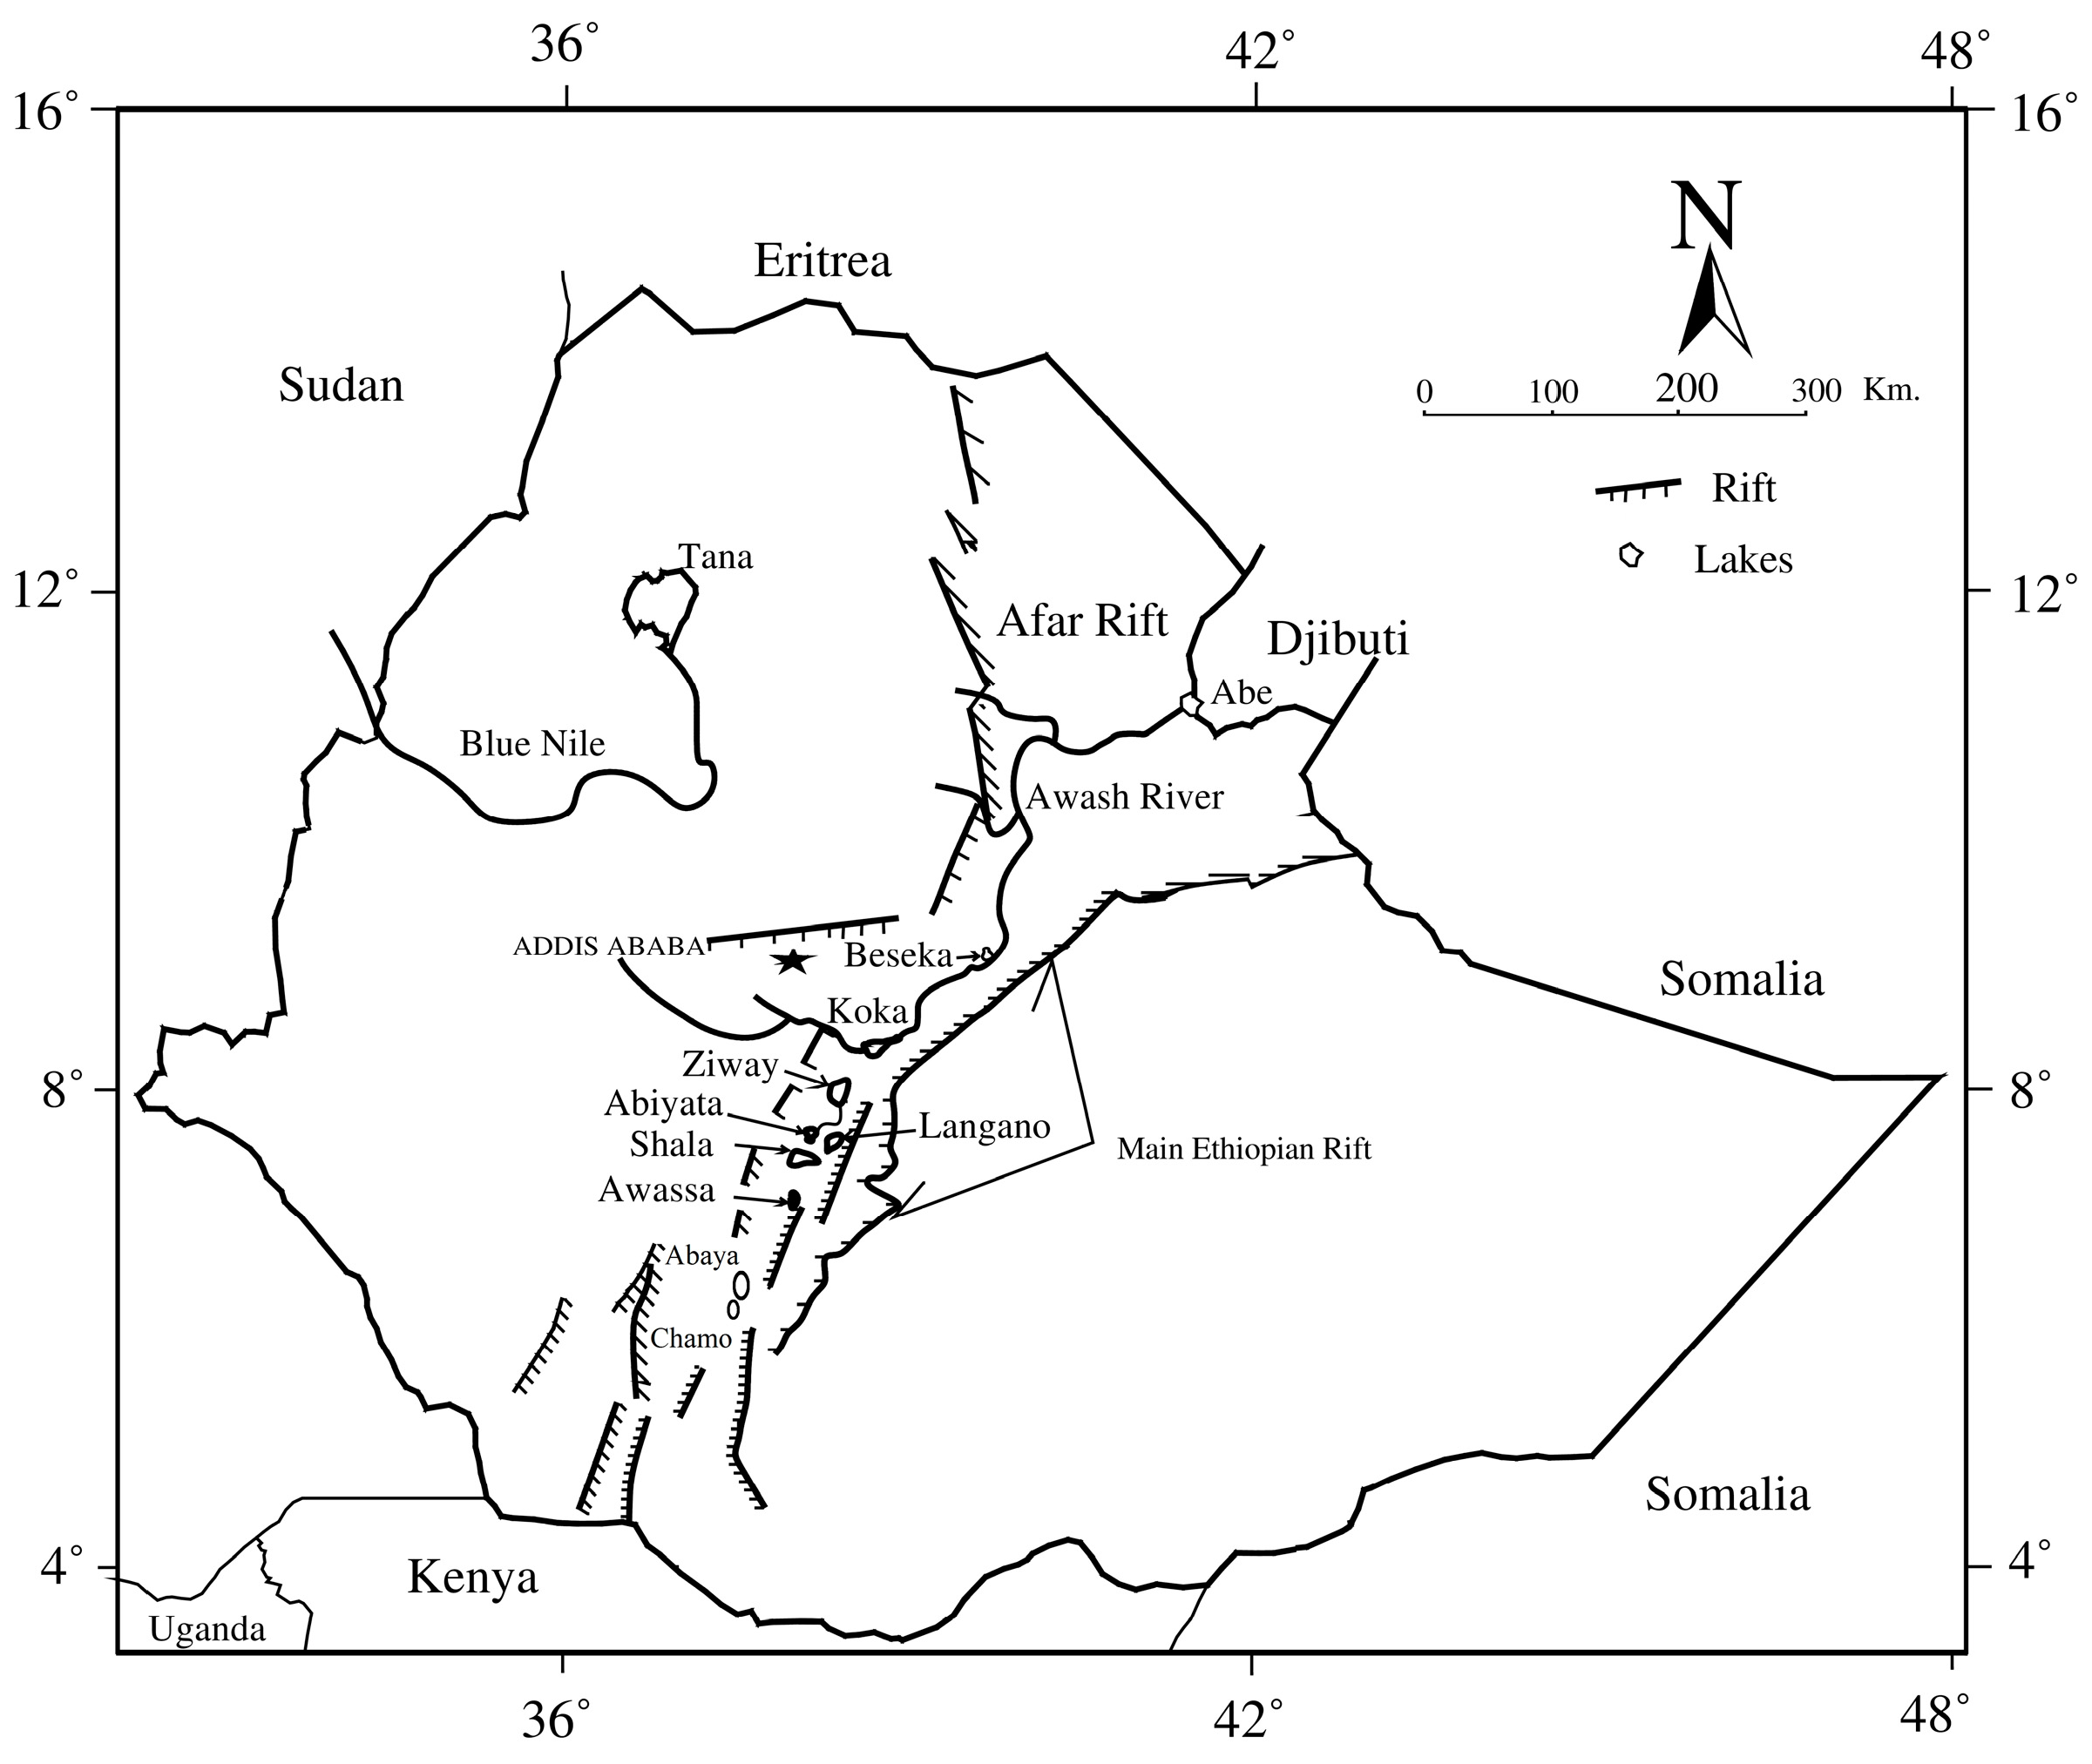
2.1. Study Area and Characteristics of the Lakes

The Rift Valley Lakes Basin (RVLB) is one of the eleven major river basins in Ethiopia with a total area of about 52,000 km2 [12]. The basin is characterized by a chain of lakes varying in size as well as in hydrological and hydrogeological settings [13]. It constitutes eight lakes, Lake Ziway, Lake Langano, Lake Abiyata, Lake Shalla, Lake Hawassa, Lake Abaya, Lake Chamo, and Lake Beseka (Figure 1), and all are located southwest of the Ethiopian capital, Addis Ababa.
Figure 1. Relative locations of the Ethiopian rift-valley lakes (source: Alemayehu et al. [13]). (N.B: The original map does not show Lake Abaya and Chamo).
Hydrology 03 00001 g001
Table 1 shows the morphological characteristics of individual lakes in the Rift Valley Basin. The information are compiled from different sources.
Table 1. Morphological characteristics of Rift Valley lakes.
Elevation (m.a.s.l)Max. Depth (m)Mean Depth (m)Volume (km)Surface Area (km)Watershed Area (km)
1Lake Ziway16368.952.51.64427025
2Lake Abiyata157814.27.61.11761630
3Lake Shalla15582668736.73293920
4Lake Langano158247.9175.32411600
5Lake Hawassa168022111.34901250
6Lake Abaya128513.17.18.2116217,300
7Lake Chamo12331363.35512210
8Lake Beseka12001180.280 (in 2010)2.7 (1969); 48.5 (2010)505
(Sources: Wood and Talling [14], Kebede et al. [15], Chernet [16], Ayenew [17], Tessema [18], MoWR [19], WWDSE [20], Deganovsky and Getahun [21], Goerner et al. [22], Belay [9], Ayenew [7], and Dinka [23]).

2.2. Available Data

Table 2 presents the magnitudes of available water balance components for the eight Rift Valley lakes of Ethiopia.
Table 2. Water balance components of the eight Rift Valley lakes (the units are as appeared in their respective literatures, no conversion made).
Name of the LakeInflowOutflowReferences
PSinRunGWiESoutAGWo
1Ziway (in 106 m3)323656.54880.58901842814.6Ayenew [7]
(mm)7501530 1720 Deganovsky and Getahun [21]
(mm)7530.692 km30.05 km31001740 200 (net)Vallet-Coulomb et al. [24]
2Langano (in ×106 m3)186212 135.446346 18.9Ayenew [7]
3Abiyata (in ×106 m3)1132301526.83720131.2Ayenew [7]
(in ×106 m3)97.2179.8713.92290.970 0Ayalew [25]
4Shalla (in ×106 m3)23224518407810 Ayenew [7]
5Hawassa (in ×106 m3)10683.1 1320 58Ayenew [7]
(mm)9501440 14400 570Deganovsky and Getahun [21]
(in ×106 m3)80.67490 164.60 71WWDSE [20]
(in ×106 m3)10683 1310 58Ayenew and Gebreegziabher [26]
(in ×106 m3)90 167 148Gebremichael [27]
(in ×106 m3)98.954.944.44 178.930 Shewangizaw [28]
(in ×106 m3)90.7288.2991.573.2166.66 71.5WRDB [29]
(in ×106 m3)10683.7 - 1320 58Gebreegziabher [10]
(in ×106 m3)10683.7 - 132 58Ayenew [8]
(in ×106 m3) 52.5Ayenew and Tilahun [30]
6Abaya (in ×106 m3)556 1900 Ayenew [7]
(in ×106 m3)980750691 2009 Belete [31]
(mm)7301080 1700 Deganovsky and Getahun [21]
7Chamo (in ×106 m3)406 900.9 Ayenew [7]
8Beseka (in ×106 m3)2230 52.898.8 Ayenew [7]
(in ×106 m3)24.47.733.861.8 0.22Belay [9]
P = over lake precipitation; Sin = stream flow; Run = surface runoff from the watershed; E = evaporation from the lake; Sout = stream outflow; A = abstraction; GWi = ground water inflow; GWo = ground water outflow.

2.3. Methods

This study aims to investigate the hydrological nature of Main Ethiopian Rift Valley lakes by assessing their long-term water balances; their morphological characteristics; and analyzing their time series data of water level records. Assuming the fundamental similarity of all lakes, the study adopted four different approaches to estimate the natural responses of the lakes. These techniques of characterizing the lake level regime are suggested by Szesztay [32] based on long-term water balances; Litinskaya [33] based on morphological nature of lakes; Pettit [34] to test for the occurrences of significant regime shift (Homogeneity test); and Mann [35] and Kendall [36] test for monotonic trend test. The methods are meant to show the expected natural behavior of the lake hydrology, and deviations from these are considered to be shifts from the natural state. The following sections discuss the methods in detail.

2.3.1. Water Balance Approach to Characterize the Lake Level Regimes

An earlier publication of Szesztay [32] suggested the possibility of classifying lakes based on their water balance as shown in Figure 2 and Figure 3. Inflow factor (i), outflow factor (o) and aridity factor (a) are the basic criteria for characterization of the lakes. The basic equations of these factors are presented below:
I n f l o w f a c t o r ( i )   =   T o t a l   i n   f l o w   i n t o   t h e   l a k e T o t a l   i n p u t   i n t o   t h e   l a k e   =   I I + P * 100 [ % ]
O u t f l o w f a c t o r ( o )   =   T o t a l   o u t f l o w   f r o m   t h e   l a k e T o t a l   o u t p u t   f r o m   t h e   l a k e   =   O O +   E * 100   [ % ]
A r i d i t y f a c t o r ( a )   =   E v a p o r a t i o n P r e c i p i t a t i o n   =   E P [ ]
in which the flow units are in given in m3. A lake which belongs to one of the nine categories of Figure 2 and Figure 3 is considered as having particular characteristics in terms of stability of the water balance and the factors controlling water level fluctuation. For instance, the quadrant I-O represents those lakes which are flow-dominated and equilibrium condition of their water balance are quickly followed by corresponding changes in the height and regime of the water level. The quadrant P-E comprises “atmosphere-controlled” lakes with self-regulating mechanism responsive to climatic changes. The quadrants IP-E and I-E are expected to accumulate short-term variations of precipitation, which in turn increase the imbalance during extreme dry and wet periods. The other five quadrants of the scheme (I-OE, IP-OE, P-OE, P-O and IP-O) are conceived as representing intermediate situations between the “flow-controlled” and “climate-controlled” lakes. The approach of Szesztay is used to classify lakes according to their hydro-climatic characteristics (e.g., Lukács et al. [37]).
Figure 2. Classification of lakes by water balance criteria (inflow-outflow). (N.B: Lake Chamo was not considered in this result due to limited data availability).
Hydrology 03 00001 g002
Figure 3. Classification of lakes by water balance criteria (aridity-outflow). (N.B: Lake Chamo was not considered in this result due to limited data availability).
Hydrology 03 00001 g003

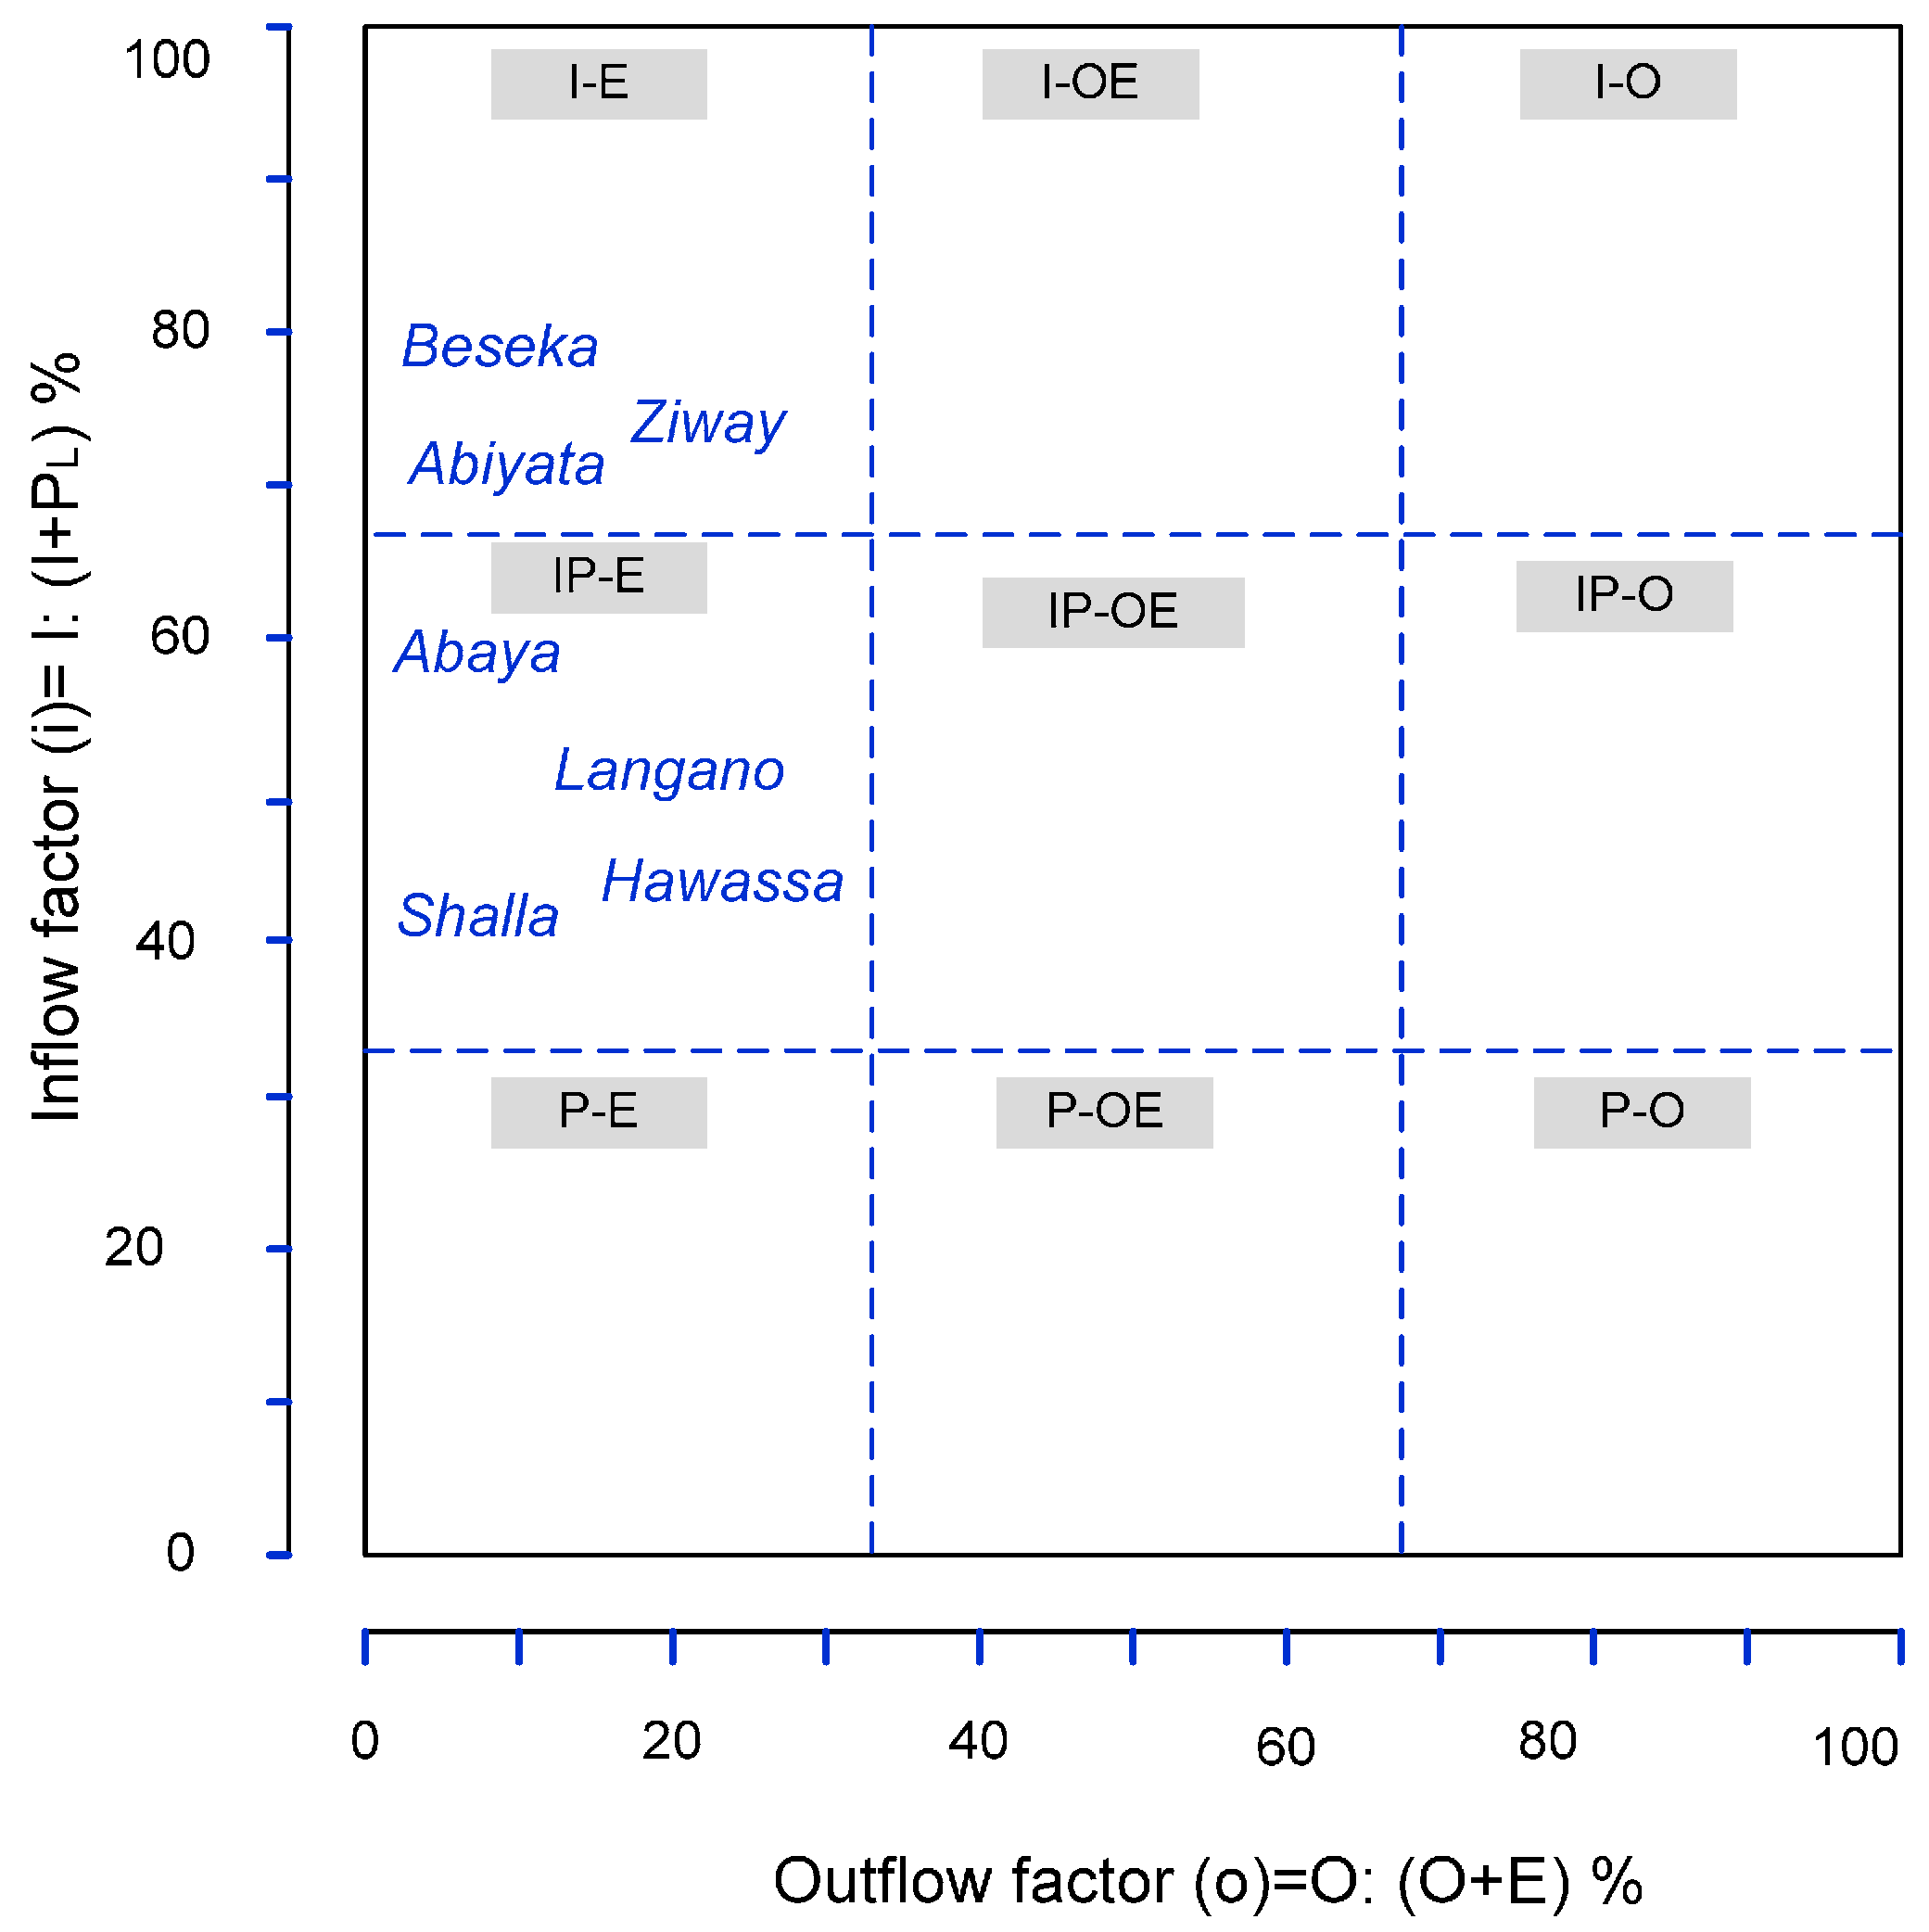
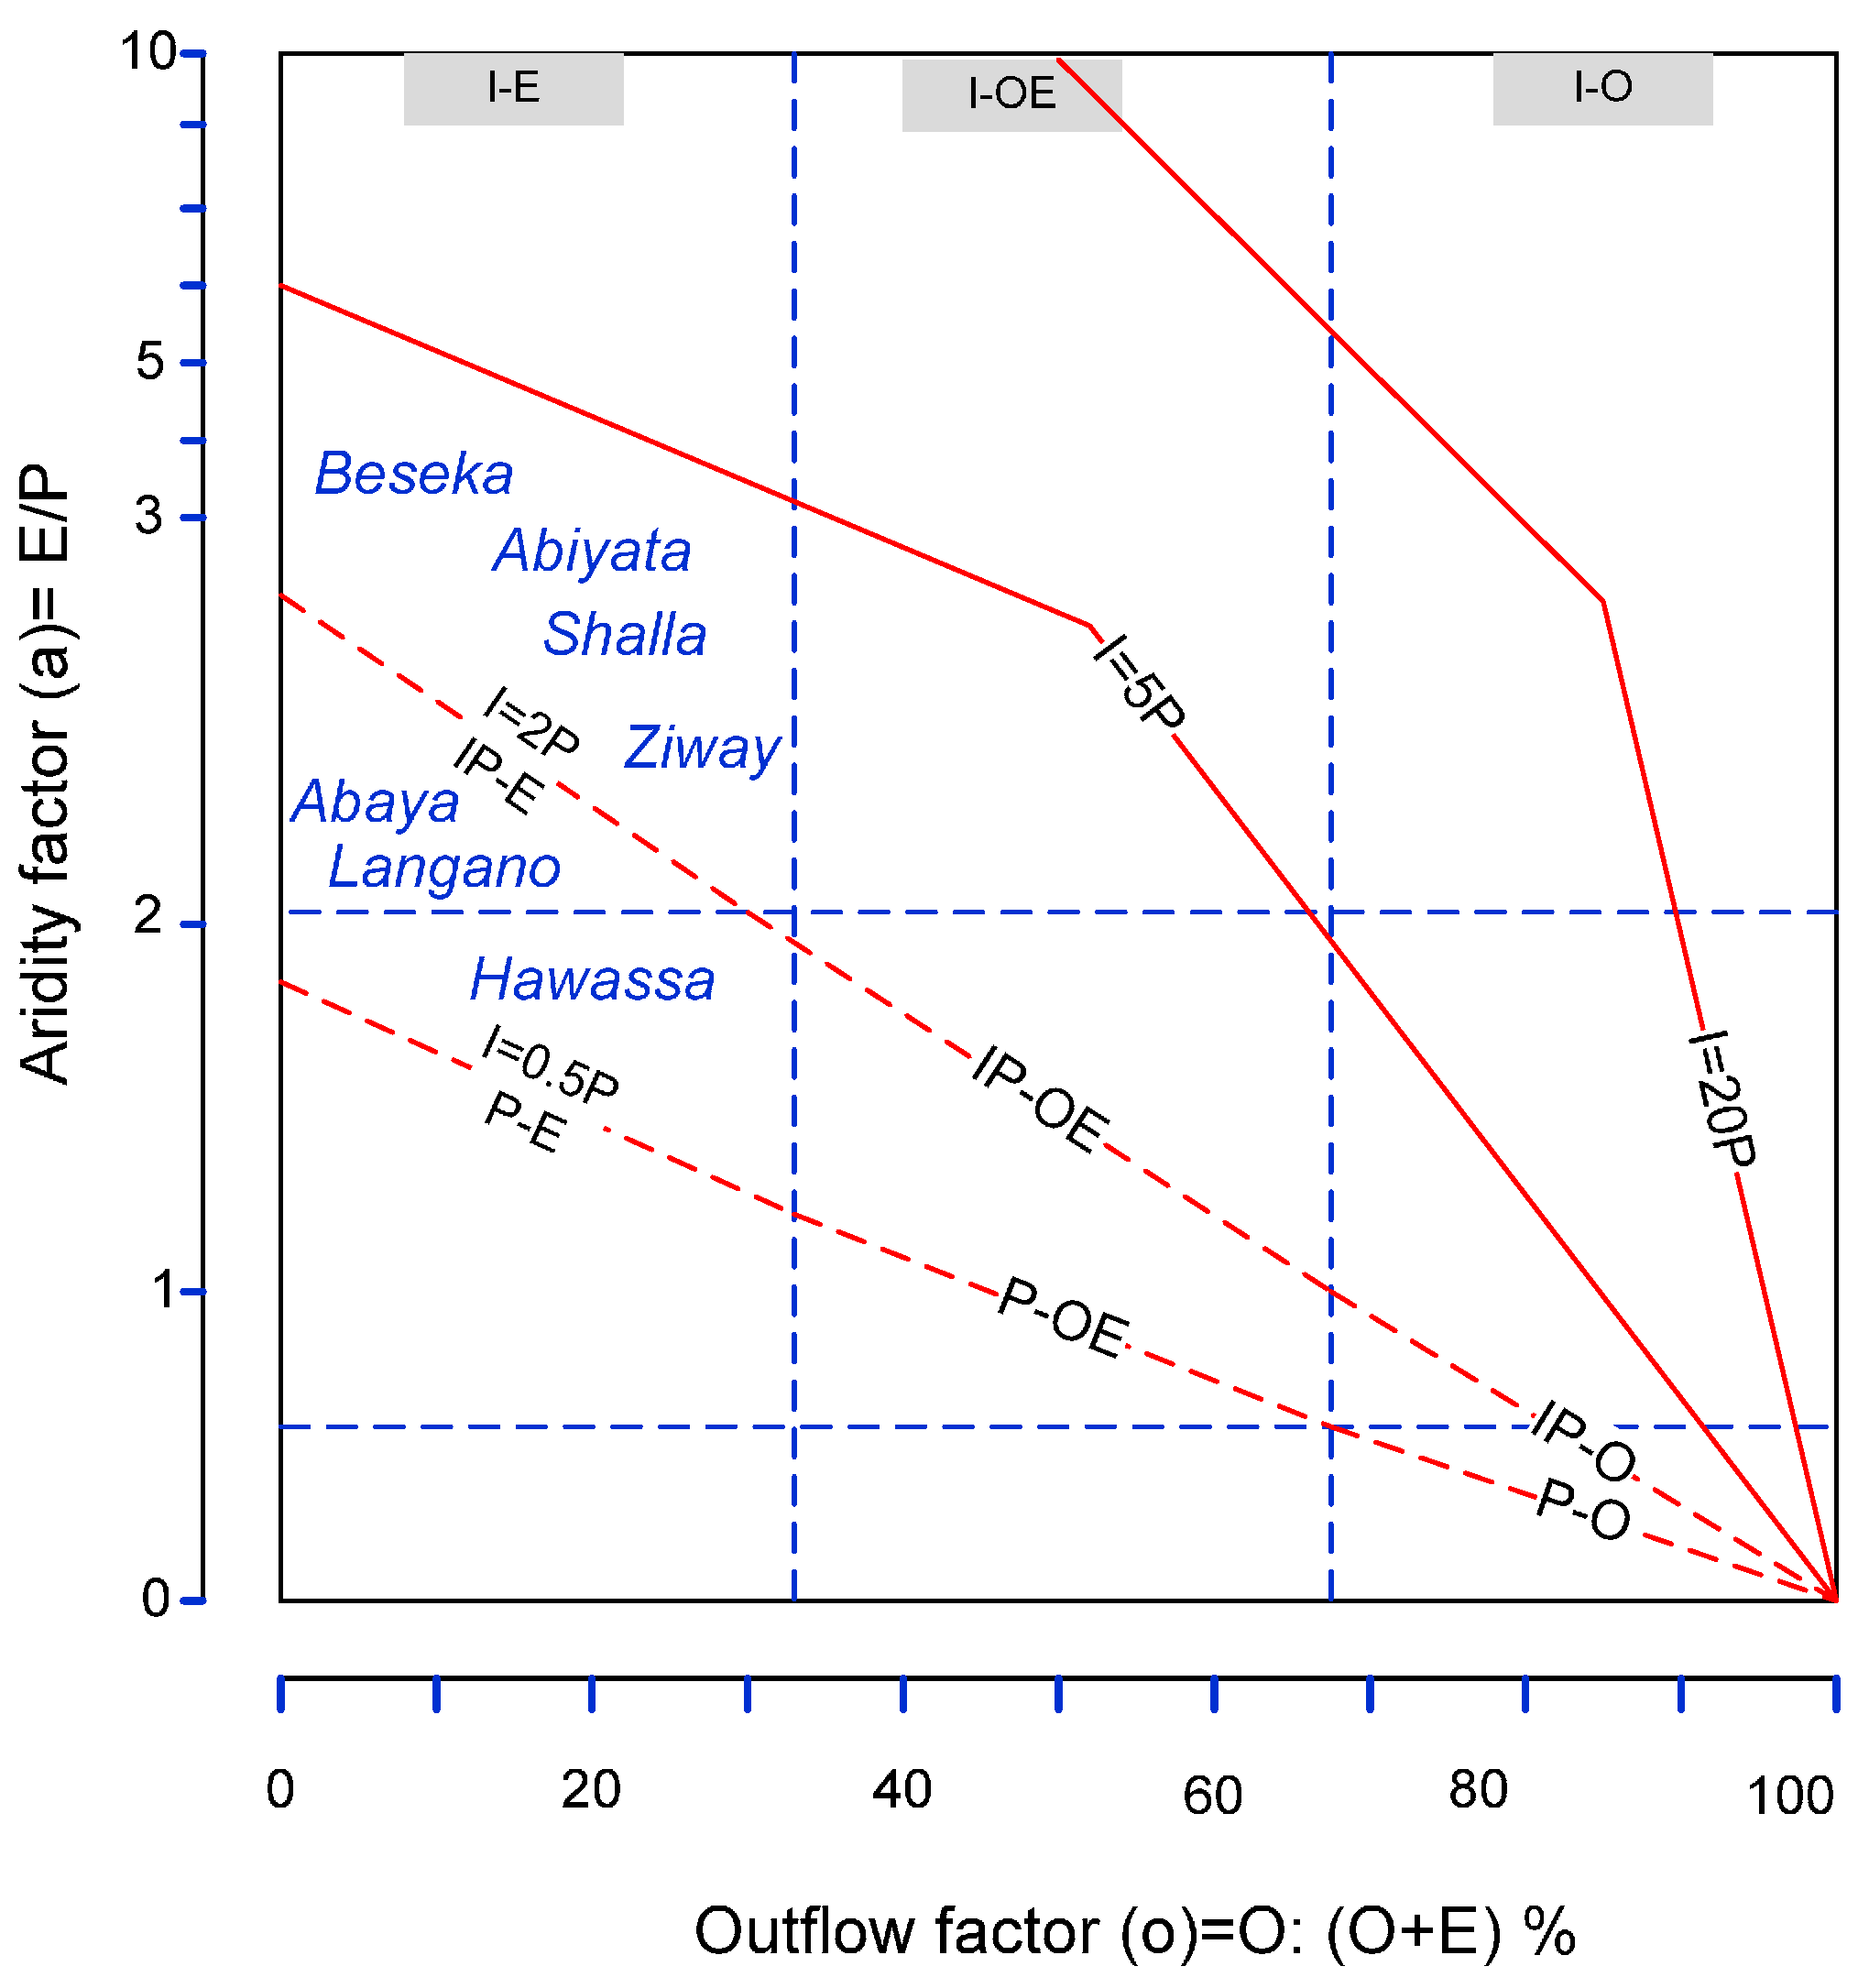
2.3.2. Morphological Approach to Characterize the Lake Level Regimes

This approach is based on the suggestion by Litinskaya [33] and is often used in analyzing lake–catchment relationships (e.g., Muvundja et al. [38]). In this approach, it is recommended to use the term specific watershed (∆F), which is computed as:
Specific watershed (∆F) = lake basin area/lake surface area
According to the approach, the lakes would be classified into three groups based on the magnitude of specific watershed that is considered as a proxy to characterize the level-regime of the lakes. Those lakes having specific watersheds less than 10 are assumed to have stable lake level regime with mean annual amplitude of fluctuation ranging from 30 to 65 cm. The other category includes those lakes having specific watersheds ranging from 10 to 50 cm. These lakes are expected to be less stable in terms of increased annual fluctuation (mean annual amplitude of water-level fluctuations rises 50 to 130 cm). The third category of lakes comprises those lakes with specific watershed exceeding 50 cm. The mean annual amplitude of lake level variability in this case increases to 110 to 210 cm.

2.3.3. Detection of Regime Shift (Pettit’s Homogeneity Test)

Among different methods to detect change points of time series (Buishand [39]; Chen and Gupta [40]; Radziejewski et al. [41]), Pettit’s test is widely applied in hydrology (Mu et al. [42]; Gao et al. [43]) and the detection of shifts in the means is the common (Rodionov [44,45]). Pettit [34] developed a non-parametric test that is capable of locating the period (month or year) where a break in time series occurred. The null hypothesis is that the data do not show a break in their values, and the alternative hypothesis is that a stepwise shift in the mean is present. The advantages of Pettit's test over other homogeneity tests are: it is more sensitive to breaks in the middle of a time series (Wijngaard et al. [46]); capable to detect the year where break occurs (Kang and Yosuf [47]) and does not assume normality of the data. Under the null hypothesis, the annual values Yi of the testing variables Y are independent and identically distributed and the time series are considered as homogeneous while under the alternative hypothesis, the test assumes the series consisted of breaks in the mean value and considered the time series as inhomogeneous.
As stated in Salarijazi et al. [48] and Kahya and Kalayci [49], Pettit’s test considers a sequence of random variables X1, X2,., XT, which have a change point at time T . As a result, (X1, X2,..., XT) have a common distribution function F1 (.), but (XT+1, XT+2,..., XT) are identically distributed as F2 (.), where F1 (.) ≠ F2 (.). The null hypothesis H0: no change (or T = T); is tested against the alternative hypothesis H1: change (or 1 ≤ T < T); using the non-parametric statistic KT = max|Ut,T| = max (KT+ ,KT−) where:
U t , T   =   i   =   1 t j   =   i + 1 T sgn   ( X t X j )
s g n ( θ ) = { + 1   i f   θ >   0 0   i f   θ   =   0 1   i f   θ <   0 }
KT+ = max Ut,T for downward shift and KT− = −min Ut,T for upward shift. The confidence level associated with KT+ or KT− is determined approximately by:
ρ = e x p ( 6 K T 2 T 3 + T 2 )
When ρ is smaller than the specific confidence level, for example, 0.95 in this study, the null hypothesis is rejected. The approximate significance probability for a change-point is defined as:
P = 1 − ρ

2.3.4. Trend Analysis

Statistical trend analysis is a hypothesis testing process. The null hypothesis (HO) is that there is no trend; each test has its own parameter for accepting or rejecting HO. Failure to reject HO does not prove that there is not a trend, but indicates that the evidence is not sufficient to conclude with a specified level of confidence that a trend exists (NNSMP [50]). Trend analysis enables to detect significant variations over time; it is easily understood and communicated, and readily accepted due to its widespread use (TSOA [51]). The Mann–Kendall (MK) statistical trend test (Mann [35]; Kendall [36]) was employed to investigate trends in time series data. It is a kind of non-parametric test and compares the relative magnitudes of sample data rather than the data values themselves. This test allows us to investigate long-term trends of data without assuming any particular distribution. In this study, the trends were evaluated at the 5% level of significance against the null hypothesis that states there is no trend in the analyzed variable. The null hypothesis states that the data (x1,…,xn) is a sample of n independent and identically distributed random variables. And the alternative hypothesis of a two-sided test is that the distributions of xk and xj are not identical for all k, j ≤ n with k ≠ j. The test statistic S, which has mean zero and a variance computed by Equation (11), is calculated using Equations (9) and 10, and is asymptotically normal:
S   =   k   =   1 n 1 j   =   k + 1 n sgn   ( x j x k )
s g n ( x j x k ) = { + 1   i f   ( x j x k )   >   0 0   i f   ( x j x k )   =   0 1   i f   ( x j x k ) <   0 }
V a r ( S )   =   [ n ( n 1 ) ( 2 n + 5 ) i   =   1 m t i ( t i 1 ) ( 2 t i + 5 ) ] 18
where n is the number of data points, m is the number of tied groups (a tied group is a set of sample data having the same value), and ti is the number of data points in the ith group. In cases where the sample size n > 10, the standard normal variable Z is computed by using Equation (12).
Z   =   { S 1 Var ( S ) i f   S   >   0 0   i f   S   =   0 S + 1 Var ( S ) i f   S   <   0 }
Positive values of Z indicate increasing trends, while negative values of Z show decreasing trends. When testing either increasing or decreasing monotonic trends at α significance level, the null hypothesis was rejected for an absolute value of Z greater than Z1−α/2, obtained from the standard normal cumulative distribution tables (Partal and Kahya [52]).

3. Results and Discussion

3.1. Classification of the Lakes Based on Long-Term Water Balance

Table 3 presents the computational results of inflow factor, outflow factor and aridity using Equations (1)–(3). The grouping of these lakes into their respective quadrants based on their calculated particularities is also presented in Table 3 as well as Figure 2 and Figure 3.
Table 3. Results of inflow, outflow, aridity, and the corresponding quadrants.
Inflow Factor (i)Outflow Factor (o)Aridity (a)Without Aridity FactorWith Aridity Factor
1Lake Ziway69.022.62.5I-E *IP-E *
2Lake Langano65.112.32.5IP-E *IP-E *
3Lake Abiyata68.63.73.1I-E *I-E *
4Lake Shalla56.60.03.4IP-E *I-E *
5Lake Hawassa53.323.2 **1.5IP-E *IP-E *
6Lake Abaya59.50.02.6IP-E *IP-E *
7Lake ChamoIncompleteincomplete2.2
8Lake Beseka79.00.04.5I-E *I-E *
* Interpretation: Climate controlled (with little role of inflow); ** The value represents the ground water outflow.
The water balance approach to characterized hydrology of the lakes shows that most of the lakes have similar characteristics in terms of their sensitivity to climate variability. This similarity is depicted in both cases of “with” and “without” the use of aridity factors as classification criteria. All of the lakes are under I-E or IP-E quadrant, and these two quadrants are known for their dominance in climate (with some exceptions) during extreme dry and wet periods in which runoff from the watershed increases the imbalance.

3.2. Classification of the Lakes Based on Morphology

Based on Equation (4), the ratio of watershed area with lake surface area was computed and results are presented in Table 4.
The result shows that lakes of mean stable level regime are dominant in the basin (Ziway, Shalla, Hawassa, Abaya and Beseka) and the rest are in the range of stable level regime (Langano, Abiyata, and Chamo) indicating the potential of the lakes to naturally regulate the surface runoff flowing into them from their watershed. This technique appears to underestimate the role of climate on Lake Hawassa as compared to the report of Tesfaye [53] in which Lake Hawassa is found to be sensitive to slight climatic variability.
Table 4. Results of characterization based on specific watershed.
Surface Area (km)Watershed Area (km)Specific Watershed [–]About Level-RegimeExpected Mean Annual Amplitude (cm) **
1Lake Ziway442702516Moderately stable50–130
2Lake Langano24116006.6stable30–65
3Lake Abiyata17616309.3stable30–65
4Lake Shalla329392012Moderately stable50–130
5Lake Hawassa90125014Moderately stable50–130
6Lake Abaya116217,30015Moderately stable50–130
7Lake Chamo55122104stable30–65
8Lake Beseka4350511.7Moderately stable50–130
** The expected amplitudes are as suggested by Litinskaya [33].

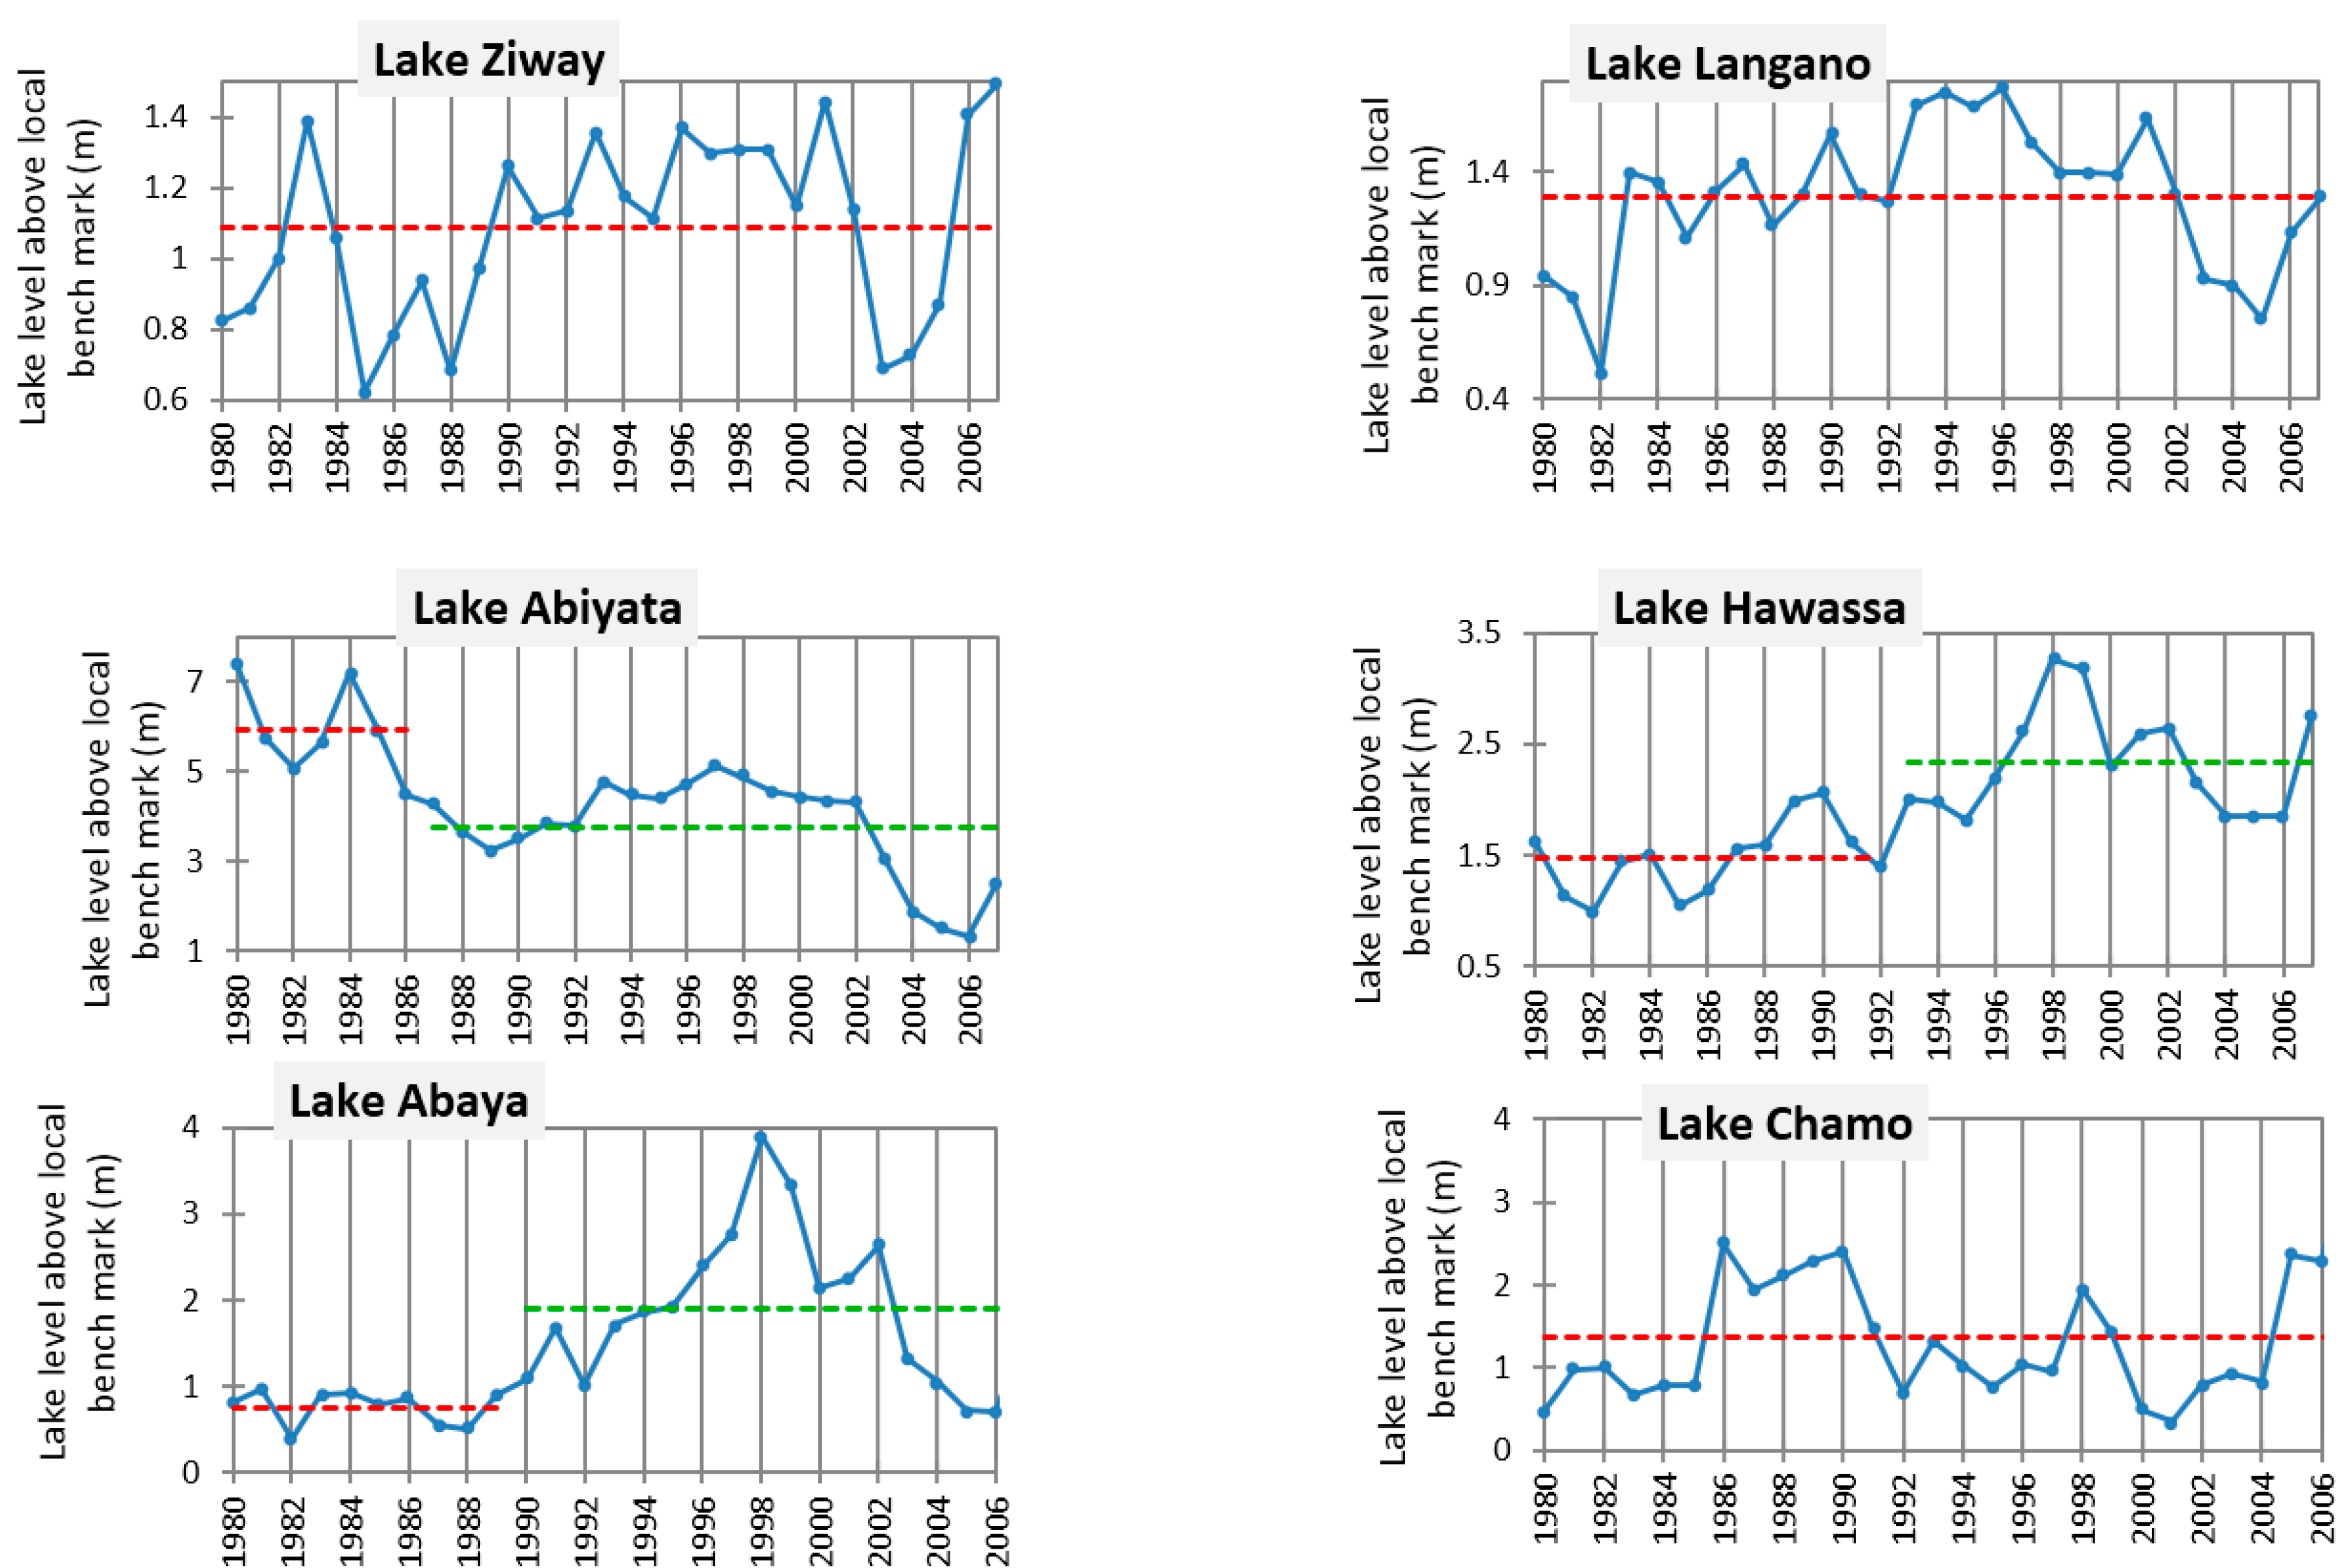
3.3. Results of Homogeneity and Trend Tests

Figure 4 shows the long-term water level records of individual lakes. Each lake has experienced particular rise and/or drop in water levels that cannot be explained by monotonic trends (defined as the slow move up or down from the mean value and keep on moving in the same direction over time). Table 5 also shows the monotonic trend of each lake under study based on raw data from the literature (for the first six lakes).
Figure 4. Long-term lake level plots of the six Ethiopian Rift Valley lakes. (N.B: (a) Analysis of regime shifts were done for the first six lakes using Pettit [34] homogeneity test. The red lines represent mean lake level before the regime shift(µ1) and the green line after the regime shift (µ2). (b) Lake Shalla and Beseka are not included in this result due to availability of time series data during the study).
Hydrology 03 00001 g004
Table 5. Monotonic trends of level of individual lakes. Lake Shalla and Lake Beseka were not analyzed due to limited data availability.
MK τ**Interpretation
1Lake Ziway0.324Increasing
2Lake Langano0.037No trend
3Lake Abiyata−0.492Decreasing
4Lake Shalla--
5Lake Hawassa0.531Increasing
6Lake Abaya0.363increasing
7Lake Chamo0.106No trend
8Lake Beseka-Increasing
N.B: (a) In this study, the Mann–Kendall (MK) statistical trend test (Mann [35]; Kendall [36]) was employed to investigate trends in time series data. ** MKτ is the Mann–Kendall coefficient. (b) Lake Shalla and Beseka are not included in this result due to availability of time series data during the study. However, Lake Beseka has been shown to exhibit increasing trend by Goerner et al. [22].
In terms of monotonic trend (Table 5), Lake Ziway, Hawassa, Abaya and Beseka experienced significant increasing trend, while Ziway, Langano and Chamo did not. Homogeneity test (Figure 4) revealed that Lake Abiyata experienced significant downward regime shift, which is likely attributed to the extended abstraction of water for industrial consumption. Lake Hawassa and Abaya showed significant upward shift, which is likely caused by climate anomalies such as ENSO phenomena. Strong ENSO have been observed in the years 1972, 1982, 1991, and 1997. All of the six lakes tend to drop in water level after 1997/1998 which possibly indicate the teleconnection between local hydrology with the worst El Niño event of the twentieth century (Tereshchenko et al. [53]; Strub and James [54]).

3.3.1. Lake Ziway

The lowest level of Ziway was recorded in June 1975 (0.13 m) and the maximum in September and October 1983 (2.17 m). However, for the last three years of the late 1970s and early 1980s, the level was slightly lower due to the dry years of the 1970s. The lake shows a slight reduction after the late 1980s due to the abstraction of water for irrigation (Legesse and Ayenew [55]; Vilalta [56]). The existence of land degradation in the watershed that induced large scale sedimentation rate was reported by Legesse and Ayenew [55] and Billi and Dramis [57].

3.3.2. Lake Langano

Lake Langano experienced only small seasonal water level variations of about 1 m, and lower inter-annual water level variations compared to other lakes in the basin (Vilalta [56]; Ayenew [58]). The absence of considerable water abstraction and large groundwater flow from springs are considered to be the factors against its relative stability of lake level variability. Lake-bed sedimentation is also estimated to the magnitude of about 0.5 to 0.6 cm/y, with 85%–95% water content (Legesse and Ayenew [55]).

3.3.3. Lake Abiyata

Lake Abiyata is a saline-alkaline type (Wood and Talling [14]) and inters of lake level variability, it has experienced a drop of about five meters over the last three decades (Alemayehu et al. [13]) and also found to be heavily impacted by human activities (Alemayehu et al. [13]; Vilalta [56]). Its size, for instance, was decreased by 25% over the last thirty years because the lake water is under pressure due to the production of Soda Ash using solar evaporation of brines from the lake and the maximum drop coincides with the time of large scale water abstraction (Legesse and Ayenew [55]). However, the inter-annual fluctuations are controlled by climate variability. According to Legesse et al. [59], this lake also reacts more rapidly to an abrupt shift to wetter conditions than to dry conditions. The production of Soda Ash has not taken place for the last three years of the reporting time because of the significant decline in the water level (MoWR [12]). The fluctuation of Abiyata follows the same trend as Lake Ziway, with an average time lag of about 20 days. Any abstraction of water in the Ziway watershed results in a greater reduction in the level of Abiyata than in Ziway (Legesse and Ayenew [55]).

3.3.4. Lake Hawassa

The monthly and annual Hawassa lake level and Tikur-Wuha stream flow showed an increasing overall trend (Wagesho et al. [60]). The lake has been experiencing a progressive rise in water level during the past two decades (1981–1998) (Gebreegziabher [10]; WWDSE [20]). The concern of this rise achieved its peak in the aftermath of the extreme flooding of the surrounding area as a result of extreme rise in 1998/1999. The possible causes of the water-level rise of the lake is associated to climate changes (Lamb et al. [61]; Ayenew [62]; Deganovsky and Getahun [21]; Gebreegziabher [10]; WWDSE [20]; MoWR [12]; and Bewketu [11]); the upset of hydrological variables (Lamb et al. [61]; Gebreegziabher [10]; Ayenew [7]; MoWR [12]; and Bewketu [11]); sedimentation process (Esayas [63]; and Gebreegziabher [10]) and geological tectonic processes that affect the ground water flow towards the lake (Ayenew and Gebreegziabher [26] and WWDSE [20]).

3.3.5. Lake Abaya

Lake Abaya experienced the rise of about 3.35 m between 1987 to 1998 (12 years) followed by continuous drop of 3.12 m in the years 1998–2006 and then rose by 0.91 m between 2006 and 2007. While discussing these variations, Belete [31] stated these fluctuations are mainly caused by precipitation as input and evaporation as output and limited role of deforestation and agricultural expansion in the watershed. Even though the role is limited, the watershed experienced an expansion of agricultural lands by close to 200% in the year 2000, while bush land increased by 17% during the same period, which can be explained by continuous deforestation for agriculture and charcoal production for commercial and community use. Table 6 below shows the land use/cover changes in the watershed.
Table 6. Land use/cover changes in Lake Abaya watershed.
Land Use/Land CoverIn the Year 1986 (ha)In the Year 2000 (ha)Change in Percent
Bushland50,459.859,442.417.8
Wetland31,512.720,790.8−34
Forest180,832143,195−20.8
Agriculture24,506.772,254.3194.84
Water137,734137,320−0.3
Grassland17,150.29192.48−46.4
(Source: Belete [31]).

3.3.6. Lake Chamo

This lake rose in the years 1989, 2006 and 2007 only. Although heavy rainfall and runoff in 1997/1998 caused an increase in water level in many other Rift Valley lakes, this was not observed for Lake Chamo (Awulachew [64]).

3.3.7. Lake Shalla

Regarding Lake Shalla, the available literature is very limited. This might be due to the little interest in the lake water because of its alkaline nature (Vilalta [56]), which discourages its use for irrigation purpose.

3.3.8. Lake Beseka

Despite small inter-annual variations, the water level of Lake Beseka has been rising for more than three decades which is evidenced by the quadrupled expansion of its surface area from 11.1 km to 39.5 km between 1973 and 2002 with the corresponding rise in lake level (Goerner et al. 2009 [22]). The main cause for this expansion in surface area and rise in lake level is the increased ground water flow from the western part of the watershed. The discharges to the lake in the form of hot springs constitute the major water inflow to the lake ( Goerner et al. [22]; Belay [9]; Williams et al. [65]; Ayenew [7]). It is estimated to be 51% of the total inflow to the lake (Belay [9]). Some investigators relate the phenomena to neotectonism (Ayenew [17]; Tessema [18]). The average annual increment of the lake was 0.2 m and the level of the lake has risen by four meters between 1976 and 1997 (Goerner et al. [22]). Due to the expansion and flooding, the loss of 57 human lives, inundation of about 35 km of grazing land, and displacement of 910 people was reported. The Methara sugar plantation has also been inundated and the company lost income from 161.55 ha of land (WWDSE [66]). Damages on the nearby railway line and highway caused a loss amounting to 2.6 million US$ (Tessema [18]; Ayenew [7]).

4. Conclusions

The combined results of the diverse approaches that are employed in this study revealed that most the Ethiopian Rift Valley lakes experienced unstable water level fluctuations due to climate variability. Although the lakes are in the same climate zone, they do not show similar hydrological behavior in all cases. This is on one hand caused by neo-tectonic activities (e.g., Lake Beseka) or by excessive water abstraction (Lake Abiyata), which may mask other processes.
Nevertheless, although each lake in the Rift Valley was separately assessed similarity among singles lakes, for instance, Lake Abaya and Lake Hawassa are evident. These lakes experienced lake level peaks in the year of 1998/1999 and both of the peaks were likely caused by short term climatic variability. The analyses and syntheses of this study showed that long-term monotonic changes provide limited information in explaining the dynamics of lake levels.
For long-term trends in water level rise of the closed lakes, one has to differentiate among climate variability, climate change as well as land use change effects. While the first aspects have been analyzed in this study, land use change impacts, on the one hand, total discharge, which usually increases in discharge with increasing agricultural use, and on the other hand, soil erosion and therefore storage capacity of the lakes. In terms of research gap, it was found that there existed nearly no attempt to estimate the impact of sedimentation on the storage capacity of the lakes. The explicit attempt to study the relationship between lake level dynamics and climate anomalies impacting hydrological and erosion processes is also absent and deserve future investigation. Lake management requires a thorough understanding of the causes of lake level dynamics to be prepared for extreme events but also for managing long-term water abstraction. This study contributes to the understanding of the causes of lake level variation and provides a base for further studies.

Acknowledgments

The authors thanks the DAAD and Ethiopian government, who supported this study under the “engineering capacity building program-ecbp” project with a three-year scholarship provided to the first author.

Author Contributions

Individual contributions of the authors are comparable.

Conflict of Interest

The authors declare no conflict of interest.

References

  1. Vuglinskiy, V. Water Level in Lakes and Reservoirs, Water Storage. Global Terrestrial Observing System: Rome, 2009; Available online: http://www.fao.org/gtos/doc/ECVs/T04/T04.pdf (accessed on 21 December 2015).
  2. Zohary, T.; Ostrovsky, I. Ecological impacts of excessive water level fluctuations in stratified freshwater lakes. Inland Waters 2011, 1, 47–59. [Google Scholar] [CrossRef]
  3. Scheffer, M.; Carpenter, S.R. Catastrophic regime shifts in ecosystems: Linking theory to observation. Trends Ecol. Evol. 2003, 18, 648–656. [Google Scholar] [CrossRef]
  4. Kinshiro, N. Hydrological Regime on the Regulation of Lake-Level. A Contribution to the Paleolimnological Study of Lake Biwa. Available online: https://www.jstage.jst.go.jp/article/pjab1945/50/9/50_9_665/_pdf (accessed on 21 December 2015).
  5. Hayashi, M.; van der Kamp, G. Water Level Changes in Ponds and Lakes: The Hydrological Processes. Available online: http://people.ucalgary.ca/~hayashi/um_may2007/Ch10_final.pdf (accessed on 21 December 2015).
  6. Gasith, A.; Gafny, S. Effects of water level fluctuation on the structure and function of the littoral zone. In Large Lakes: Ecological Structure and Function; Tilzer, M.M., Serruya, C., Eds.; Springer: Berlin, Germany, 1990; pp. 156–171. [Google Scholar]
  7. Ayenew, T. Environmental implications of changes in the levels of lakes in the Ethiopian Rift since 1970. Regional Environ. Chang. 2004, 4, 192–204. [Google Scholar] [CrossRef]
  8. Ayenew, T. Water management problems in the Ethiopian rift: Challenges for development. J. Afr. Earth Sci. 2007, 48, 222–236. [Google Scholar] [CrossRef]
  9. Belay, E.A. Growing Lake with Growing Problems: Integrated Hydrogeological Investigation on Lake Beseka, Ethiopia. Ph.D. Thesis, Rheinischen Friedrich-Wilhelms-Universität Bonn, Bonn, Germany, 2009. Available online: http://hss.ulb.uni-bonn.de/2009/1645/1645.pdf (accessed on 21 December 2015). [Google Scholar]
  10. Gebreegziabher, Y. Assessment of the Water Balance of Lake Awassa Catchment, Ethiopia. Master’s Thesis, International Institute for Geo-information Science and Earth Observation, Enschede, The Netherlands, 2004. [Google Scholar]
  11. Bewketu, K. Hydrodynamics of Selected Ethiopian Rift Lakes. Master’s Thesis, Addis Ababa University, Addis Ababa, Ethiopia, 2010. [Google Scholar]
  12. MoWR. The Federal Democratic Republic of Ethiopia-Ministry of Water Resources: Rift Valley Lakes Basin Integrated Resources Development Master Plan Study Project. Phase 3 Report: Lake Hawassa Sub-basin Integrated Watershed Management Feasibility Study. Part 1 and 2; Halcrow Group Limited and Generation Integrated Rural Development (GIRD) Consultants: Addis Ababa, Ethiopia, 2010. [Google Scholar]
  13. Alemayehu, T.; Ayenew, T.; Kebede, S. Hydrogeochemical and lake level changes in the Ethiopian Rift. J. Hydrol. 2006, 316, 290–300. [Google Scholar] [CrossRef]
  14. Wood, R.B.; Talling, J.F. Chemical and algal relationship in a salinity series of Ethiopian inland waters. Hydrobiologia 1988, 158, 29–67. [Google Scholar] [CrossRef]
  15. Kebede, E.; Zinabu, G.M.; Ahlgren, I. The Ethiopian rift-valley lakes: Chemical characters along a salinity-alkalinity gradient. Hydrobiologia 1994, 288, 1–12. [Google Scholar] [CrossRef]
  16. Chernet, T. Hydrogeology of the Lakes Region, Ethiopia; Ministry of Mines and Energy: Addis Ababa, Ethiopia, 1982; p. 97. [Google Scholar]
  17. Ayenew, T. The Hydrogeological System of the Lake District Basin: Central Main Ethiopian Rift. Ph.D. Thesis, Free University of Amsterdam, Amsterdam, The Netherlands, 1998; p. 259. [Google Scholar]
  18. Tessema, Z. Hydrochemical and water balance approach in the study of high water level rise of Lake Beseka. Master’s Thesis, University of Birmingham, Birmingham, UK, 1998; p. 90. [Google Scholar]
  19. MoWR. Master Plan for the Development of Surface Water Resources in Ten Awash Basin; Ministry of Water Resources: Addis Ababa, Ethiopia, 1989; Volume 6. [Google Scholar]
  20. Water Works Design and Supervision Enterprise (WWDSE). The study of Lake Awassa Level Rise. Southern Nations Nationalities and Peoples Regional State; Water, Mines and Energy Resources Development Bureau: Addis Ababa, Ethiopia, 2001. [Google Scholar]
  21. Deganovsky, A.M.; Getahun, A. Water balance and level regime of Ethiopian lakes as integral indicators of climate change. In Proceedings of the 12th World Lake Conference (Taal 2007), Jaipur, India, 29 October–2 November 2007.
  22. Goerner, A.; Jolie, E.; Gloaguen, R. Non-climatic growth of the saline Lake Beseka. Main Ethiopian Rift. J. Arid Environ. 2009, 73, 287–295. [Google Scholar] [CrossRef]
  23. Dinka, M.O. Analysing the extent (size and shape) of Lake Basaka expansion (Main Ethiopian Rift Valley) using remote sensing and GIS. Lakes Reserv. Res. Manag. 2012, 17, 131–141. [Google Scholar] [CrossRef] [Green Version]
  24. Vallet-Coulomb, C.; Legesse, D.; Gasse, G.; Travi, Y.; Chernet, T. Lake evaporation estimates in tropical Africa (Lake Ziway, Ethiopia). J. Hydrol. 2001, 245, 1–18. [Google Scholar] [CrossRef]
  25. Ayalew, E. Application of Stable Isotopes in the Study of Lake Dynamics in Ziway-Shalla Basin. Master’s Thesis, Addis Ababa University, Addis Ababa, Ethiopia, 2003. [Google Scholar]
  26. Ayenew, T.; Gebreegziabher, Y. Application of a spreadsheet hydrological model for computing the long-term water balance of Lake Awassa, Ethiopia. Hydrol. Sci. J. 2006, 51, 418–431. [Google Scholar] [CrossRef]
  27. Gebremichael, H. Modeling and Forecasting Hawassa Lake Level Fluctuation. Master’s Thesis, Addis Ababa University, Addis Ababa, Ethiopia, 2007. [Google Scholar]
  28. Shewangizaw, D. Assessing the effect of land use changes on the hydraulic regime of Lake Hawassa. Master’s Thesis, Addis Ababa University, Addis Ababa, Ethiopia, 2010. [Google Scholar]
  29. Water Resources Development Bureau (WRDB). Study of Pollution of Lakes and Rivers; AG Consulting Hydrogeologists and Engineers Plc: Addis Ababa, Ethiopia, 2007. [Google Scholar]
  30. Ayenew, T.; Tilahun, N. Assessment of lake-groundwater interactions and anthropogenic stresses, using numerical groundwater flow model for a Rift lake catchment in central Ethiopia. Lakes Reservoirs Res. Manag. 2008, 13, 325–343. [Google Scholar] [CrossRef]
  31. Belete, A. Climate Change Impact on Lake Abaya Water Level. Master’s Thesis, Addis Ababa University, Addis Ababa, Ethiopia, 2009. [Google Scholar]
  32. Szesztay, K. Water balance and water level fluctuation of lakes. Hydrol. Sci. Bull. 1974, 19, 73–84. [Google Scholar] [CrossRef]
  33. Litinskaya, K.D. Long-Term Water Stage Regime in Natural Lakes of Karelia and Its Changes in View of Conversion of Lakes into Storage Reservoirs. Available online: http://hydrologie.org/redbooks/a109/iahs_109_0486.pdf (accessed on 21 December 2015).
  34. Pettitt, A.N. A non-parametric approach to change point problem. Appl. Stat. 1979, 28, 126–135. [Google Scholar] [CrossRef]
  35. Mann, H.B. Non-parametric tests against trend. Econometrica 1945, 13, 245–259. [Google Scholar] [CrossRef]
  36. Kendall, M.G. Rank Correlation Measures; Charles Griffin: London, UK, 1975. [Google Scholar]
  37. Lukács, B.A.; Tóthmérészb, B.; Boricsa, G.; Várbíróa, G.; Juhászc, P.; Kissc, B.; Müller, Z.; G-Tóth, L.; Eros, T. Macrophyte diversity of lakes in the Pannon Ecoregion (Hungary). Limnologica 2015, 53, 74–83. [Google Scholar] [CrossRef]
  38. Muvundja, F.A.; Wüest, A.; Isumbisho, M.; Kaningini, M.B.; Pasche, N.; Rinta, P.; Schmid, M. Modelling Lake Kivu water level variations over the last seven decades. Limnologica 2014, 47, 21–33. [Google Scholar] [CrossRef]
  39. Buishand, T.A. Some methods for testing the homogeneity of rainfall records. J. Hydrol. 1982, 58, 11–27. [Google Scholar] [CrossRef]
  40. Chen, J.; Gupta, A.K. Parametric Statistical Change Point Analysis; Birkhauser: Boston, MA, USA, 2000. [Google Scholar]
  41. Radziejewski, M.; Bardossy, A.; Kundzewicz, Z.W. Detection of change in river flow using phase randomization. Hydrol. Sci. J. 2000, 45, 547–558. [Google Scholar] [CrossRef]
  42. Mu, X.; Zhang, L.; McVicar, T.R.; Chille, B.; Gau, P. Analysis of the impact of conservation measures on stream flow regime in catchments of the Loess Plateau, China. Hydrol. Process 2007, 21, 2124–2134. [Google Scholar] [CrossRef]
  43. Gao, P.; Mu, X.-M.; Wang, F.; Li, R. Changes in streamflow and sediment discharge and the response to human activities in the middle reaches of the Yellow River. Hydrol. Earth Syst. Sci. 2011, 15, 1–10. [Google Scholar] [CrossRef] [Green Version]
  44. Rodionov, S.N. A sequential algorithm for testing climate regime shifts. Geophys. Res. Lett. 2004. [Google Scholar] [CrossRef]
  45. Rodionov, S.N. A Brief Overview of the Regime Shift Detection Methods. Available online: http://www.beringclimate.noaa.gov/regimes/rodionov_overview.pdf (accessed on 21 December 2015).
  46. Wijngaard, J.; Klein, T.; Können, G.P. Homogeneity of 20th century European daily temperature and precipitation series. Int. J. Climatol. 2003, 23, 679–692. [Google Scholar] [CrossRef]
  47. Kang, H.M.; Yusof, F. Homogeneity Tests on Daily Rainfall Series in Peninsular Malaysia. Int. J. Contemp. Math. Sci. 2012, 7, 9–22. [Google Scholar]
  48. Salarijazi, M.; Ahmadianfar, I.; Ameriun, M.S.; Salari, A.; Najafpour, K. Non parametric spatial and temporal analysis of temperature characteristics in Karoun & Dez watershed. In Proceedings of the 4th National Conference on Water Resources, Tehran, Iran, 3–4 May 2011. (In Persian)
  49. Kahya, E.; Kalayci, S. Trend analysis of stream flow in Turkey. J. Hydrol. 2004, 289, 128–144. [Google Scholar] [CrossRef]
  50. NNSMP-National Non-Point Source Monitoring Program. Statistical Analysis for Monotonic Trends. Technical Note 6, 2011. Available online: http://www.bae.ncsu.edu/programs/extension/wqg/319monitoring/TechNotes/technote6_trend_analysis.pdf (accessed on 21 December 2015).
  51. Texas State Auditor’s Office (TSOA). Data Analysis: Analyzing Data—Trend Analysis-2.Methodology Manual, Rev. 5/95, 1995. Available online: http://www.sputtr.com/trend+analysis (accessed on 21 December 2015).
  52. Partal, T.; Kahya, E. Trend analysis in Turkish precipitation data. Hydrol. Process 2006, 20, 2011–2026. [Google Scholar]
  53. Tereshchenko, I.; Filonov, A.; Gallegos, A.; Monzón, C.; Rodríguez, R. El Niño 1997–98 and the hydrometeorological variability of Chapala, a shallow tropical lake in Mexico. J. Hydrol. 2002, 264, 133–146. [Google Scholar] [CrossRef]
  54. Strub, P.T.; James, C. Altimeter-Derived Surface Circulation in the Large-Scale NE Pacific Gyres. Part 2. 1997–1998 anomalies. Progress Oceanogr. 2002, 53, 185–214. [Google Scholar] [CrossRef]
  55. Legesse, D.; Ayenew, T. Effect of improper water and land resource utilization on the central Main Ethiopian Rift lakes. Quat. Int. 2006, 148, 8–18. [Google Scholar] [CrossRef]
  56. Vilalta, E.R. Water resources management in the central Rift Valley of Ethiopia. Master’s Thesis, Civil Engineering, Barcelona, Spain, 2010. [Google Scholar]
  57. Billi, P.; Dramis, F. Geomorphological Investigation on Gully Erosion in the Rift Valley and Northern Highlands of Ethiopia. Catena 2003, 50, 353–368. [Google Scholar] [CrossRef]
  58. Ayenew, T. Numerical groundwater flow modeling of the Central Main Ethiopian Rift lakes basin. SINET Ethiop. J. Sci. 2001, 24, 167–184. [Google Scholar] [CrossRef]
  59. Legesse, D.; Vallet-Coulomb, C.; Gasse, F. Analysis of the hydrological response of a tropical terminal lake, Lake Abiyata (Main Ethiopian Rift Valley) to changes in climate and human activities. Hydrol. Process. 2004, 18, 487–504. [Google Scholar] [CrossRef]
  60. Wagesho, N.; Goel, N.K.; Jain, M.K. Investigation of non-stationarity in hydro-climatic variables at Rift Valley lakes basin of Ethiopia. J. Hydrol. 2012, 444–445, 113–133. [Google Scholar] [CrossRef]
  61. Lamb, A.L.; Leng, M.J.; Lamb, H.F.; Telford, R.J.; Mohammed, M.U. Climatic and non-climatic effects on the δ O and δ C compositions of Lake Awassa, Ethiopia, during the last 6.5 ka. Quat. Sci. Rev. 2002, 21, 2199–2211. [Google Scholar] [CrossRef]
  62. Ayenew, T. Vulnerability of Selected Ethiopian Lakes to Climatic Variability, Tectonism and Water Use: Global Change System for Analysis, Research and Training (START), 2006. Available online: http://start.org/download/gec05/ayenew-final.pdf (accessed on 21 December 2015).
  63. Esayas, Y. Evaluating the Impact of Land Use/Land Cover Change on Soil Erosion Runoff Using SWAT Model at Tikur Wuha Watershed. Available online: http://etd.aau.edu.et/bitstream/123456789/993/3/Yacob%20Esayas.pdf (accessed on 21 December 2015).
  64. Awulachew, S.B. Characteristics Investigation of physical and bathymetric characteristics of Lakes Abaya and Chamo and their management implications. Lakes Reservoirs Res. Manag. 2006, 11, 133–140. [Google Scholar] [CrossRef]
  65. Williams, M.A.; Williams, F.M.; Bishop, P.M. Late Quaternary history of Lake Beseka, Ethiopia. Palaeoecol. Afr. Surround. Islands Antarct. 1981, 13, 93–104. [Google Scholar]
  66. Water Works Design and Supervision Enterprise (WWDSE). Study of Lake Beseka; Ministry of Water Resources: Addis Ababa, Ethiopia, 1999; Volume 1, p. 203. [Google Scholar]

