Article

Genome-Wide Characterization of Cucumber (Cucumis sativus L.) GRAS Genes and Their Response to Various Abiotic Stresses

1
Institute of Vegetables and Flowers, Chinese Academy of Agricultural Sciences, Beijing 100081, China
2
Department of Plant Sciences, University of California, Davis, One Shield Avenue, Davis, CA 95616, USA
*
Authors to whom correspondence should be addressed.
These authors contributed equally to this work.
Horticulturae 2020, 6(4), 110; https://doi.org/10.3390/horticulturae6040110
Submission received: 1 December 2020 / Revised: 15 December 2020 / Accepted: 16 December 2020 / Published: 21 December 2020
(This article belongs to the Section Biotic and Abiotic Stress)

Abstract

:
The GRAS (gibberellic acid insensitive, repressor of GAI, and scarecrow) proteins are a family of plant-specific transcription factors that regulate plant growth, development, and stress response. Currently, the role of GRAS transcription factors in various abiotic stress responses has not been systematically studied in cucumber (Cucumis sativus L.), a popular vegetable crop. Here, we provide a comprehensive bioinformatics analysis of the 35 GRAS genes identified in the cucumber genome. In this study, cucumber genotypes, i.e., “CG104”, which is stress-tolerant, and genotype “CG37”, which is stress-sensitive, were examined to provide insight on potential differences in the GRAS-regulated abiotic stress pathways. Transcriptional analysis by RNA-seq or qRT-PCR of these two genotypes revealed common and divergent functions of CsGRAS genes regulated by low and high temperatures, salinity, and by exposure to the phytohormones gibberellin (GA) and abscisic acid (ABA). Notably, CsGRAS2 (DELLA) and CsGRAS26 (LISCL) were regulated by all abiotic stresses and hormone treatments, suggesting that they may function in the biological cross-talk between multiple signaling pathways. This study provides candidate genes for improving cucumber tolerance to various environmental stresses.

1. Introduction

Transcription factors (TFs) play important regulatory roles in diverse plant biological processes for fitness [1,2]. There are several TFs in plants that are well-known regulators of plant stress response including WRKY [3], TCP [4], bZIP [5], MYB [6], NAC [7], and GRAS [8]. The GRAS gene family is named after the three family members that were first characterized: GIBBERELLIN-INSENSITIVE (GAI) [9], Repressor of ga1–3 (RGA) [10] and SCARECROW (SCR) [11].
With advances in whole-genome sequencing, members of the GRAS gene family have now been identified in many species. The numbers vary by species, e.g., there are 34 GRAS genes in Arabidopsis thaliana [12], 57 in rice (Oryza sativa) [12], 50 in pepper (Capsicum annuum L.) [8], 86 in cabbage (Brassica napus) [13], 53 in tomato (Solanum lycopersicum) [14], 86 in maize (Zea mays) [15], and 46 in poplar (Populus sp.) [16]. The GRAS gene family can be classified into eight subfamilies based on the different domain architectures in Arabidopsis and rice [12]. They include DELLA, Scarecrow-like (SCR), Lateral Suppressor (LISCL), Hairy Meristem (HAM), Phytochrome A signal transduction 1 (PAT1), Short-Root (SHR), Scarecrow-like 9 (SCL9), and SCL3. Afterwards, three more subfamilies LISCL, DLT, and AtSCL4/7 were identified in Arabidopsis [17]. Within the GRAS gene subfamily, isoforms can vary from eight to seventeen [18,19,20]. There are 13 subfamilies in Populus [18], 16 in Medicago truncatula [19], and 17 based on the eight diverse species analyzed by Cenci and Rouard [20], which suggest that the classification of the GRAS subfamily is specific in various species.
Until recently, the distinct functions of GRAS genes were studied according to the amino acid sequences of each subfamily. For example, SCR and SHR are both involved in the coordination of root development by forming an SCR/SHR complex [11,21]. DELLA, a transcriptional repressor of the gibberellin (GA) signaling pathway [22,23], is involved in abaxial trichome initiation, rosette radius, flowering time, stem elongation, and apical dominance [24]. SCL3, regulates GA homeostasis to promote root development [25]. Members of the Arabidopsis PAT1 subfamily regulate phytochrome signaling transduction [26,27]. The LAS subfamily plays a pivotal role in axillary meristem formation in rice [28], tomato, and Arabidopsis [29,30]. Moreover, GRAS members have been shown to have a function in abiotic stress response in Arabidopsis [31] and cabbage [32].
Cucumber (Cucumis sativus L.) is an economically important Cucurbit vegetable that is widely cultivated worldwide. Global production of cucumber reached 80 million metric tons in 2016 [33]. During production, cucumber often suffers from various abiotic stresses, such as low temperatures, high temperatures, and salinity. Low temperature stress causes yellowed leaves and retarded growth, which reduces cucumber yield, especially in winter and early spring [34,35]. High temperatures lead to sunburn of leaves and fruit malformation, which affects yield and fruit quality in summer [36]. Salt stress reduces chlorophyll content and mineral uptake, thus delaying cucumber growth [37]. Phytohormones are also essential in regulating stresses response. The abscisic acid (ABA) signaling pathway is central to salt-, drought-, and cold-stress signaling responses in plants [38]. GA treatment can decrease Arabidopsis survival under salt and low temperature stresses [39,40,41]. GA and ABA biosynthesis and signals take part in the response to low temperatures in tomato [42]. Thus far, transcription factor families such as WRKY [3], NAC [43], ARF [44], MADS [45], and MLO [46,47] have been well studied in cucumber response to abiotic stresses. However, the cucumber GRAS gene family has not been well characterized in different abiotic stresses in detail.
In this study, the cucumber GRAS gene family members were characterized using bioinformatics, and their chromosomal location, gene and protein structures, evolution, and protein interactions were analyzed. The expression patterns of the CsGRAS genes after exogenous phytohormone (GA and ABA) and different abiotic stress treatments were further analyzed. This study will provide the basis for a better understanding of the CsGRAS gene family members and their role in cucumber abiotic stress response.

2. Materials and Methods

2.1. Plant Materials

Three cucumber genotypes were used in this study: “CG104”, “CG37”, and “CG25”. “CG104”is a Japanese-type cucumber that shows resistance to high salt and high and low temperature stresses. “CG37” is a European–Asian type that is sensitive to high salt and high and low temperature stresses. “CG25”is a North China-type cucumber which is sensitive to high temperatures. “CG104” and “CG37” were used for RNA-seq (low temperature stress) and quantitative real-time PCR Analysis (low temperature, high temperature, and salt stresses). “CG104” and “CG25” were used for RNA-seq analysis after exposure to high temperature stress. These genotypes were all obtained from the Cucumber Research Group within the Institute of Vegetables and Flowers, at the Chinese Academy of Agricultural Sciences, Beijing, China.

2.2. Identification of the CsGRAS Genes

The cucumber genome sequence was completed in 2009 [48]. The “Cucumber genome version 2” (“9930” as reference genome) sequences were downloaded from the Cucurbit Genomics database (http://www.cucurbitgenomics.org/organism/2). In addition, GRAS genes identified in Arabidopsis, rice, and tomato were obtained from TAIR (https://www.arabidopsis.org), RGAP (http://rice.plantbiology.msu.edu) [16], and SGN (https://solgenomics.net) [50], respectively.
The coding sequences (CDSs) of all cucumber genes were extracted from the genome using TBtools [49] and translated into protein sequences according to the gene structure information. Three steps were used to identify cucumber GRAS gene family members in this study. First, the latest Hidden Markov Model (HMM) of the GRAS domain (PF03514) was obtained from Pfam (http://pfam.xfam.org) and used to search GRAS protein from the cucumber genome by HMMER 3.2.1 (E-value < 0.01). The first set of GRAS genes was collected [50]. Secondly, 32 Arabidopsis and 48 rice GRAS proteins were used as queries to search the cucumber genome using the BLASTP program, thus obtaining the second set of candidate GRAS genes in cucumber. Third, two independent sets of candidate GRAS genes were merged, and the repetitive and redundant genes were removed manually. In order to ensure candidate gene accuracy, conserved domains for GRAS proteins were further analyzed using NCBI-CDD (https://www.ncbi.nlm.nih.gov/Structure/bwrpsb/bwrpsb.cgi) and SMART (http://smart.embl-heidelberg.de/). The non-redundant genes were used for subsequent analysis.

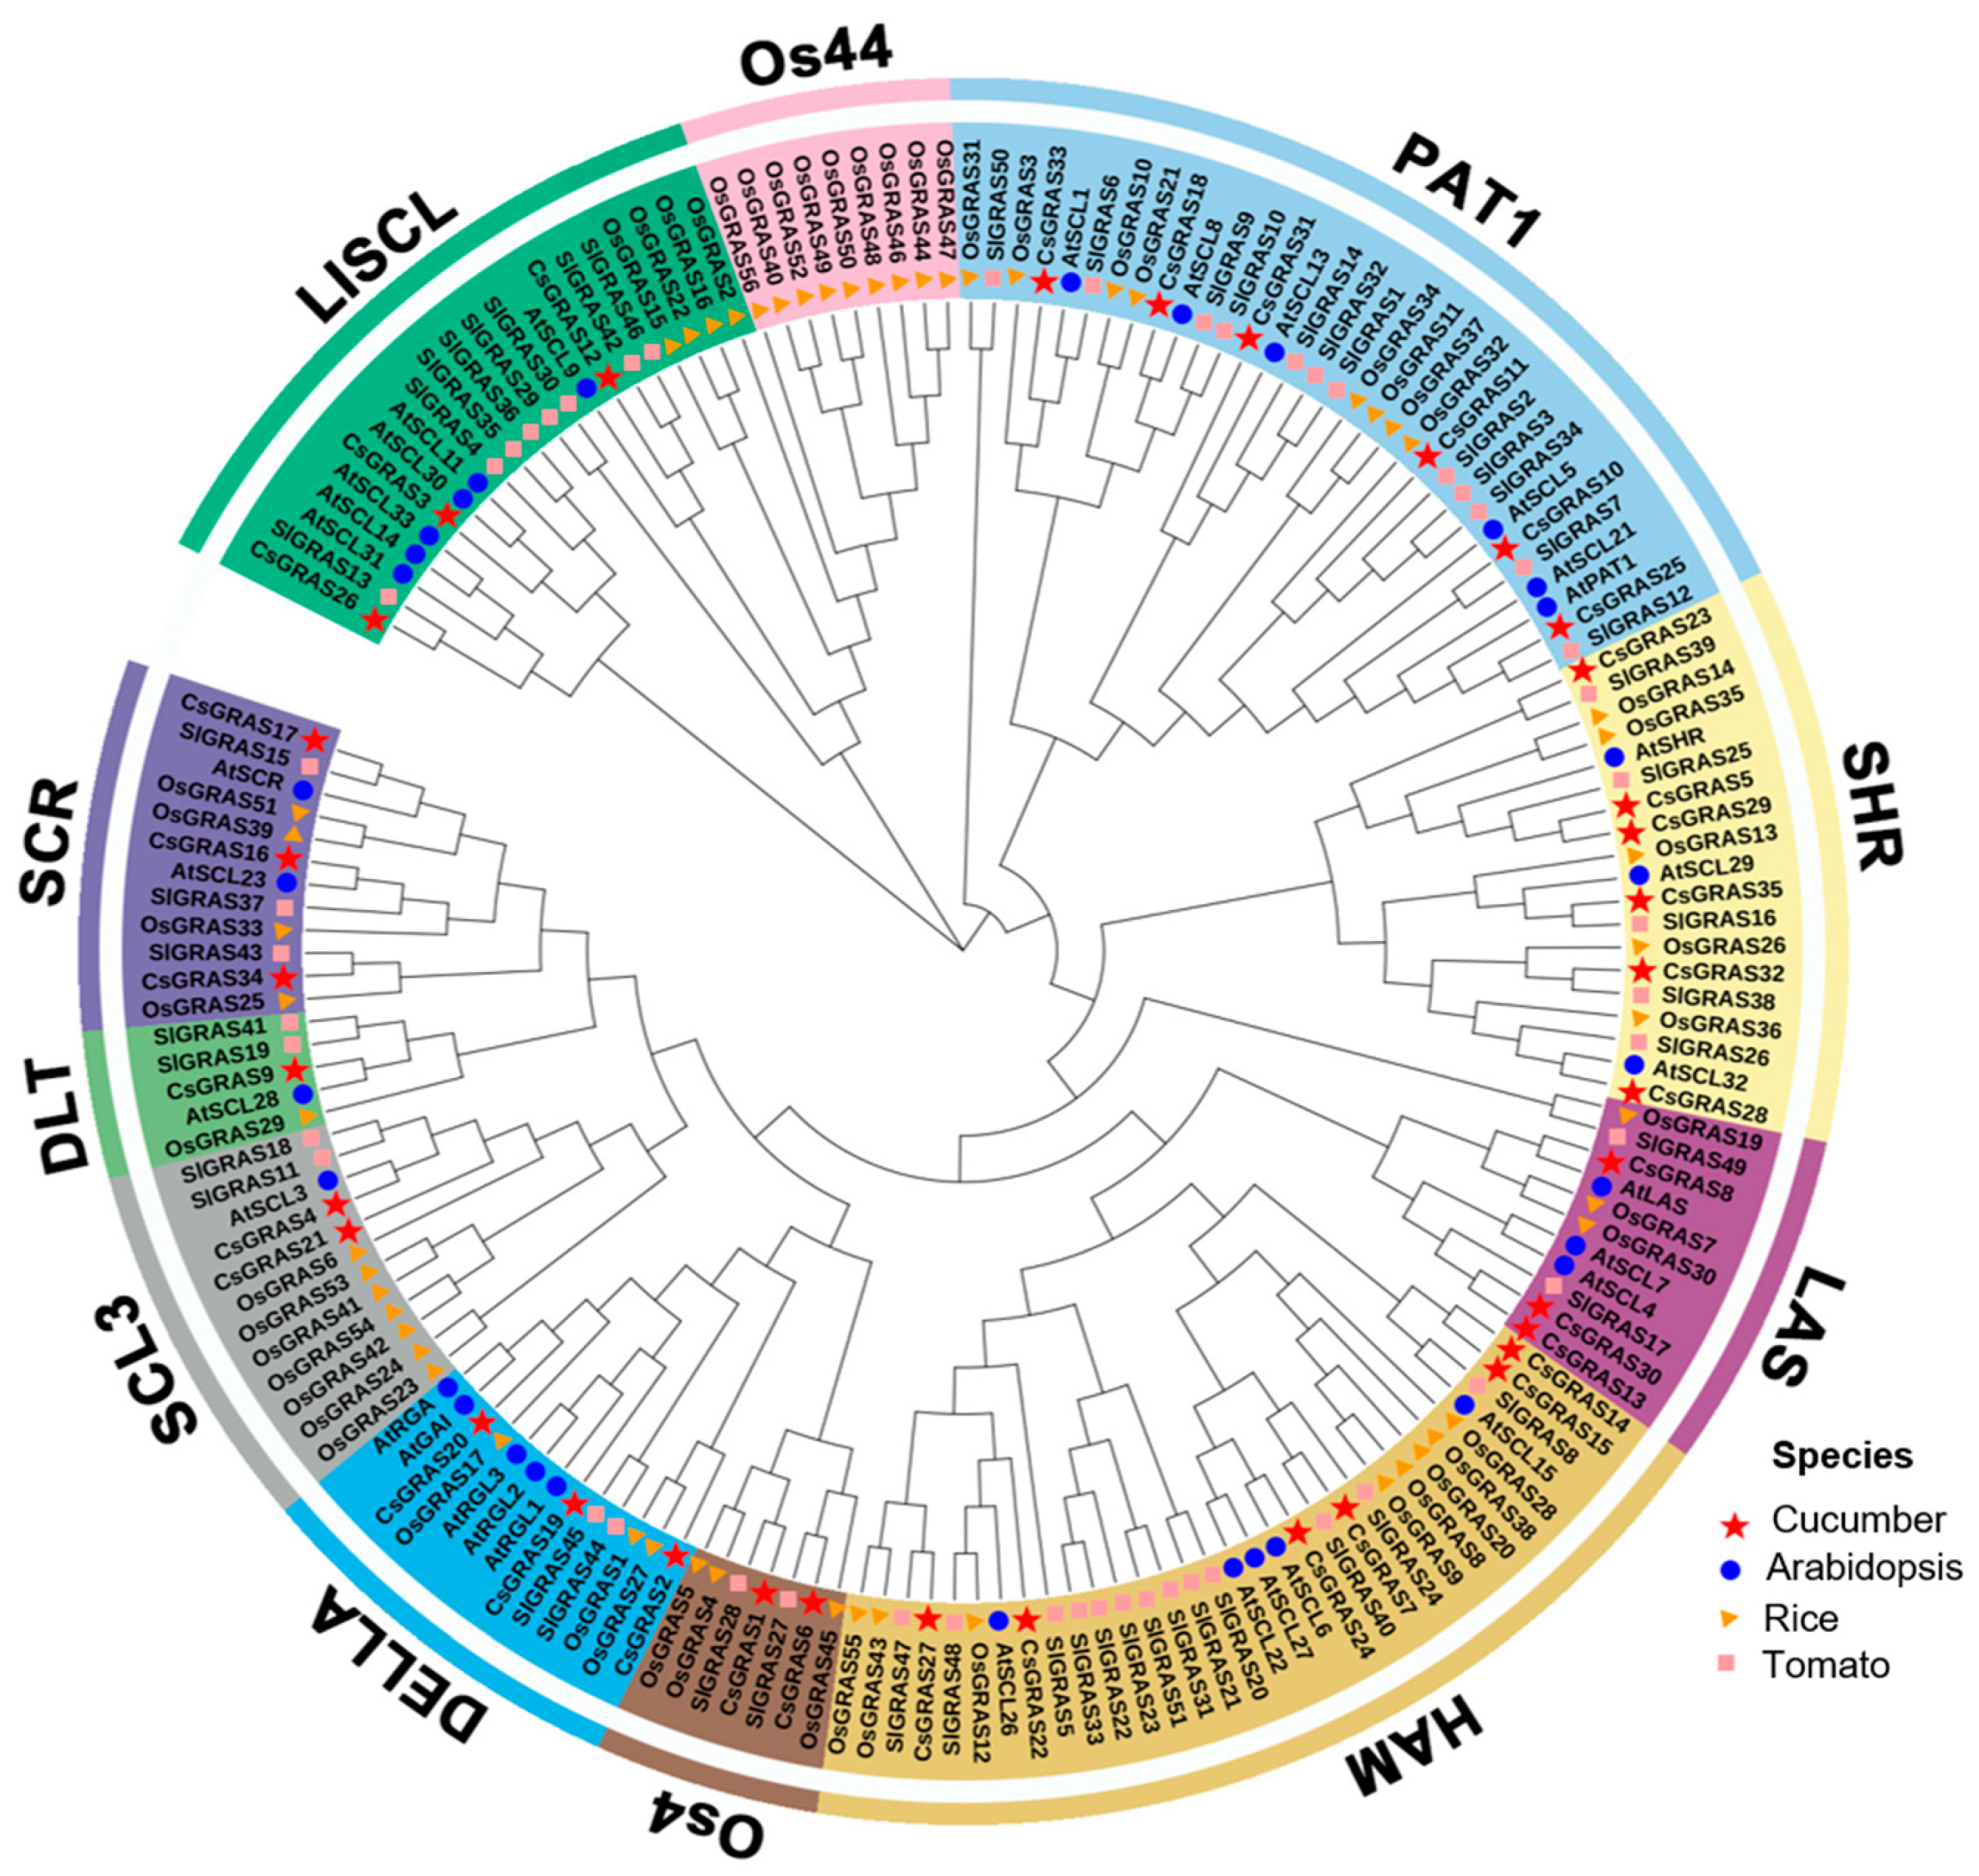
2.3. Phylogenetic Analysis of CsGRAS Genes

The phylogenetic relationships among the predicted amino acid sequences of the GRAS genes in cucumber and the model plants Arabidopsis, rice, and tomato were determined using the ClustalW program [51]. Then, an unrooted phylogenetic tree was generated using the Molecular Evolutionary Genetics Analysis software package, Version X (MEGA X) with the maximum likelihood (ML) method [52]. A bootstrap analysis with 1000 replications was performed to assess group support. Finally, the GRAS gene family in cucumber was further divided into different subfamilies based on the well-established standards in Arabidopsis and rice [52].

2.4. Protein Property, Gene Structure, and Conserved Motif Analysis

The physical and chemical features of CsGRAS proteins were calculated using the “Compute pI/Mw tool” in ExPASy (https://web.expasy.org/compute_pi/), including the theoretical isoelectric point (pI) and molecular weight (Mw) [53]. To detect the intron–exon organization of the cucumber GRAS genes, the coding sequences (CDSs) with corresponding genomic DNA sequences were aligned, and the final gene structure of each CsGRAS gene was displayed online using the Gene Structure Display Server (GSDS, http://gsds.cbi.pku.edu.cn/index.php). The conserved motifs of full-length GRAS proteins were identified by MEME (http://meme-suite.org/) [54]. The maximum number of motifs was set to 20 and “others” options were the default parameters.

2.5. Chromosomal Mapping and Synteny Analysis

The chromosomal position of each CsGRAS gene was extracted from the cucumber genomic sequence annotation file and was used to draft a map using TBtools [49]. MCscanX (http://chibba.pgml.uga.edu/mcscan2/) was used to identify syntenic and collinear regions, as well as tandem and duplicated regions among the GRAS genes in cucumber, Arabidopsis, and tomato. The linear map of syntenic analysis maps in cucumber genome was constructed by TBtools.

2.6. Promoter Cis-Elements Analysis

The 2.0-kb region upstream of the ‘ATG’ start codon of each CsGRAS gene was examined for the presence of characterized cis-regulatory elements. This was done using the PlantCARE online tool (http://bioinformatics.psb.ugent.be/webtools/plantcare/html/) [55], and the results were visualized using TBtools.

2.7. Prediction of the CsGRAS Protein–Protein Interaction Network

To further clarify the relationships among the CsGRAS proteins, interologs in Arabidopsis were used to predict protein–protein interactions. First, cucumber orthologs of the Arabidopsis GRAS proteins were identified using the Cucurbit (http://cucurbitgenomics.org) and Arabidopsis databases (https://www.arabidopsis.org). Then, the functional interaction networks of proteins were generated using the online STRING database (https://string-db.org/cgi/network.pl?taskId = Dca4SwniBosz), with the confidence parameter set at a default of 0.15 [56]. Finally, Cytoscape version 3.4.0 was used to visualize the interaction networks of the CsGRAS proteins [57].

2.8. Expression Profile Analysis of CsGRAS Genes via RNA-Seq Data

To determine the tissue-specific expression of the CsGRAS genes, the RNA-seq data of various cucumber tissues (root, stem, leaf, ovary fertilized, ovary, female flowers, ovary unfertilized, male flowers, tendril base, and tendril) were downloaded and analyzed from the Cucumber Genome Database (code: PRJNA80169). To determine the expression patterns of the CsGRAS gene family under high and low temperatures, we performed a transcriptome analysis using “CG104”, “CG25”, and “CG37” (data unpublished). For the high temperature experiment, leaves were sampled from “CG104” (resistant to high temperatures) and “CG25” (susceptible to high temperatures) at 0, 10, and 60 min after a 50 °C heat stress treatment. For the low temperature experiment, leaves were sampled from “CG104” (resistant to high temperatures) and “CG37” (susceptible to high temperatures) at 0, 10, 144, 240, and 336 h after a low temperature treatment (i.e., 19 °C with 14 h of light/10 °C with 10 h of dark). All high-quality reads were located to the cucumber reference V2, and the uniquely mapped reads were used for expression analysis. The fragments per kb per million (FPKM) method was conducted to normalize and calculate the gene expression levels of GRAS genes in different tissues and stresses [58]. Besides the above two RNA-seq datasets generated in our lab, the RNA-seq datasets from the Cucumber Genome Database of cucumber seedlings exposed to chilling stress (0, 2, 6, and 12 h after 4 °C exposure, code: PRJNA438923) and salt stress (75 mM NaCl and the control with water, code: PRJNA437579) were downloaded. The heat maps were constructed using TBtools.

2.9. qRT-PCR Gene Expression Analysis

“CG37” and “CG104” were used for an in-depth expression analysis in response to abiotic stress. Fifty seeds were soaked at 55 °C for 2 min and were then transferred to 28 °C for 1 d. Germinated seeds were sown in a 32-well seedling plate with substrate. After sowing, the cucumber seedlings were cultivated in a light incubator (29 °C with 14 h of light/20 °C with 10 h of dark; light intensity 190~600 μmol/m2·s) until the two-leaf stage. Then, the seedlings were subjected to different stress treatments, including low temperature, high temperature, and salinity stress. Conditions for the low temperature treatment were as follows: 19 °C during the 14 h of light and 10 °C during the 10 h of dark. Leaves were sampled at 0, 10, 144, and 336 h after the temperature treatment. For the high temperature treatment, the incubator was maintained at 50 ± 1 °C and leaves were collected 0, 10, and 60 min after the application of the stress. For the salinity treatment, leaves were harvested 12, 48, and 96 h after watering seedlings with a 200-mM NaCl solution. Growth temperatures were 29 °C during the 14 h of light and 20 °C during the 10 h of dark. For all experiments, light intensity was maintained at 190~600 μmol/m2·s.
For the hormonal treatment, three sets of two-leaf-old seedlings were used. One set was sprayed with 100 μmol/L ABA (Sigma, St, Louis, MO, USA), another with 100 mg/L GA3 (Coolaber, Beijing, China), and a third with water, as a control. The first application was at 09:00 a.m., and the second, 6 h later. Twelve hours after the treatment, leaves were harvested separately. Seedlings without treatment were set as controls. The samples of each treatment were harvested and frozen in liquid nitrogen and stored at −80 °C for RNA extraction. Each experiment was conducted with three biological replicates, each consisting of 10 plants.

2.10. RNA Extraction and Quantitative Real-Time PCR Analysis

Total RNA was extracted from the leaf samples using the RNA prep Pure Plant Kit (Tiangen, Beijing, China). First-strand cDNA synthesis was accomplished using the HiScriptfiIII RT SuperMix kit (Vazyme Biotech, Nanjing, China), and quantitative RT-PCR for each sample was then carried out using the Bio-Rad CFX Manager system (Bio-Rad, Berkeley, CA, USA). Specific primers were designed to each CsGRAS gene using DNAMAN software [59], such that each amplicon size varied in the range of 100~150 bps. The sequences and locations of each primer are listed in Table S1. The qRT-PCR conditions used were as follows: 95 °C for 3 min, followed by 45 cycles of 95 °C for 10 s, 60 °C for 30 s, and 72 °C for 20 s. The relative gene expression levels were analyzed using the delta-delta Ct algorithm [60,61]. Actin1 (Csa3G806800) was used as the internal control for the normalization of gene expression values [62]. Statistical analysis of significant differential expression was determined using a two-tailed Student’s t-test in Microsoft Office Excel 2017 and Origin 2018.

3. Results

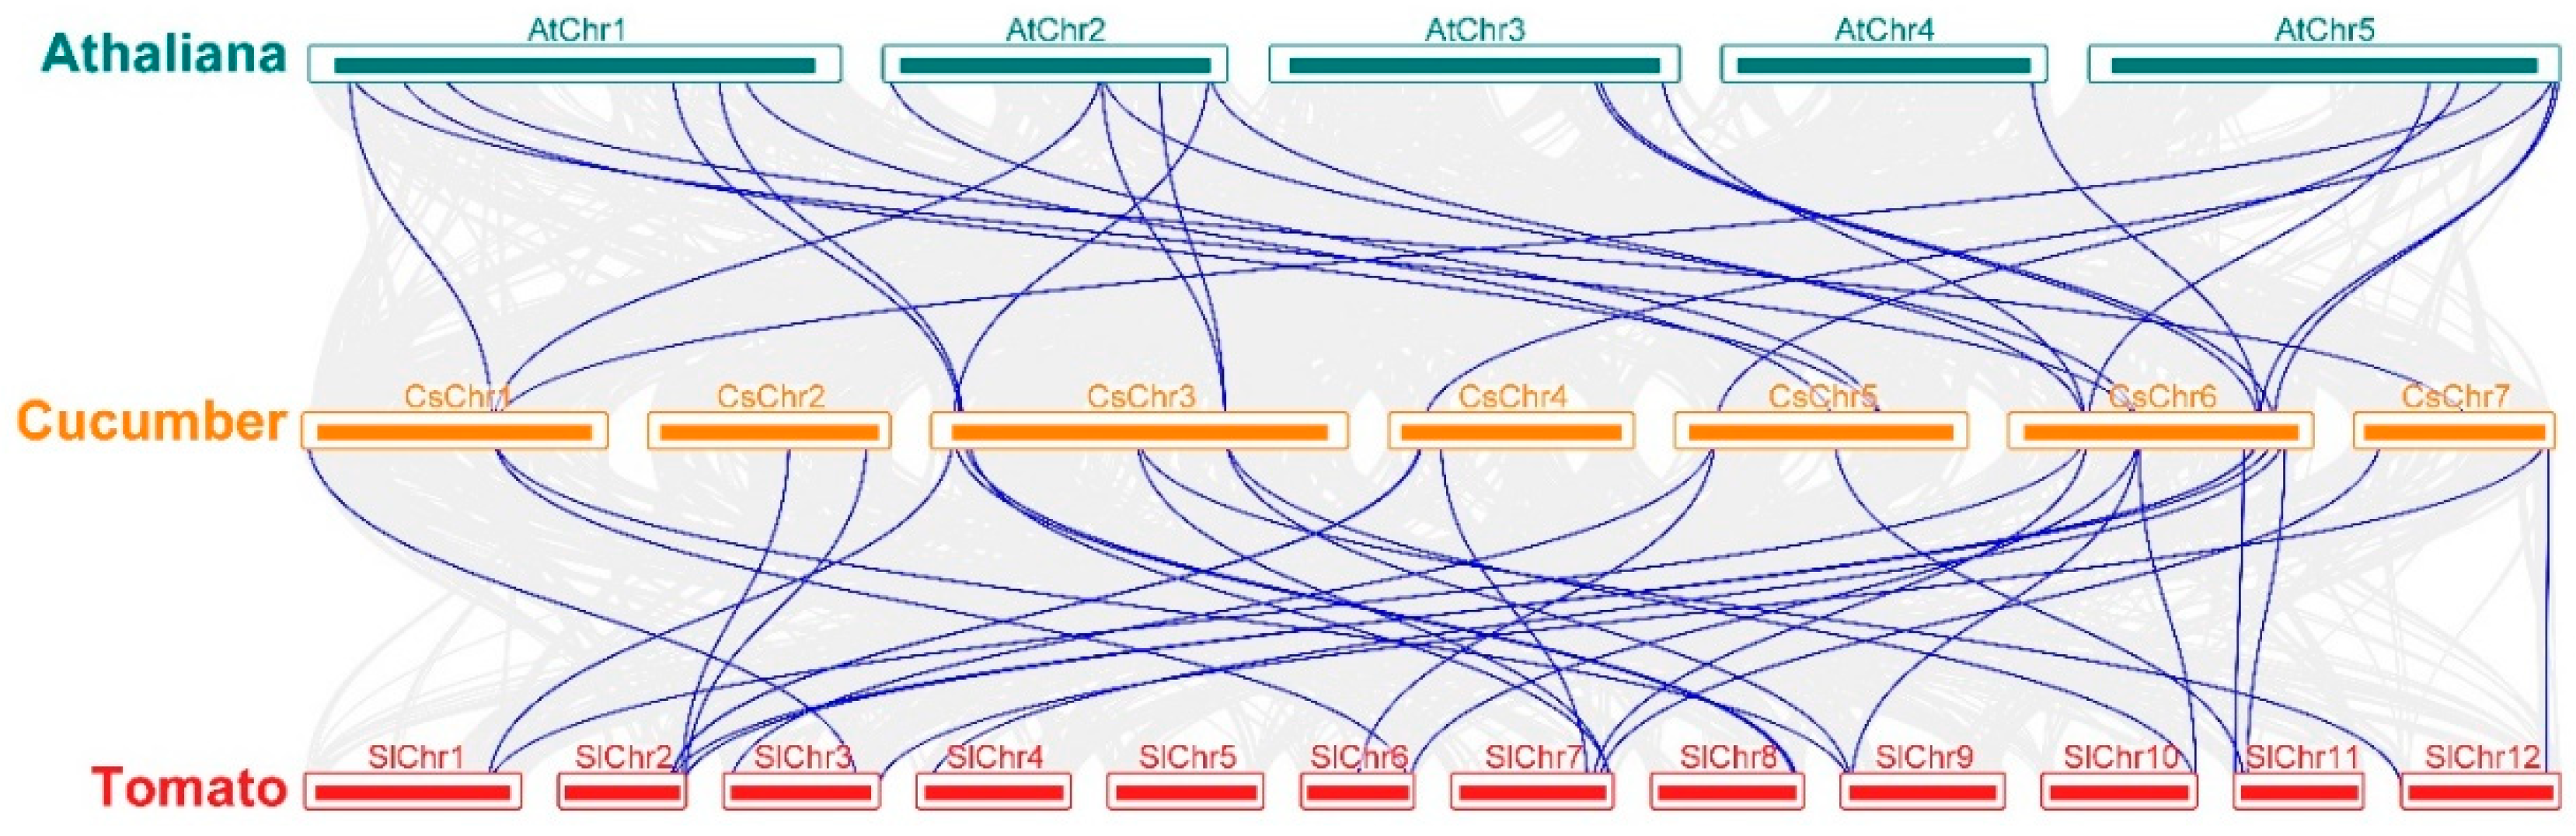
3.1. Syntenic Relations of the GRAS Gene Family in Cucumber, Arabidopsis, and Tomato

All 32 Arabidopsis and 56 rice GRAS proteins (Table S2) were BLASTed against the cucumber V2 genome, yielding 35 non-redundant CsGRAS genes (Table S3). The nucleotide, coding sequences (CDSs), and predicted amino acid sequences of these CsGRAS genes are listed in Table S4. All 35 cucumber GRAS genes were assigned to seven chromosomes (Figure S1). Based on the chromosomal location, the 35 GRAS genes in cucumber were renamed from CsGRAS1 to CsGRAS35 (Figure S1; Table S3).
To further understand the evolutionary relationship of the CsGRAS genes with other species, syntenic and collinear regions of the GRAS genes in cucumber, tomato, and Arabidopsis were analyzed by the Multiple Collinearity Scan toolkit (MCscanX; Figure 1). Many syntenic blocks were found. A total of 24 gene pairs were detected between cucumber and tomato, and 16 pairs were found between cucumber and Arabidopsis. Interestingly, 13 CsGRAS genes had orthologs in both the Arabidopsis and tomato genomes (Table S5). These results suggest that the cucumber GRAS gene family is more closely related to tomato than to Arabidopsis.

3.2. Phylogenetic and Structural Analysis of the Cucumber GRAS Genes

To detect the phylogenetic relationship of the predicted amino acid sequence of the CsGRAS proteins, an unrooted phylogenetic tree was constructed using the maximum likelihood (ML) method in MEGA-X software. The predicted amino acid sequences of the full-length GRAS homologs in cucumber (35), Arabidopsis (32), rice (55), and tomato (50) were compared. Based on the classification of these homologs, the 35 cucumber GRAS proteins were grouped into ten subfamilies: LISCL (3), PAT1 (6), SHR (6), LAS (3), HAM (6), DELLA (3), SCL3 (2), DLT (1), SCR (3), and Os4 (2) (Figure 2, Figure S2, and Table S6). Among these proteins, CsGRAS1 and CsGRAS6 had no Arabidopsis homologs and were grouped into previously reported rice-specific Os4 subfamilies [18]. The classification of GRAS homologs from cucumber, Arabidopsis, rice, and tomato revealed the conserved evolutionary and functional relationships of this family.
The diversity found among generally conserved motifs and gene structures plays an important role in the evolution of numerous gene family. GRAS proteins are typically composed of 400~700 amino acid (aa) residues. The conserved motifs were identified using the MEME suite. A total of 20 motifs representing the GRAS and DELLA domains were detected (named motif 1–20) in the CsGRAS genes (Figure S2b; Table S7). The GRAS domain was composed of five main parts, that is leucine heptad repeat I (LHRI), VHIID motif, leucine heptad repeat II (LHRII|), PFYRE motif, and SAW motif from the N- to the C-terminal. Generally, the motifs showed similar patterns in the same subfamily, which confirmed that the domains were highly conserved. For instance, motif 18 was specially distributed within the DELLA subfamily and conserved in the N-terminal region; motif 19 was only detected within the LISCL subfamily (Figure S2b). Besides, the untranslated regions (UTRs), exons, and introns of each gene were identified. The majority of CsGRAS genes contained one, two, or three exons; CsGRAS5 has the largest number of exons at three, whereas four GRAS subfamilies (CsGRAS27, CsGRAS34, CsGRAS33, and CsGRAS35) had only one exon and no introns (Figure S2c). Moreover, CsGRAS genes have distinct lengths and positions of exons and introns.

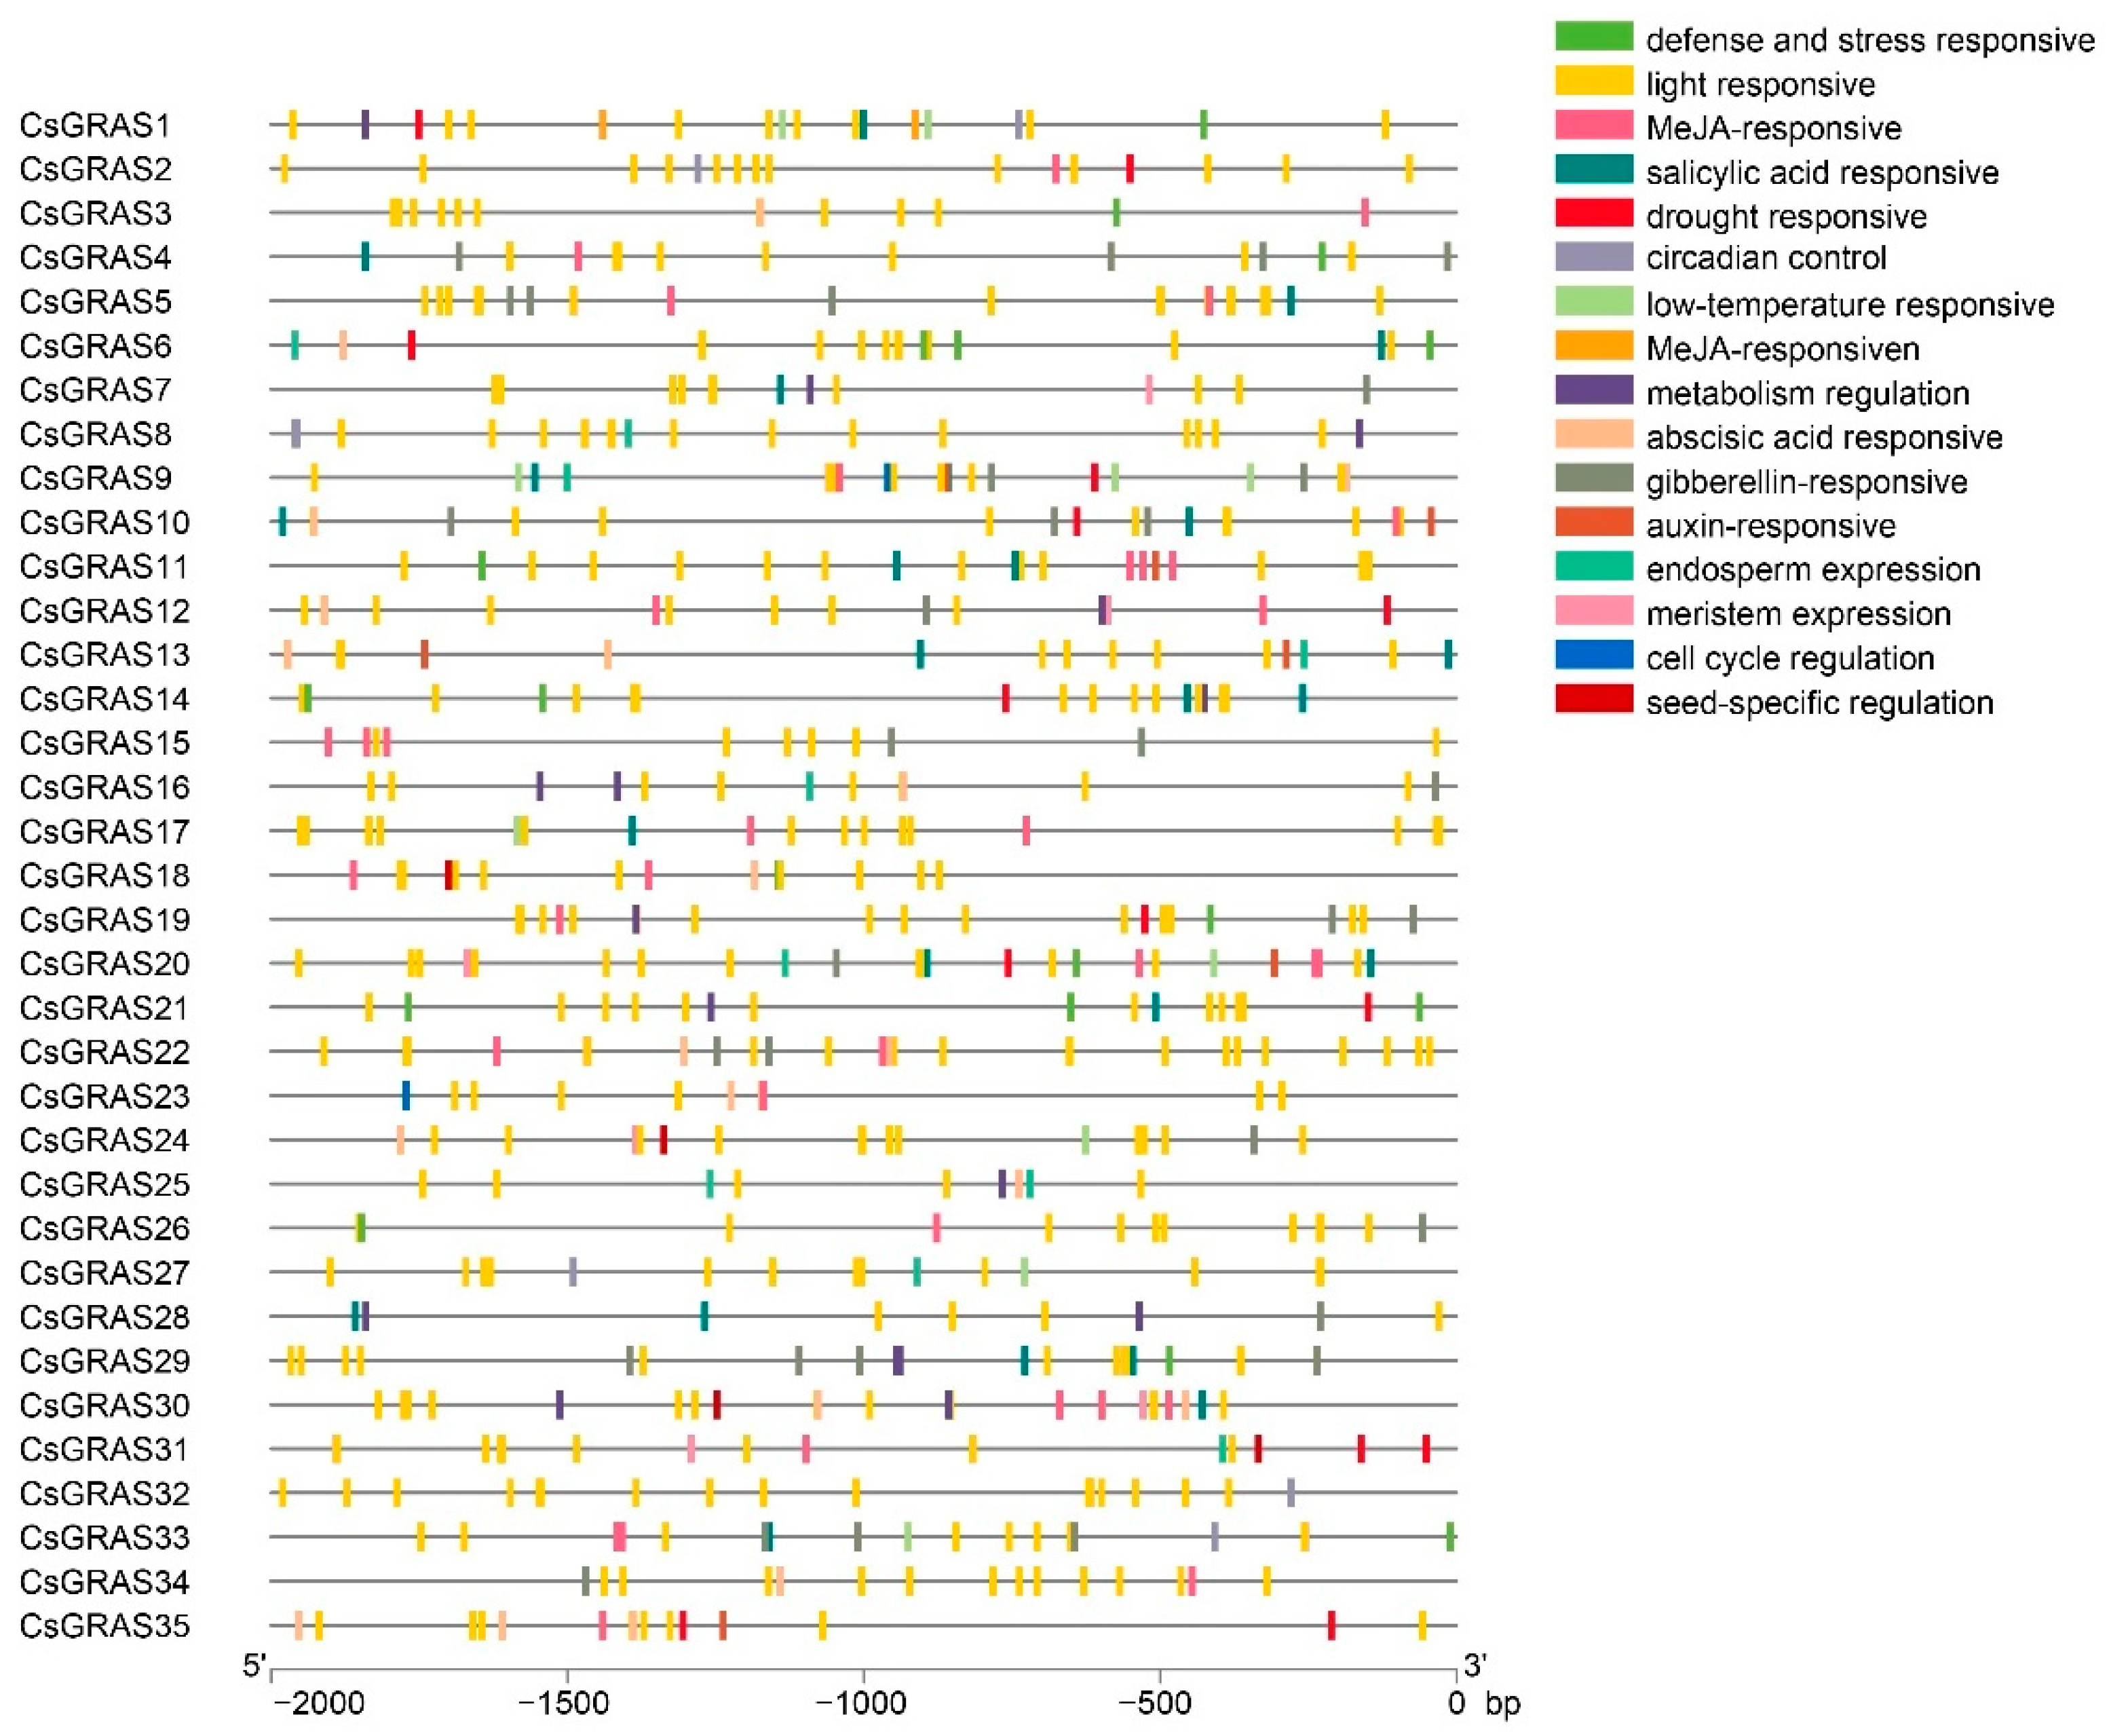
3.3. Analysis of Cis-Elements in Promoters and Interaction Network of CsGRAS Family

To better understand the regulatory mechanisms that could potentially modulate the CsGRAS genes, the cis-elements in the promoter region (2.0 kb upstream of the ATG start site) were identified (Figure 3). These cis-elements include light-responsive, stress-responsive (drought, low temperature), plant hormone-responsive (MeJA, abscisic acid, salicylic acid, gibberellin, auxin, salicylic acid), temporal, and spatial gene expression elements (meristem, endosperm, seed cell) and elements involved in biological processes (metabolism, circadian, cell cycle). Therefore, members of the GRAS gene family might participate in integrating multiple responses (e.g., stress response) via the regulation of upstream transcription factors.
To further identify the potential proteins that interacted with GRAS proteins, an interaction network was constructed based on the interologs from Arabidopsis (Figure S3 and Table S8). Interestingly, members from the DELLA (CsGRAS2, CsGRAS19, and CsGRAS20), SCL3 (CsGRAS4), and LISCL (CsGRAS26) subfamilies interact with more proteins, such as the GA-responsive (GID1) and light-responsive (PIF3/4 and PHY A/B) proteins. These results were consistent with their proposed functions, i.e., that DELLA and SCL maintain GA homeostasis by integrating multiple signaling pathways. Therefore, these GRAS family members are likely to be among the key genes that respond to a variety of plant processes, although this needs to be confirmed [63]. Surprisingly, the LAS (CsGRAS8) and PAT1 (CsGRAS10, CsGRAS11, and CsGRAS25) subfamilies have only one or two interaction partners. The cis-elements analysis and interaction networks may provide a reference for studying the functions of GRAS genes.

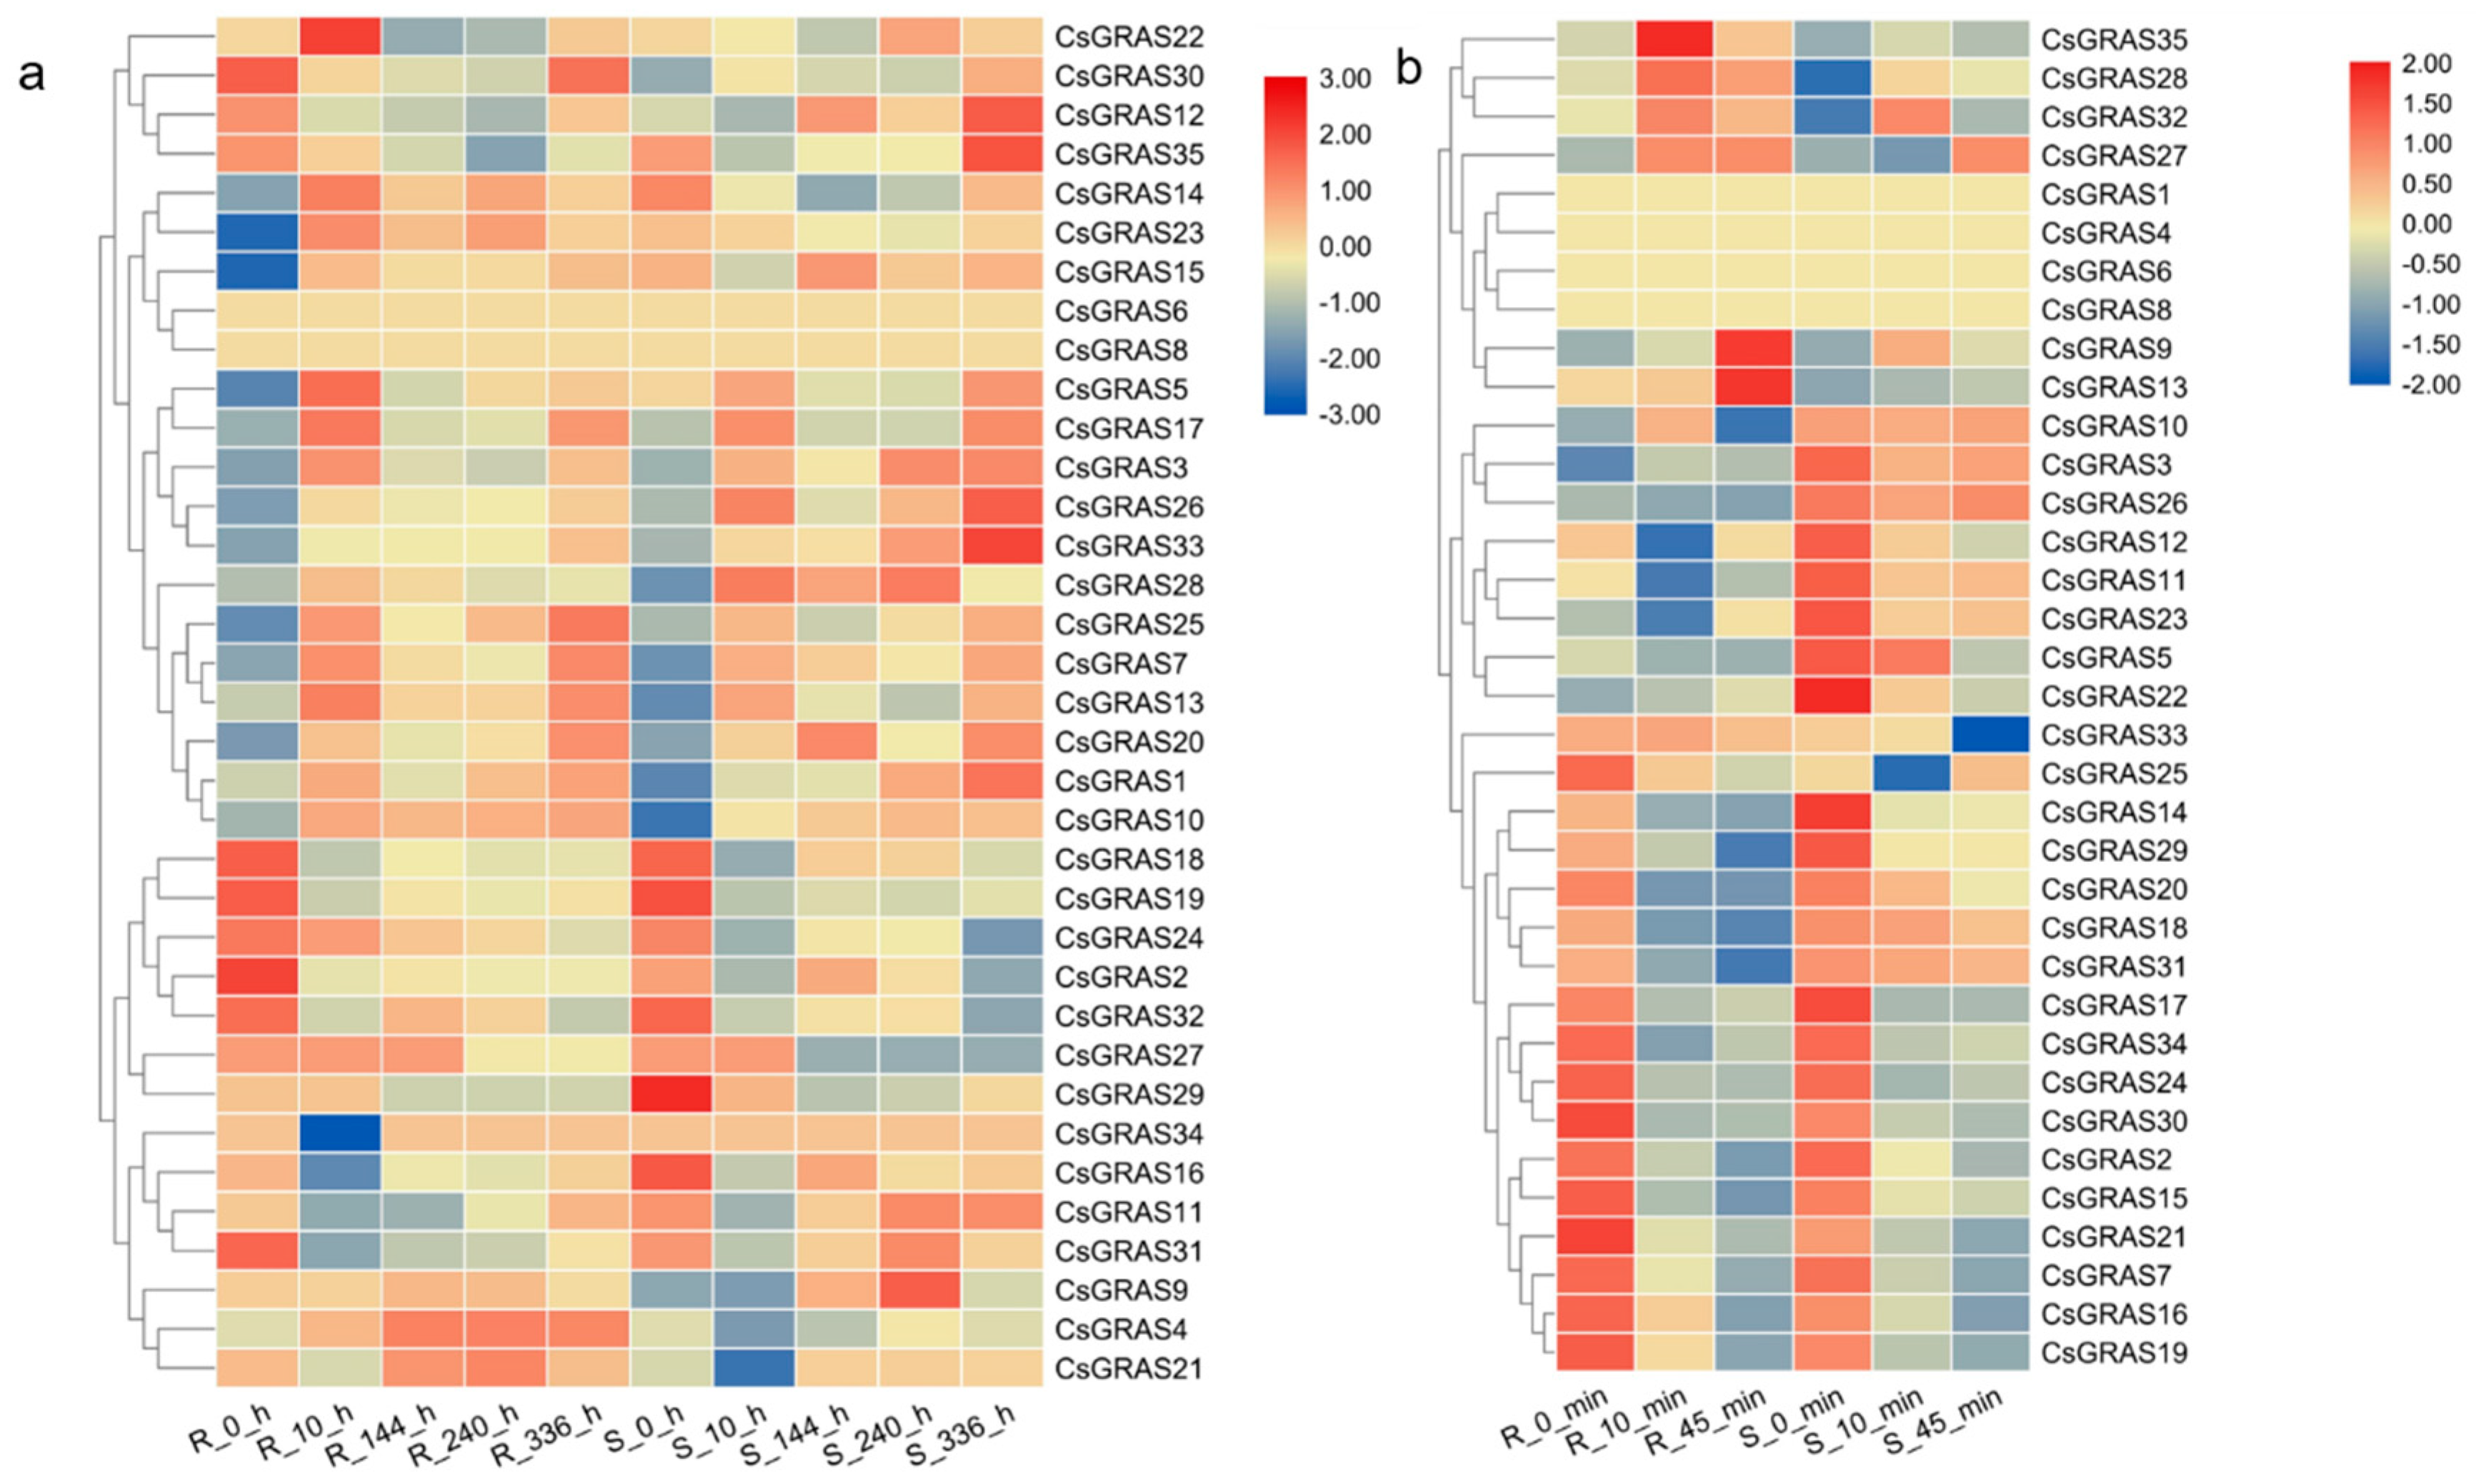
3.4. Expression Profiles of the Cucumber GRAS Genes under Various Abiotic Stresses

The GRAS gene family plays a crucial role in numerous biological processes in plant growth, development, and abiotic stress response, and their roles may be partially implied from their expression profiles. Therefore, the expression profile of CsGRAS family genes was explored using RNA-seq data from ten cucumber tissues (root, stem, leaf, ovary fertilized, ovary, female flowers, ovary unfertilized, male flowers, tendril base, and tendril), downloaded from the Cucumber Genome Database, and these data were used to generate a heatmap (Figure S4 and Table S9). Several CsGRAS subfamilies showed tissue-specific expression—for example, members of HAM subfamily were mainly expressed in reproductive organs, while members of the SCL3, HAM, and PAT1 subfamilies were highly expressed in vegetative organs. The tissue-specific expression of these genes is consistent with their function, considering the fact that SCL3 as a key regulator of root development [25] and PAT1 is involved in the phyA/B signaling pathway [26,27].
To further detect the time course expression patterns of CsGRAS genes under various abiotic stresses, RNA-seq data of cucumber seedlings exposed to chilling (Figure S5a), low temperature (Figure 4a), high temperature (Figure 4b), and salt (Figure S5b) stresses were used for expression analysis.
Under 4 °C chilling stress, a total of 22 CsGRAS genes (6 genes at 6 h; 17 genes at 12 h) were significantly downregulated, while four CsGRAS genes were significantly upregulated at 12 h (Figure S5a and Table S9). At 13 °C, four CsGRAS genes were downregulated in the low-temperature-tolerant line “CG104” but were upregulated in the sensitive line “CG37”, indicating that these genes might play a negative role in cucumber low temperature tolerance (Figure 4a and Table S9). Twelve CsGRAS genes (e.g., CsGRAS26) in the tolerant line “CG104,” and the sensitive line “CG37,” were upregulated, and ten genes (e.g., CsGRAS2) were downregulated (Figure 4a and Table S9). Similarly, under 50 °C heat stress, six CsGRAS genes were upregulated in both the tolerant “CG104” and sensitive “CG25” lines, and the other 24 genes were downregulated in expression. Other CsGRAS genes were also differentially regulated in the salt-tolerant and -sensitive lines (Figure 4b and Table S9). CsGRAS26 and 12 other genes were upregulated, while CsGRAS2 was downregulated by 75 mM salt stress (Figure S5b and Table S9).

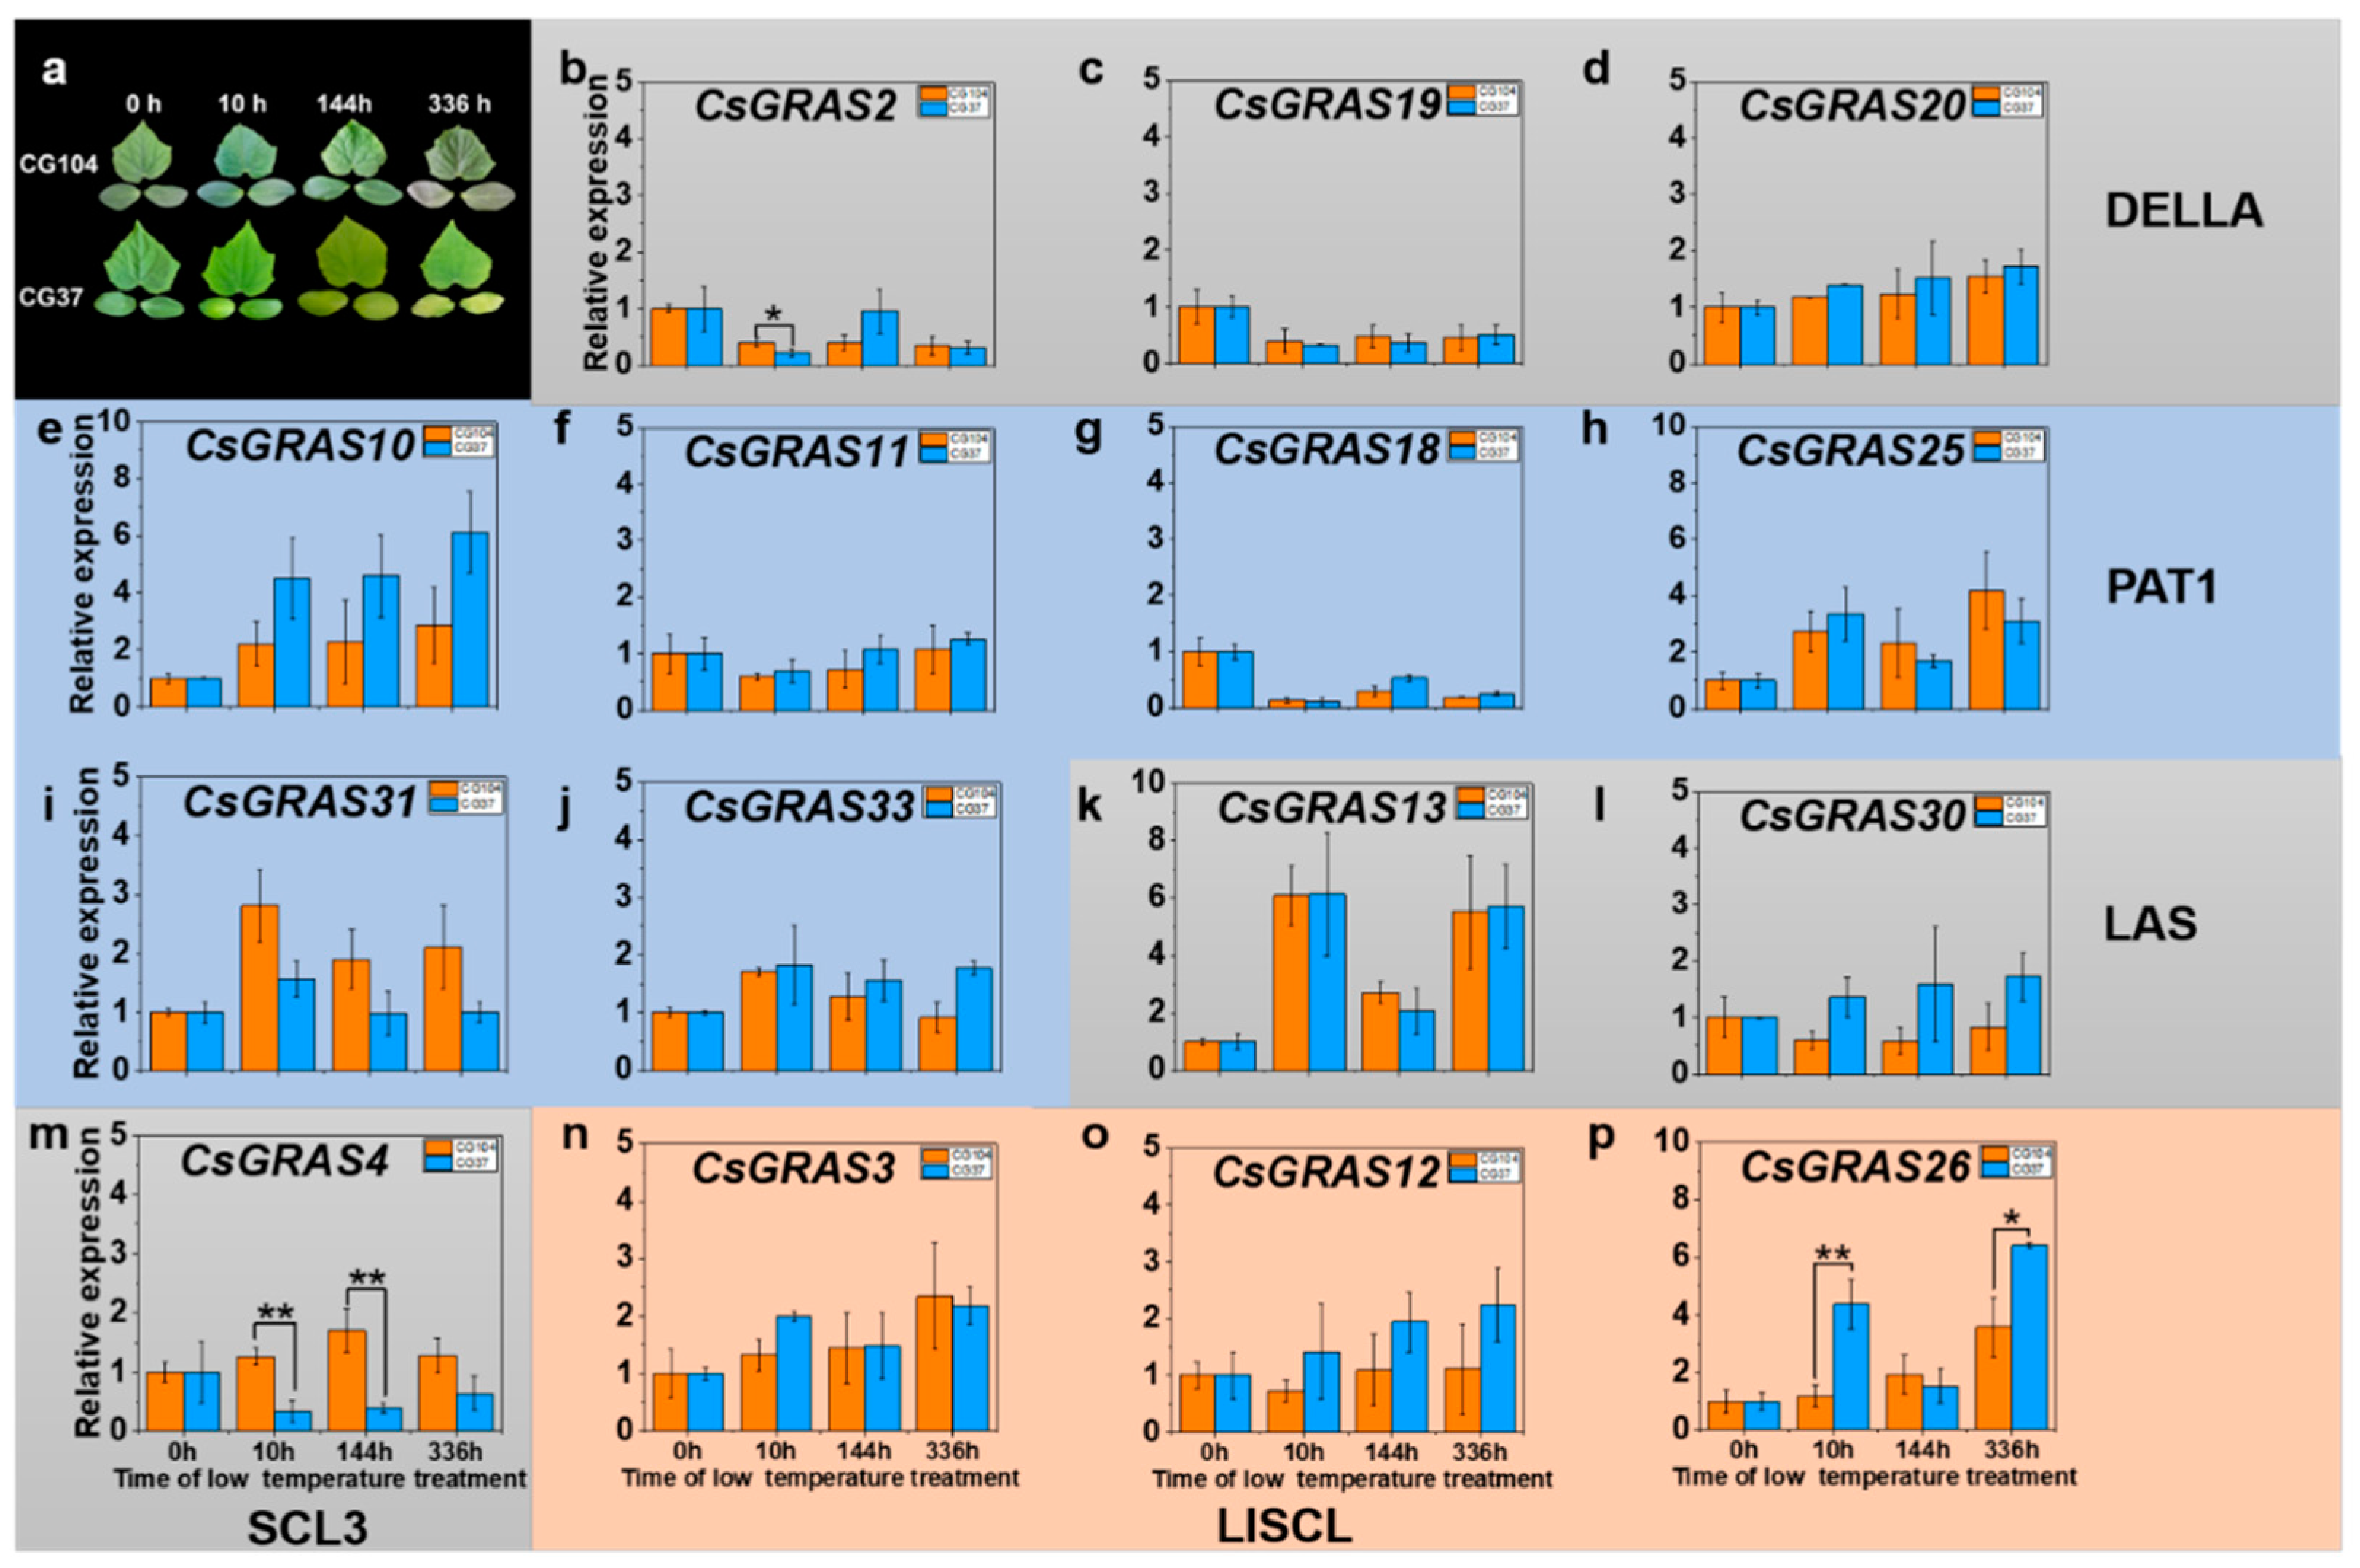
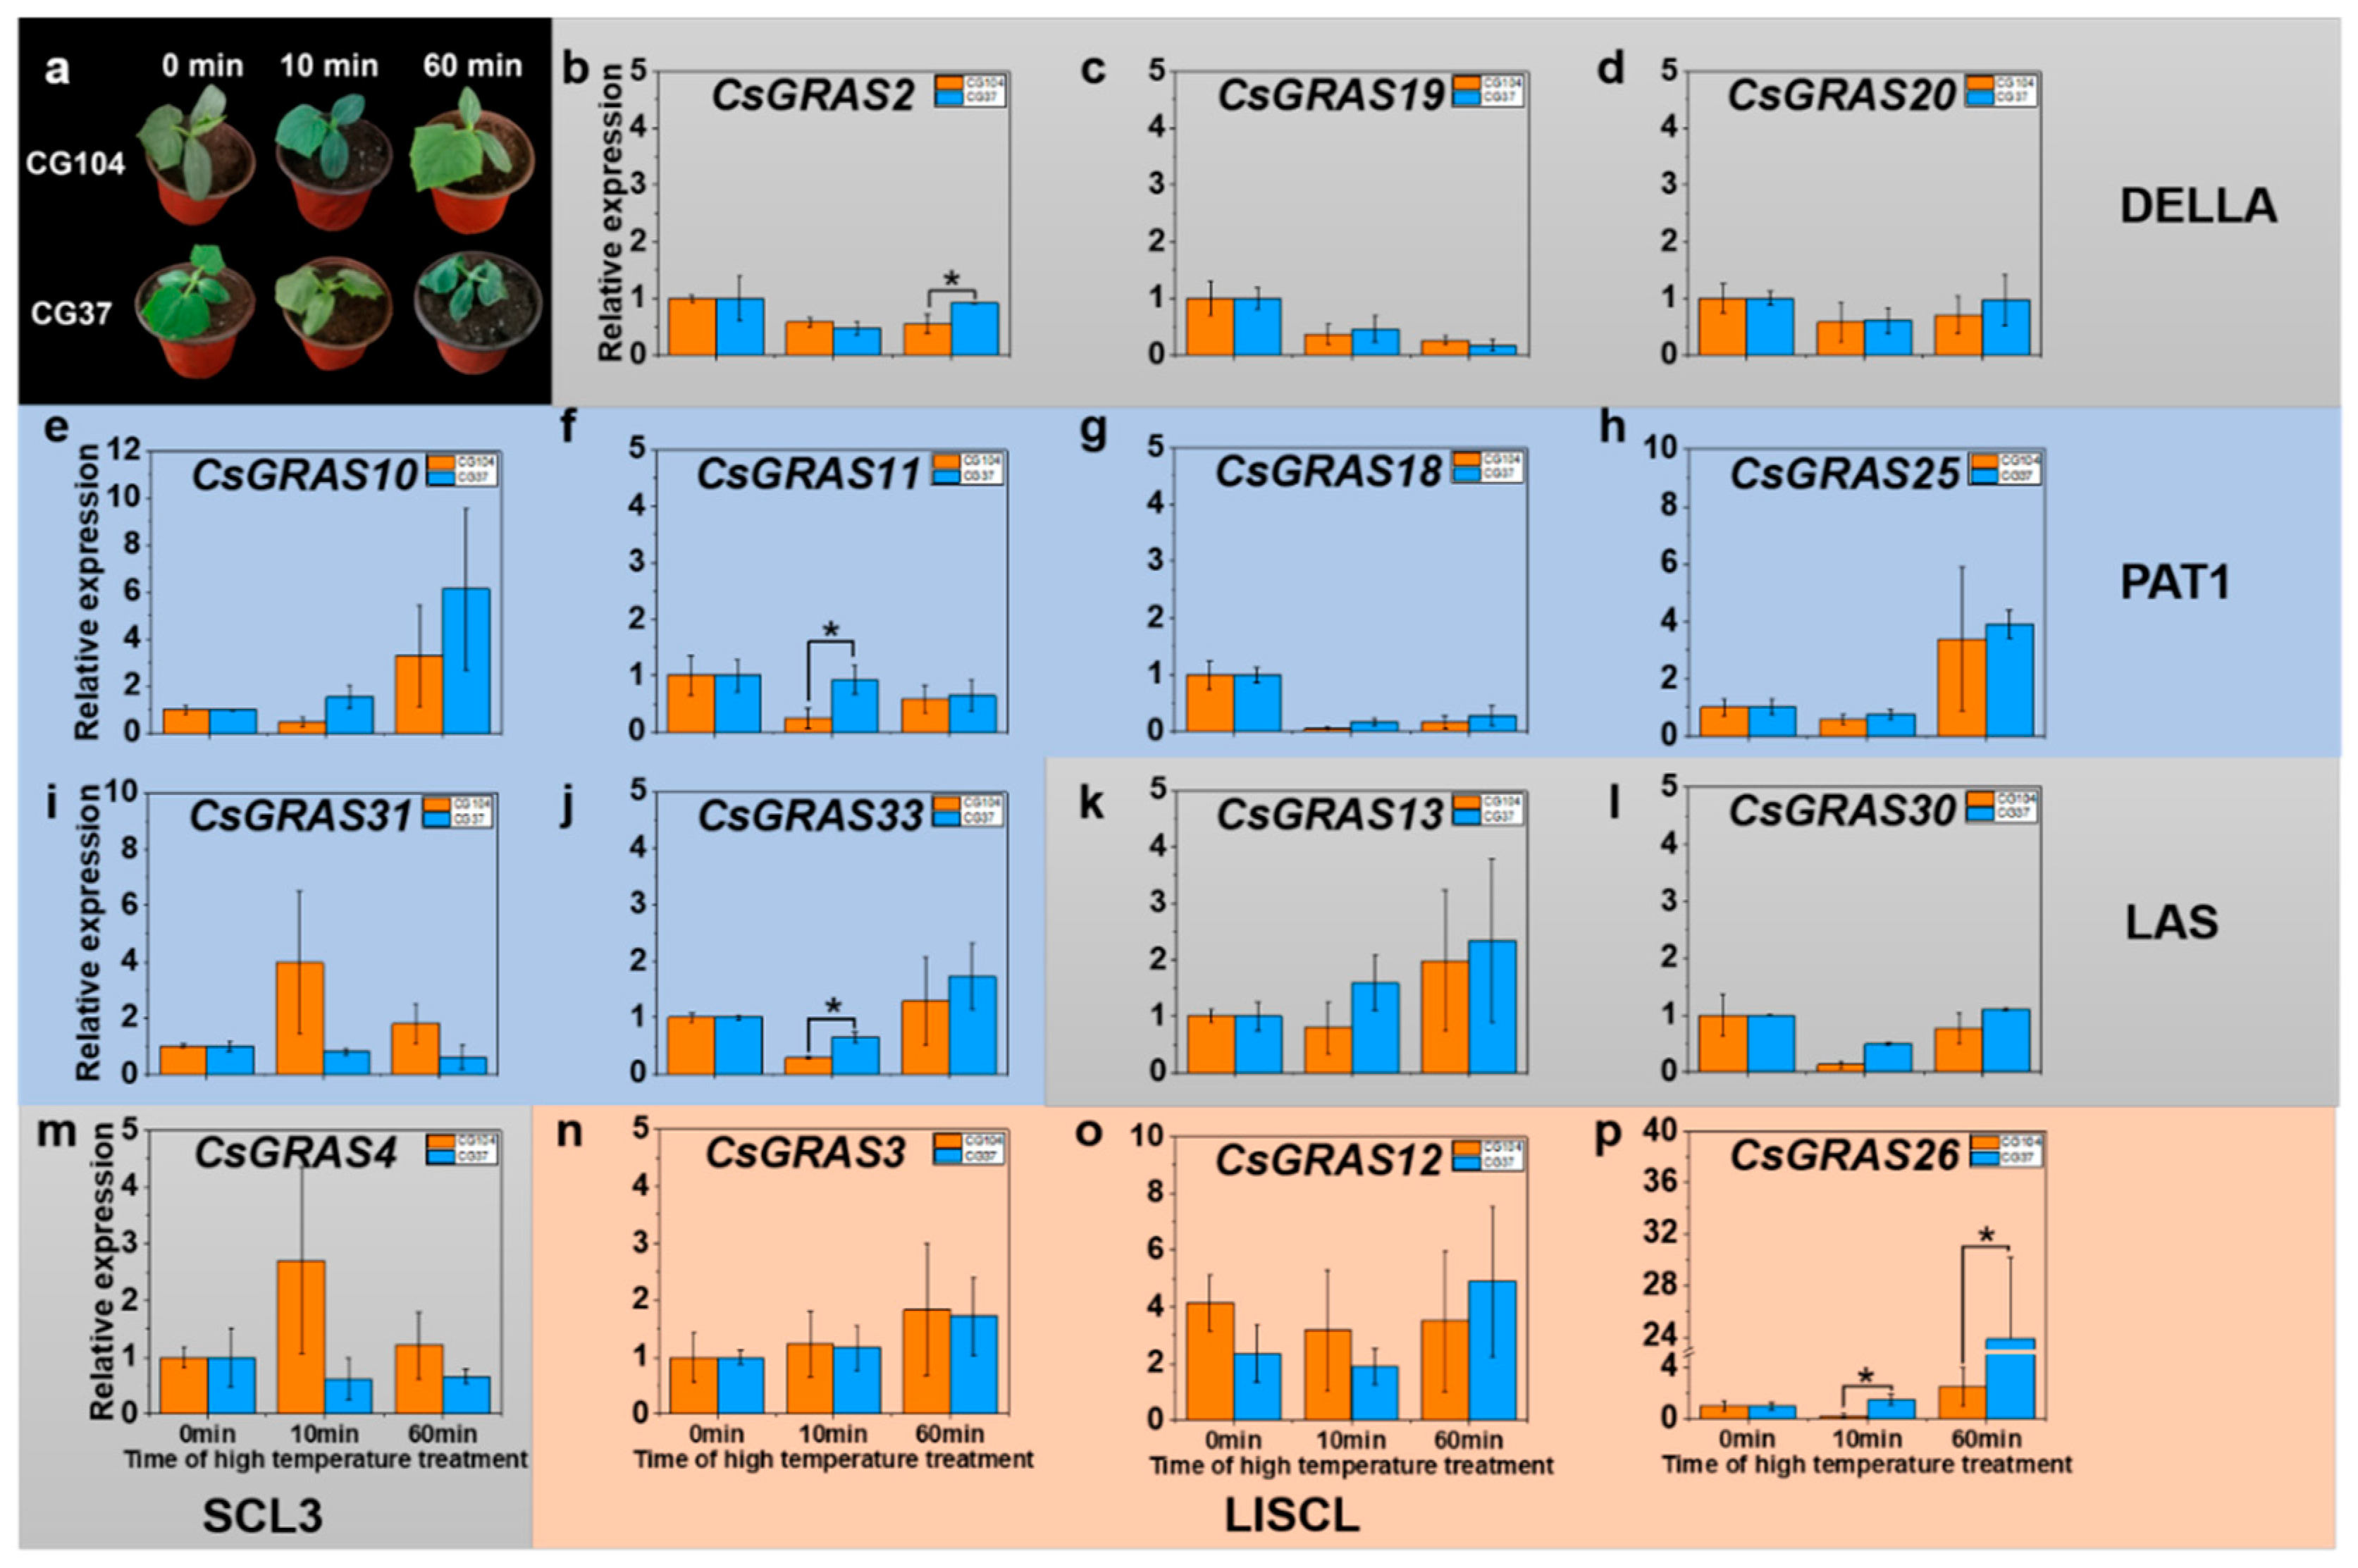
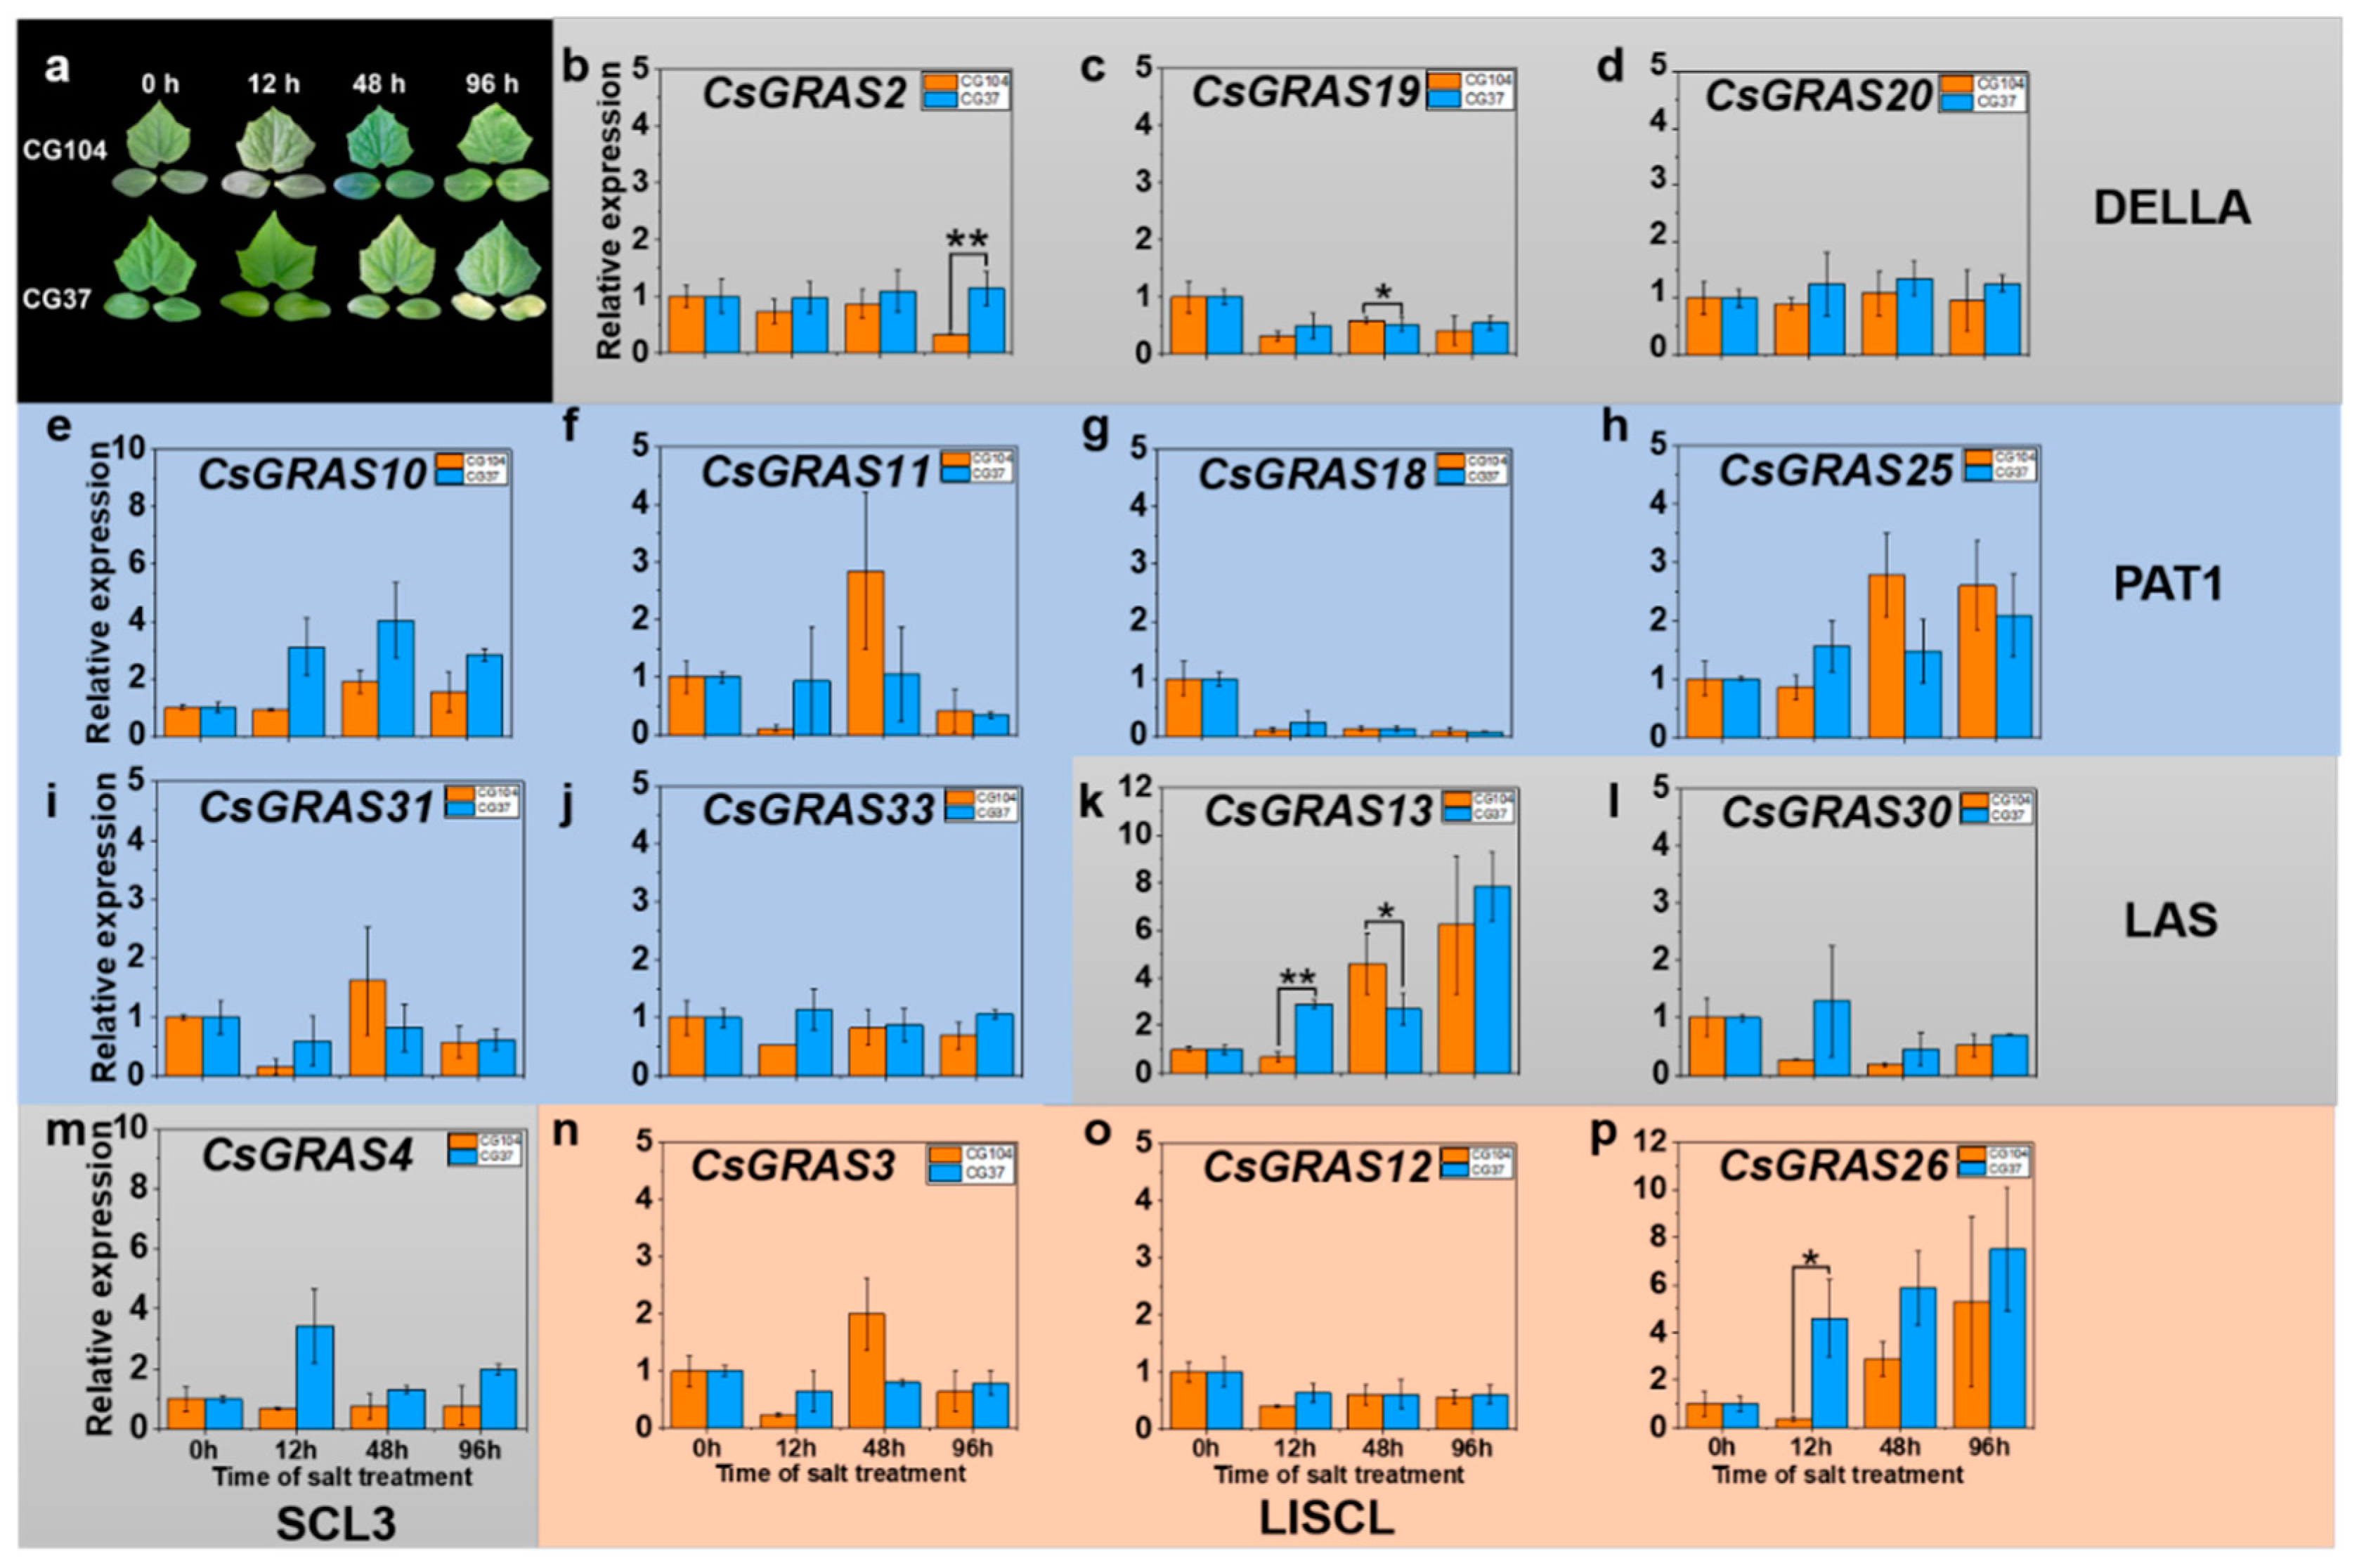
3.5. Expression Pattern of GRAS Genes under Various Abiotic Stresses in “CG104” and “CG37”

Numerous studies have revealed that the DELLA [41,64,65], LISCL [66], PAT1 [8,19,67], LAS [31,68], and SCL3 [69] subfamilies might regulate diverse signaling pathways involved in a wide range of abiotic stresses [8,14,67,70]. DELLA acts as a transcriptional repressor of the gibberellin (GA) signaling pathway [22,23], playing a pivotal role in regulating abiotic stress responses [41,71,72]. The SCL3 subfamily could participate in abiotic stress response by antagonizing the master growth repressor DELLA in Arabidopsis [25,69]. Intriguingly, phyA and phyB, acting as light sensors [73], could positively and negatively regulate cold tolerance, respectively [74,75]—for instance, through the CBFs-PIF3-phyB pathway in Arabidopsis [76]. Additionally, the PAT1 subfamily could further regulate the phyA and phyB signaling transduction pathways through the regulation of phytochrome signaling mechanisms [26,27,77]. LISCL positively regulated rice drought tolerance through activating stress-inducible promoters [66,78]. Meanwhile, transgenic Arabidopsis plants overexpressing PeSCL7 of the LAS subfamily showed enhanced drought and salt tolerance [31]. RNA-seq data indicated that the above five subfamilies are closely associated with abiotic stresses (chilling, low temperature, high temperature, and salt stress) (Table S9). Therefore, the time course expression patterns of 15 genes from these five subfamilies were further investigated using the cucumber lines “CG104” and “CG37”. The two-mature-leaf seedlings of “CG104” and “CG37” were exposed to low temperature (19 °C with 14 h of light/10 °C with 10 h of dark for two weeks), high temperature (50 °C), and salinity (200 mM NaCl), and qRT-PCR was performed (Figure 5, Figure 6 and Figure 7).
After two weeks of low temperature treatment, cotyledons and the first true leaf of the low-temperature-sensitive “CG37” showed severe withering and yellowing, while “CG104” had no symptoms (Figure 5a). Three genes (CsGRAS2, CsGRAS18, and CsGRAS19) were downregulated while six genes (CsGRAS3, CsGRAS10, CsGRAS13, CsGRAS25, CsGRAS26, and CsGRAS31) were upregulated at 10 h (Figure S6). Interestingly, the expression levels of CsGRAS2 and CsGRAS4 were significantly different at 10 h or 6 d in two materials, and their expression in “CG104” was significantly higher than that in “CG37” (Figure 5b,m). On the contrary, the expression level of CsGRAS26 was significantly lower in “CG104” than in “CG37” at 10 and 336 h (Figure 5i).
After 60 min of heat stress, cotyledons and the first true leaf of “CG37” showed dehydration symptoms (Figure 6a). Six CsGRAS genes including CsGRAS2, CsGRAS11, CsGRAS18, CsGRAS19, CsGRAS30, and CsGRAS33 were downregulated (Figure S7). However, the expression of four genes (CsGRAS2, CsGRAS11, CsGRAS26, and CsGRAS33) in “104” was lower than in “CG37” at 10 or 60 min (Figure 6).
After 96 h of 200 mM NaCl, cotyledons and the first true leaf of “CG37” become dehydrated and yellowed (Figure 7a). There are four genes (CsGRAS2, CsGRAS10, CsGRAS13, and CsGRAS26) that were upregulated and two genes (CsGRAS18 and CsGRAS19) that were downregulated by salinity (Figure S8). Moreover, the expressions of CsGRAS2 and CsGRAS26 were significantly different in two materials, with lower expression in “CG104” (Figure 7b,p), whereas the expression pattern in CsGRAS19 was opposite (Figure 7c).

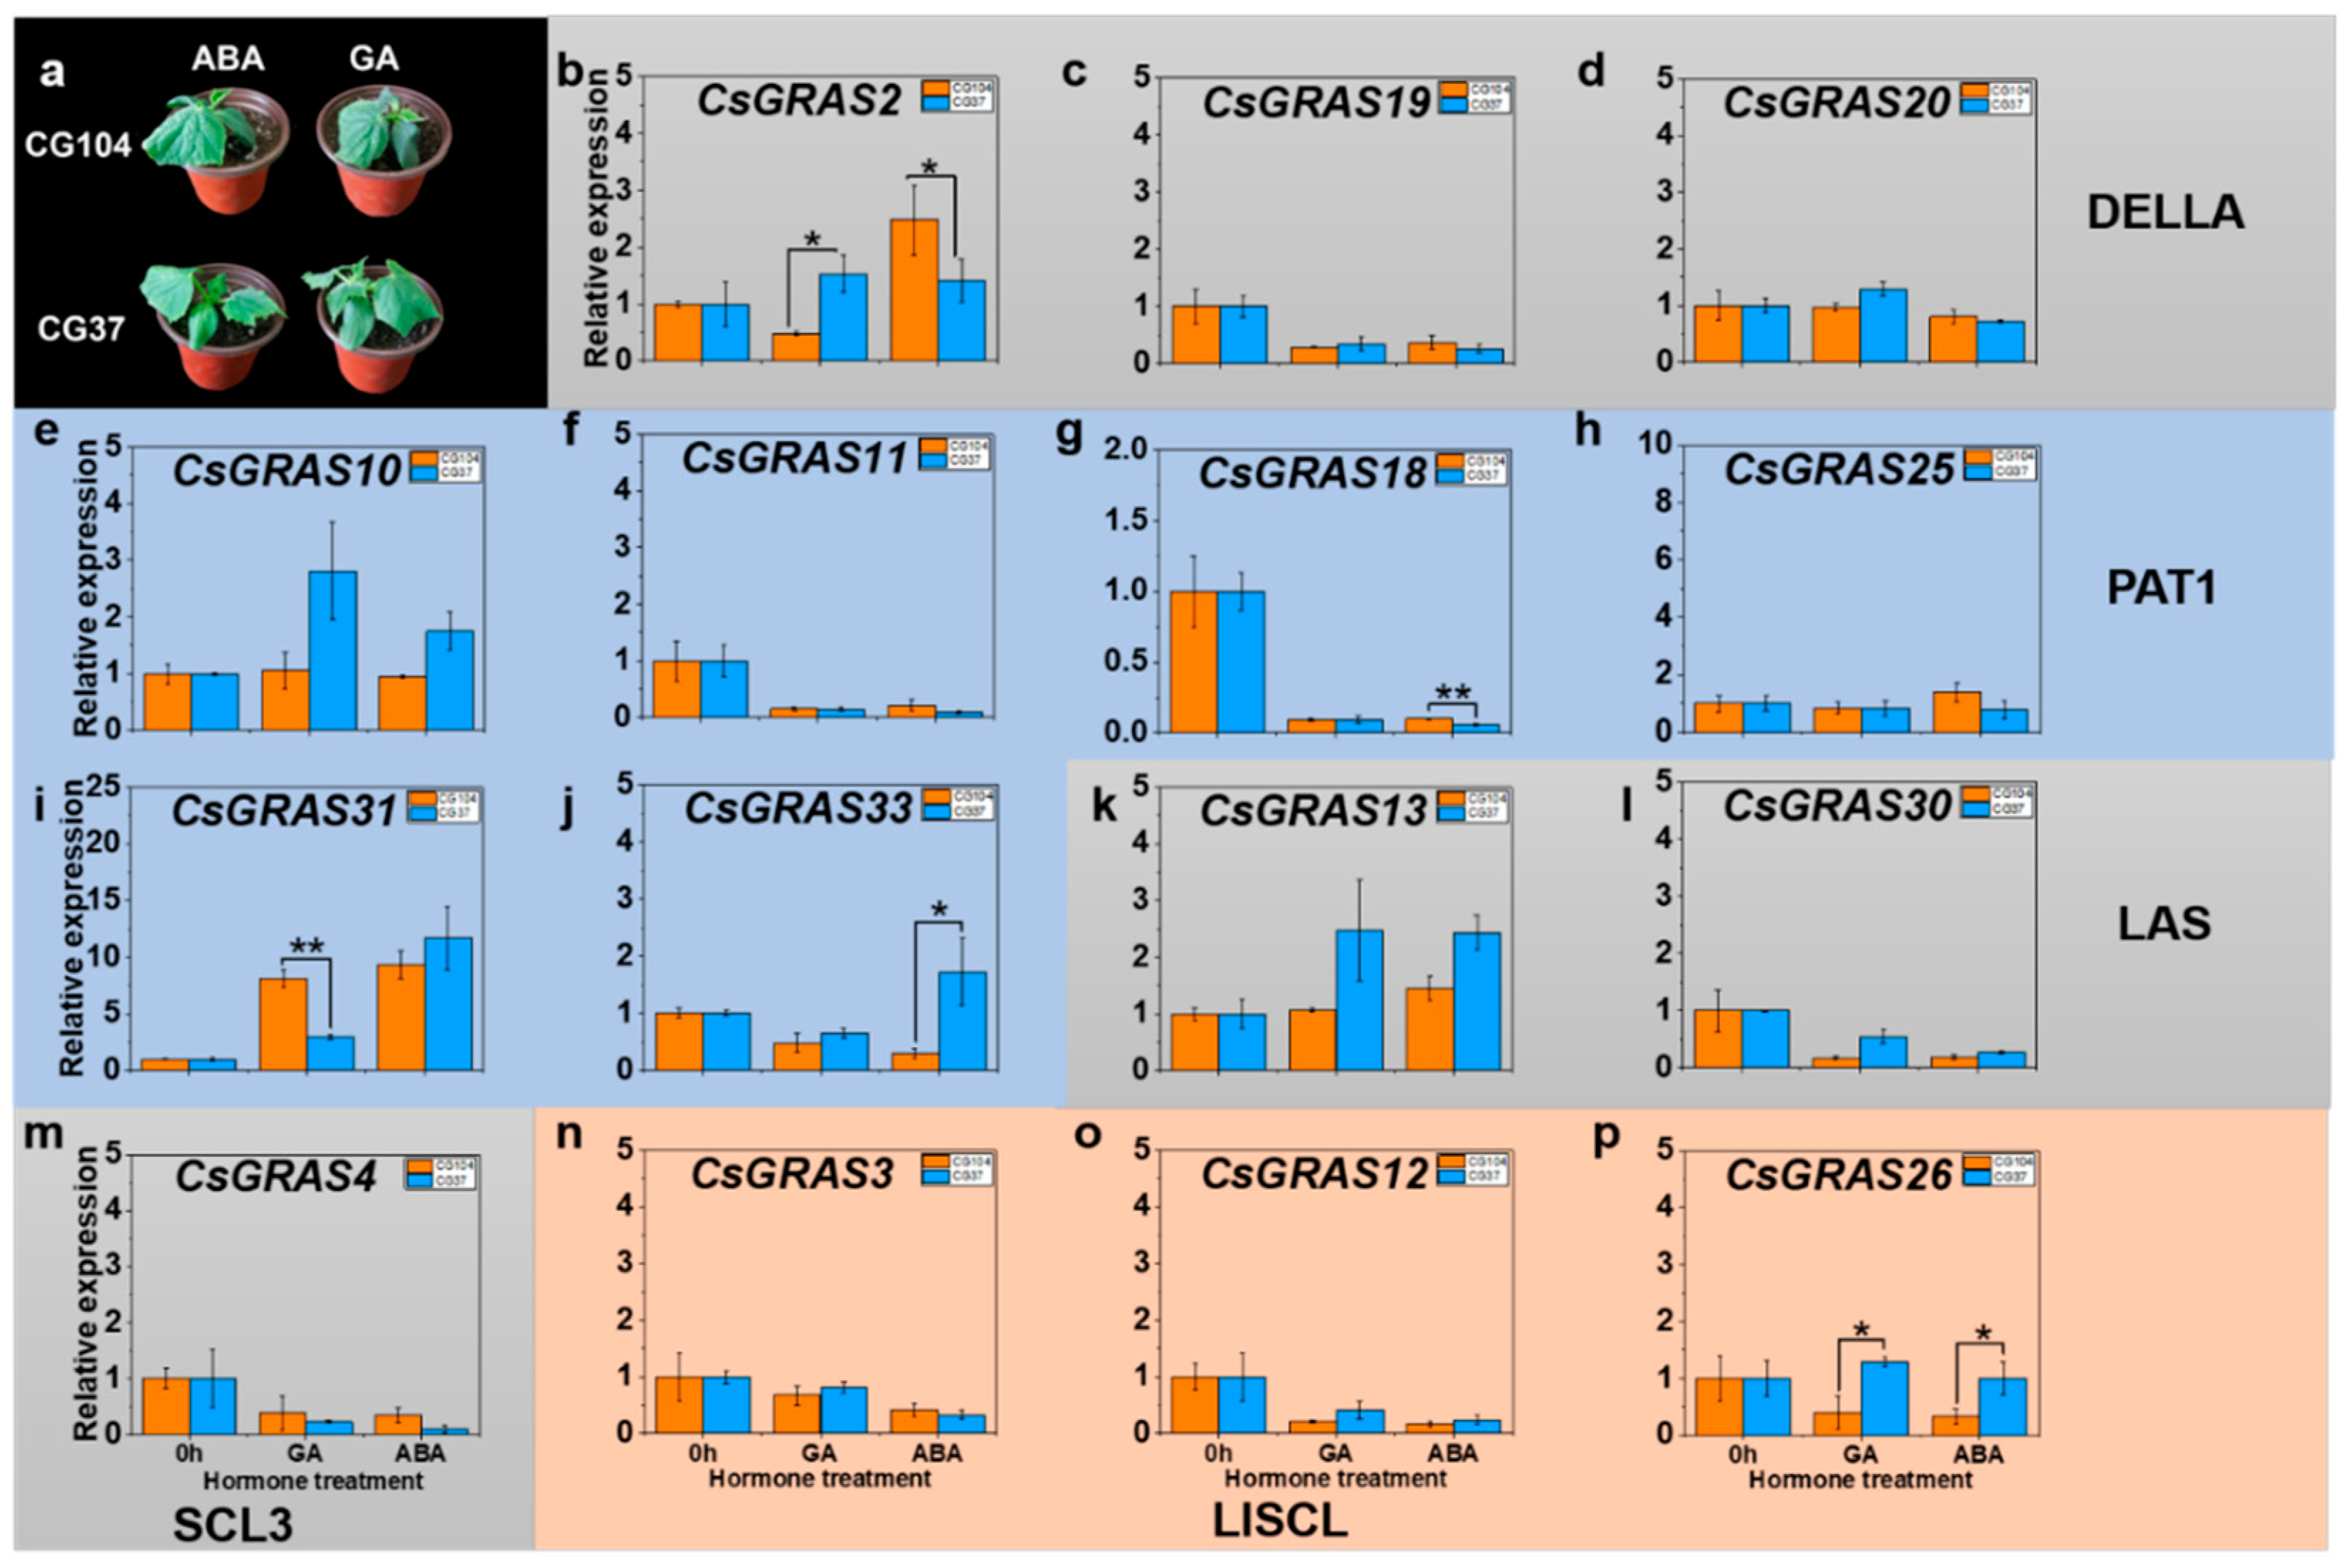
3.6. Expression Patterns of GRAS Genes after Exogenous Phytohormone Treatment in “CG104” and “CG37

In this study, the differential responses of GRAS genes to GA and ABA were compared between “CG104” and “CG37” by qRT-PCR (Figure 8). Six genes (CsGRAS4, CsGRAS11, CsGRAS12, CsGRAS18, CsGRAS19, and CsGRAS30) were downregulated by GA and ABA treatment, while CsGRAS31 was upregulated (Figure S9). In addition, CsGRAS2 and CsGRAS26 showed significant expressional differences between “CG104” and “CG37” after GA treatment, with lower levels in “CG104” (Figure 8b,p); however, the expression of CsGRAS31 in “CG104” is significantly higher than that in “CG37” (Figure 8i). In addition, the expression levels of four genes were significantly different between “CG104” and “CG37” after ABA treatment. CsGRAS2 and CsGRAS18 levels were significantly higher in “CG104” compared to “CG37” (Figure 8b,g), whereas CsGRAS33 and CsGRAS26 had lower expression levels in “CG104” (Figure 8j,p). Notably, CsGRAS2 and CsGRAS26 were concurrently induced by both GA and ABA phytohormones.

4. Discussion

In this study, a comprehensive genome-wide bioinformatic analysis of the cucumber GRAS gene family was performed. A total of 35 CsGRAS family genes were identified in cucumber, and these, along with GRAS members from Arabidopsis, rice, and tomato, were grouped into 11 clades based on their sequence relationships. Notably, the rice-specific Os4 and Os44 subfamilies were not detected in Arabidopsis. Previous reports have found that some GRAS subfamilies are species-specific, such as the Rc_GRAS subfamily in castor bean [67], the Pt20 subfamily in Populus [18], the Ca_GRAS subfamily in pepper [8], and the Me_GRAS family in cassava [19]. These data indicate that in some plant species, one or more subfamilies gradually became specialized during evolution, while in other species, that subfamily may have been lost [16]. These subfamilies have specific domains—for example, DELLA family members can be distinguished from other GRAS proteins by their distinct DELLA N-terminal, and the neighboring VHYNP domains [79]. What is more, the motifs of the same subfamily were similar, which further demonstrated that each domain was conserved and that the subfamily classification was reliable. Generally, conserved motifs were found in common in the CsGRAS proteins; however, their physical and chemical features were obviously different. Differences in amino acids in non-conserved regions result in this distinction, which suggests that the CsGRAS proteins may play different roles in their own microenvironment [14].
In this study, many cucumber GRAS genes were differentially regulated by salinity and by low and high temperature stress. These responses to different stresses may occur via common or different regulatory mechanisms. For example, CsGRAS26 was downregulated by high temperature stress but was upregulated by low temperature and salt stresses, while in contrast, CsGRAS33 was downregulated by low temperatures but was upregulated by high temperature stress. These data indicate that these genes, i.e., CsGRAS26 and CsGRAS33, respond to identical stresses via different mechanisms. However, in another example, CsGRAS2 and CsGRAS18 were downregulated by all four stress treatments, which suggests they might share common regulatory mechanisms or pathways, which is distinct from CsGRAS26 and CsGRAS33. Interestingly, no expression changes were detected in CsGRAS6 and CsGRAS8 under any of the stress treatments applied. This study also highlights the widespread involvement of GRAS genes in multiple environmental adaptations. Recently, the GRAS gene family in cucumber was found to have a potential role in cold tolerance [80]. In that study, a short-term (6 d), extreme cold stress (4 °C) was used, and they found that Csa_1G408720 (DELLA) was involved in regulating the CBF-regulatory cold pathway. In our study, we exposed cucumber seedlings to a long-term, mild cold stress (19 °C with 14 h of light/10 °C with 10 h of dark for 14 d); similarly, CsGRAS2 (Csa1G408720) responded to low temperature stress as well as other abiotic stress (e.g., high temperature and salt stresses).
Phytohormone signaling networks are essential to plant stress response. ABA plays a critical role in plant response to salinity and low and high temperature stresses [81]. GA is also pivotal in the molecular pathways to different stresses adaptation, particularly the GA biosynthetic gene GA20ox1 [82,83]. In this study, most of the CsGRAS genes were downregulated by GA and ABA treatments, especially CsGRAS31. These results indicated that the GRAS gene family may play a key role in the crosstalk among various phytohormones.
In this study, CsGRAS2 and CsGRAS26 were responsive to abiotic stresses including salinity, and low and high temperature stresses. Besides, they were induced by GA, a central regulator for growth in response to abiotic stress, and ABA, a hormone integrating various stress signals and controlling downstream responses. Our work indicated that they are key genes involved in environmental stress. The orthologs of CsGRAS2 and CsGRAS26 in Arabidopsis are GAI and SCL14, respectively. Studies have shown that GAI and SCL14 respond to abiotic stress via multiple regulatory pathways in Arabidopsis. The DELLA family members GAI and GAs, together, regulate abiotic stress response [84]. Patrick et al. [72] found that environmental change regulates DELLA activity, which, in turn, leads to DELLAs restraining plant growth and improving stress tolerance through the modulation of reactive oxygen species levels. GA binds to its receptor GID1 (GA-GID1-DELLA) to promote degradation of DELLAs, thus accelerating plant growth. Lucio et al. [85] found that the small ubiquitin-like modifier protein (SUMO)-DELLA sequesters GID1, allowing DELLA accumulation and the restraint of plant growth during stress. DELLAs also work together with other plant hormones to participate in stress regulation, for example, a Ser/Thr kinase1/Ethylene (CTR1/EIN3)-dependent and GA-DELLA-signaling pathway enables plant flexible adaptation in response to environmental adversity [86]. Additionally, DELLA modulates the CBF transcript to enhance cold tolerance by the phytochrome interacting factor 3 (PIF3) of Arabidopsis and the PIF4 of tomato [42,76]. A recent study indicated that SCL14, interacting with Class II TGA transcription factors, is crucial for stress response [87]. Therefore, the molecular mechanism of CsGRAS2 and CsGRAS26 in response to abiotic stress need further investigation.

5. Conclusions

In summary, we have provided a comprehensive bioinformatic analysis of 35 GRAS genes identified in the “Cucumber V2” genome and an analysis of their potential role in various abiotic stress for the first time. The expression of the CsGRAS genes suggests that they have tissue- and developmental stage-specific roles in plant growth and development, and that the expressions of many CsGRAS genes respond differently to abiotic stress and to phytohormone (GA and ABA) treatments. Transcripts of the CsGRAS2 (DELLA) and CsGRAS26 (LISCL) isoforms were modulated by all abiotic stresses and hormonal treatments used in this work, suggesting that they are potential key regulators in stress response. The results of this study improve our understanding of CsGRAS genes in plant abiotic stress response and provide the basis for further functional characterization of CsGRAS2 and CsGRAS26.

Supplementary Materials

The following are available online at https://www.mdpi.com/2311-7524/6/4/110/s1, Figure S1: Distribution of GRAS genes on cucumber chromosomes. Thirty-five GRAS genes renamed are shown on the right of each chromosome. Gene positions and chromosome size can be measured using the scale on the left of the figure in mega bases. Red colors in chromosome banding represent higher gene density, blue colors in chromosome banding represent lower gene density. Figure S2: The phylogenetic tree (a), gene structures (b) and motifs (c) of 35 GRAS genes identified in cucumber. The phylogenetic tree was constructed by MEGA-X with the maximum-likelihood method. (a) The same subfamilies are marked in orange or light blue. (b)Boxes with different colors indicate conserved motifs 1–20, and the combined P-values are shown on the left side of the figure. The length of motifs in each protein is shown proportionally and can be measured using the scale on the lower in amino acids (aa). The domain was listed in above. (c)UTRs are represented by yellow boxes, exons are represented by green boxes, and introns are represented by grey lines, respectively, the length of gene structures can be measured by the scale on the lower in mega bases (bp). Figure S3: Predicted protein-protein interaction network of CsGRAS proteins in cucumber based on interologs from Arabidopsis. Homologous cucumber genes were side. Square represent protein, the black line represents interaction. Red represents many interactions. Yellow represents few interactions. Figure S4: Heatmap representation and horizontal clustering of cucumber GRAS gene expression levels across root, stem, leaf, ovary fertilized, ovary, female, ovary unfertilized, male, tendril base and tendril. Log2 transformed values were used to generate the color-coded heatmap, and the color scale with red and blue represent high and low values, respectively, color scale from −3.0 to 3.0. Figure S5: Heat map of cucumber GRAS genes suffering from chilling stress and salt stress. (a) Expression profile of CsGRAS genes after chilling stress; (b) Expression profile of CsGRAS genes after salt stress. CS: Chilling stress, R: Resistant line, S: Susceptible line in bottom of the picture. Log2 transformed values were used to generate the color-coded heatmap. Figure S6: Expression pattern tendency of cucumber GRAS genes during low temperature treatment. The blue background represents down-regulated CsGRAS genes at 10 h after low temperature treatment. The orange background represents up-regulated CsGRAS genes at 10 h after low temperature treatment. The error bars show the standard error with three biological replicates. * represent “p < 0.05”. Figure S7: Expression pattern tendency of cucumber GRAS genes during high temperature treatment. The blue background represents down-regulated CsGRAS genes at 10 min after high temperature treatment. The error bars show the standard error with three biological replicates. * represent “p < 0.05”, ** represent “p < 0.05”. Figure S8: Expression pattern tendency of cucumber GRAS genes during salt treatment. The blue background represents down-regulated CsGRAS genes at 12 h after salt treatment. The orange background represents up-regulated CsGRAS genes at 12 h after salt treatment. The error bars show the standard error with three biological replicates. * represent “p < 0.05”. Figure S9: Expression pattern tendency of cucumber GRAS genes during hormone treatment. The blue background represents down-regulated CsGRAS genes after GA and ABA treatment. The orange background represents up-regulated CsGRAS genes after GA and ABA treatment. The error bars show the standard error with three biological replicates. * represent “p < 0.05”. Table S1: The primers information used for qRT-PCR in this paper.Table S2: HMMER and BLASTP search results of the GRAS gene family in cucumber. Table S3: Lists of the 35 GRAS genes in cucumber. Table S4: Nucleotide, CDS and amino acid sequences of 35 GRAS genes in cucumber. Table S5: Cucumber orthologous genes in tomato and Arabidopsis. Table S6: Gene lists from Arabidopsis, tomato and rice. Table S7: The structural features of motif 1-20. Table S8: Cucumber homologous genes list in Arabidopsis. Table S9: Expression levels of the CsGRAS genes in different tissues and after abiotic stress.

Author Contributions

C.L. and S.D. analyzed the data and drafted the manuscript. C.L. performed the experiments. X.L. and K.B. helped to collect the data. H.M. and D.M.B. helped analyzed the data. X.G. and S.Z. designed the experiments. All authors edited and have read and agreed to the published version of the manuscript.

Funding

This research was supported by National Key Research and Development Program of China (2018YFD1000800), the Earmarked Fund for Modern Agro-industry Technology Research System (CARS-23), the Science and Technology Innovation Program of the Chinese Academy of Agricultural Science (CAAS-ASTIP-IVFCAAS), the Key Laboratory of Biology and Genetic Improvement of Horticultural Crops, Ministry of Agriculture, P.R. China, Central Public-Interest Scientific Institution Basal Research Fund (No.Y2017PT52), and the National Natural Science Foundation of China (No. 31902028).

Conflicts of Interest

The authors declare no conflict of interest.

References

  1. Casaretto, J.; Ho, T.-H.D. The transcription factors HvABI5 and HvVP1 are required for the abscisic acid induction of gene expression in barley aleurone cells. Plant Cell 2003, 15, 271–284. [Google Scholar] [CrossRef] [PubMed] [Green Version]
  2. Zhu, J.-K. Salt and drought stress signal transduction in plants. Annu. Rev. Plant Biol. 2002, 53, 247–273. [Google Scholar] [CrossRef] [PubMed] [Green Version]
  3. Ling, J.; Jiang, W.; Zhang, Y.; Yu, H.; Mao, Z.; Gu, X.; Huang, S.; Xie, B. Genome-wide analysis of WRKY gene family in Cucumis sativus. BMC Genom. 2011, 12, 1–20. [Google Scholar] [CrossRef] [PubMed] [Green Version]
  4. Lei, N.; Yu, X.; Li, S.; Zeng, C.; Zou, L.; Liao, W.; Peng, M. Phylogeny and expression pattern analysis of TCP transcription factors in cassava seedlings exposed to cold and/or drought stress. Sci. Rep. 2017, 7, 1–13. [Google Scholar] [CrossRef] [PubMed]
  5. Hu, W.; Yang, H.; Yan, Y.; Wei, Y.; Tie, W.; Ding, Z.; Zuo, J.; Peng, M.; Li, K. Genome-wide characterization and analysis of bZIP transcription factor gene family related to abiotic stress in cassava. Sci. Rep. 2016, 6, 22783. [Google Scholar] [CrossRef] [Green Version]
  6. Peng, X.; Hui, L.; Dan, W.; Shen, S. Genome-wide identification of the Jatropha curcas MYB family and functional analysis of the abiotic stress responsive gene JcMYB2. BMC Genom. 2016, 17, 251. [Google Scholar] [CrossRef] [Green Version]
  7. Zhuo, X.; Zheng, T.; Zhang, Z.; Zhang, Y.; Jiang, L.; Ahmad, S.; Sun, L.; Wang, J.; Cheng, T.; Zhang, Q. Genome-Wide Analysis of the NAC Transcription Factor Gene Family Reveals Differential Expression Patterns and Cold-Stress Responses in the Woody Plant Prunus mume. Genes 2018, 9, 494. [Google Scholar] [CrossRef] [Green Version]
  8. Liu, B.; Sun, Y.; Xue, J.; Jia, X.; Li, R. Genome-wide characterization and expression analysis of GRAS gene family in pepper (Capsicum annuum L.). PeerJ 2018, 6, e4796. [Google Scholar] [CrossRef] [Green Version]
  9. Peng, J.; Carol, P.; Richards, D.E.; King, K.E.; Cowling, R.J.; Murphy, G.P.; Harberd, N.P. The Arabidopsis GAI gene defines a signaling pathway that negatively regulates gibberellin responses. Genes Dev. 1997, 11, 3194–3205. [Google Scholar] [CrossRef] [Green Version]
  10. Silverstone, A.L.; Ciampaglio, C.N.; Sun, T.-P. The Arabidopsis RGA gene encodes a transcriptional regulator repressing the gibberellin signal transduction pathway. Plant Cell 1998, 10, 155–169. [Google Scholar] [CrossRef] [Green Version]
  11. Laurenzio, L.D.; Wysocka-Diller, J.; Malamy, J.E.; Pysh, L.; Helariutta, Y.; Freshour, G.; Hahn, M.G.; Feldmann, K.A.; Benfey, P.N. The SCARECROW Gene Regulates an Asymmetric Cell Division That Is Essential for Generating the Radial Organization of the Arabidopsis Root. Cell 1996, 86, 423–433. [Google Scholar] [CrossRef] [Green Version]
  12. Tian, C.; Wan, P.; Sun, S.; Li, J.; Chen, M. Genome-Wide Analysis of the GRAS Gene Family in Rice andArabidopsis. Plant Mol. Biol. 2004, 54, 519–532. [Google Scholar] [CrossRef] [PubMed]
  13. Guo, P.; Wen, J.; Yang, J.; Ke, Y.; Du, H. Genome-wide survey and expression analyses of the GRAS gene family in Brassica napus reveals their roles in root development and stress response. Planta 2019, 250, 1051–1072. [Google Scholar] [CrossRef] [PubMed] [Green Version]
  14. Huang, W.; Xian, Z.; Kang, X.; Tang, N.; Li, Z. Genome-wide identification, phylogeny and expression analysis of GRAS gene family in tomato. BMC Plant Biol. 2015, 15, 1–18. [Google Scholar] [CrossRef] [Green Version]
  15. Guo, Y.; Hongyu, W.; Xiang, L.; Qi, L.; Xinyan, Z.; Xueqing, D.; Yanrong, A.; Wei, L.; Hailong, A.; Meng-xiang, S. Identification and expression of GRAS family genes in maize (Zea mays L.). PLoS ONE 2017, 12, e0185418. [Google Scholar] [CrossRef] [Green Version]
  16. Lu, J.; Wang, T.; Xu, Z.; Sun, L.; Zhang, Q. Genome-wide analysis of the GRAS gene family in Prunus mume. Mol. Genet. Genom. 2014, 290, 303–317. [Google Scholar] [CrossRef]
  17. Sun, X.; Xue, B.; Jones, W.T.; Rikkerink, E.; Dunker, A.K.; Uversky, V.N. A functionally required unfoldome from the plant kingdom: Intrinsically disordered N-terminal domains of GRAS proteins are involved in molecular recognition during plant development. Plant Mol. Biol. 2011, 77, 205–223. [Google Scholar] [CrossRef]
  18. Liu, X.; Widmer, A. Genome-wide Comparative Analysis of the GRAS Gene Family in Populus, Arabidopsisand Rice. Plant Mol. Biol. Report. 2014, 32, 1129–1145. [Google Scholar] [CrossRef]
  19. Song, L.; Tao, L.; Cui, H.; Ling, L.; Guo, C. Genome-wide identification and expression analysis of the GRAS family proteins in Medicago truncatula. Acta Physiol. Plant. 2017, 39, 93. [Google Scholar] [CrossRef]
  20. Alberto, C.; Mathieu, R. Evolutionary Analyses of GRAS Transcription Factors in Angiosperms. Front. Plant Sci. 2017, 8, 273. [Google Scholar] [CrossRef]
  21. Heo, J.O.; Chang, K.S.; Kim, I.A.; Lee, M.H.; Lee, S.A.; Song, S.K.; Lee, M.M.; Lim, J. Funneling of gibberellin signaling by the GRAS transcription regulator SCARECROW-LIKE 3 in the Arabidopsis root. Proc. Natl. Acad. Sci. USA 2011, 108, 2166–2171. [Google Scholar] [CrossRef] [PubMed] [Green Version]
  22. VanWallendael, A.; Soltani, A.; Emery, N.C.; Peixoto, M.M.; Olsen, J.; Lowry, D.B. A Molecular View of Plant Local Adaptation: Incorporating Stress-Response Networks. Annu. Rev. Plant Biol. 2019, 70, 559–583. [Google Scholar] [CrossRef] [PubMed] [Green Version]
  23. Sun, T.P.; Gubler, F. Molecular mechanism of gibberellin signaling in plants. Annu. Rev. Plant Biol. 2004, 55, 197–223. [Google Scholar] [CrossRef] [PubMed] [Green Version]
  24. Dill, A.; Sun, T.-P. Synergistic derepression of gibberellin signaling by removing RGA and GAI function in Arabidopsis thaliana. Genetics 2001, 159, 777–785. [Google Scholar] [PubMed]
  25. Zhang, Z.L.; Ogawa, M.; Fleet, C.M.; Zentella, R.; Hu, J.; Heo, J.O.; Lim, J.; Kamiya, Y.; Yamaguchi, S.; Sun, T. SCARECROW-LIKE 3 promotes gibberellin signaling by antagonizing master growth repressor DELLA in Arabidopsis. Proc. Natl. Acad. Sci. USA 2011, 108, 2160–2165. [Google Scholar] [CrossRef] [PubMed] [Green Version]
  26. Bolle, C.; Koncz, C.; Chua, N.H. PAT1, a new member of the GRAS family, is involved in phytochrome A signal transduction. Genome Res. 2000, 14, 1269–1278. [Google Scholar]
  27. Torres-Galea, P.; Hirtreiter, B.; Bolle, C. Two GRAS Proteins, SCARECROW-LIKE21 and PHYTOCHROME A SIGNAL TRANSDUCTION1, Function Cooperatively in Phytochrome A Signal Transduction. Plant Physiol. 2012, 161, 291–304. [Google Scholar] [CrossRef] [Green Version]
  28. Li, X.; Qian, Q.; Fu, Z.; Wang, Y.; Xiong, G.; Zeng, D.; Wang, X.; Liu, X.; Teng, S.; Hiroshi, F.; et al. Control of tillering in rice. Nat. Cell Biol. 2003, 422, 618–621. [Google Scholar] [CrossRef]
  29. Schumacher, K.; Schmitt, T.; Rossberg, M.; Schmitz, G.; Theres, K. The Lateral suppressor (Ls) gene of tomato encodes a new member of the VHIID protein family. Proc. Natl. Acad. Sci. USA 1999, 96, 290–295. [Google Scholar] [CrossRef] [Green Version]
  30. Greb, T.; Clarenz, O.; Schäfer, E.; Müller, D.; Herrero, R.; Schmitz, G.; Theres, K. Molecular analysis of the LATERAL SUPPRESSOR gene in Arabidopsis reveals a conserved control mechanism for axillary meristem formation. Genes Dev. 2003, 17, 1175–1187. [Google Scholar] [CrossRef] [Green Version]
  31. Ma, H.S.; Dan, L.; Peng, S.; Xia, X.L.; Yin, W.L. The salt− and drought−inducible poplar GRAS protein SCL7 confers salt and drought tolerance in Arabidopsis thaliana. J. Exp. Bot. 2010, 61, 4011–4019. [Google Scholar] [CrossRef] [PubMed] [Green Version]
  32. Park, H.; Jung, W.; Lee, S.; Song, J.; Kwon, S.Y.; Kim, H.R.; Kim, C.W.; Ahn, J.; Cho, H. Use of Heat Stress Responsive Gene Expression Levels for Early Selection of Heat Tolerant Cabbage (Brassica oleracea L.). Int. J. Mol. Sci. 2013, 14, 11871–11894. [Google Scholar] [CrossRef] [PubMed] [Green Version]
  33. Chen, B.; Saltveit, M.E.; Beckles, D.M. Chilling-stress modifies DNA methylation level in cucumber (Cucumis sativus L.) seedling radicle to regulate elongation rate. Sci. Hortic. 2019, 252, 14–19. [Google Scholar] [CrossRef]
  34. Smeets, L.; Wehner, T.C. Environmental effects on genetic variation of chilling resistance in cucumber. Sci. Hortic. 2019, 252, 14–19. [Google Scholar] [CrossRef]
  35. Dong, S.; Wang, W.; Bo, K.; Miao, H.; Song, Z.; Wei, S.; Zhang, S.; Gu, X. Quantitative Trait Loci mapping and candidate gene analysis of low temperature tolerance in cucumber seedlings. Front. Plant Sci. 2019, 10, 1620. [Google Scholar] [CrossRef] [PubMed]
  36. Yu, S.-C.; Wang, Y.-J. Inheritance of Heat Tolerance in Cucumber. Acta Agric. Boreali—Sin. 2003, 3. Available online: http://en.cnki.com.cn/Article_en/CJFDTotal-HBNB200303024.htm (accessed on 21 December 2020). (In Chinese).
  37. Yildirim, E.; Turan, M.; Guvenc, I. Effect of foliar salicylic acid applications on growth, chlorophyll, and mineral content of cucumber grown under salt stress. J. Plant Nutr. 2008, 31, 593–612. [Google Scholar] [CrossRef]
  38. Zhu, J.-K. Abiotic stress signaling and responses in plants. Cell 2016, 167, 313–324. [Google Scholar] [CrossRef] [Green Version]
  39. Magome, H.; Yamaguchi, S.; Hanada, A.; Kamiya, Y.; Oda, K. dwarf and delayed−flowering 1, a novel Arabidopsis mutant deficient in gibberellin biosynthesis because of overexpression of a putative AP2 transcription factor. Plant J. 2004, 37, 720–729. [Google Scholar] [CrossRef]
  40. Magome, H.; Yamaguchi, S.; Hanada, A.; Kamiya, Y.; Oda, K. The DDF1 transcriptional activator upregulates expression of a gibberellin−deactivating gene, GA2ox7, under high−salinity stress in Arabidopsis. Plant J. 2008, 56, 613–626. [Google Scholar] [CrossRef]
  41. Achard, P.; Gong, F.; Cheminant, S.; Alioua, M.; Hedden, P.; Genschik, P. The cold-inducible CBF1 factor–dependent signaling pathway modulates the accumulation of the growth-repressing DELLA proteins via its effect on gibberellin metabolism. Plant Cell 2008, 20, 2117–2129. [Google Scholar] [CrossRef] [PubMed] [Green Version]
  42. Wang, F.; Chen, X.; Dong, S.; Jiang, X.; Wang, L.; Yu, J.; Zhou, Y. Crosstalk of PIF4 and DELLA modulates CBF transcript and hormone homeostasis in cold response in tomato. Plant Biotechnol. J. 2020, 18, 1041–1055. [Google Scholar] [CrossRef] [PubMed]
  43. Liu, X.; Wang, T.; Ezra, B.; Kezia, B.; Dong, M.; Zhang, Y.; Yang, S.; Cai, Y.; Xue, S.; Weng, Y. Comprehensive analysis of NAC transcription factors and their expression during fruit spine development in cucumber (Cucumis sativus L.). Hortic. Res. 2018, 5, 31. [Google Scholar] [CrossRef] [PubMed]
  44. Liu, S.Q.; Hu, L.F. Genome-wide analysis of the auxin response factor gene family in cucumber. Genet. Mol. Res. 2013, 12, 4317–4331. [Google Scholar] [CrossRef]
  45. Hu, L.; Liu, S. Genome-wide analysis of the MADS-box gene family in cucumber. Genome 2012, 55, 245–256. [Google Scholar] [CrossRef]
  46. Zhou, S.J.; Jing, Z.; Shi, J.L. Genome-wide identification, characterization, and expression analysis of the MLO gene family in Cucumis sativus. Genet. Mol. Res. 2013, 12, 6565–6578. [Google Scholar] [CrossRef]
  47. Schouten, H.J.; Krauskopf, J.; Visser, R.G.F.; Bai, Y. Identification of candidate genes required for susceptibility to powdery or downy mildew in cucumber. Euphytica 2014, 200, 475–486. [Google Scholar] [CrossRef] [Green Version]
  48. Huang, S.; Li, R.; Zhang, Z.; Li, L.; Gu, X.; Fan, W.; Lucas, W.J.; Wang, X.; Xie, B.; Ni, P.; et al. The genome of the cucumber, Cucumis sativus L. Nat. Genet. 2009, 41, 1275–1281. [Google Scholar] [CrossRef] [Green Version]
  49. Chen, C.; Chen, H.; Zhang, Y.; Thomas, H.R.; Xia, R. TBtools: An Integrative Toolkit Developed for Interactive Analyses of Big Biological Data. Mol. Plant 2020, 13, 1194–1202. [Google Scholar] [CrossRef]
  50. Potter, S.C.; Aurélien, L.; Eddy, S.R.; Youngmi, P.; Rodrigo, L.; Finn, R.D. HMMER web server: 2018 update. Nucleic Acids Res. 2018, 46, W200–W204. [Google Scholar] [CrossRef] [Green Version]
  51. Larkin, M.A.; Blackshields, G.; Brown, N.P.; Chenna, R.; McGettigan, P.A.; McWilliam, H.; Valentin, F.; Wallace, I.M.; Wilm, A.; Lopez, R. Clustal W and Clustal X version 2.0. Bioinformatics 2007, 23, 2947–2948. [Google Scholar] [CrossRef] [PubMed] [Green Version]
  52. Sudhir, K.; Glen, S.; Li, M.; Christina, K.; Koichiro, T. MEGA X: Molecular Evolutionary Genetics Analysis across Computing Platforms. Mol. Biol. Evol. 2018, 35, 1547–1549. [Google Scholar] [CrossRef]
  53. Elisabeth, G.; Alexandre, G.; Christine, H.; Ivan, I.; Appel, R.D.; Amos, B. ExPASy: The proteomics server for in-depth protein knowledge and analysis. Nucleic Acids Res. 2003, 31, 3784–3788. [Google Scholar] [CrossRef] [Green Version]
  54. Bailey, T.L.; Nadya, W.; Chris, M.; Li, W.W. MEME: Discovering and analyzing DNA and protein sequence motifs. Nucleic Acids Res. 2006, 34, W369–W373. [Google Scholar] [CrossRef]
  55. Lescot, M.; Déhais, P.; Thijs, G.; Marchal, K.; Moreau, Y.; Van de Peer, Y.; Rouzé, P.; Rombauts, S. PlantCARE, a database of plant cis-acting regulatory elements and a portal to tools for in silico analysis of promoter sequences. Nucleic Acids Res. 2002, 30, 325–327. [Google Scholar] [CrossRef]
  56. Franceschini, A.; Szklarczyk, D.; Frankild, S.; Kuhn, M.; Jensen, L.J. STRING V9.1: Protein-Protein Interaction Networks, with Increased Coverage and Integration. Nucleic Acids Res. 2012, 41, D808–D815. [Google Scholar] [CrossRef] [Green Version]
  57. Shannon, P. Cytoscape: A Software Environment for Integrated Models of Biomolecular Interaction Networks. Genome Res. 2003, 13, 2498–2504. [Google Scholar] [CrossRef]
  58. Trapnell, C.; Williams, B.A.; Pertea, G.; Mortazavi, A.; Kwan, G.; Van Baren, M.J.; Salzberg, S.L.; Wold, B.J.; Pachter, L. Transcript assembly and quantification by RNA-Seq reveals unannotated transcripts and isoform switching during cell differentiation. Nat. Biotechnol. 2010, 28, 511–515. [Google Scholar] [CrossRef] [Green Version]
  59. Woffelman, C. DNAMAN for Windows; Lynon Biosoft, Institute of Molecular Plant Sciences, Leiden University: Leiden, The Netherlands, 2004. [Google Scholar]
  60. Livak, K.J.; Schmittgen, T.D. Analysis of relative gene expression data using real-time quantitative PCR and the 2− ΔΔCT method. Methods 2001, 25, 402–408. [Google Scholar] [CrossRef]
  61. Rieu, I.; Powers, S.J. Real-time quantitative RT-PCR: Design, calculations, and statistics. Plant Cell 2009, 21, 1031–1033. [Google Scholar] [CrossRef] [Green Version]
  62. Koornneef, M.; Jorna, M.; Brinkhorst-Van der Swan, D.; Karssen, C. The isolation of abscisic acid (ABA) deficient mutants by selection of induced revertants in non-germinating gibberellin sensitive lines of Arabidopsis thaliana (L.) Heynh. Theor. Appl. Genet. 1982, 61, 385–393. [Google Scholar] [CrossRef] [PubMed]
  63. Yang, L.; Jiang, Z.; Liu, S.; Lin, R. Interplay between REVEILLE1 and RGA−LIKE2 regulates seed dormancy and germination in Arabidopsis. New Phytol. 2019, 225, 1593–1605. [Google Scholar] [CrossRef] [PubMed]
  64. Achard, P.; Genschik, P. Releasing the brakes of plant growth: How GAs shutdown DELLA proteins. J. Exp. Bot. 2009, 60, 1085–1092. [Google Scholar] [CrossRef] [PubMed] [Green Version]
  65. Yao, T.; Bai, S.; Li, M.; Zhang, Y.; He, Y. DELLA contribute to tolerance to nitric oxide stress in Arabidopsis seedlings. Chin. Bull. Bot. 2011, 46, 481–488. [Google Scholar] [CrossRef]
  66. Xu, K.; Chen, S.; Li, T.; Ma, X.; Liang, X.; Ding, X.; Liu, H.; Luo, L. OsGRAS23, a rice GRAS transcription factor gene, is involved in drought stress response through regulating expression of stress-responsive genes. BMC Plant Biol. 2015, 15, 141. [Google Scholar] [CrossRef] [Green Version]
  67. Xu, W.; Chen, Z.; Ahmed, N.; Han, B.; Cui, Q.; Liu, A. Genome-wide identification, evolutionary analysis, and stress responses of the GRAS gene family in castor beans. Int. J. Mol. Sci. 2016, 17, 1004. [Google Scholar] [CrossRef] [Green Version]
  68. Yang, M.; Yang, Q.; Fu, T.; Zhou, Y. Overexpression of the Brassica napusBnLAS gene in Arabidopsis affects plant development and increases drought tolerance. Plant Cell Rep. 2011, 30, 373–388. [Google Scholar] [CrossRef]
  69. Torres-Galea, P.; Huang, L.-F.; Chua, N.-H.; Bolle, C. The GRAS protein SCL13 is a positive regulator of phytochrome-dependent red light signaling, but can also modulate phytochrome A responses. Mol. Genet. Genom. 2006, 276, 13–30. [Google Scholar] [CrossRef]
  70. Zhang, H.; Cao, Y.; Shang, C.; Li, J.; Wang, J.; Wu, Z.; Ma, L.; Qi, T.; Fu, C.; Bai, Z. Genome-wide characterization of GRAS family genes in Medicago truncatula reveals their evolutionary dynamics and functional diversification. PLoS ONE 2017, 12, e0185439. [Google Scholar] [CrossRef]
  71. Colebrook, E.H.; Thomas, S.G.; Phillips, A.L.; Hedden, P. The role of gibberellin signalling in plant responses to abiotic stress. J. Exp. Biol. 2013, 217, 67–75. [Google Scholar] [CrossRef] [Green Version]
  72. Achard, P.; Renou, J.-P.; Berthomé, R.; Harberd, N.P.; Genschik, P. Plant DELLAs restrain growth and promote survival of adversity by reducing the levels of reactive oxygen species. Curr. Biol. 2008, 18, 656–660. [Google Scholar] [CrossRef] [PubMed] [Green Version]
  73. Jung, J.-H.; Domijan, M.; Klose, C.; Biswas, S.; Ezer, D.; Gao, M.; Khattak, A.K.; Box, M.S.; Charoensawan, V.; Cortijo, S. Phytochromes function as thermosensors in Arabidopsis. Science 2016, 354, 886–889. [Google Scholar] [CrossRef] [PubMed] [Green Version]
  74. Wang, F.; Guo, Z.; Li, H.; Wang, M.; Onac, E.; Zhou, J.; Xia, X.; Shi, K.; Yu, J.; Zhou, Y. Phytochrome A and B function antagonistically to regulate cold tolerance via abscisic acid-dependent jasmonate signaling. Plant Physiol. 2016, 170, 459–471. [Google Scholar] [CrossRef] [PubMed] [Green Version]
  75. Franklin, K.A.; Whitelam, G.C. Light-quality regulation of freezing tolerance in Arabidopsis thaliana. Nat. Genet. 2007, 39, 1410. [Google Scholar] [CrossRef] [PubMed]
  76. Jiang, B.; Shi, Y.; Peng, Y.; Jia, Y.; Yan, Y.; Dong, X.; Li, H.; Dong, J.; Li, J.; Gong, Z. Cold-Induced CBF-PIF3 Interaction Enhances Freezing Tolerance by Stabilizing the phyB Thermosensor in Arabidopsis. Mol. Plant 2020, 13, 894–906. [Google Scholar] [CrossRef]
  77. Bolle, C. The role of GRAS proteins in plant signal transduction and development. Planta 2004, 218, 683–692. [Google Scholar] [CrossRef]
  78. Tong, H.; Jin, Y.; Liu, W.; Li, F.; Fang, J.; Yin, Y.; Qian, Q.; Zhu, L.; Chu, C. DWARF AND LOW−TILLERING, a new member of the GRAS family, plays positive roles in brassinosteroid signaling in rice. Plant J. 2009, 58, 803–816. [Google Scholar] [CrossRef]
  79. Pysh, L.D.; Wysocka-Diller, J.W.; Camilleri, C.; Bouchez, D.; Benfey, P.N. The GRAS gene family in Arabidopsis: Sequence characterization and basic expression analysis of the scarecrow-like genes. Plant J. 1999, 18, 111–119. [Google Scholar] [CrossRef]
  80. Lu, X.; Liu, W.; Xiang, C.; Li, X.; Wang, Q.; Wang, T.; Liu, Z.; Zhang, J.; Gao, L.; Zhang, W. Genome-Wide Characterization of GRAS Family and Their Potential Roles in Cold Tolerance of Cucumber (Cucumis sativus L.). Int. J. Mol. Sci. 2020, 21, 3857. [Google Scholar] [CrossRef]
  81. Suzuki, N.; Bassil, E.; Hamilton, J.S.; Inupakutika, M.A.; Zandalinas, S.I.; Tripathy, D.; Luo, Y.; Dion, E.; Fukui, G.; Kumazaki, A. ABA is required for plant acclimation to a combination of salt and heat stress. PLoS ONE 2016, 11, e0147625. [Google Scholar] [CrossRef] [Green Version]
  82. Lim, S.; Park, J.; Lee, N.; Jeong, J.; Toh, S.; Watanabe, A.; Kim, J.; Kang, H.; Kim, D.H.; Kawakami, N.; et al. ABA-insensitive3, ABA-insensitive5, and DELLAs Interact to Activate the Expression of SOMNUS and Other High-Temperature-Inducible Genes in Imbibed Seeds in Arabidopsis. Plant Cell 2013, 25, 4863–4878. [Google Scholar] [CrossRef] [PubMed] [Green Version]
  83. Luo, Y.; Dong, X.; Yu, T.; Shi, X.; Li, Z.; Yang, W.; Widmer, A.; Karrenberg, S. A Single Nucleotide Deletion in Gibberellin20-oxidase1 Causes Alpine Dwarfism in Arabidopsis. Plant Physiol. 2015, 168, 930–937. [Google Scholar] [CrossRef] [PubMed] [Green Version]
  84. Lantzouni, O.; Alkofer, A.; Falter-Braun, P.; Schwechheimer, C. Growth-regulating factors interact with Dellas and Regulate Growth in Cold Stress. Plant Cell 2020, 32, 1018–1034. [Google Scholar] [CrossRef] [PubMed]
  85. Conti, L.; Nelis, S.; Zhang, C.; Woodcock, A.; Swarup, R.; Galbiati, M.; Tonelli, C.; Napier, R.; Hedden, P.; Bennett, M.; et al. Small Ubiquitin-like Modifier Protein SUMO Enables Plants to Control Growth Independently of the Phytohormone Gibberellin. Dev. Cell 2014, 28, 102–110. [Google Scholar] [CrossRef] [Green Version]
  86. Achard, P.; Baghour, M.; Chapple, A.; Hedden, P.; Van Der Straeten, D.; Genschik, P.; Moritz, T.; Harberd, N.P. The plant stress hormone ethylene controls floral transition via DELLA-dependent regulation of floral meristem-identity genes. Proc. Natl. Acad. Sci. USA 2007, 104, 6484–6489. [Google Scholar] [CrossRef] [Green Version]
  87. Fode, B.; Siemsen, T.; Thurow, C.; Weigel, R.; Gatz, C. The Arabidopsis GRAS Protein SCL14 Interacts with Class II TGA Transcription Factors and Is Essential for the Activation of Stress-Inducible Promoters. Plant Cell 2008, 20, 3122–3135. [Google Scholar] [CrossRef] [Green Version]
Figure 1. Syntenic analyses of the GRAS genes among cucumber (Cs), tomato (Sl), and Arabidopsis (At). The gray lines in the background indicate the collinear blocks within cucumber (red), tomato (yellow), and Arabidopsis (red) genomes, while the blue lines highlight the syntenic GRAS gene pairs.
Horticulturae 06 00110 g001
Figure 2. Phylogenetic tree of the predicted amino acid sequences of the GRAS gene family from cucumber, rice, Arabidopsis, and tomato. The proteins from each species are labeled with different graphics and colors (red star: cucumber; blue circle: Arabidopsis; yellow triangle: rice; pink square: tomato). The eleven subfamilies with different colors represent eleven clades.
Horticulturae 06 00110 g002
Figure 3. Predicted cis-elements in the promoter (2000 bp upstream of ATG start code) regions of the GRAS genes. The numbers at the bottom of the image represent nucleotide positions.
Horticulturae 06 00110 g003
Figure 4. Heatmap of cucumber GRAS genes after exposure to long-term low temperature and high temperature stresses. (a) Expression profile of GRAS genes after low temperature stress; (b) expression profile of GRAS genes after high temperature stress. R: resistant line; S: susceptible line. Log2 transformed values were used to generate the color-coded heatmap.
Horticulturae 06 00110 g004
Figure 5. Expression pattern of GRAS genes in response to low temperature treatment in cucumber genotypes “CG37” and “CG104”. The gray, blue, and orange rectangles represent the DELLA, PAT1, LAS, LISCL, and SCL3 subfamilies. The error bars show the standard error of the mean of three biological replicates. * represents p < 0.05, ** represents p < 0.01.
Horticulturae 06 00110 g005
Figure 6. Expression pattern of GRAS genes in response to high temperature treatment in cucumber genotypes “CG37” and “CG104”. The gray, blue, and orange rectangles represent the DELLA, PAT1, LAS, LISCL, and SCL3 subfamilies. The error bars show the standard error of the mean of three biological replicates. * represents p < 0.05.
Horticulturae 06 00110 g006
Figure 7. Expression pattern of GRAS genes in response to salt treatment in cucumber genotypes “CG37” and “CG104”. The gray, blue, and orange rectangle represent the DELLA, PAT1, LAS, LISCL, and SCL3 subfamilies. The error bars show the standard error of the mean of three biological replicates. * represents p < 0.05, ** represents p < 0.01.
Horticulturae 06 00110 g007
Figure 8. Expression pattern of GRAS genes in response to gibberellin (GA) and abscisic acid (ABA) treatment in cucumber genotypes “CG37” and “CG104”. The gray, blue, and orange rectangles represent the DELLA, PAT1, LAS, LISCL, and SCL3 subfamilies. The error bars show the standard error of the mean of with three biological replicates. * represents p < 0.05, ** represents p < 0.01.
Horticulturae 06 00110 g008
Publisher’s Note: MDPI stays neutral with regard to jurisdictional claims in published maps and institutional affiliations.

