
The Association between Uric Acid and Metabolic Syndrome in a Middle-Aged and Elderly Taiwanese Population: A Community-Based Cross-Sectional Study

Abstract
:1. Introduction
2. Materials and Methods
2.1. Study Design and Participants
2.2. Data Collection and Measurements
2.3. Definition of MetS and Other Variables
2.4. Statistical Analysis
3. Results
4. Discussion
5. Conclusions
Author Contributions
Funding
Institutional Review Board Statement
Informed Consent Statement
Data Availability Statement
Conflicts of Interest
References
- Huang, P.L. A comprehensive definition for metabolic syndrome. Dis. Model. Mech. 2009, 2, 231–237. [Google Scholar] [CrossRef] [PubMed]
- Bovolini, A.; Garcia, J.; Andrade, M.A.; Duarte, J.A. Metabolic Syndrome Pathophysiology and Predisposing Factors. Int. J. Sports Med. 2021, 42, 199–214. [Google Scholar] [CrossRef] [PubMed]
- Mottillo, S.; Filion, K.B.; Genest, J.; Joseph, L.; Pilote, L.; Poirier, P.; Rinfret, S.; Schiffrin, E.L.; Eisenberg, M.J. The metabolic syndrome and cardiovascular risk a systematic review and meta-analysis. J. Am. Coll. Cardiol. 2010, 56, 1113–1132. [Google Scholar] [CrossRef] [PubMed]
- Esposito, K.; Chiodini, P.; Colao, A.; Lenzi, A.; Giugliano, D. Metabolic syndrome and risk of cancer: A systematic review and meta-analysis. Diabetes Care 2012, 35, 2402–2411. [Google Scholar] [CrossRef] [PubMed]
- Xi, B.; He, D.; Hu, Y.; Zhou, D. Prevalence of metabolic syndrome and its influencing factors among the Chinese adults: The China Health and Nutrition Survey in 2009. Prev. Med. 2013, 57, 867–871. [Google Scholar] [CrossRef] [PubMed]
- Yang, W.; Reynolds, K.; Gu, D.; Chen, J.; He, J. A comparison of two proposed definitions for metabolic syndrome in the Chinese adult population. Am. J. Med. Sci. 2007, 334, 184–189. [Google Scholar] [CrossRef] [PubMed]
- Ranasinghe, P.; Mathangasinghe, Y.; Jayawardena, R.; Hills, A.P.; Misra, A. Prevalence and trends of metabolic syndrome among adults in the asia-pacific region: A systematic review. BMC Public Health 2017, 17, 101. [Google Scholar] [CrossRef] [PubMed]
- Wu, J.; Zhang, H.; Yang, L.; Shao, J.; Chen, D.; Cui, N.; Tang, L.; Fu, Y.; Xue, E.; Lai, C.; et al. Sedentary time and the risk of metabolic syndrome: A systematic review and dose-response meta-analysis. Obes. Rev. 2022, 23, e13510. [Google Scholar] [CrossRef]
- George, C.; Leslie, S.W.; Minter, D.A. Hyperuricemia. In StatPearls; StatPearls Publishing LLC.: Treasure Island, FL, USA, 2023. [Google Scholar]
- Li, C.; Hsieh, M.C.; Chang, S.J. Metabolic syndrome, diabetes, and hyperuricemia. Curr. Opin. Rheumatol. 2013, 25, 210–216. [Google Scholar] [CrossRef]
- King, C.; Lanaspa, M.A.; Jensen, T.; Tolan, D.R.; Sánchez-Lozada, L.G.; Johnson, R.J. Uric Acid as a Cause of the Metabolic Syndrome. Contrib. Nephrol. 2018, 192, 88–102. [Google Scholar] [CrossRef]
- Cortese, F.; Scicchitano, P.; Cortese, A.M.; Meliota, G.; Andriani, A.; Truncellito, L.; Calculli, G.; Giordano, P.; Ciccone, M.M. Uric Acid in Metabolic and Cerebrovascular Disorders: A Review. Curr. Vasc. Pharmacol. 2020, 18, 610–618. [Google Scholar] [CrossRef] [PubMed]
- Yuan, H.; Yu, C.; Li, X.; Sun, L.; Zhu, X.; Zhao, C.; Zhang, Z.; Yang, Z. Serum Uric Acid Levels and Risk of Metabolic Syndrome: A Dose-Response Meta-Analysis of Prospective Studies. J. Clin. Endocrinol. Metab. 2015, 100, 4198–4207. [Google Scholar] [CrossRef] [PubMed]
- Prof, C.-C.; Inoue, S.; Prof, J.G.C.; Zimmet Australia, P.; Chen, C.; Prof, C.; Japan, I.; Ys, P.; Korea, K.; Bassett, J. TheAsia-Pacific Perspective: Redefining Obesity and Its Treatment. Available online: https://www.vepachedu.org/TSJ/BMI-Guidelines.pdf (accessed on 1 September 2023).
- Diagnosis and classification of diabetes mellitus. Diabetes Care 2011, 34 (Suppl. S1), S62–S69. [CrossRef] [PubMed]
- Grundy, S.M.; Stone, N.J.; Bailey, A.L.; Beam, C.; Birtcher, K.K.; Blumenthal, R.S.; Braun, L.T.; de Ferranti, S.; Faiella-Tommasino, J.; Forman, D.E.; et al. 2018 AHA/ACC/AACVPR/AAPA/ABC/ACPM/ADA/AGS/APhA/ASPC/NLA/PCNA Guideline on the Management of Blood Cholesterol: Executive Summary: A Report of the American College of Cardiology/American Heart Association Task Force on Clinical Practice Guidelines. J. Am. Coll. Cardiol. 2019, 73, 3168–3209. [Google Scholar] [CrossRef] [PubMed]
- Elliott, W.J. Systemic hypertension. Curr. Probl. Cardiol. 2007, 32, 201–259. [Google Scholar] [CrossRef] [PubMed]
- Iseki, K.; Konta, T.; Asahi, K.; Yamagata, K.; Fujimoto, S.; Tsuruya, K.; Narita, I.; Kasahara, M.; Shibagaki, Y.; Moriyama, T.; et al. Impact of Metabolic Syndrome on the Mortality Rate among Participants in a Specific Health Check and Guidance Program in Japan. Intern. Med. 2020, 59, 2671–2678. [Google Scholar] [CrossRef] [PubMed]
- Cheng, H.M.; Lin, H.J.; Wang, T.D.; Chen, C.H. Asian management of hypertension: Current status, home blood pressure, and specific concerns in Taiwan. J. Clin. Hypertens 2020, 22, 511–514. [Google Scholar] [CrossRef]
- Tseng, W.P. Epidemiology of hypertension among Chinese in Taiwan. J. Hum. Hypertens 1990, 4, 144–146. [Google Scholar]
- Zhang, L.; Li, J.L.; Guo, L.L.; Li, H.; Li, D.; Xu, G. The interaction between serum uric acid and triglycerides level on blood pressure in middle-aged and elderly individuals in China: Result from a large national cohort study. BMC Cardiovasc. Disord. 2020, 20, 174. [Google Scholar] [CrossRef]
- Cheng, W.; Wen, S.; Wang, Y.; Qian, Z.; Tan, Y.; Li, H.; Hou, Y.; Hu, H.; Golledge, J.; Yang, G. The association between serum uric acid and blood pressure in different age groups in a healthy Chinese cohort. Medicine 2017, 96, e8953. [Google Scholar] [CrossRef]
- Wang, H.; Wang, L.; Xie, R.; Dai, W.; Gao, C.; Shen, P.; Huang, X.; Zhang, F.; Yang, X.; Ji, G. Association of Serum Uric Acid with Body Mass Index: A Cross-Sectional Study from Jiangsu Province, China. Iran J. Public Health 2014, 43, 1503–1509. [Google Scholar] [PubMed]
- Chang, H.C.; Yang, H.C.; Chang, H.Y.; Yeh, C.J.; Chen, H.H.; Huang, K.C.; Pan, W.H. Morbid obesity in Taiwan: Prevalence, trends, associated social demographics, and lifestyle factors. PLoS ONE 2017, 12, e0169577. [Google Scholar] [CrossRef] [PubMed]
- Pan, W.H.; Wu, H.J.; Yeh, C.J.; Chuang, S.Y.; Chang, H.Y.; Yeh, N.H.; Hsieh, Y.T. Diet and health trends in Taiwan: Comparison of two nutrition and health surveys from 1993–1996 and 2005–2008. Asia Pac. J. Clin. Nutr. 2011, 20, 238–250. [Google Scholar] [PubMed]
- Zheng, R.; Ren, P.; Chen, Q.; Yang, T.; Chen, C.; Mao, Y. Serum Uric Acid Levels and Risk of Incident Hypertriglyceridemia: A Longitudinal Population-based Epidemiological Study. Ann. Clin. Lab. Sci. 2017, 47, 586–591. [Google Scholar] [PubMed]
- Sheen, Y.J.; Hsu, C.C.; Jiang, Y.D.; Huang, C.N.; Liu, J.S.; Sheu, W.H. Trends in prevalence and incidence of diabetes mellitus from 2005 to 2014 in Taiwan. J. Formos. Med. Assoc. 2019, 118 (Suppl. 2), S66–S73. [Google Scholar] [CrossRef] [PubMed]
- Nejatinamini, S.; Ataie-Jafari, A.; Qorbani, M.; Nikoohemat, S.; Kelishadi, R.; Asayesh, H.; Hosseini, S. Association between serum uric acid level and metabolic syndrome components. J. Diabetes Metab. Disord. 2015, 14, 70. [Google Scholar] [CrossRef] [PubMed]
- Sun, H.L.; Pei, D.; Lue, K.H.; Chen, Y.L. Uric Acid Levels Can Predict Metabolic Syndrome and Hypertension in Adolescents: A 10-Year Longitudinal Study. PLoS ONE 2015, 10, e0143786. [Google Scholar] [CrossRef]
- Kanbay, M.; Jensen, T.; Solak, Y.; Le, M.; Roncal-Jimenez, C.; Rivard, C.; Lanaspa, M.A.; Nakagawa, T.; Johnson, R.J. Uric acid in metabolic syndrome: From an innocent bystander to a central player. Eur. J. Intern. Med. 2016, 29, 3–8. [Google Scholar] [CrossRef]
- Chen, Y.Y.; Kao, T.W.; Yang, H.F.; Chou, C.W.; Wu, C.J.; Lai, C.H.; Sun, Y.S.; Wang, C.C.; Chen, W.L. The association of uric acid with the risk of metabolic syndrome, arterial hypertension or diabetes in young subjects—An observational study. Clin. Chim. Acta 2018, 478, 68–73. [Google Scholar] [CrossRef]
- Keerman, M.; Yang, F.; Hu, H.; Wang, J.; Wang, F.; Li, Z.; Yuan, J.; Yao, P.; Zhang, X.; Guo, H.; et al. Mendelian randomization study of serum uric acid levels and diabetes risk: Evidence from the Dongfeng-Tongji cohort. BMJ Open Diabetes Res. Care 2020, 8, e000834. [Google Scholar] [CrossRef]
- Gill, D.; Cameron, A.C.; Burgess, S.; Li, X.; Doherty, D.J.; Karhunen, V.; Abdul-Rahim, A.H.; Taylor-Rowan, M.; Zuber, V.; Tsao, P.S.; et al. Urate, Blood Pressure, and Cardiovascular Disease: Evidence From Mendelian Randomization and Meta-Analysis of Clinical Trials. Hypertension 2021, 77, 383–392. [Google Scholar] [CrossRef] [PubMed]
- Liu, L.; Gu, Y.; Li, C.; Zhang, Q.; Meng, G.; Wu, H.; Du, H.; Shi, H.; Xia, Y.; Guo, X.; et al. Serum uric acid is an independent predictor for developing prehypertension: A population-based prospective cohort study. J. Hum. Hypertens 2017, 31, 116–120. [Google Scholar] [CrossRef] [PubMed]
- Taniguchi, Y.; Hayashi, T.; Tsumura, K.; Endo, G.; Fujii, S.; Okada, K. Serum uric acid and the risk for hypertension and Type 2 diabetes in Japanese men: The Osaka Health Survey. J. Hypertens 2001, 19, 1209–1215. [Google Scholar] [CrossRef] [PubMed]
- Osgood, K.; Krakoff, J.; Thearle, M. Serum uric acid predicts both current and future components of the metabolic syndrome. Metab. Syndr. Relat. Disord. 2013, 11, 157–162. [Google Scholar] [CrossRef] [PubMed]
- Wang, L.; Zhang, T.; Liu, Y.; Tang, F.; Xue, F. Association of Serum Uric Acid with Metabolic Syndrome and Its Components: A Mendelian Randomization Analysis. Biomed. Res. Int. 2020, 2020, 6238693. [Google Scholar] [CrossRef] [PubMed]
- Zhao, D.; Liu, H.; Dong, P. Empagliflozin reduces blood pressure and uric acid in patients with type 2 diabetes mellitus: A systematic review and meta-analysis. J. Hum. Hypertens 2019, 33, 327–339. [Google Scholar] [CrossRef] [PubMed]
- Rocha, E.P.A.A.; Vogel, M.; Vogel, M.; Stanik, J.; Pietzner, D.; Willenberg, A.; Körner, A.; Kiess, W. Serum Uric Acid Levels as an Indicator for Metabolically Unhealthy Obesity in Children and Adolescents. Horm. Res. Paediatr. 2018, 90, 19–27. [Google Scholar] [CrossRef]
- Del Pinto, R.; Viazzi, F.; Pontremoli, R.; Ferri, C.; Carubbi, F.; Russo, E. The URRAH study. Panminerva Med. 2021, 63, 416–423. [Google Scholar] [CrossRef]


| Uric Acid Levels | |||||||||||||
|---|---|---|---|---|---|---|---|---|---|---|---|---|---|
| Total | Low | Middle | High | ||||||||||
| Variables | (n = 400) | (n = 130) | (<5.1) | (n = 138) | (5.1–6.2) | (n = 132) | (>6.2) | p Value | |||||
| Age (year) | 64.47 | ± | 8.45 | 64.80 | ± | 7.90 | 63.26 | ± | 8.48 | 65.39 | ± | 8.84 | 0.10 |
| Gender (male), n(%) | 141 | 35.2% | 29 | 22.3% | 36 | 26.1% | 76 | 57.6% | <0.001 | ||||
| SBP (mmHg) | 129.50 | ± | 16.71 | 126.43 | ± | 17.32 | 130.64 | ± | 16.36 | 131.33 | ± | 16.16 | 0.04 |
| DBP (mmHg) | 76.93 | ± | 11.36 | 74.13 | ± | 10.20 | 77.49 | ± | 11.43 | 79.11 | ± | 11.89 | 0.001 |
| BMI (kg/m2) | 24.55 | ± | 3.57 | 23.45 | ± | 3.66 | 24.86 | ± | 3.08 | 25.30 | ± | 3.71 | <0.001 |
| Waist circumference (cm) | 85.07 | ± | 9.68 | 81.51 | ± | 8.93 | 85.05 | ± | 8.77 | 88.58 | ± | 10.07 | <0.001 |
| ALT (U/L) | 22.63 | ± | 12.95 | 20.80 | ± | 10.48 | 23.00 | ± | 12.87 | 24.03 | ± | 14.98 | 0.12 |
| FPG (mg/dL) | 96.23 | ± | 25.73 | 95.18 | ± | 22.25 | 95.23 | ± | 21.13 | 98.32 | ± | 32.50 | 0.52 |
| HDL-C (mg/dL) | 54.43 | ± | 13.93 | 58.93 | ± | 14.57 | 55.01 | ± | 12.67 | 49.39 | ± | 12.98 | <0.001 |
| LDL-C (mg/dL) | 118.37 | ± | 32.11 | 116.48 | ± | 28.60 | 121.65 | ± | 32.54 | 116.79 | ± | 34.79 | 0.33 |
| TC (mg/dL) | 197.15 | ± | 35.71 | 195.35 | ± | 33.82 | 200.04 | ± | 36.41 | 195.88 | ± | 36.83 | 0.50 |
| TG (mg/dL) | 122.07 | ± | 65.97 | 99.62 | ± | 47.91 | 117.08 | ± | 53.87 | 149.41 | ± | 81.73 | <0.001 |
| Uric acid (mg/dL) | 5.75 | ± | 1.41 | 4.30 | ± | 0.53 | 5.60 | ± | 0.34 | 7.33 | ± | 1.03 | <0.001 |
| Alcohol drinking, n (%) | 75 | 18.8% | 14 | 10.8% | 25 | 18.1% | 36 | 27.3% | 0.003 | ||||
| Current smoking, n (%) | 43 | 10.8% | 8 | 6.2% | 11 | 8.0% | 24 | 18.2% | 0.003 | ||||
| Regular exercise, n (%) | 328 | 82.0% | 110 | 84.6% | 112 | 81.2% | 106 | 80.3% | 0.63 | ||||
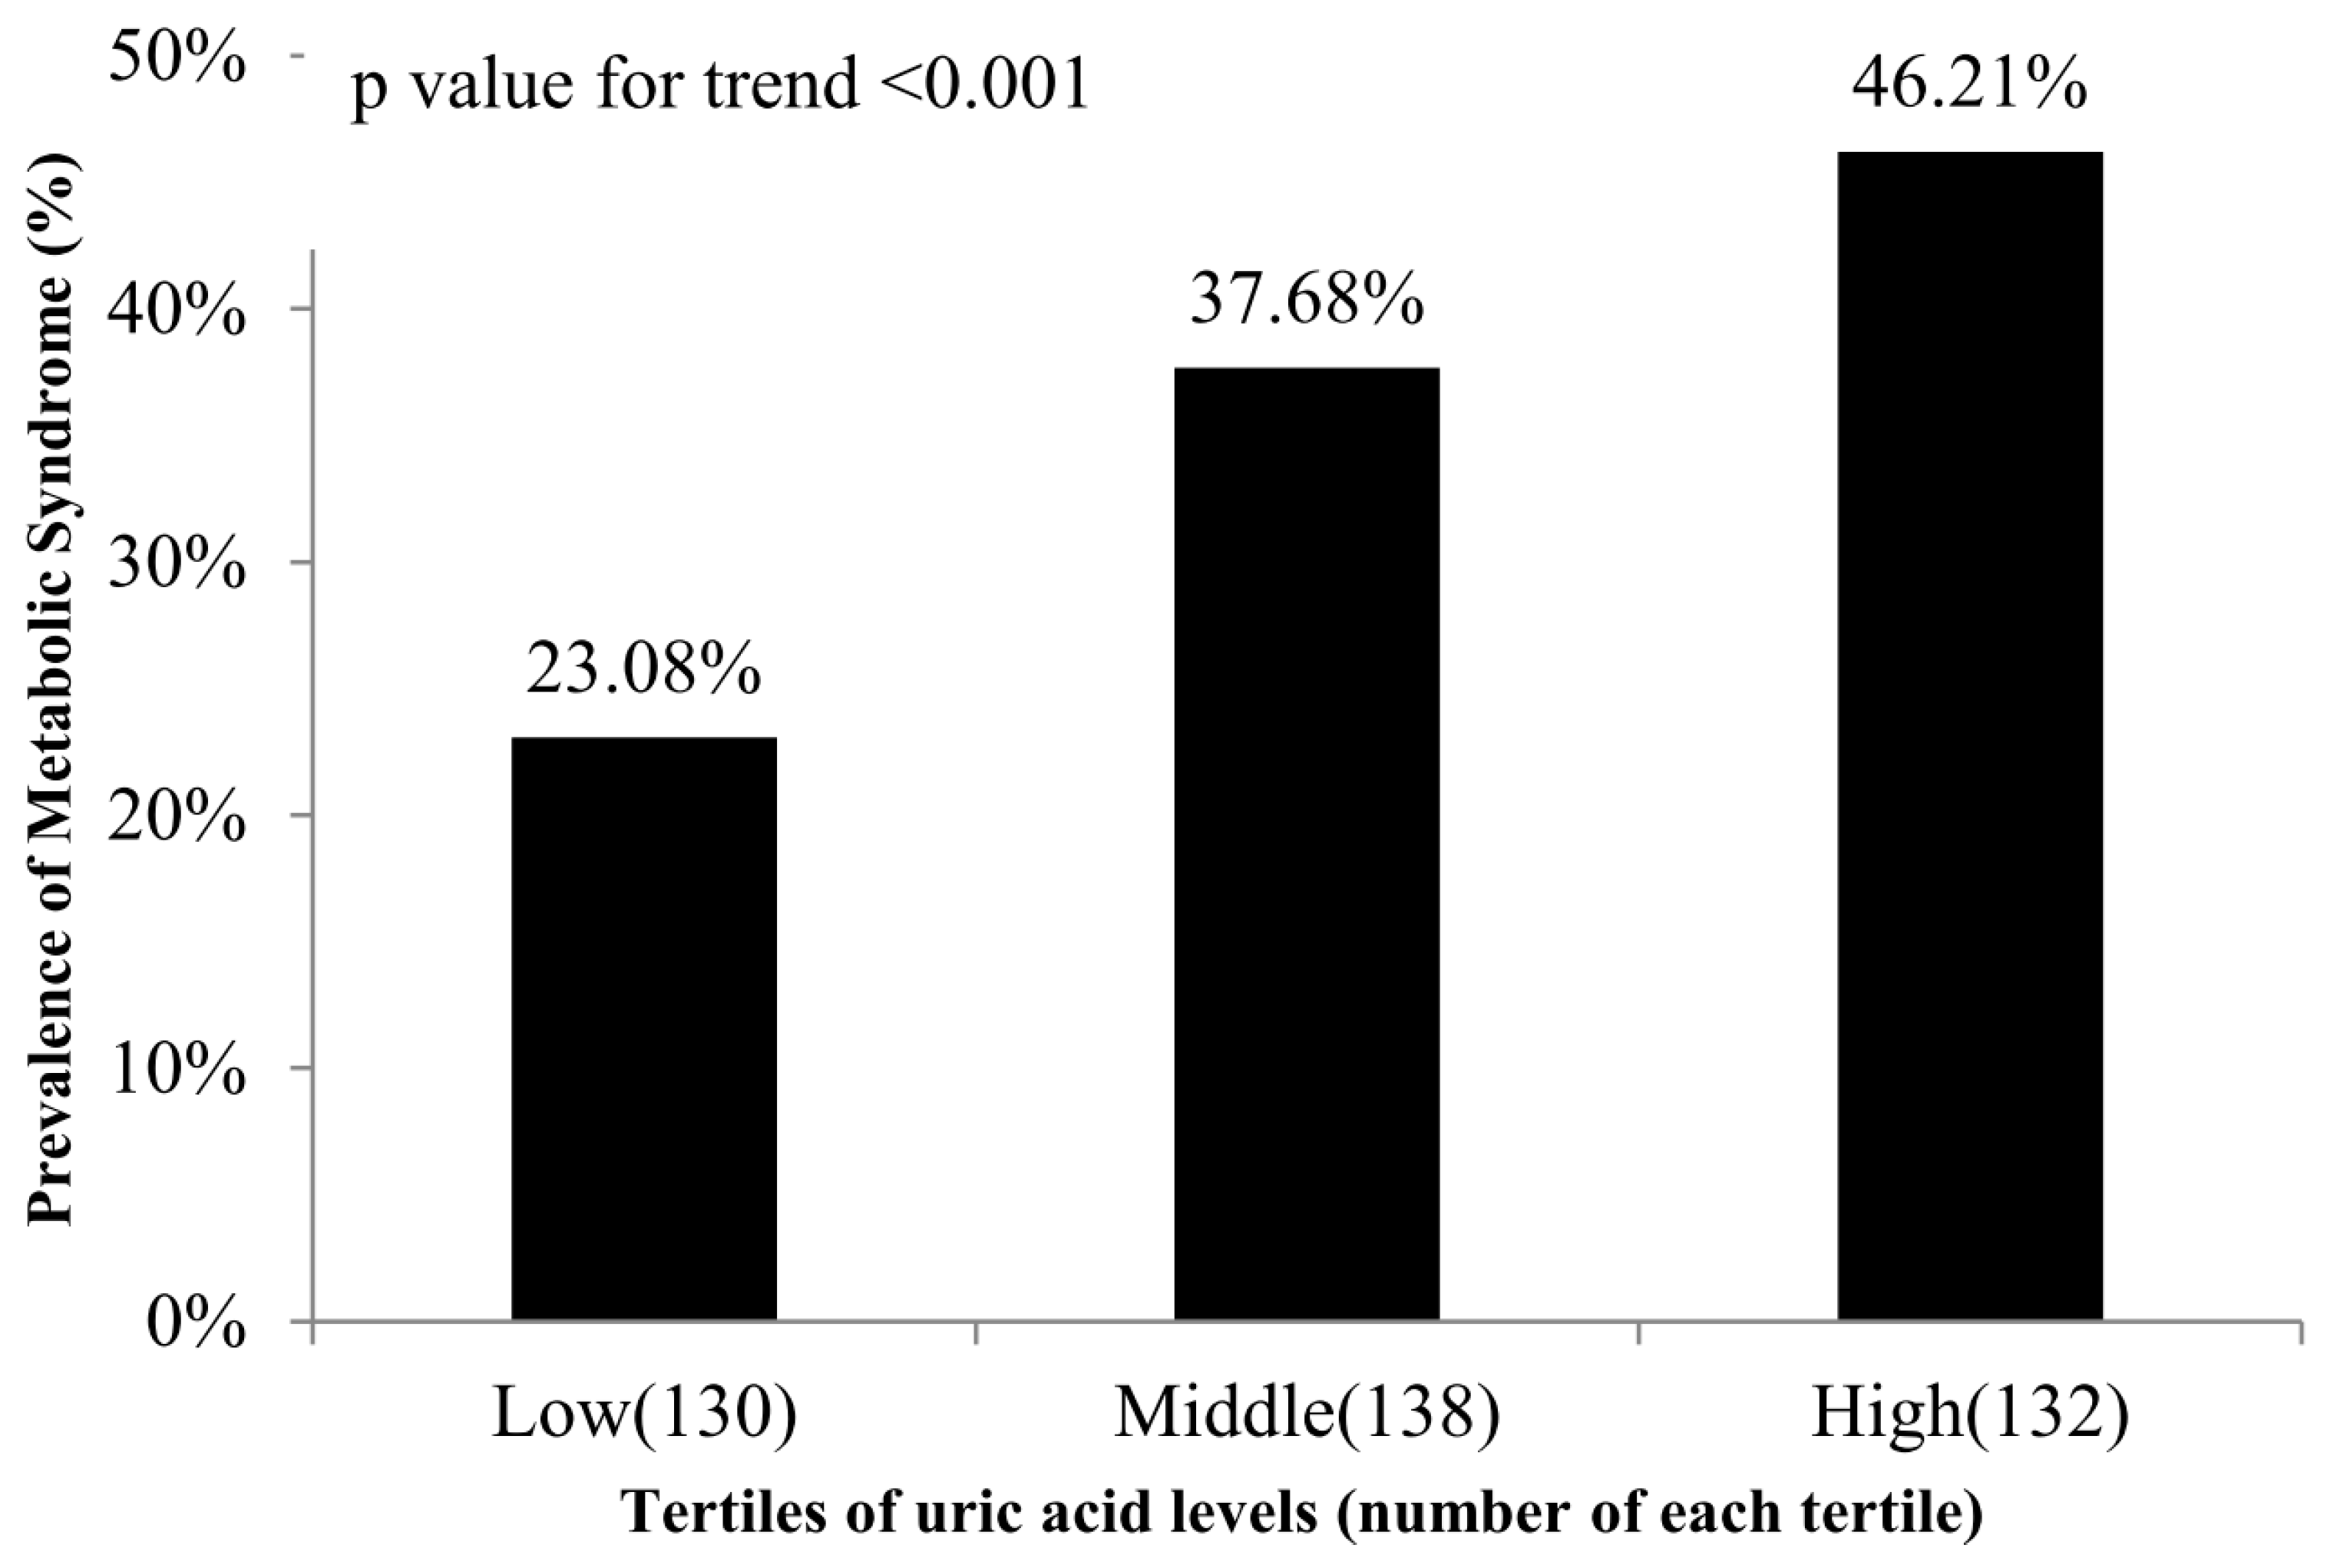
| Metabolic syndrome, n (%) | 143 | 35.8% | 30 | 23.1% | 52 | 37.7% | 61 | 46.2% | <0.001 | ||||
| HTN, n (%) | 201 | 50.3% | 53 | 40.8% | 70 | 50.7% | 78 | 59.1% | 0.01 | ||||
| DM, n (%) | 79 | 19.8% | 24 | 18.5% | 29 | 21.0% | 26 | 19.7% | 0.87 | ||||
| Hyperlipidemia, n (%) | 260 | 65.0% | 75 | 57.7% | 87 | 63.0% | 98 | 74.2% | 0.02 | ||||
| Uric Acid | ||
|---|---|---|
| Variables | Pearson’s Coefficient | p Value |
| Age (year) | 0.02 | 0.67 |
| SBP (mmHg) | 0.13 | 0.01 |
| DBP (mmHg) | 0.23 | <0.001 |
| BMI (kg/m2) | 0.21 | <0.001 |
| Waist circumference (cm) | 0.30 | <0.001 |
| ALT (U/L) | 0.10 | 0.04 |
| FPG (mg/dL) | 0.05 | 0.31 |
| HDL-C (mg/dL) | −0.30 | <0.001 |
| LDL-C (mg/dL) | 0.02 | 0.69 |
| TC (mg/dL) | 0.02 | 0.67 |
| TG (mg/dL) | 0.33 | <0.001 |
| Variables | Unadjusted | Adjusted | ||||
|---|---|---|---|---|---|---|
| OR | (95% CI) | p Value | OR | (95% CI) | p Value | |
| Low | 1.00 | - | - | 1.00 | - | - |
| Middle | 2.02 | (1.18–3.44) | 0.01 | 1.73 | (0.95–3.16) | 0.07 |
| High | 2.86 | (1.68–4.88) | <0.001 | 2.48 | (1.31–4.71) | 0.01 |
| Adjusted for age, sex, alcohol drinking, smoking, BMI, regular exercise, ALT, and TC | ||||||
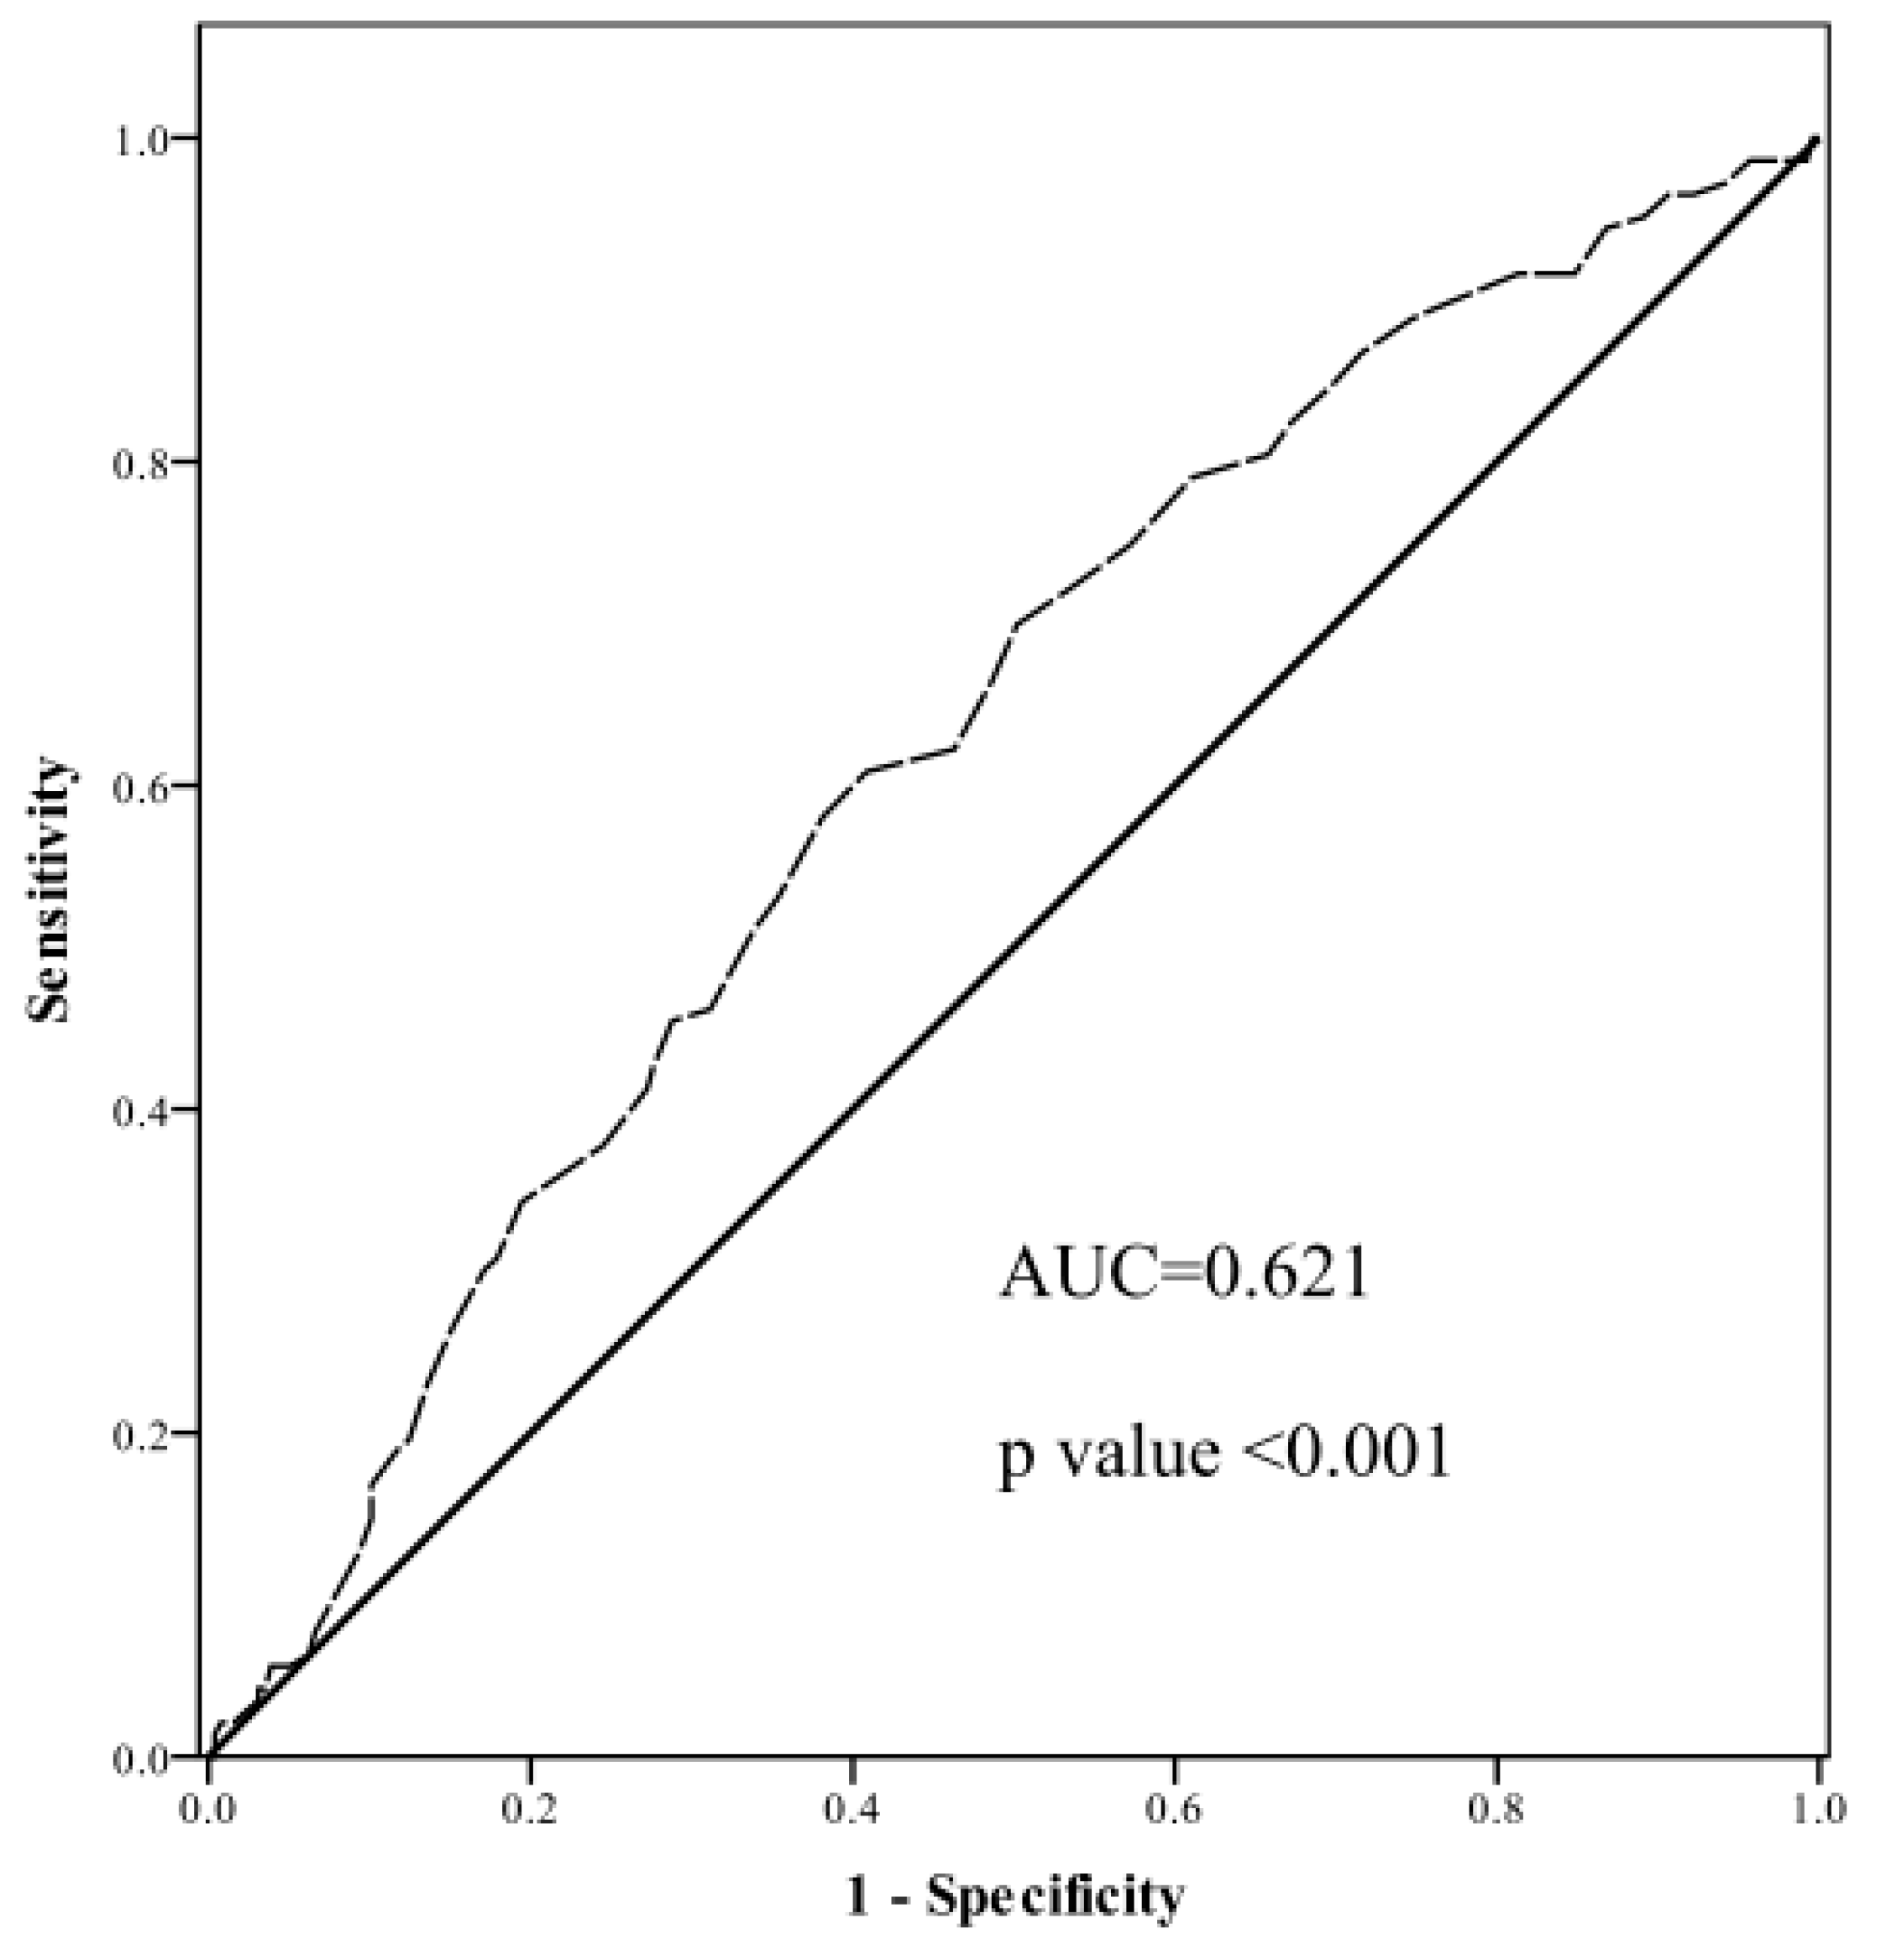
| Variables | AUC (95% CI) | p Value | Cut-Off Point | Sensitivity | Specificity |
|---|---|---|---|---|---|
| Uric acid | 0.62 (0.56–0.68) | <0.001 | 5.62 | 0.61 | 0.59 |
Disclaimer/Publisher’s Note: The statements, opinions and data contained in all publications are solely those of the individual author(s) and contributor(s) and not of MDPI and/or the editor(s). MDPI and/or the editor(s) disclaim responsibility for any injury to people or property resulting from any ideas, methods, instructions or products referred to in the content. |
© 2024 by the authors. Licensee MDPI, Basel, Switzerland. This article is an open access article distributed under the terms and conditions of the Creative Commons Attribution (CC BY) license (https://creativecommons.org/licenses/by/4.0/).
Share and Cite
Lin, C.-R.; Tsai, P.-A.; Wang, C.; Chen, J.-Y. The Association between Uric Acid and Metabolic Syndrome in a Middle-Aged and Elderly Taiwanese Population: A Community-Based Cross-Sectional Study. Healthcare 2024, 12, 113. https://doi.org/10.3390/healthcare12010113
Lin C-R, Tsai P-A, Wang C, Chen J-Y. The Association between Uric Acid and Metabolic Syndrome in a Middle-Aged and Elderly Taiwanese Population: A Community-Based Cross-Sectional Study. Healthcare. 2024; 12(1):113. https://doi.org/10.3390/healthcare12010113
Chicago/Turabian StyleLin, Chun-Ru, Po-An Tsai, Che Wang, and Jau-Yuan Chen. 2024. "The Association between Uric Acid and Metabolic Syndrome in a Middle-Aged and Elderly Taiwanese Population: A Community-Based Cross-Sectional Study" Healthcare 12, no. 1: 113. https://doi.org/10.3390/healthcare12010113