Quantitative Assessment of Epistemic Uncertainties in Tsunami Hazard Effects on Building Risk Assessments


1
College of Science and Engineering, Kanto Gakuin University, Yokohama 236-8501, Japan
2
International Research Institute of Disaster Science, Tohoku University, Sendai 980-0845, Japan
*
Author to whom correspondence should be addressed.
Geosciences 2018, 8(1), 17; https://doi.org/10.3390/geosciences8010017
Submission received: 30 September 2017
/
Revised: 20 December 2017
/
Accepted: 5 January 2018
/
Published: 10 January 2018
(This article belongs to the Special Issue Interdisciplinary Geosciences Perspectives of Tsunami)
Abstract
:Based on the definition of tsunami risk, we quantitatively evaluated the annual expected tsunami loss ratio (Tsunami Risk Index) and clarified the quantitative effects of epistemic uncertainties in tsunami hazard assessments on the tsunami risk of buildings by combining probabilistic information regarding tsunami inundation depths at target points and tsunami fragility assessments of buildings. For the risk assessment, we targeted buildings with four different structures (reinforced concrete, steel, brick, wood) located in three different areas (Soma, Sendai, Kesennuma). In conclusion, we demonstrated that the expected tsunami risk could vary by approximately two orders of magnitude when considering tsunami hazard uncertainties between the 95th percentile and the 5th percentile. In addition, we quantitatively clarified the fact that we cannot properly understand the tsunami risk by evaluating the tsunami fragility alone. For example, the analysis results indicate that the tsunami risk of a wood building located in Kesennuma is lower than that of a reinforced concrete building located in either Soma or Sendai.
1. Introduction
In general, the risks of natural disasters can be understood by multiplying the magnitude of the hazard and the evaluated vulnerability [1]. The magnitude of the hazard must include the severity of the hazard and its occurrence probability. Therefore, it is necessary to carry out probabilistic natural hazard assessments in order to properly evaluate such risks. Based on this concept, tsunami risks can be understood by multiplying the probabilistic tsunami hazard assessment and the tsunami fragility assessment, which represents the vulnerability of the tsunami. In other words, neither the tsunami hazard nor the tsunami fragility alone can capture the tsunami risk for an appropriate evaluation. Numerous studies on probabilistic tsunami hazard assessment methods and tsunami fragility evaluation methods have been conducted individually but few studies have quantitatively assessed tsunami risks by multiplying them together. Moreover, probability estimations of tsunami inundation depths at inland locations constitute necessary input information for the quantitative evaluation of tsunami risks; however, not many studies have conducted probabilistic tsunami inundation assessments (e.g., [2,3,4,5,6,7,8]). González et al. [2] applied a probabilistic tsunami hazard assessment methodology to Seaside, Oregon, that combines tsunami inundation modeling with probabilistic concepts. Goda et al. [4] developed stochastic random-field slip models for the 2011 Tohoku earthquake and conducted a tsunami inundation simulation using those developed models, after which they concluded that the inundation heights at a coastal location are major sources of uncertainties in the prediction of tsunami risks. Park and Cox [5] demonstrated an approach for assessing probabilistic near-field tsunami hazards within the Cascadia Subduction Zone using the logic tree method.
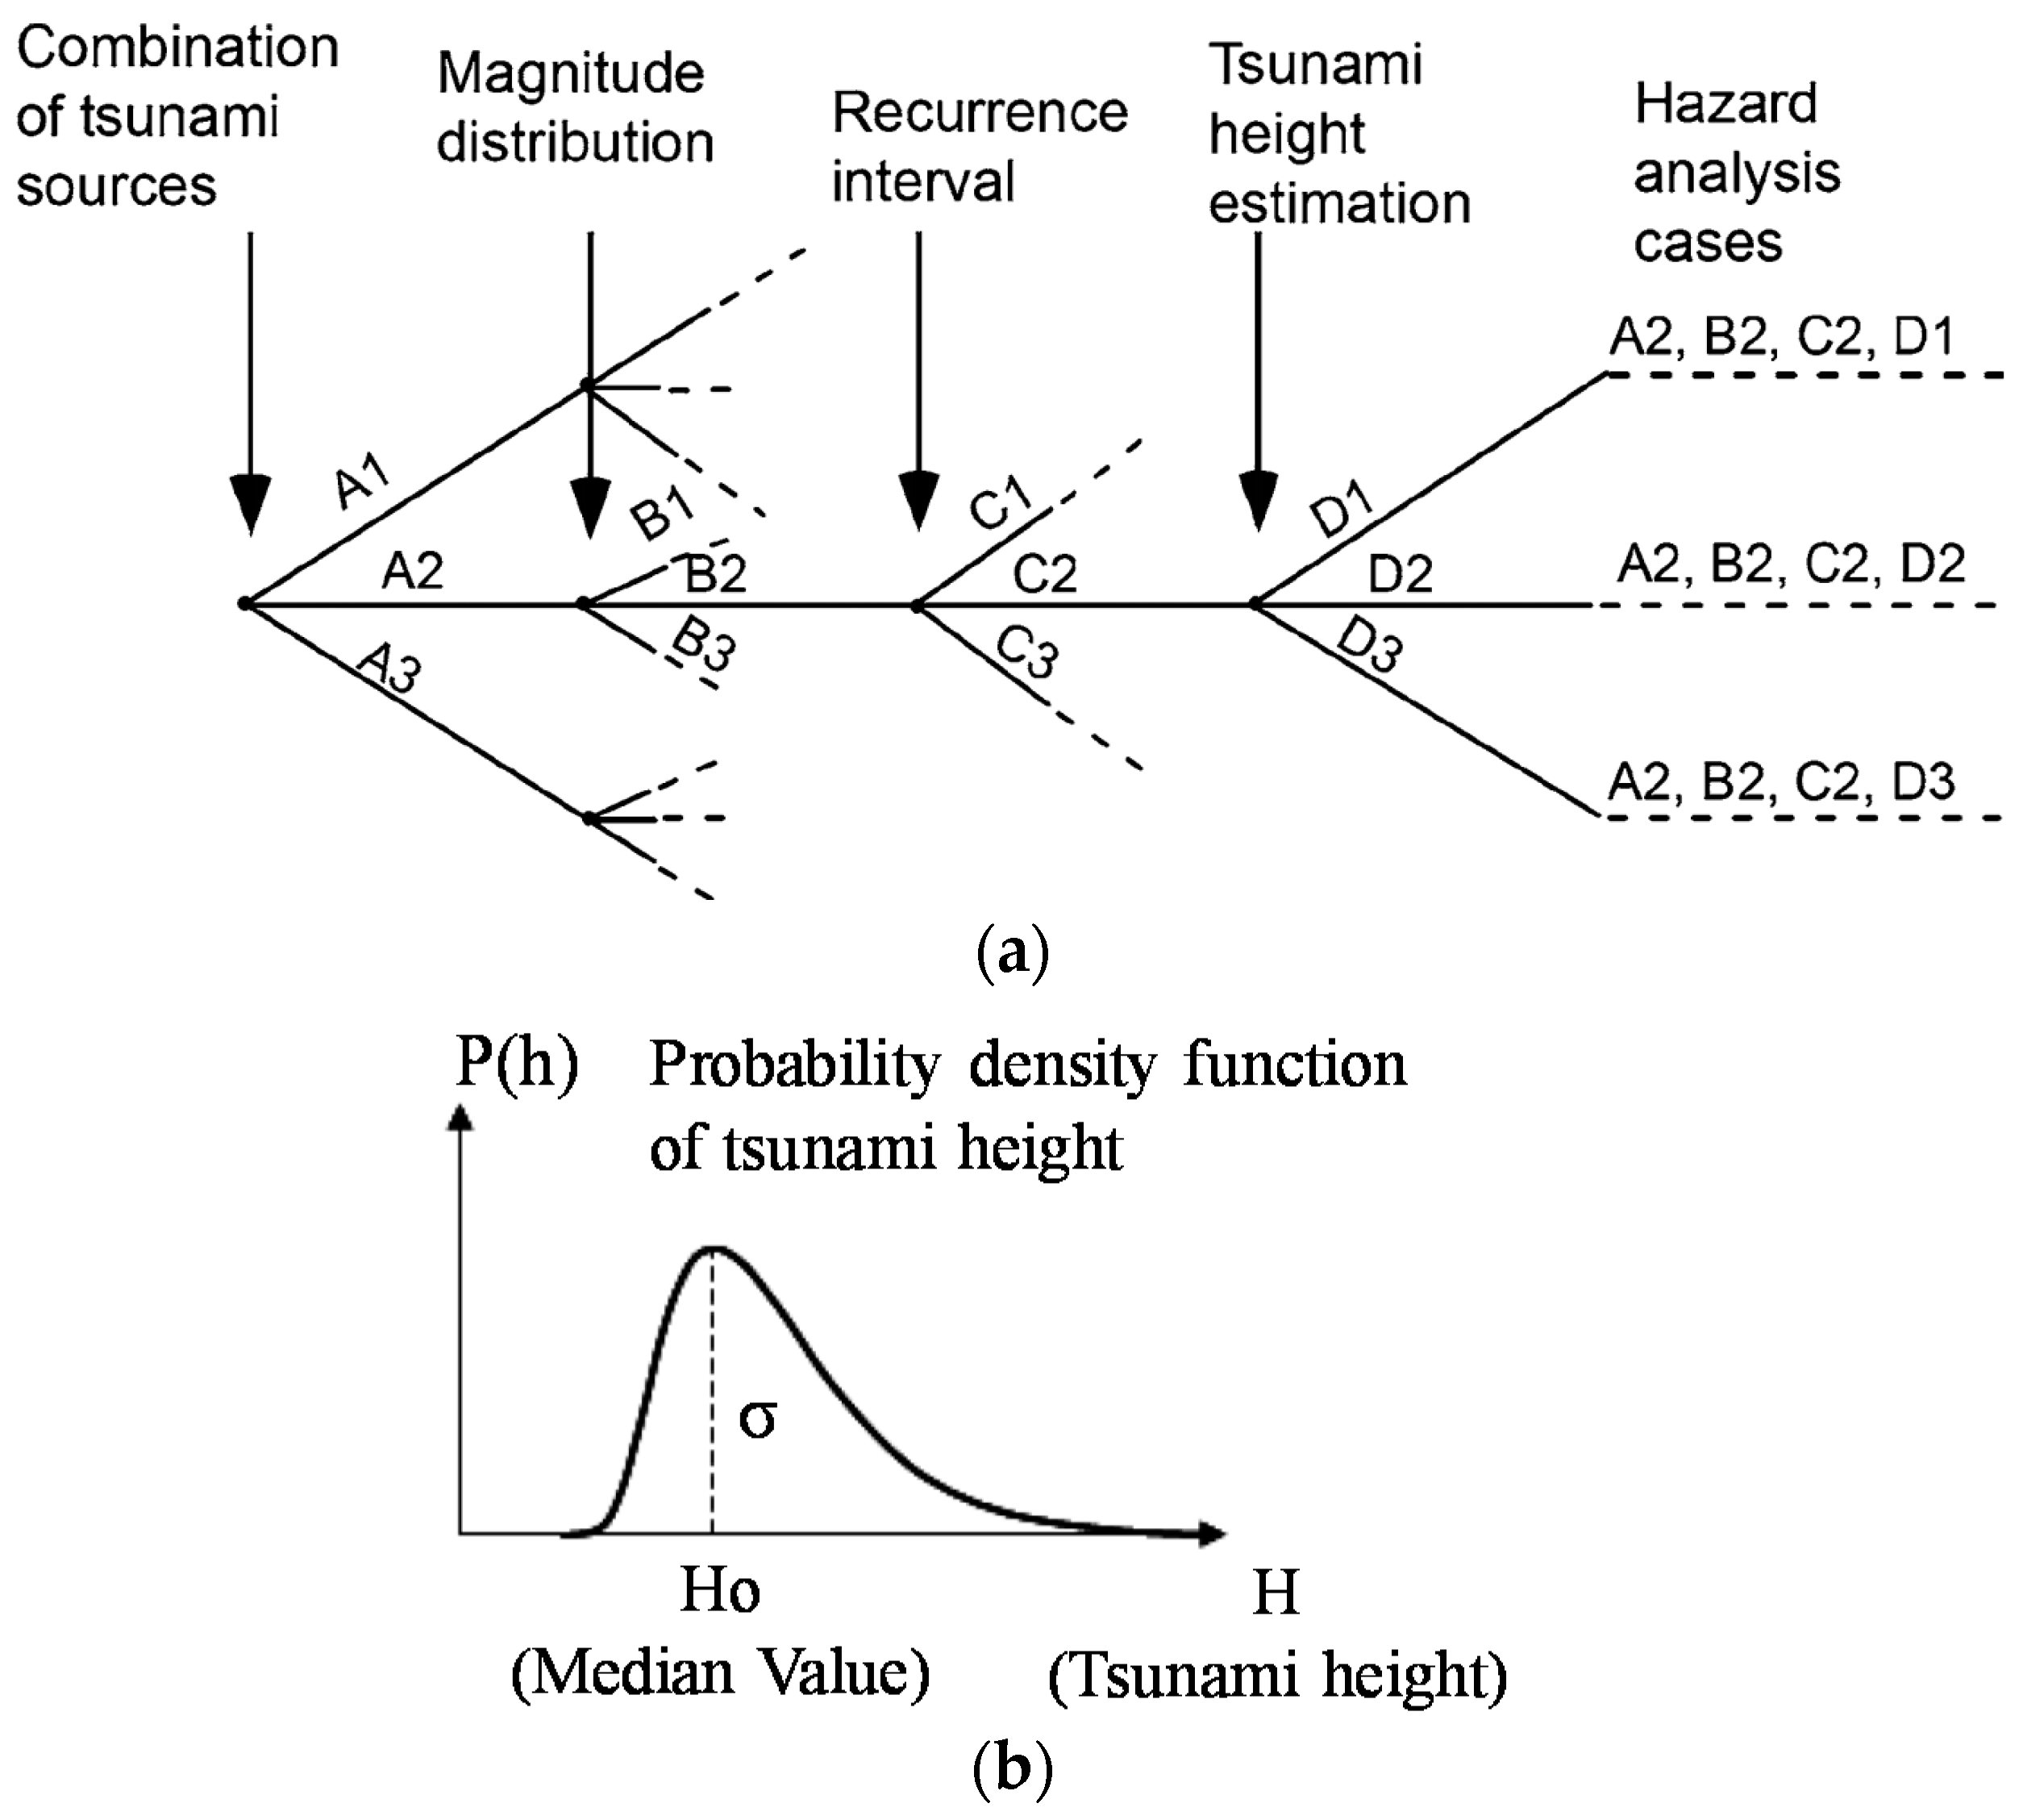
The logic tree method has been widely utilized to conduct probabilistic tsunami hazard analysis (e.g., [5,6,7,8,9,10]). In this method, the uncertainties in tsunami hazard assessments are classified as either epistemic uncertainties or aleatory uncertainties. Historically, Cornell [11] categorized the types of uncertainties that should be considered during an evaluation of strong earthquake motion into epistemic uncertainties and aleatory uncertainties. It has since become commonplace to evaluate the epistemic and aleatory uncertainties in probabilistic tsunami hazard assessments. As shown in Figure 1, the epistemic uncertainty can be captured using a logic tree, while the aleatory uncertainty can be evaluated through a probability distribution function of the tsunami height.
In this study, we first demonstrate a method for evaluating the probabilistic tsunami inundation depths at inland locations by employing a probabilistic tsunami hazard assessment model using the logic tree method. The demonstrated probabilistic tsunami inundation depths are combined with information regarding the tsunami fragility of buildings and is therefore capable of quantitatively evaluating the tsunami risk of a specific building located at a specific location. If the tsunami risk can be evaluated quantitatively, it is possible to objectively compare the risks among buildings with different structures in different areas. Since the method proposed in this study is relatively simple, its calculation cost is smaller than those of the methods employed within previous studies.
After the 2011 Great East Japan Tsunami, many improvements of tsunami countermeasures have been made in both structural measures and nonstructural measures but large future challenges remain such as probabilistic risk prediction and an advanced simulation technique and system for real-time hazard etc. [12]. The method proposed in this study will be used to produce tsunami risk index using objective judgment for various situations in disaster prevention scenarios. Consequently, we can also examine how the evaluation of the tsunami risk index varies depending on the structures of buildings and other regional differences. The method is intended to quantitatively clarify the contribution from the epistemic uncertainty in the tsunami hazard evaluation to the quantitative amount of risk.
2. Methodology for the Tsunami Risk Assessment and Quantification of Hazard Uncertainty
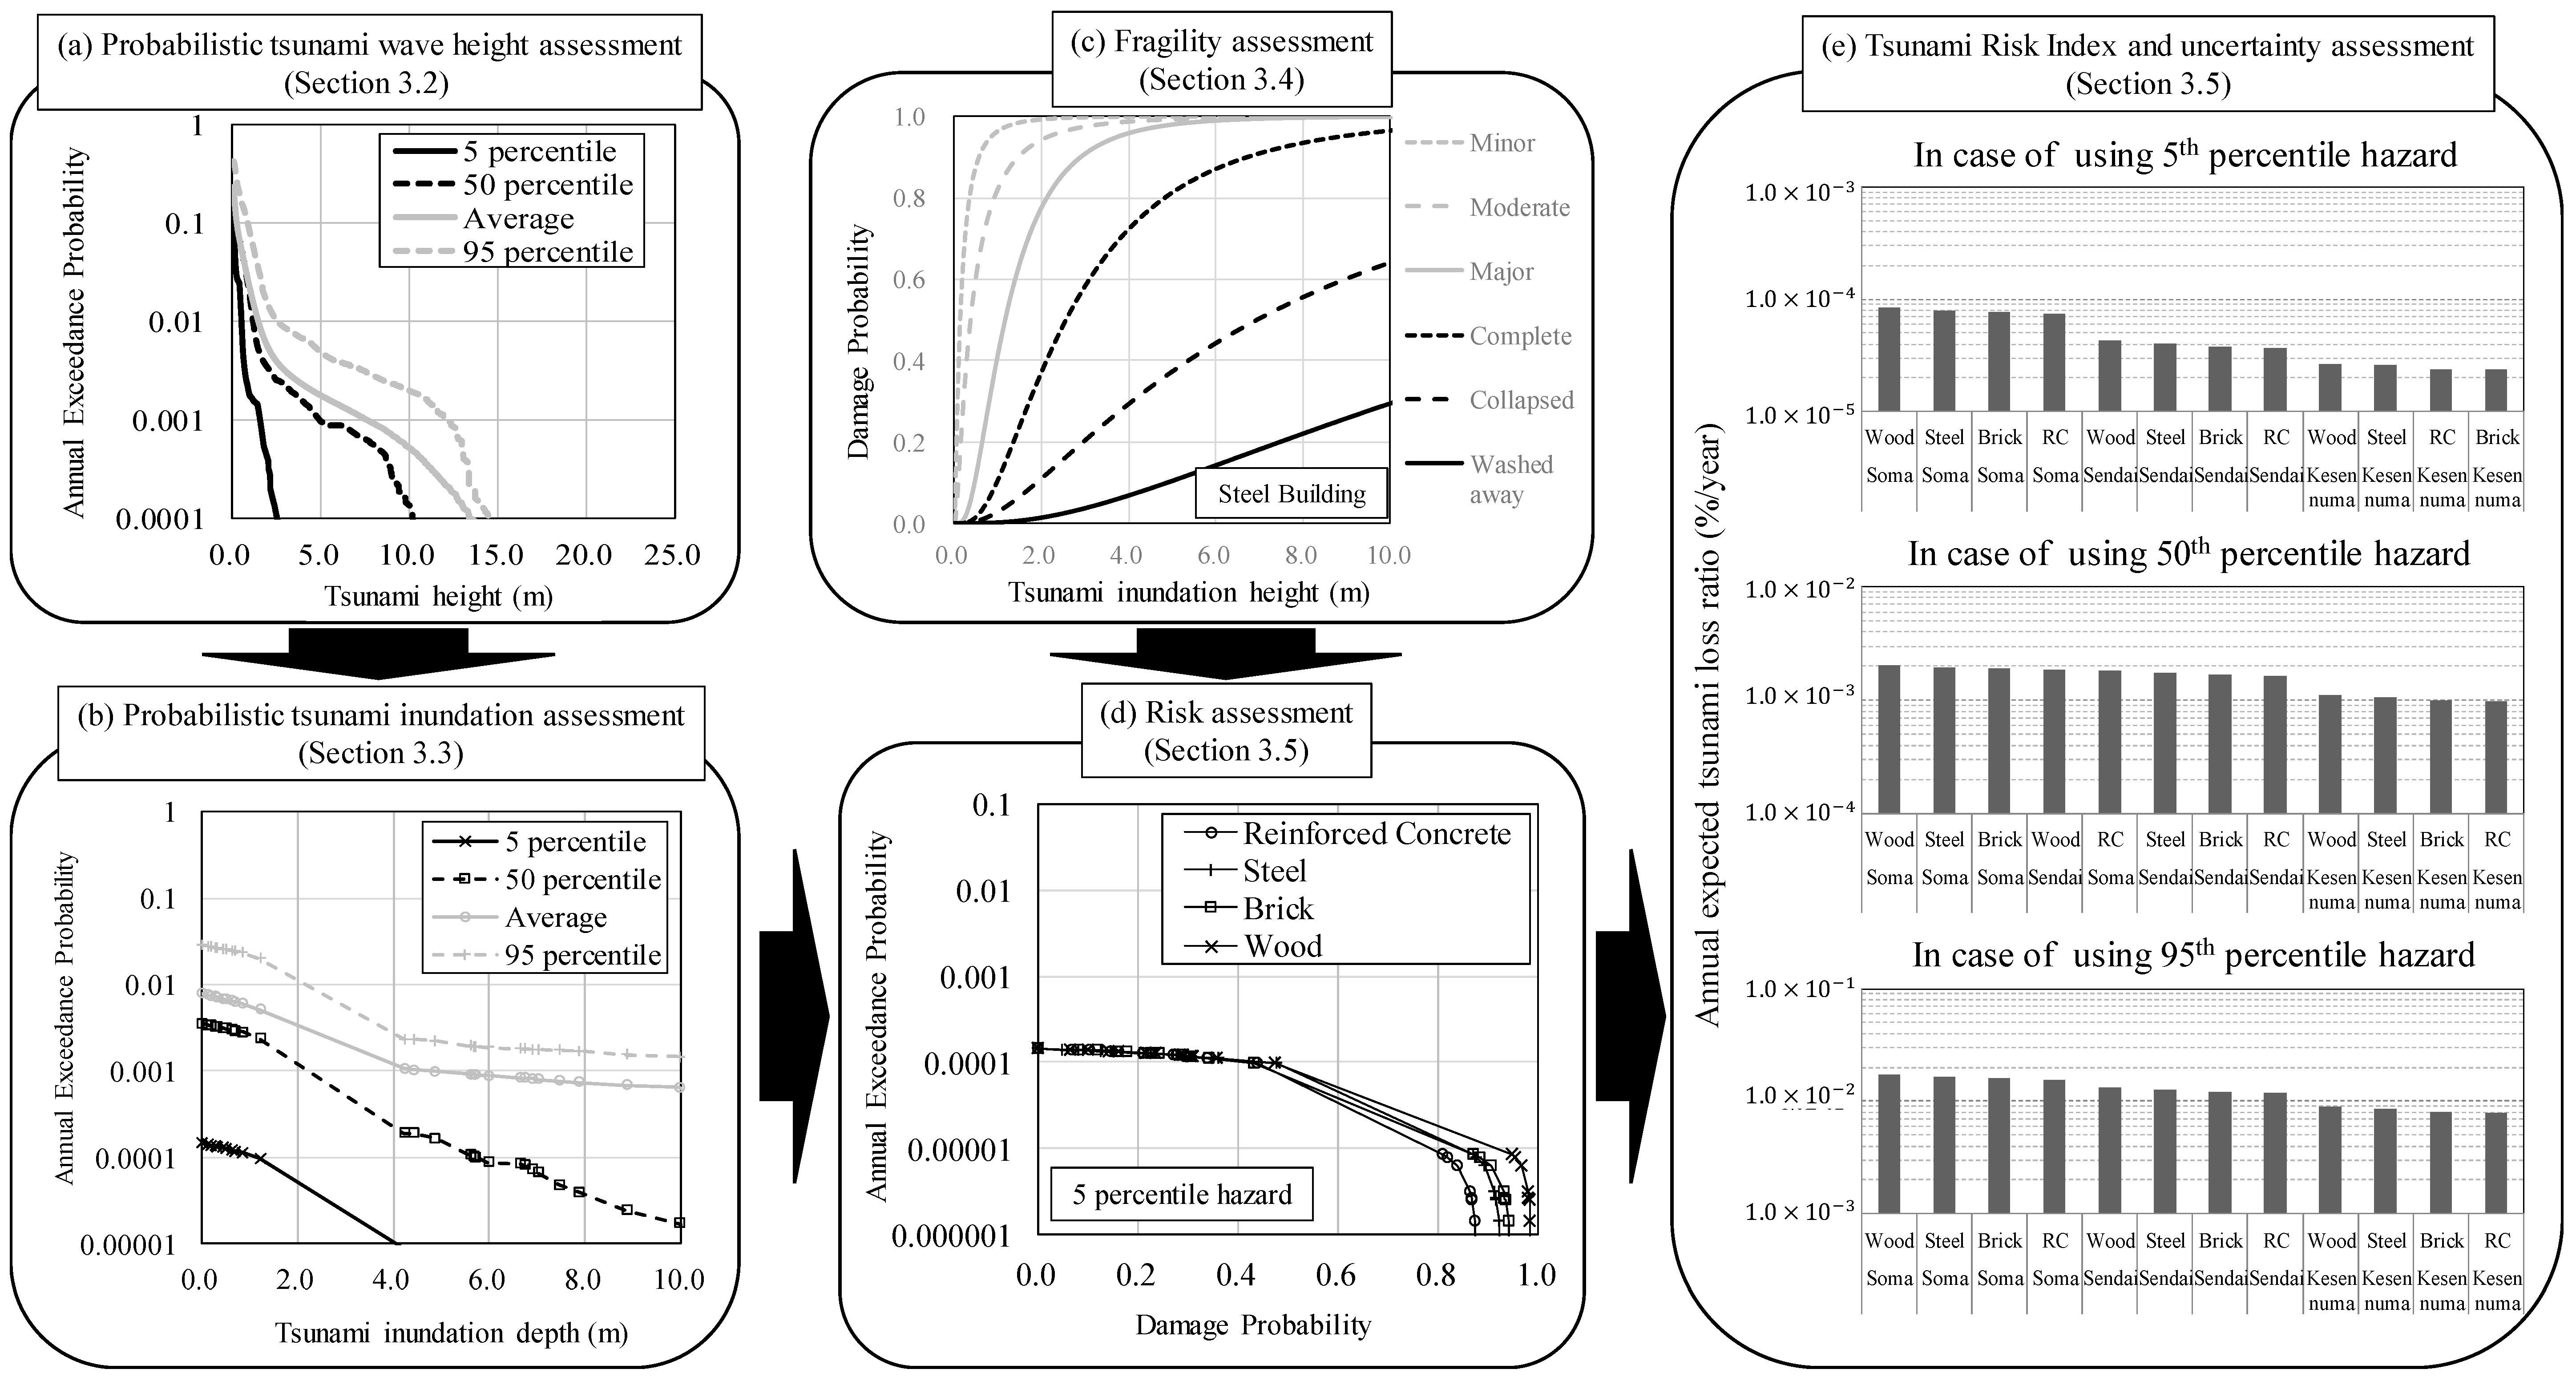
Figure 2 shows the workflow for the quantitative assessment of the risk posed by a tsunami of the direct damage of a building located at a specific location in consideration of tsunami hazard uncertainties. First, the tsunami wave height simulated from each fault source exceeding a specific level () is determined as follows:
where i is the number of assumed fault sources in one earthquake region, j is the number of logic tree branches, k is the number of assumed earthquake regions and is the aleatory uncertainty, which is defined as a lognormal normal distribution. Then, the annual exceedance frequency of the tsunami wave height in one earthquake region is calculated as follows using the annual exceedance frequency of each fault source :
If we assume a Poissonian arrival time distribution, the annual exceedance probability of the tsunami wave height in one earthquake region is given using the following exponential function:
By considering the annual excess probability of the tsunami wave height created for each logic tree branch and the weight of each logic tree branch , the annual exceedance probability of the tsunami wave height for each percentile (perc) in each earthquake region can be obtained as follows:
After calculating these curves for each earthquake region, we can obtain the annual exceedance probability of the tsunami wave height for each percentile (perc) for the entire earthquake region through the following formula (Figure 2a):
We convert this annual exceedance probability of the tsunami wave height into the annual exceedance probability of the tsunami inundation depth using the results from the tsunami numerical simulation (Figure 2b). Meanwhile, assuming that the tsunami-induced damage level of each building is n, the damage probability for each damage level can be written as follows (Figure 2c):
where represents the standardized normal distribution function for the damage levels and and represent the mean and standard deviation of , respectively. Then, by using the damage probability coefficient for each damage level (, the damage probability function can be written as follows:
In this study, we consider six damage levels: minor damage, moderate damage, major damage, complete damage, collapsed damage and washed away. Consequently, by using the annual exceedance probability of the inundation depth (Equation (5)) and the damage probability (Equation (7)), the tsunami risk curve for each percentile hazard can be written as follows (Figure 2d):
We should note that we have not performed a tsunami risk estimation that includes variability in the building response and uncertainties in the loss estimates because the main objective of this study is to quantify the epistemic uncertainties in tsunami hazards affecting the building risk. Future research will include other uncertainties in addition to those of hazards within the risk assessment. Finally, we can quantitatively evaluate the tsunami risk by integrating Equation 8 based on the definition of the tsunami risk. We can consider this index representative of the annual expected tsunami loss ratio (%/year), that is, a Tsunami Risk Index (TRI) (Figure 2e):
3. Application to the Tohoku Area
3.1. Assessment Targets
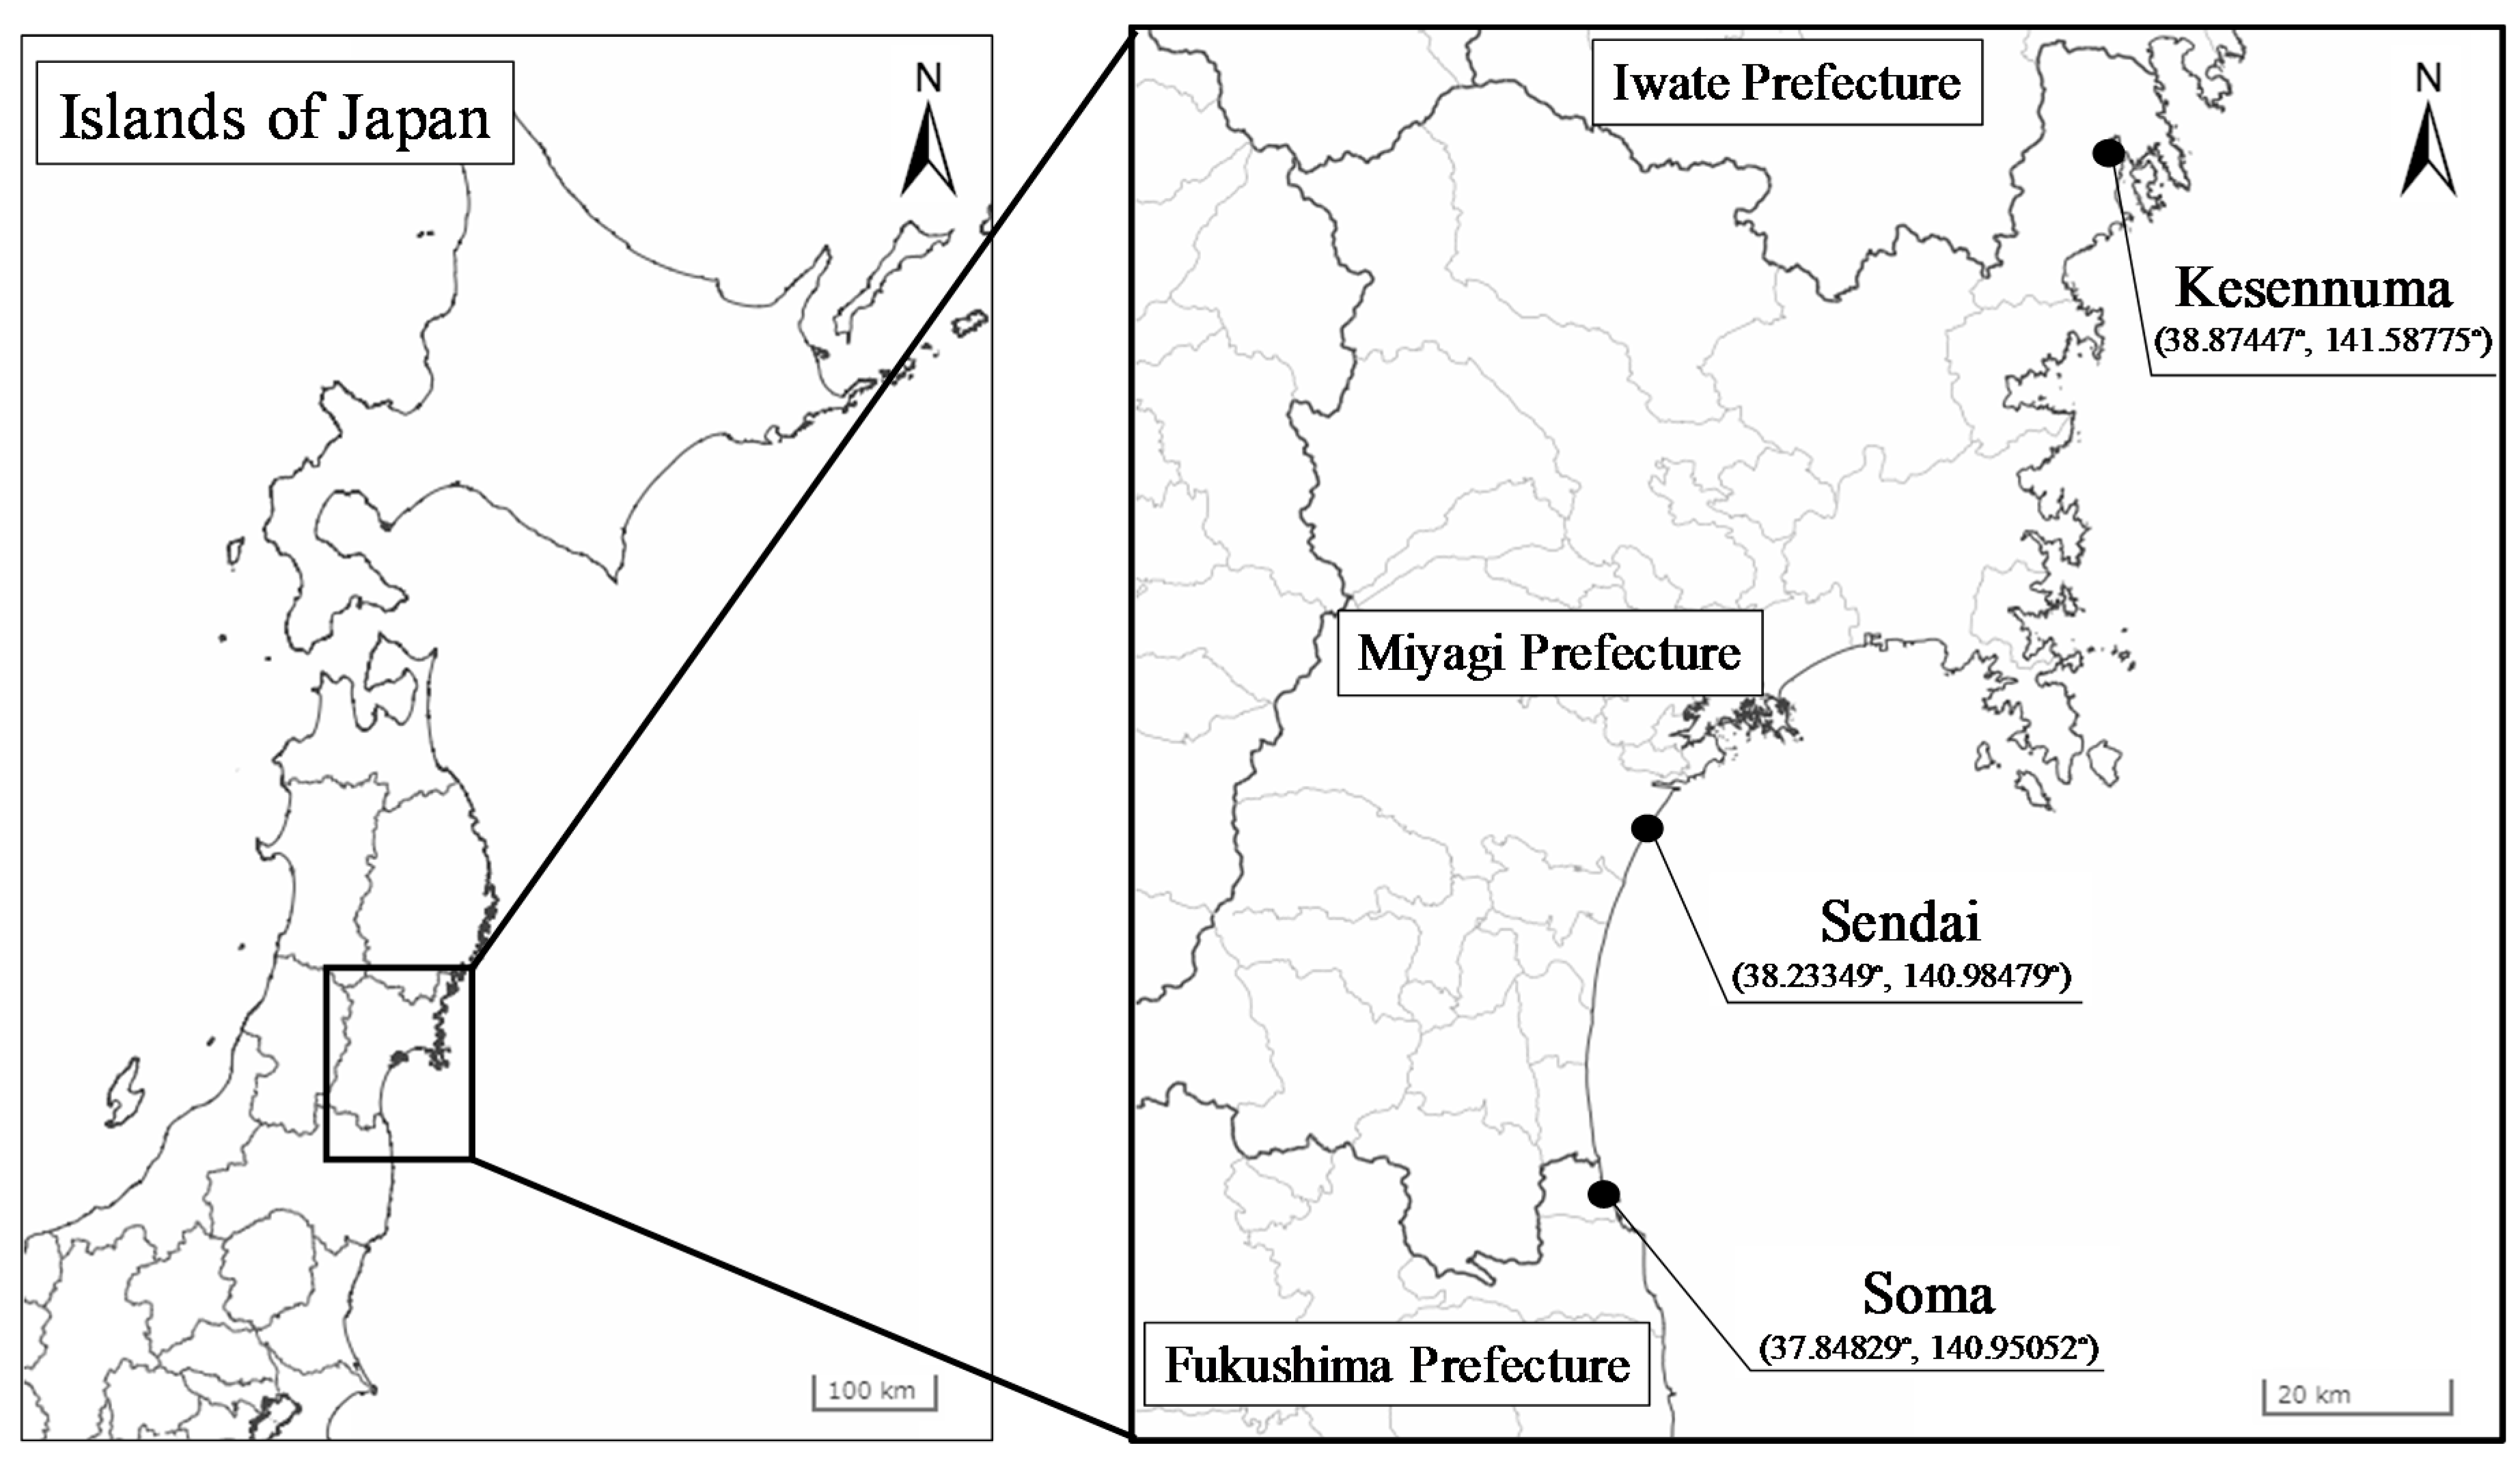
For the targets of the risk assessment, we considered wooden, brick, steel and reinforced concrete buildings located in the city of Soma in Fukushima Prefecture and the cities of Sendai and Kesennuma in Miyagi Prefecture. Figure 3 and Table 1 show the information for the locations of the buildings in each city. Kesennuma is in the ria coast, Sendai is inside of the Sendai bay and Soma is directly facing the Pacific Ocean. We selected these three regions to capture the difference of the tsunami risk due to different geography. The elevation and distance from coastline of the three cities also indicated in Table 1.
3.2. Probabilistic Tsunami Wave Height
3.2.1. Construction of the Logic Trees
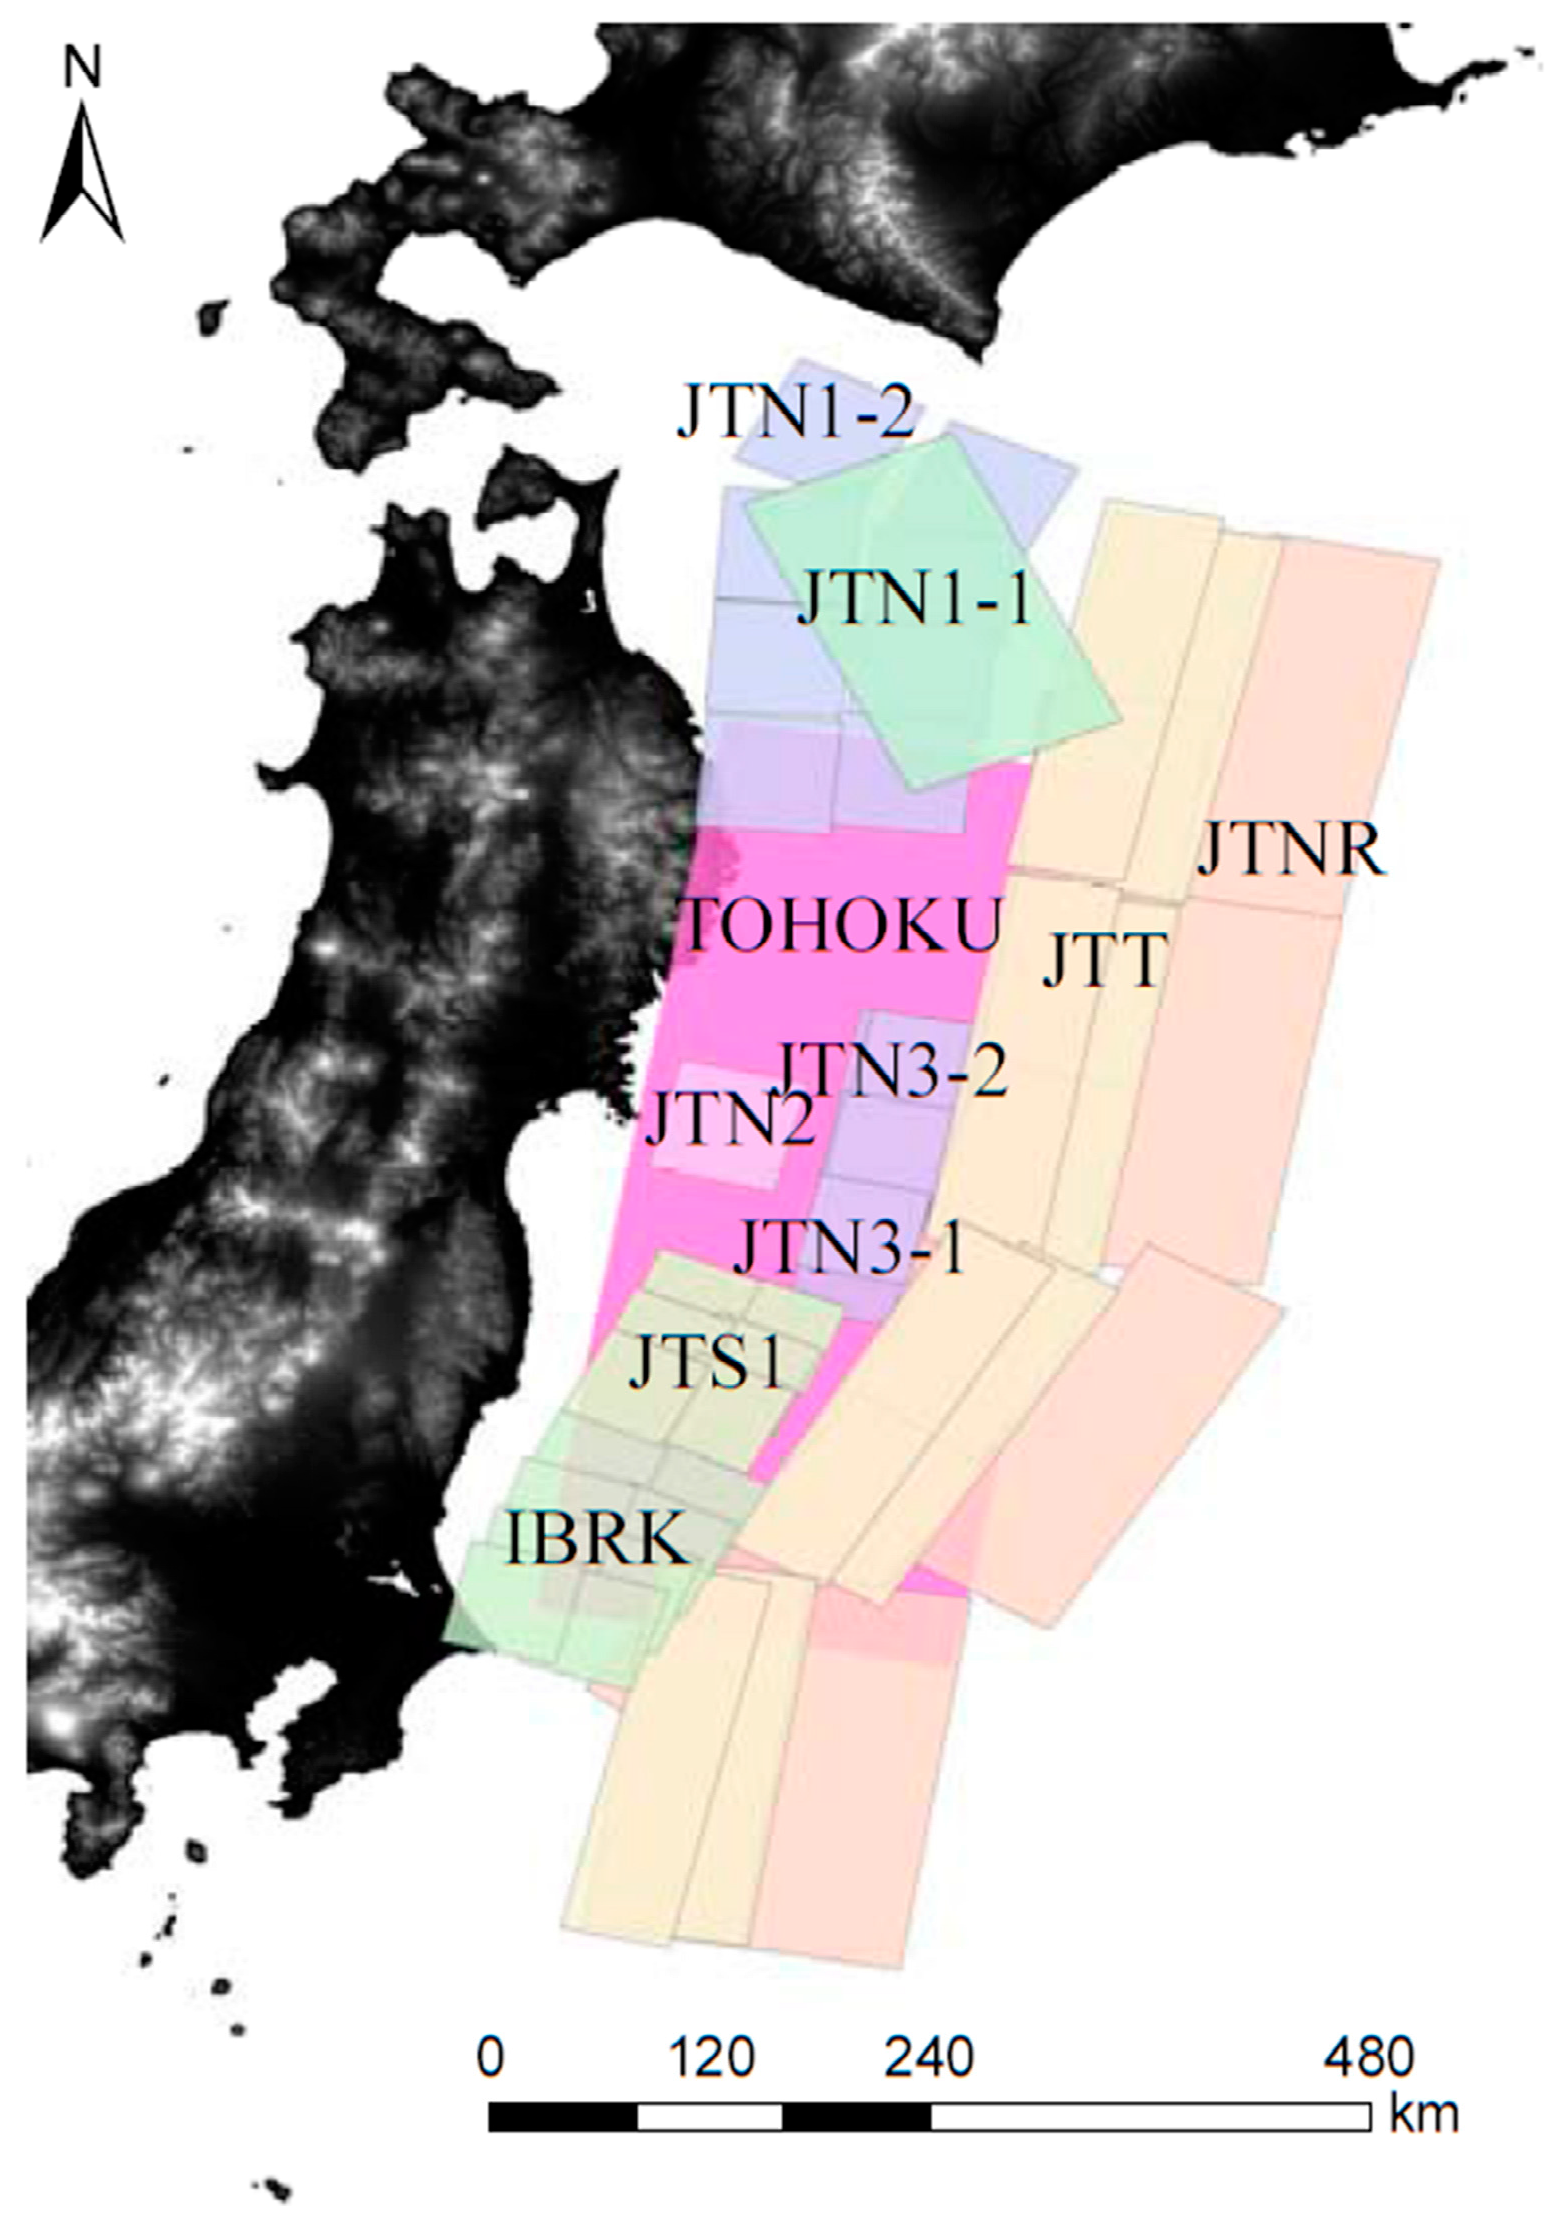
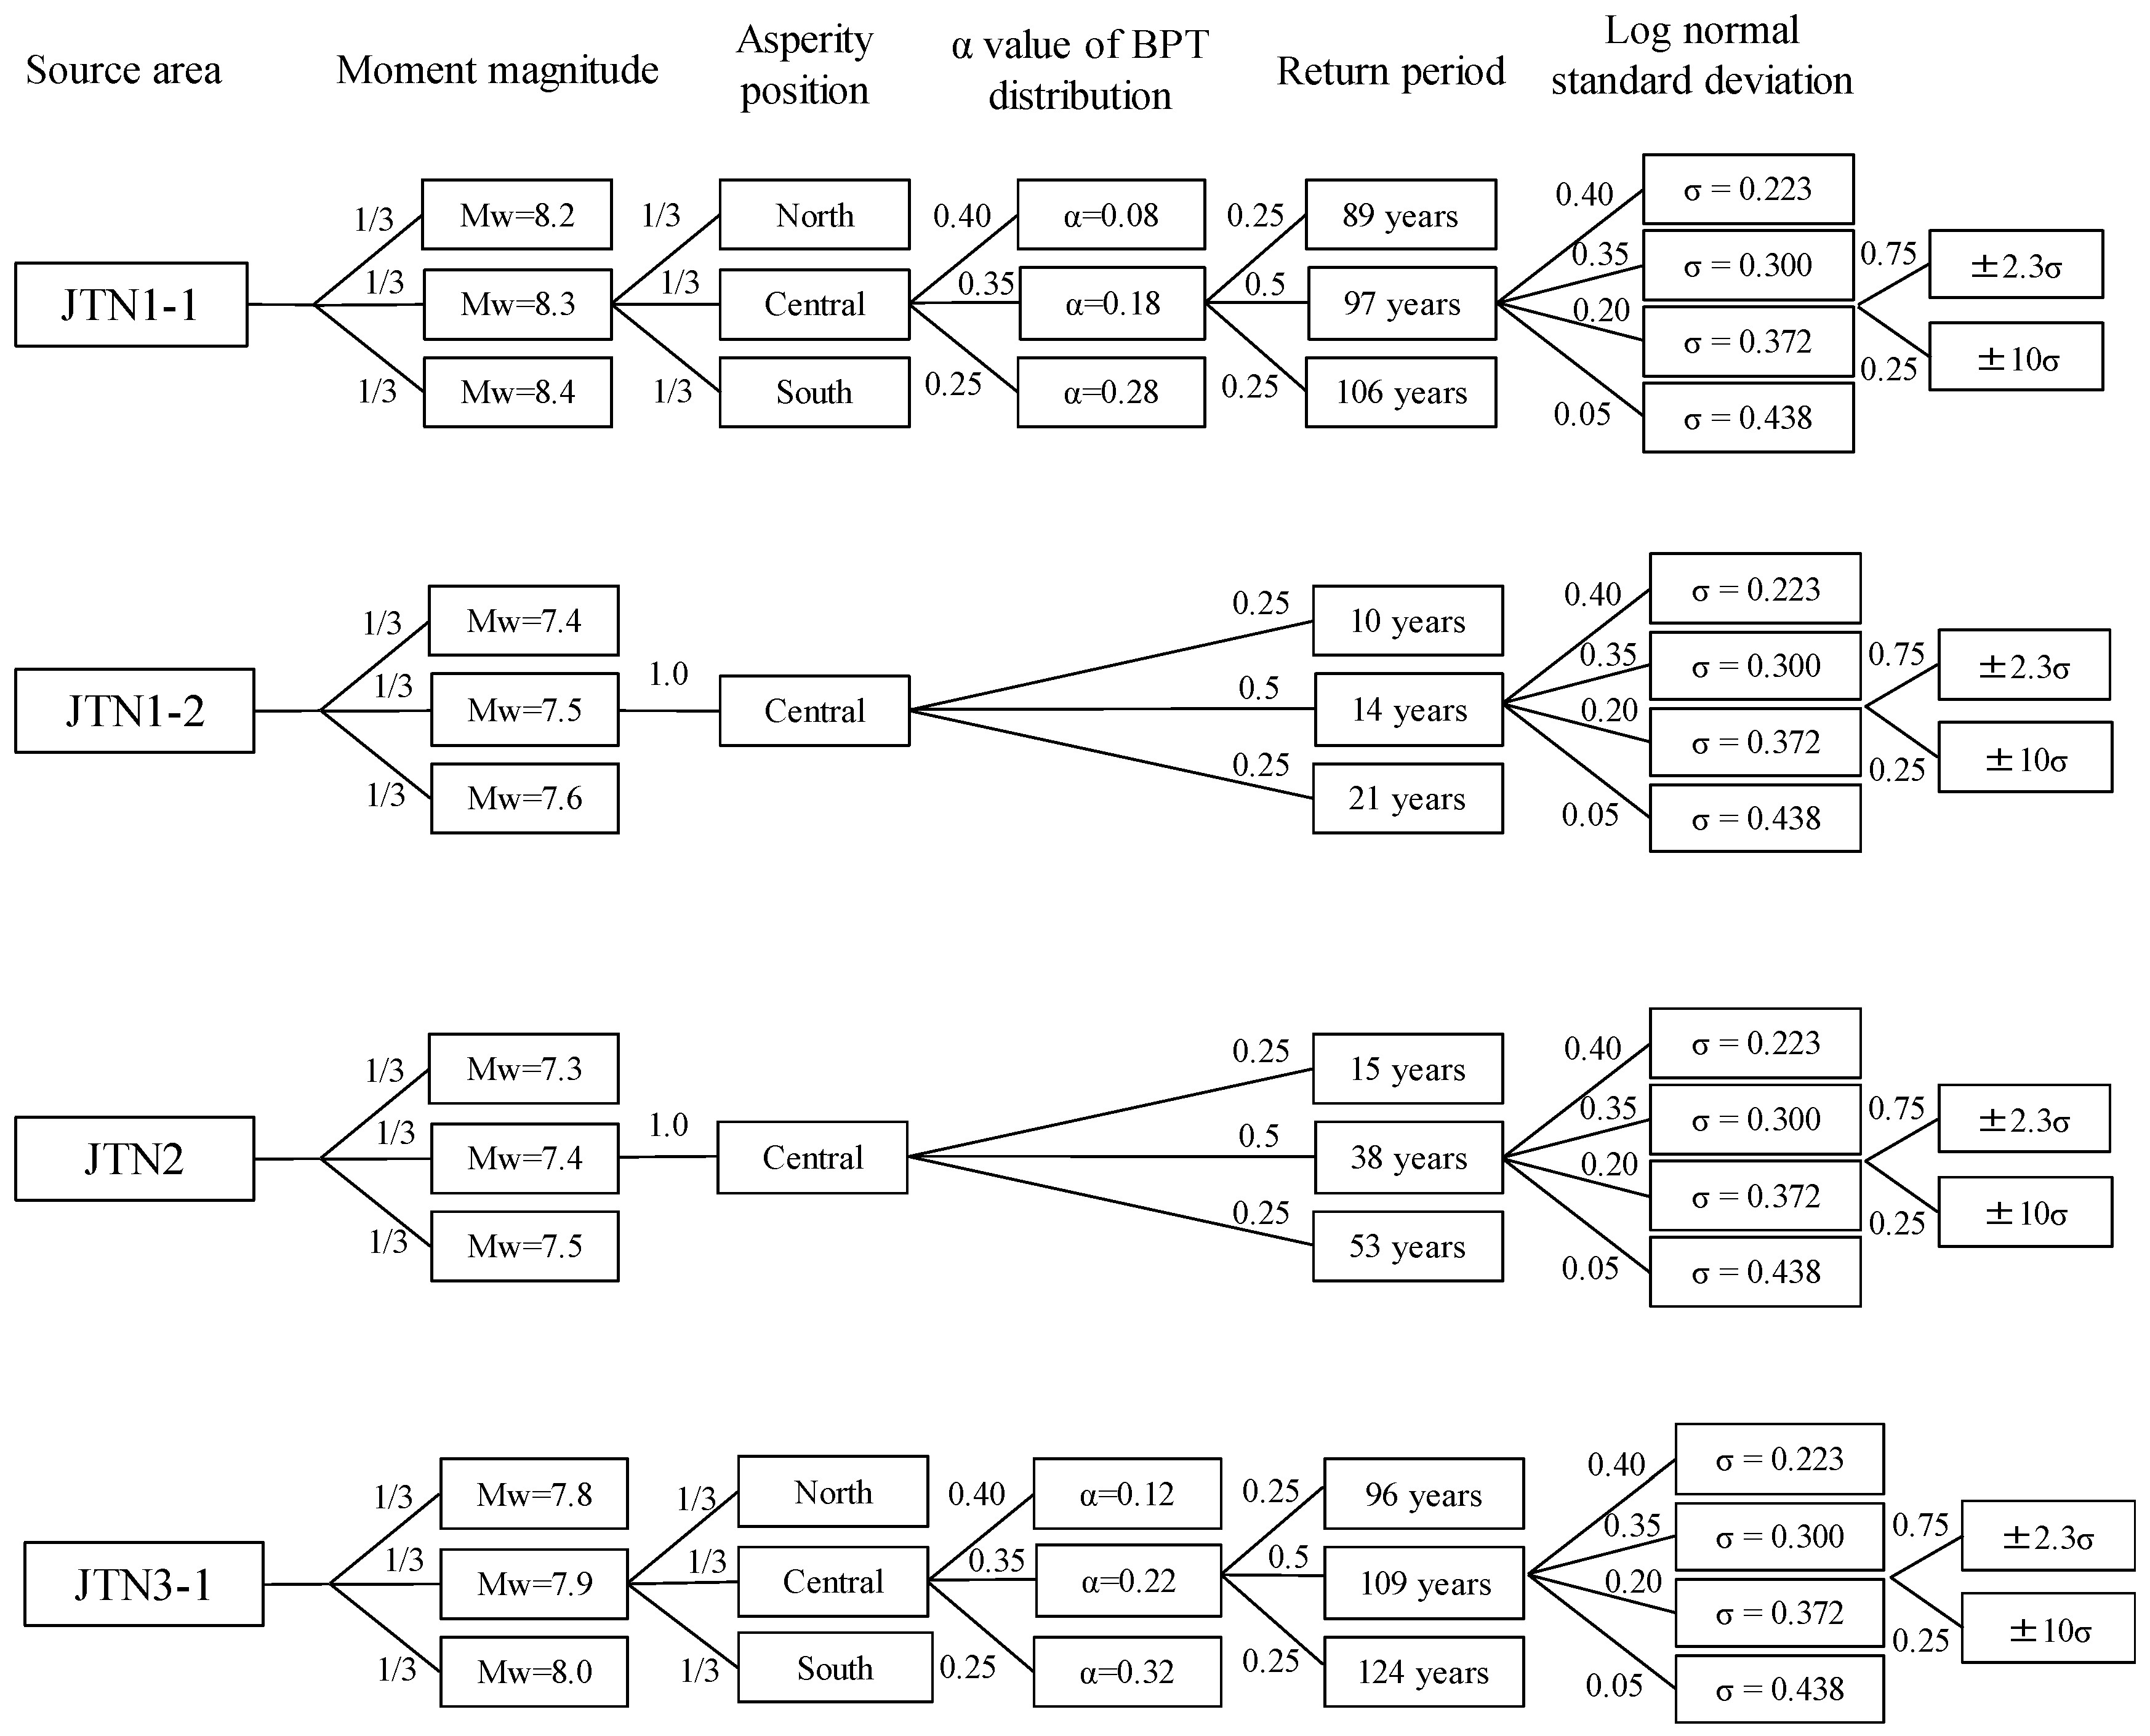
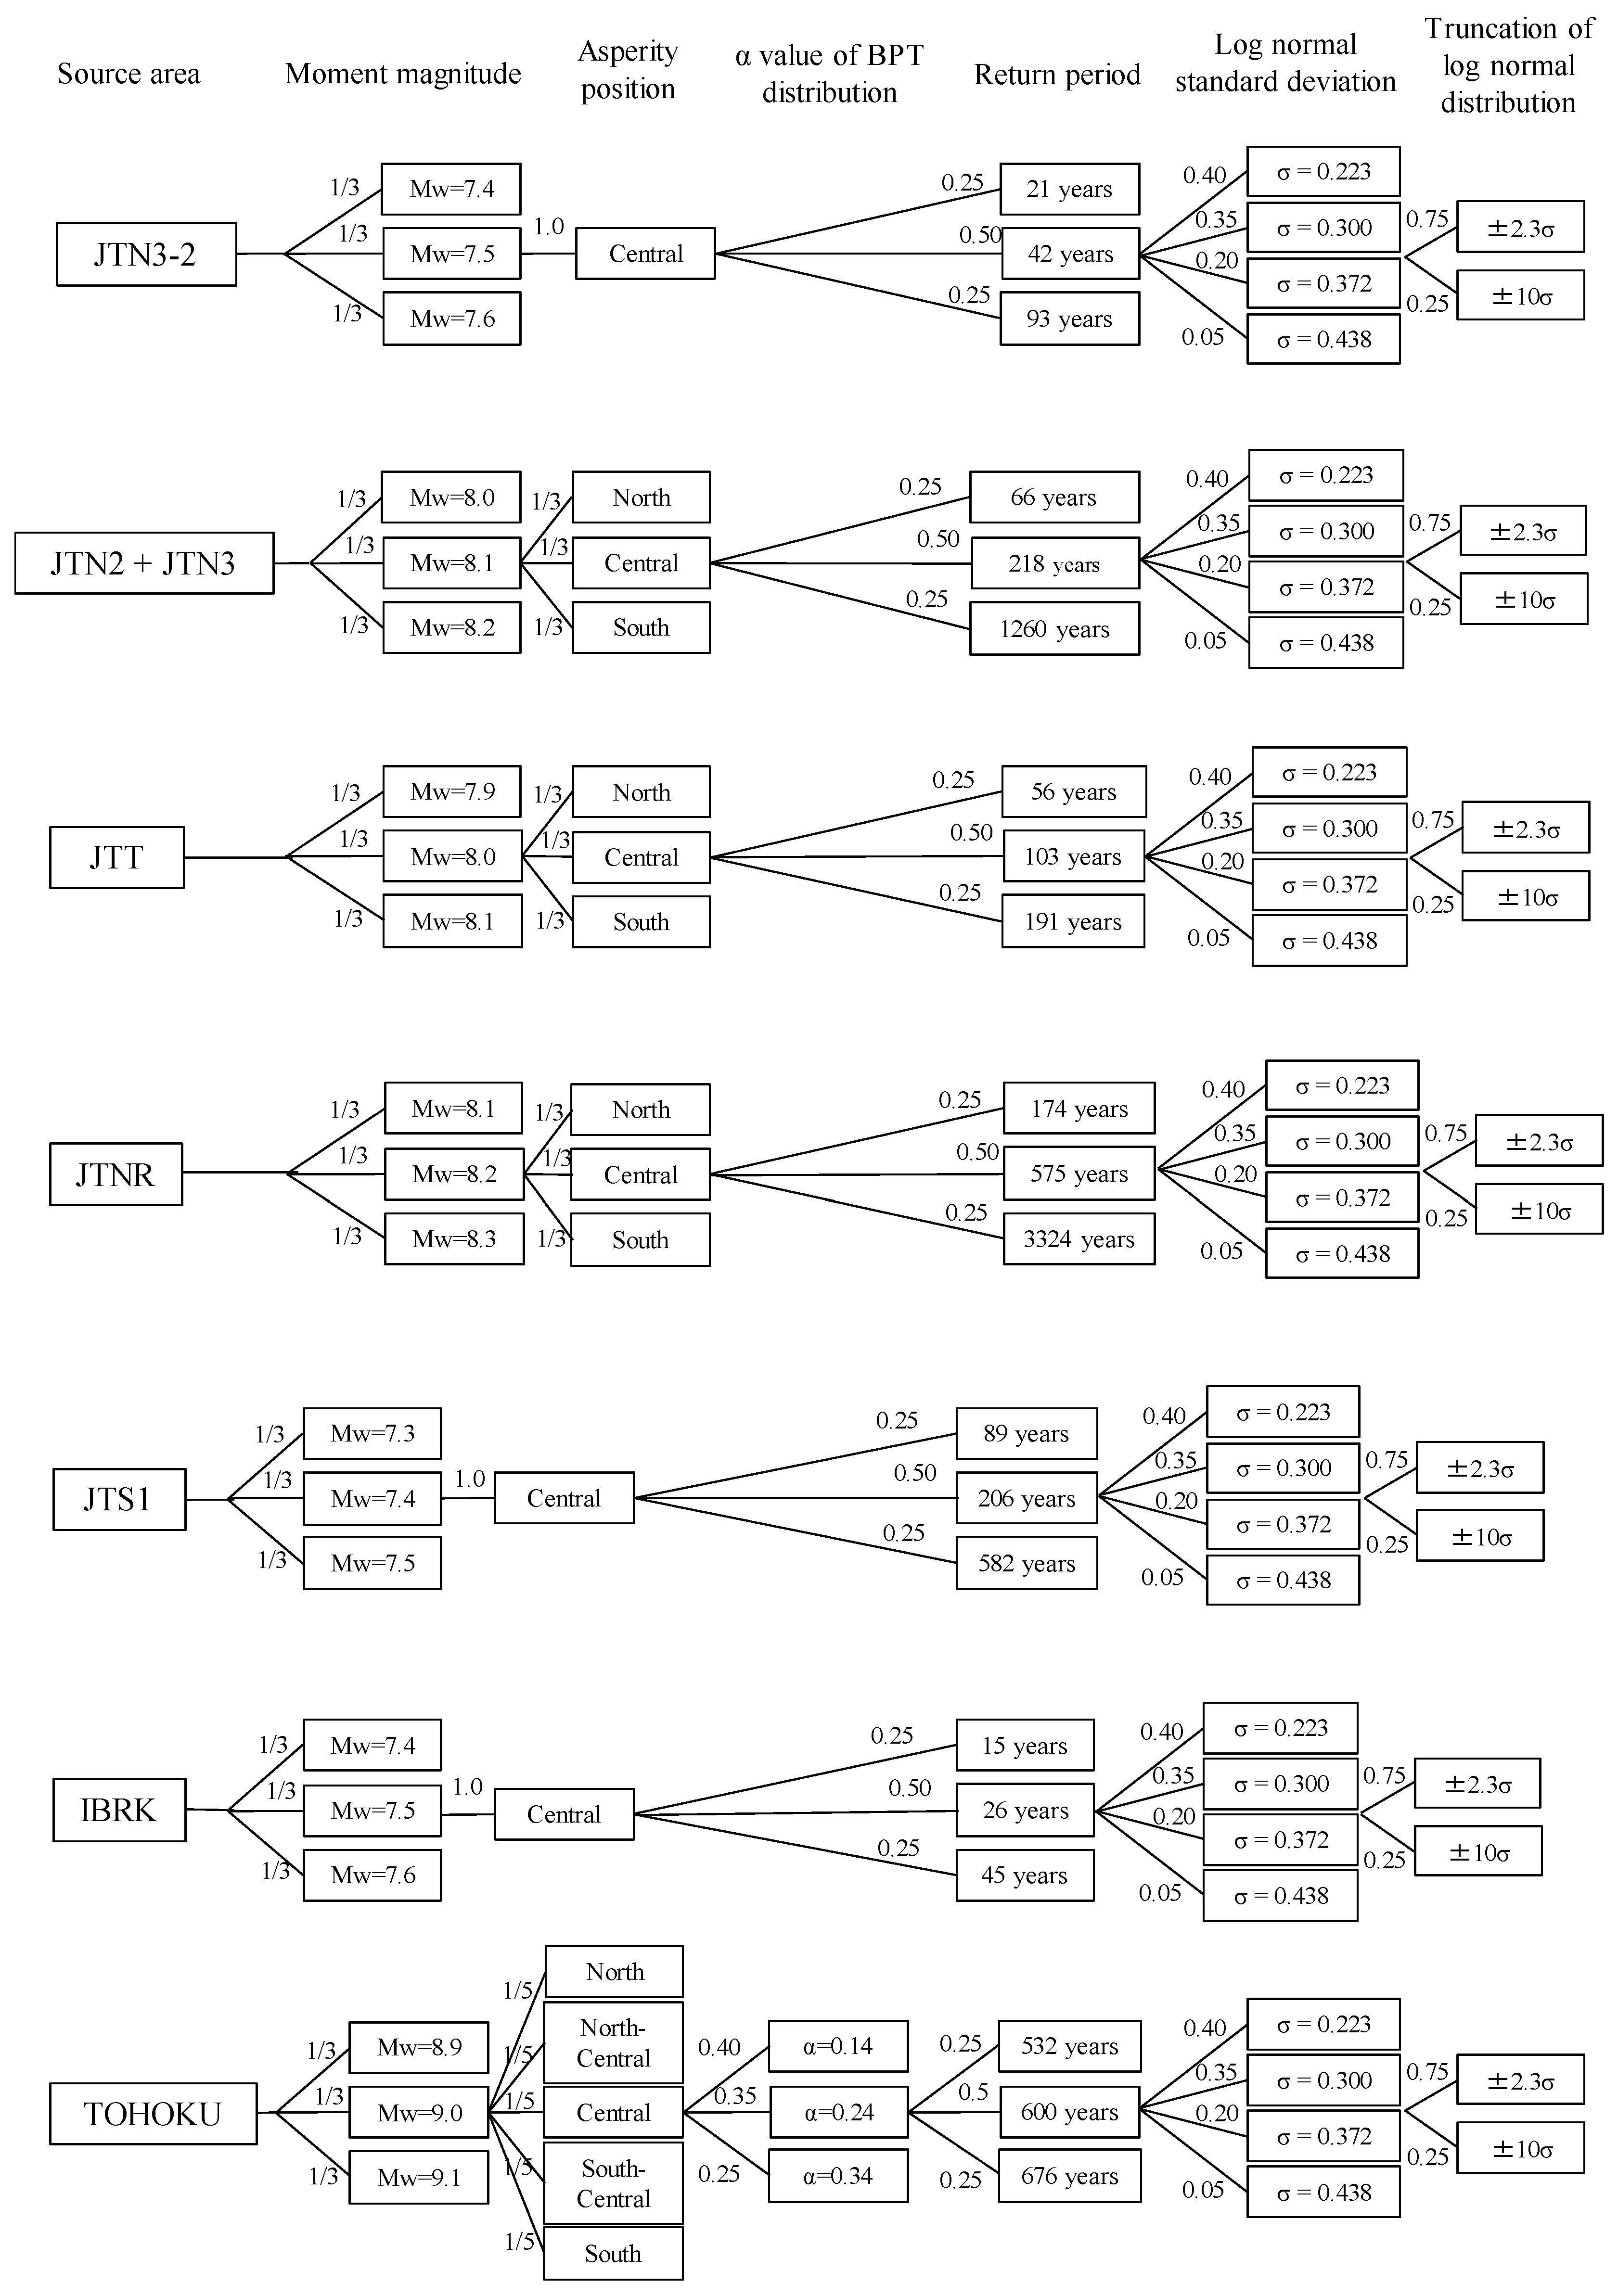
In this section, we aim to evaluate the probabilistic coastal tsunami height in the Tohoku region adjacent to the Pacific Ocean. First, we need to select an appropriate earthquake-generating fault to produce a tsunami. We select ten regions and one region of interlocking earthquakes from among the occurrence areas of trench-type earthquakes along the Japan Trench used in the probabilistic earthquake prediction map released by the NIED [14], all of which are shown in Figure 4 and Table 2 as earthquake faults that could generate tsunamis. These selections exclude both earthquakes with moment magnitudes (Mw) reaching 7.4 or less in consideration of a variation of ±0.1 Mw and earthquakes for which the source fault is unlikely to be predicted beforehand. To evaluate the epistemic uncertainties for these eleven fault regions, we use the logic tree method proposed in Annaka’s study [10]. Figure 5 shows the logic tree constructed for these regions. We establish five branches within the logic tree: The Mw range of the earthquake, the asperity position of the earthquake fault, the average occurrence interval (return period) of the earthquake, the standard deviation of the lognormal distribution followed by the error of the tsunami wave height and the truncation range of the lognormal distribution. Except for the asperity position of the earthquake fault, the other four branches follow the branches shown in Annaka’s study [10]. The total number of branches in the logic tree constructed using this approach is 3384 branches. The outline of setting for each branch is as follows.
The Mw range of each earthquake is varied by ±0.1. This Mw variation is accomplished by changing the average slip amount along the entire fault. For the asperity position of the fault, three types of branches with asperities located at the center of the fault and near both ends of the fault are established when the fault length is 150 km or more. Since only Tohoku-type earthquakes have long lengths (approximately 500 km), we set five branches by adding two cases where an additional asperity is located between the three asperities. The method utilized to establish the asperity positions along the fault is detailed in Fukutani et al. [15]. Regarding the occurrence probability of the earthquake, we construct three types of branches that take into consideration the confidence interval of the occurrence probability determined by the probabilistic seismic motion prediction evaluation published by the NIED [14]. Table 3 shows the model name for the generation interval of the earthquake, α value of the BPT distribution, average return period, sample period, earthquake generation time within the period used to determine the average occurrence interval and lower and upper limits of the confidence interval for each earthquake fault, which are shown in the Headquarters for Earthquake Research Promotion [16]. See Appendix A for the method used to establish the confidence intervals. Although the probability of the occurrence of an earthquake with a relatively small magnitude can be evaluated with high accuracy using the general Gutenberg-Richter rule, it is known that the probability of occurrence of a relatively high-magnitude earthquake that causes a large tsunami cannot be perfectly evaluated using the Gutenberg-Richter rule. Based upon this background, in this study, we note that data of the return period collected as the result of a detailed examination of the historical earthquake record are used. Regarding the standard deviation of the lognormal distribution (i.e. aleatory uncertainty) followed by the error of the tsunami wave height, we use the modeling error in the tsunami numerical simulation results and observation records, that is, the geometrical standard deviation κ of Aida [17], for the past eleven historical earthquakes represented by the following expression based on Annaka’s study [10]:
where n is the number of observation points, i is the observation point, βi = (Ri/Hi), Ri is the observed tsunami height at the i-th point and Hi is the simulated value at the i-th point. The values of κ are evaluated from the past eleven historical earthquakes. The minimum value is the result for the 1707 Hoei earthquake, where κ = 1.35 (σ = log κ = 0.300) and the maximum value is the result for the 1946 Nankai earthquake, where κ = 1.60 (σ = log κ = 0.470). Finally, two types of branches with ±2.3σ and ±10σ are established as truncation values at both ends of the lognormal distribution.
The numbers attached to the branches of the logic trees are the weights of each branch and the sum of all of the weights is set to 1.0. The weights of the branches containing the Mw range and asperity positions along the fault are set by equally dividing their weights. Regarding the branch consisting of the occurrence probability of the earthquakes, we use a weight of 0.50 for the central branch and 0.25 for the branches at both ends to consider the confidence interval. The weight value adopted in Annaka’s study [10] is also adopted for the weights of the branches for the standard deviation of the lognormal distribution and the truncation range.
3.2.2. Tsunami Numerical Simulation
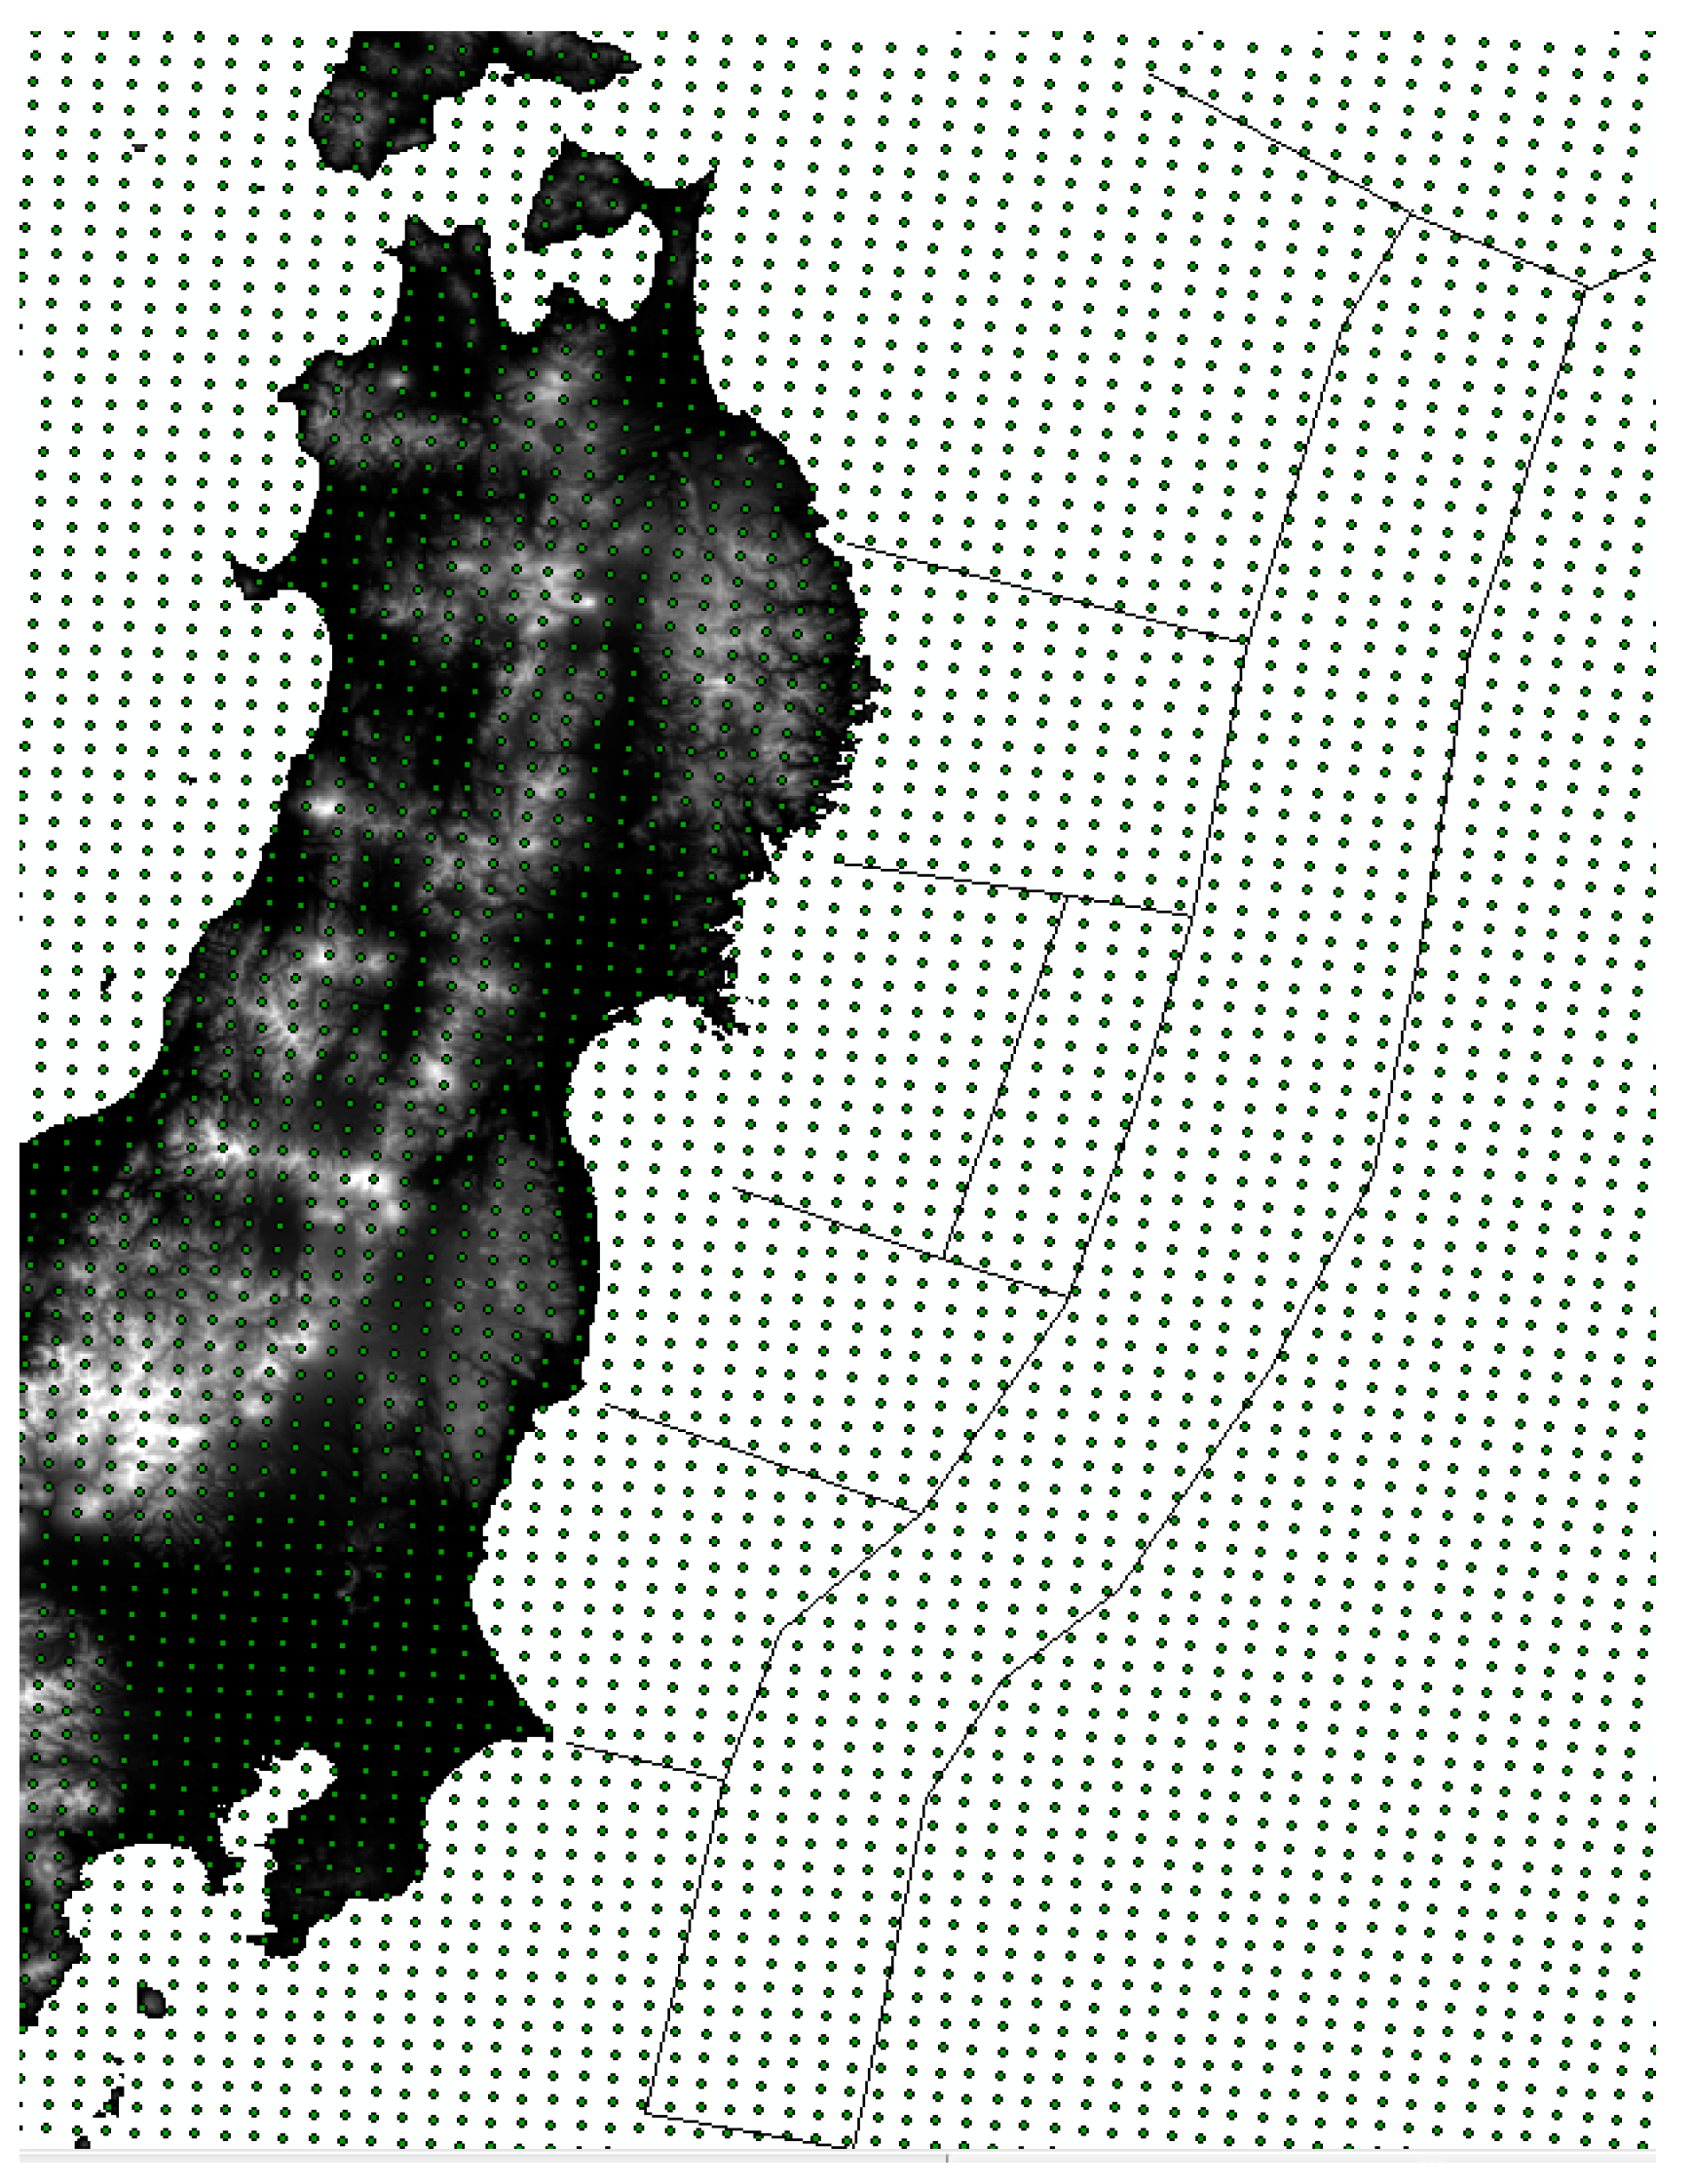
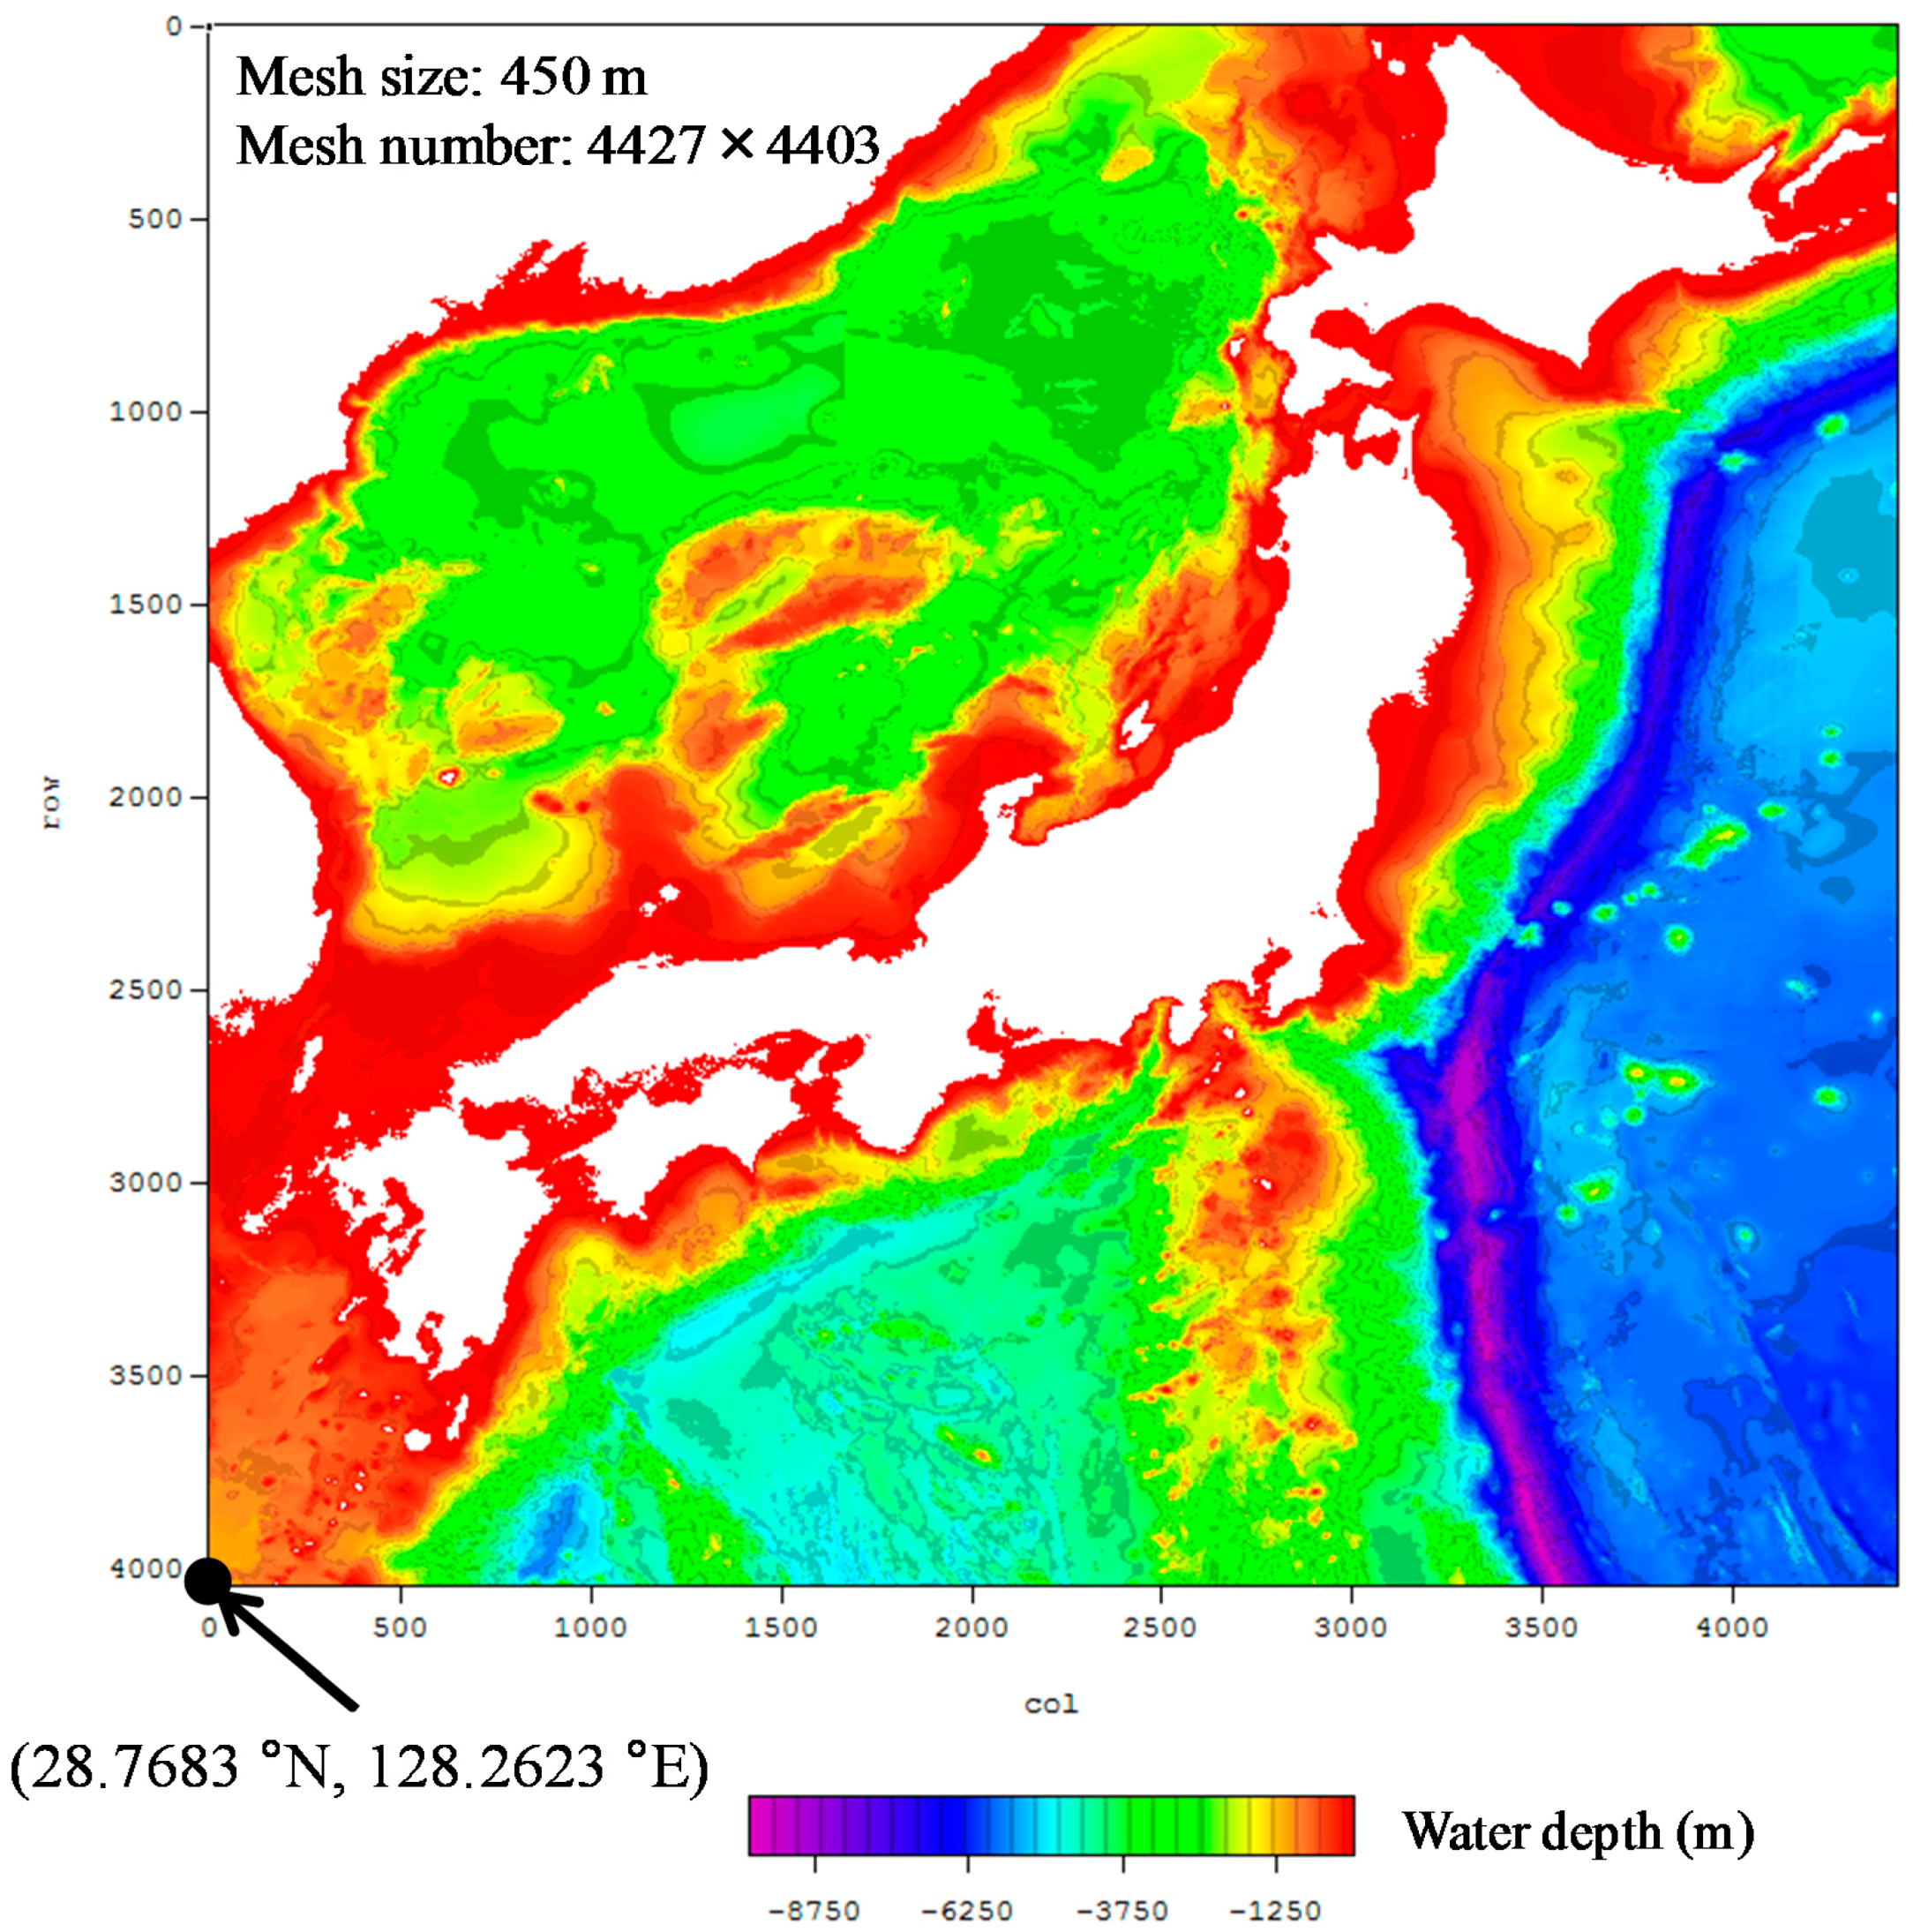
For each branch comprising either the Mw range or asperity positions in the logic trees constructed in the previous section, the fault parameters for the tsunami numerical simulation are determined. The fault parameters for the reference magnitudes of each fault are shown in Table 4. These data, which are related to the position of the fault, were published by the NIED [14]. To provide heterogeneous asperities along the fault planes, we generated 10 km mesh points covering the Japan Trench area shown in Figure 6 while assuming the presence of small faults with lengths and widths of 10 km and setting a slip amount to each fault. As described above, the method used to establish the asperity along the 3.11 Tohoku earthquake-type fault is described in Fukutani et al. [15]. The depth of each small fault was set considering its length, width and dip estimated from the depth along the entire fault. The strike, dip and rake of each small fault were set to the same values as those along the entire fault. The calculation conditions of the tsunami numerical simulation are shown in Table 5 and the terrain data used for the simulation are shown in Figure 7. The terrain data were generated from 30 s gridded depth data (J-TOPO 30, Japan Hydrographic Association) near the islands of Japan and a mesh of 500 m bathymetry data (J-EGG 500, Japan Oceanographic Data Center). We obtained the initial displaced water height using the formula of Okada [18] from these fault parameters. Using the calculated initially displaced water heights as input values, time integration was performed in each mesh using the continuous equation (Equation (12)) and the equations of motion (Equations (13) and (14)) based on a nonlinear longwave equation using the TUNAMI model (Tohoku University Numerical Analysis Modeling for Inundation) [19]:
where η is the water level, D is the total water depth, g is the gravitational acceleration, n is Manning’s roughness coefficient and M and N are the flow fluxes in the x and y directions. Taking into consideration the number of branches comprising the Mw range and asperity positions along the earthquake faults, there are 258 cases in which the tsunami numerical simulation can be performed.
3.2.3. Tsunami Hazard Curves at the Offshore Points
For each branch of the constructed logic tree, the maximum wave height in each mesh is determined according to the results of the tsunami numerical simulation. If we assume the simulated maximum wave height is the median value μ and if we use the lognormal standard deviation σ in the logic tree, we can obtain a probability density function of the tsunami wave height represented by the following (Equation (15)):
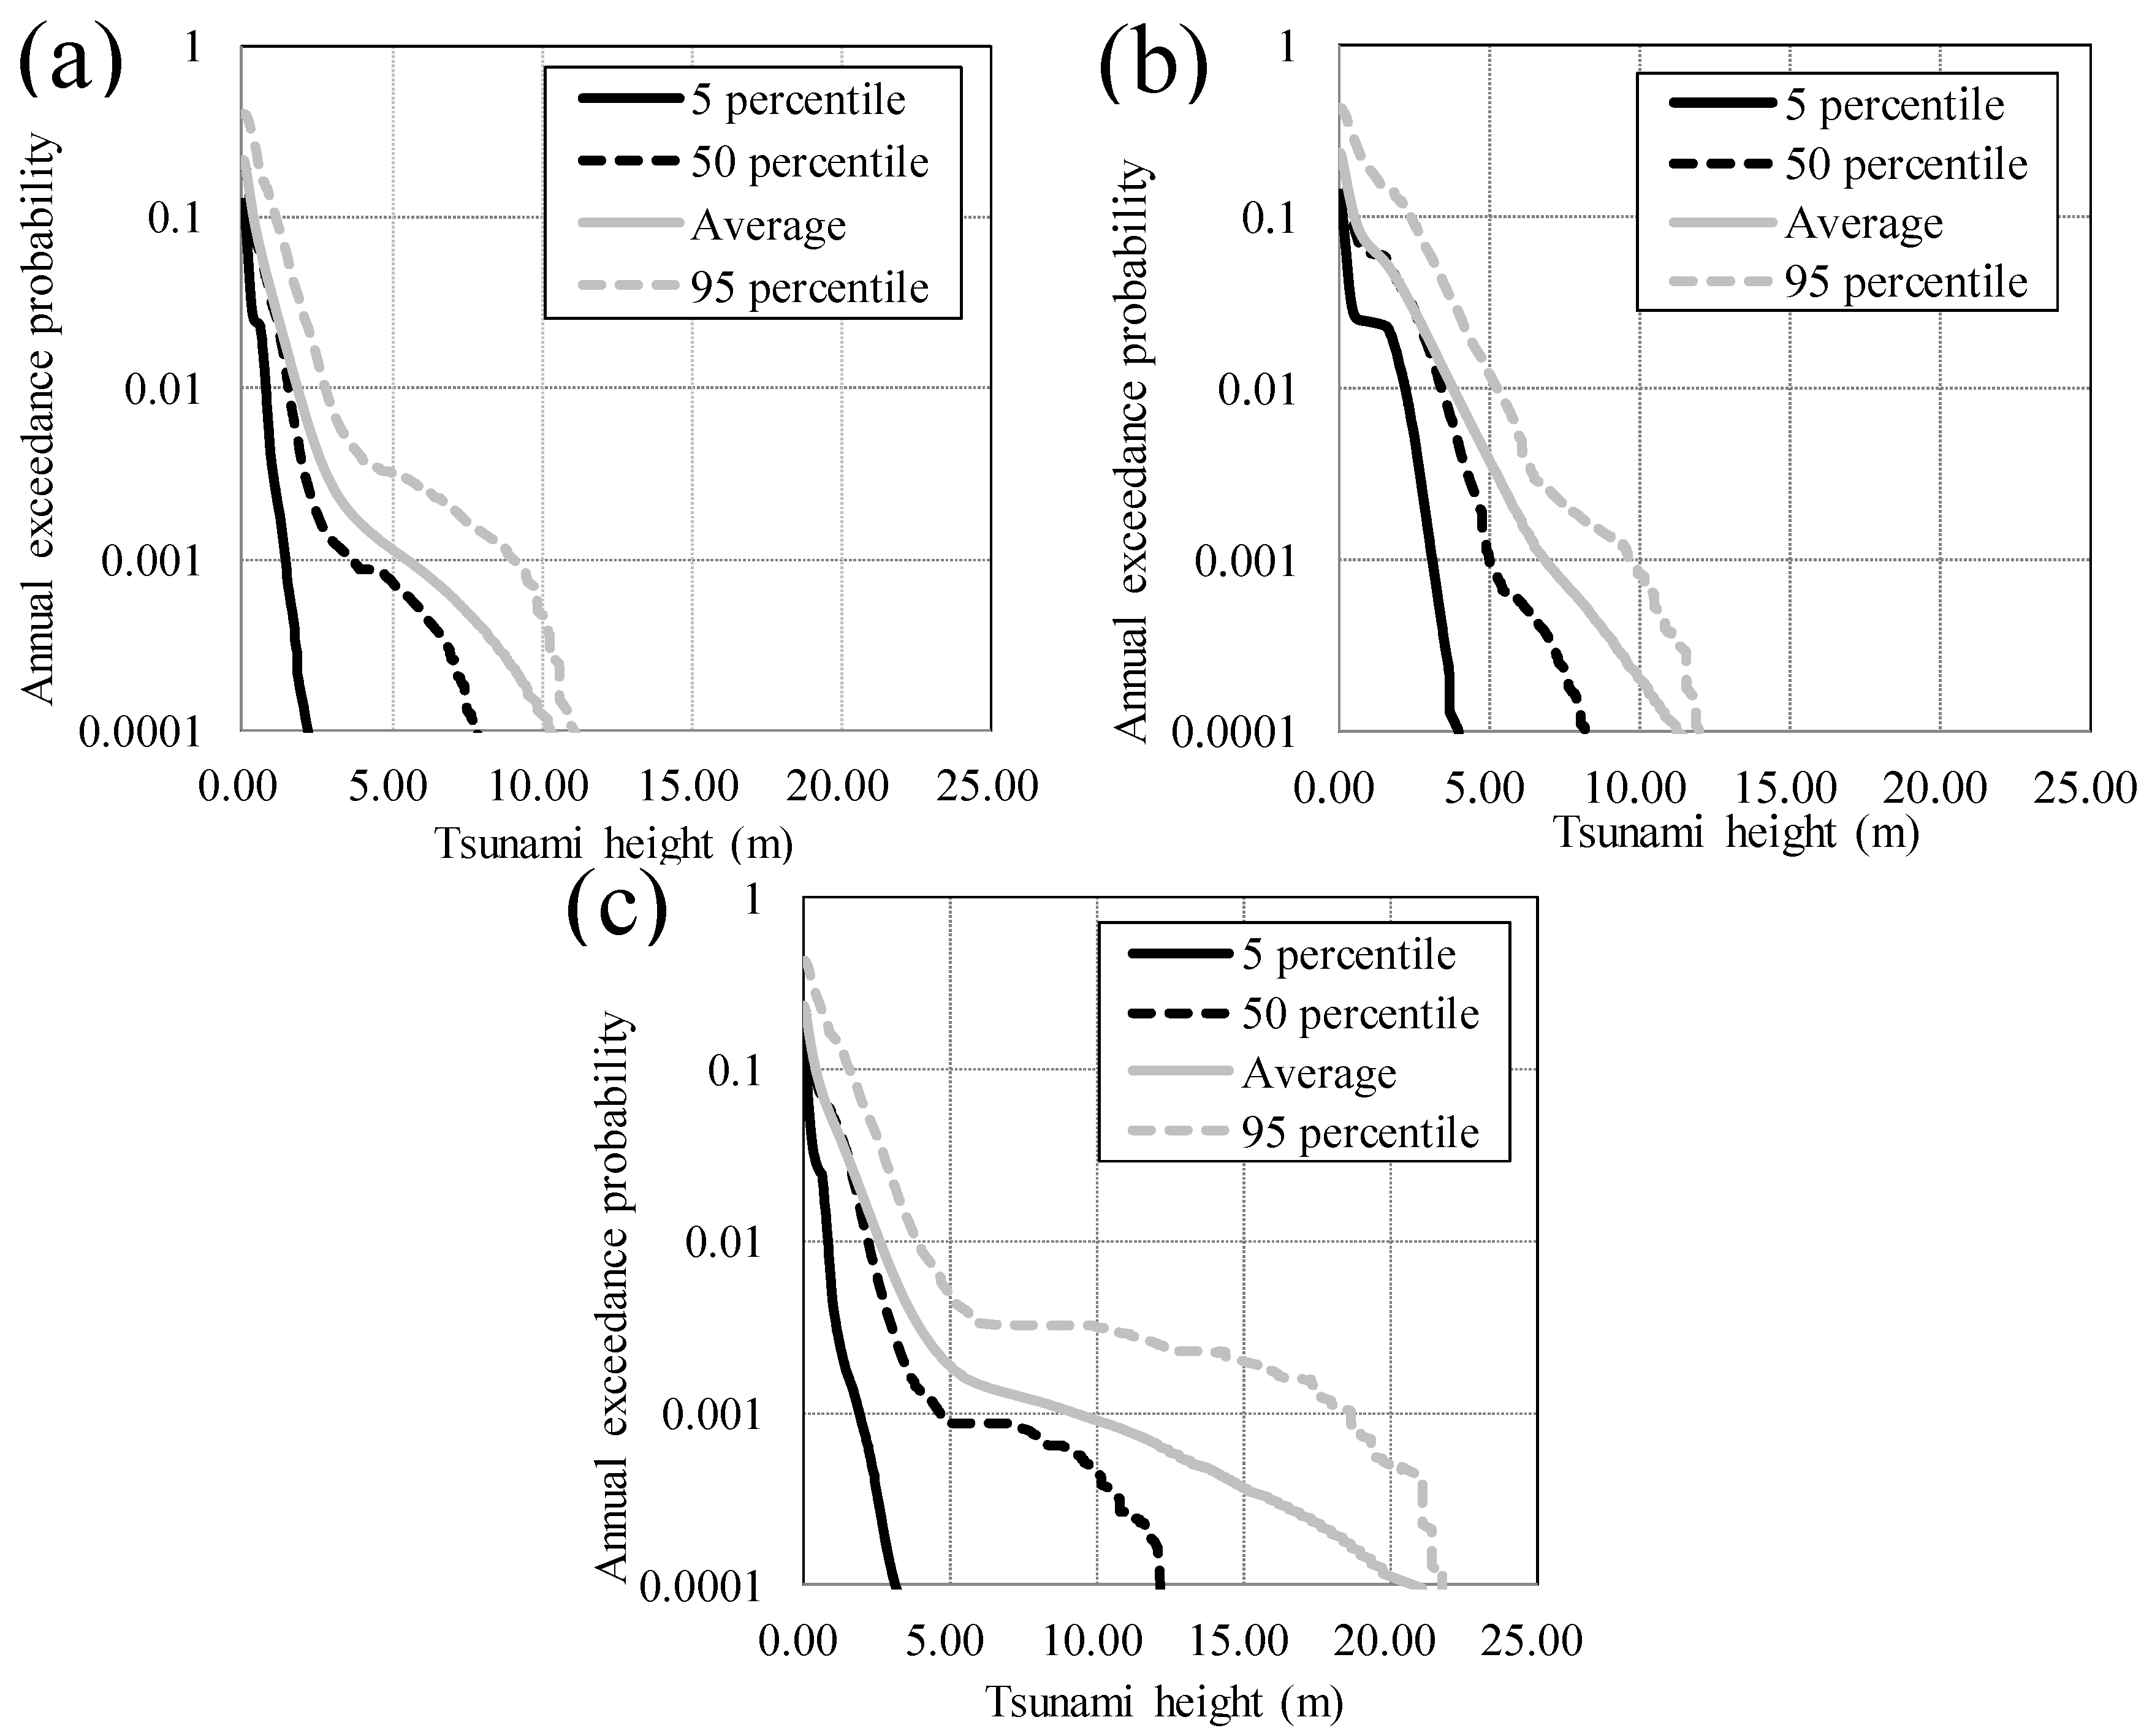
Next, by converting the probability density function into the exceedance probability distribution under an ergodic assumption, it is possible to obtain the tsunami hazard curve expressed by the relationship between the tsunami wave height and the annual exceedance probability for each branch of the logic tree. The ergodic assumption is a statistical assumption that the spatial variation is equal to the temporal variation. By evaluating the annual exceedance probability distribution within an earthquake area and drawing curves along percentile paths in consideration of the weights of the logic tree branches, it is possible to estimate the tsunami hazard curve (i.e. a fractile curve) for that earthquake area. Finally, we integrate each tsunami hazard curve for each earthquake area. The evaluation results for 10 m water depths off Soma, Sendai and Kesennuma are shown in Figure 8.
3.3. Tsunami Inundation Assessment
3.3.1. Probabilistic Tsunami Hazard Map
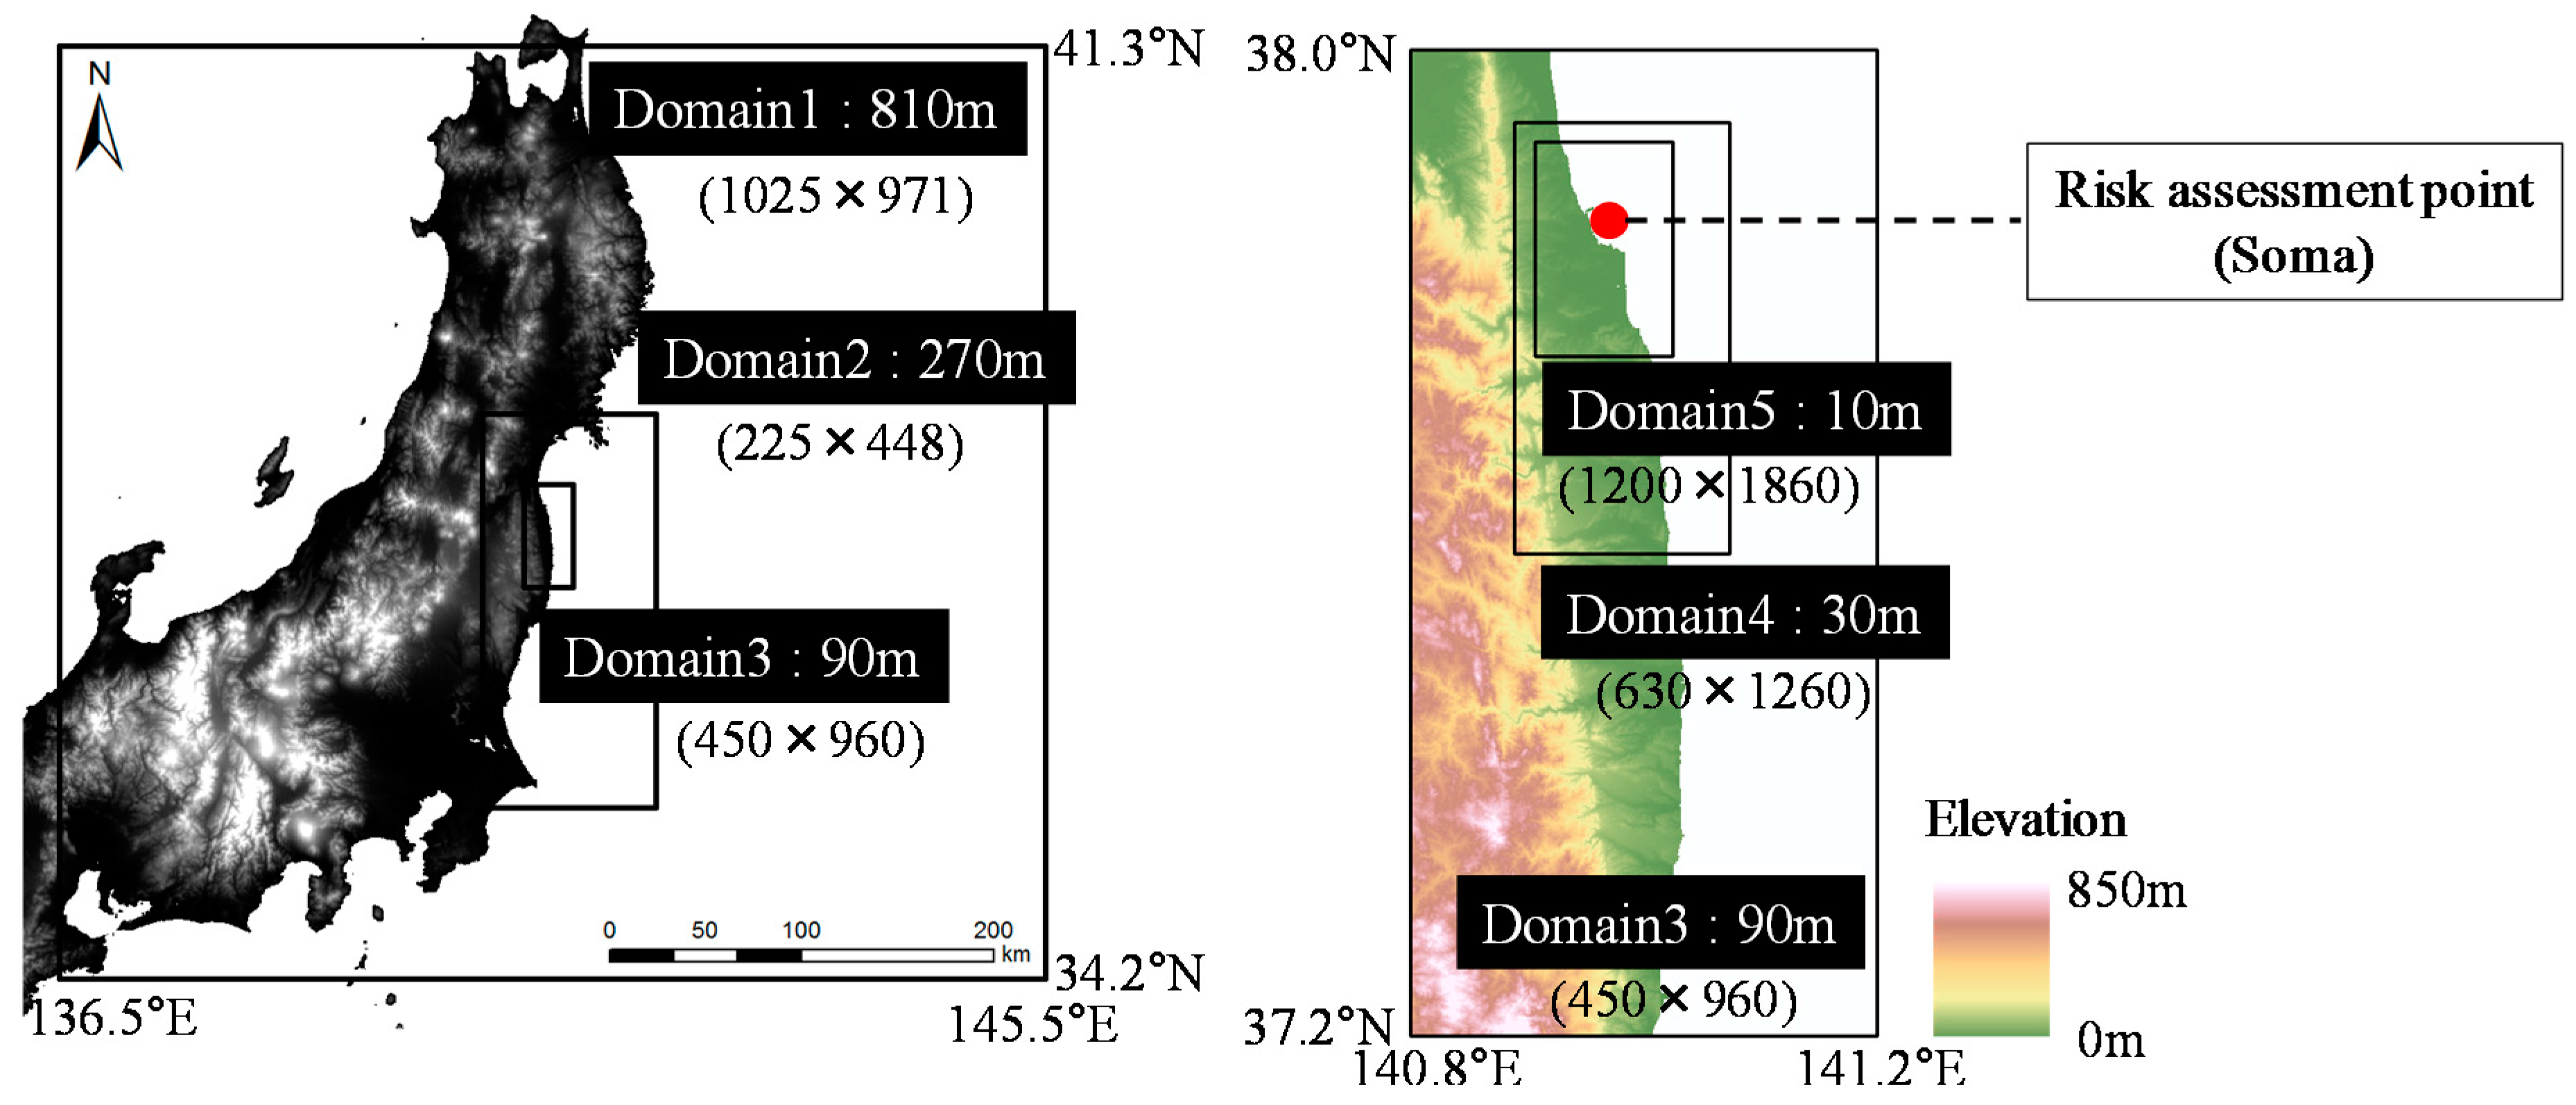
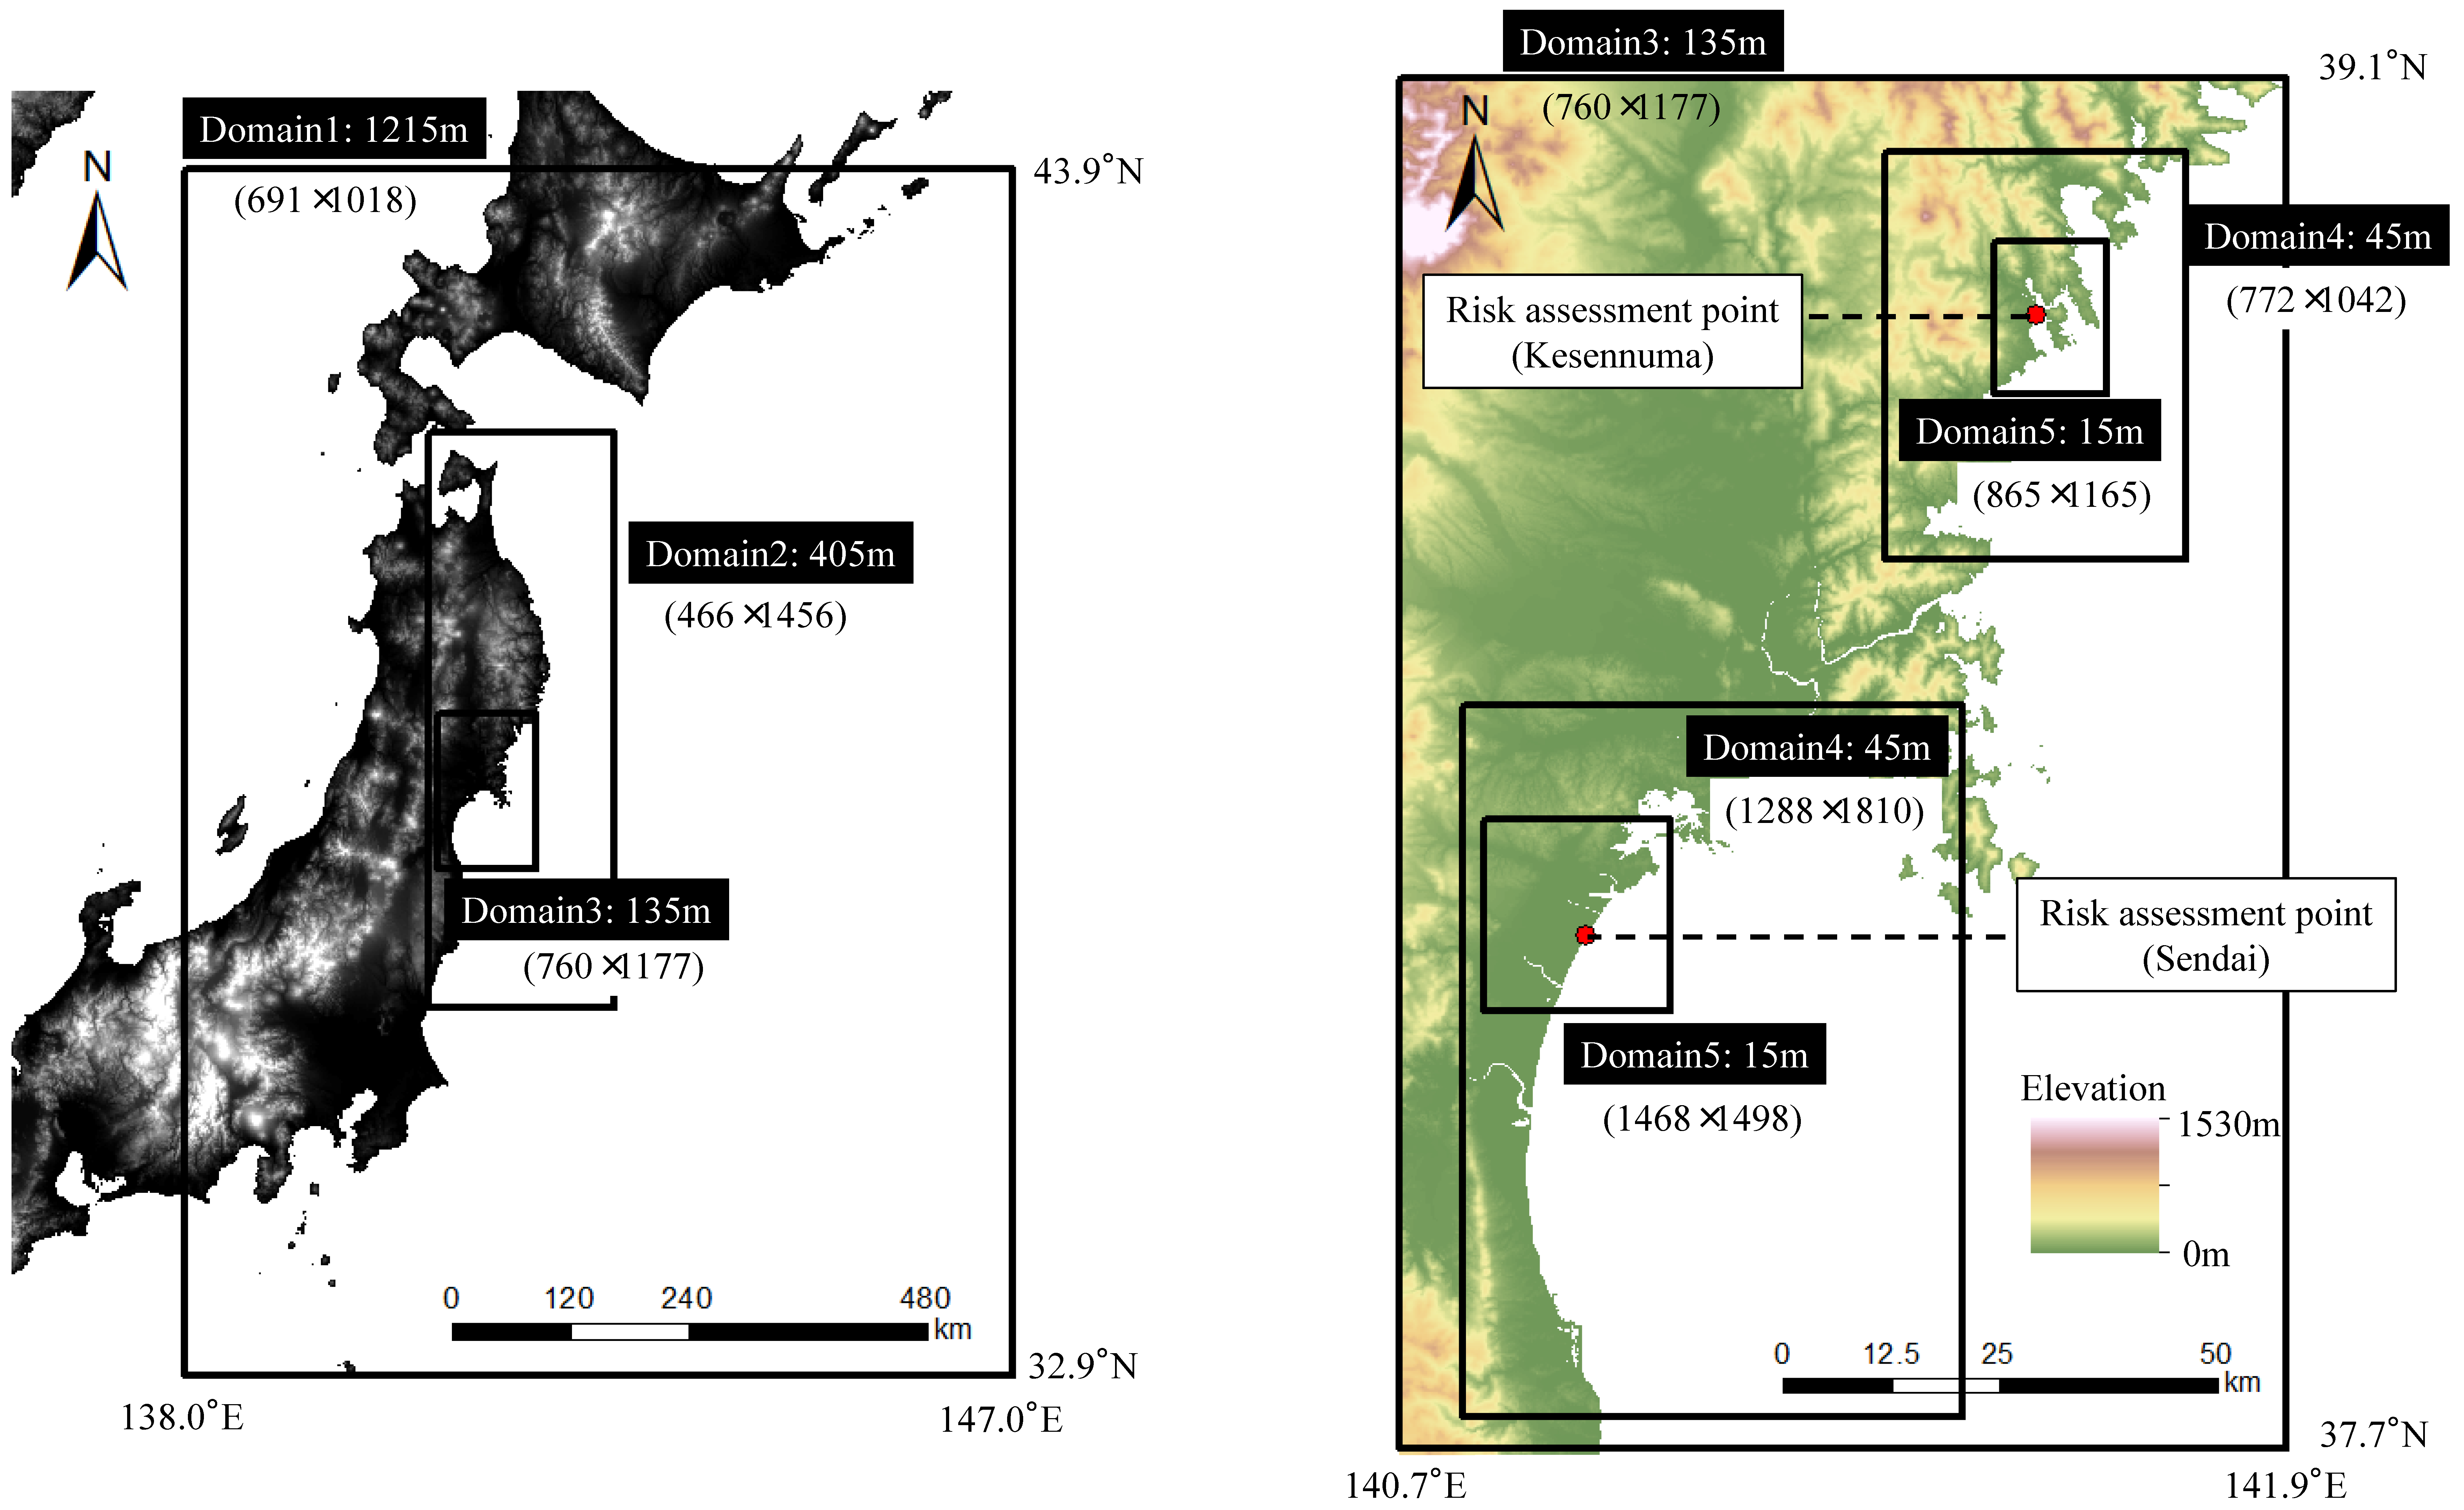
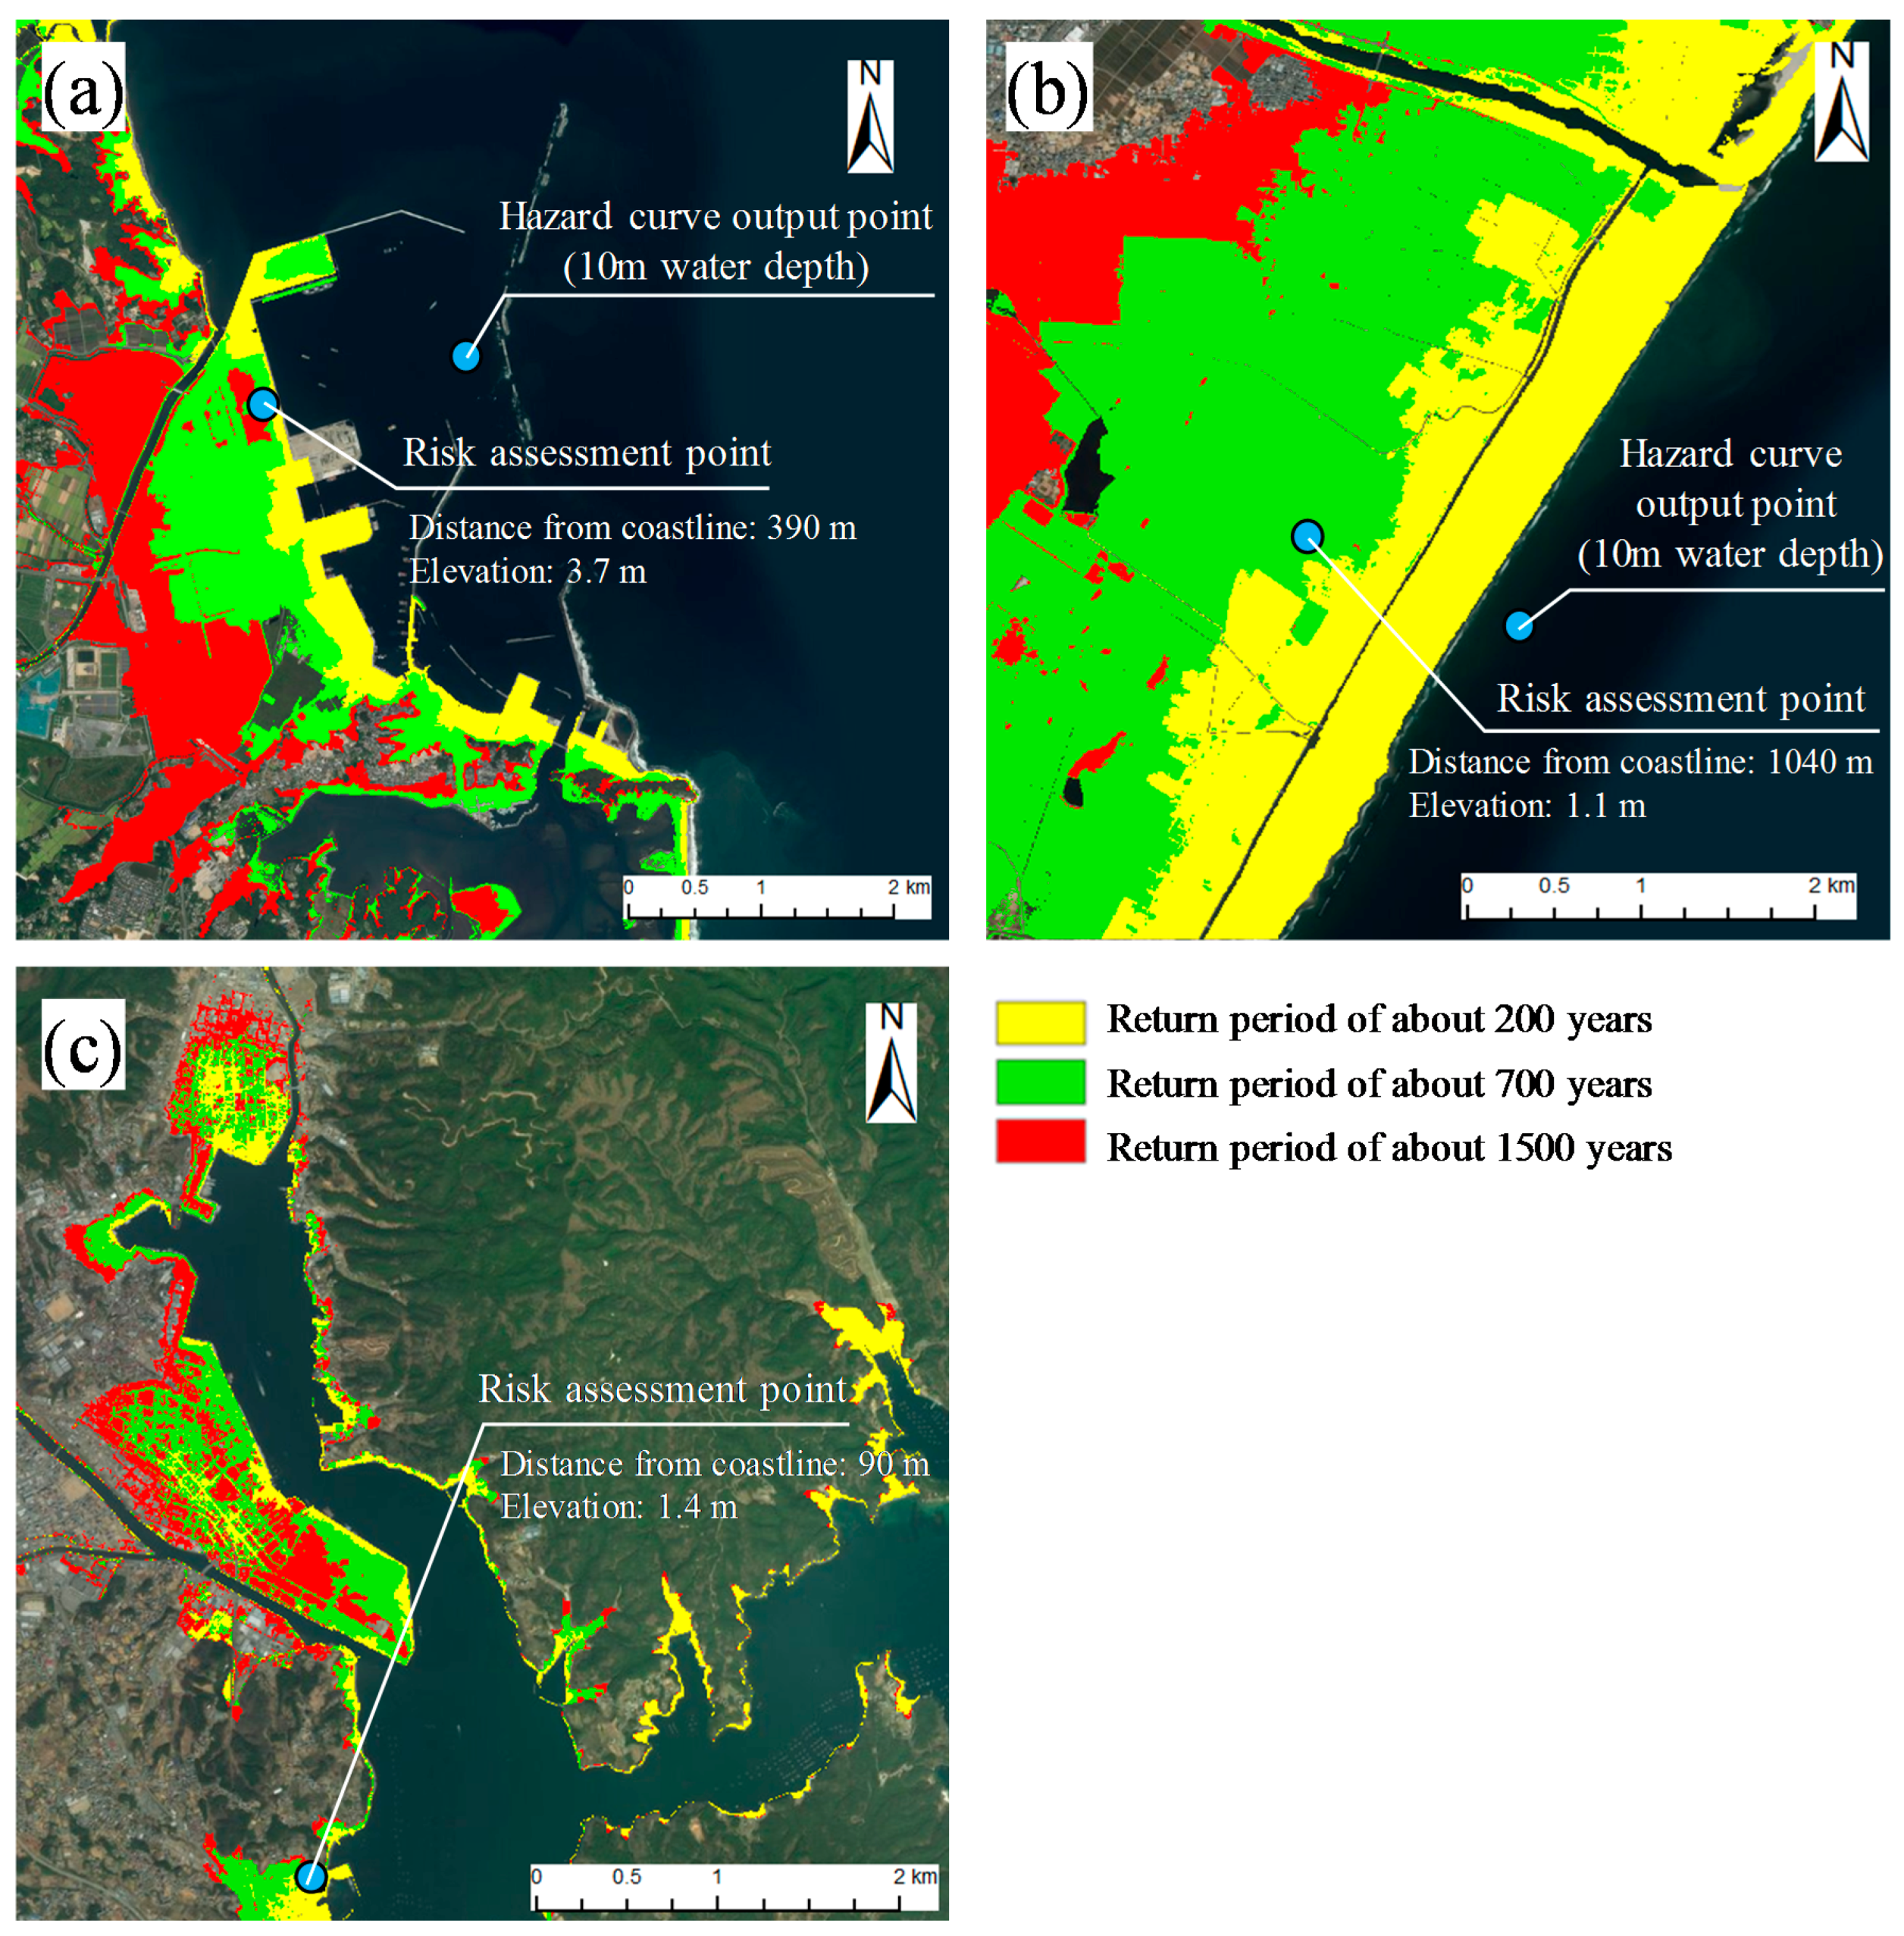
The results shown in Table 6 for Soma, Table 7 for Sendai and Table 8 for Kesennuma represent the values converted from the tsunami wave heights at water depths of 10 m generated for each earthquake to the annual exceedance probability and the return period using each tsunami hazard curve. It should be noted that we used the average values of the tsunami hazard curves in this section. Using these tables, we can consider the possibility of specifying the return period of an earthquake-generating fault by focusing on the tsunami height in a coastal area. Then, if a tsunami run-up simulation is carried out using the parameters of the fault specifying the return period, a tsunami inundation area and a tsunami inundation depth for every return period on land are obtained by running a tsunami simulation. The tsunami run-up simulations were conducted using the nonlinear longwave equations under the calculation conditions shown in Table 9 (Soma) and Table 10 (Sendai and Kesennuma). The calculation regions for each area are shown in Figure 9 (Soma) and Figure 10 (Sendai and Kesennuma). The tsunami inundation areas for each return period simulated using the above method are shown in Figure 11 and the tsunami inundation heights and tsunami inundation depths at each target point within the risk assessment are shown in Table 6 through Table 8 (g), (h). This method of calculating the inundation area for each return period is advantageous because it is possible to easily perform the inundation calculations by appropriately changing the information regarding the initial tide levels or artificial structures (e.g., dikes and buildings).
3.3.2. Tsunami Hazard Curves at Inland Points
Based on the annual exceedance probability of the tsunami wave height and the numerical simulation results of the inundation depths, we evaluate the annual exceedance probability curves of inland inundation depths.
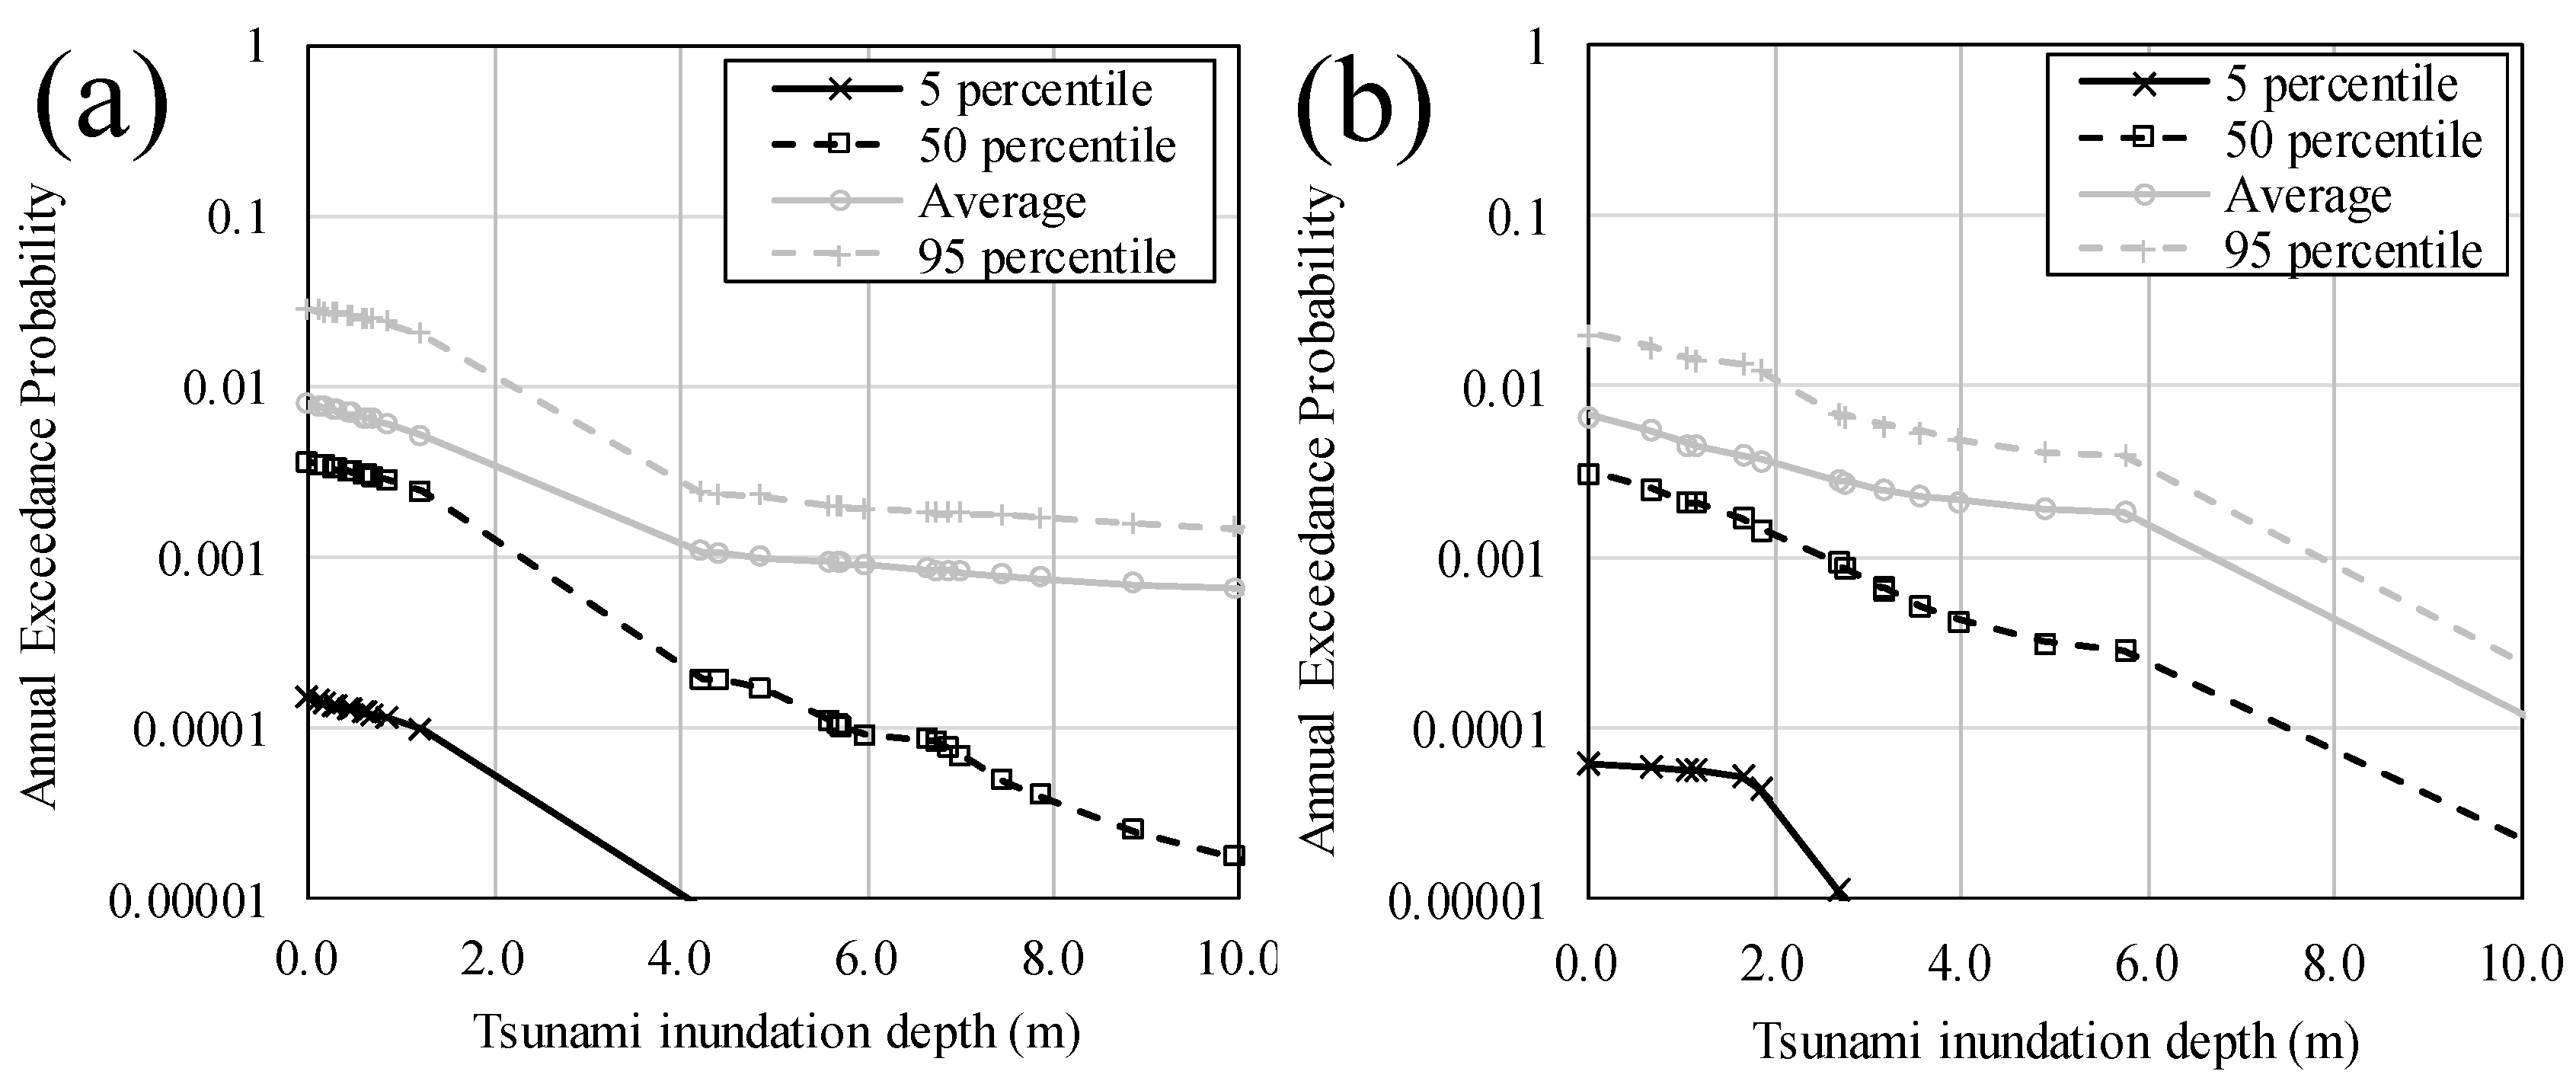
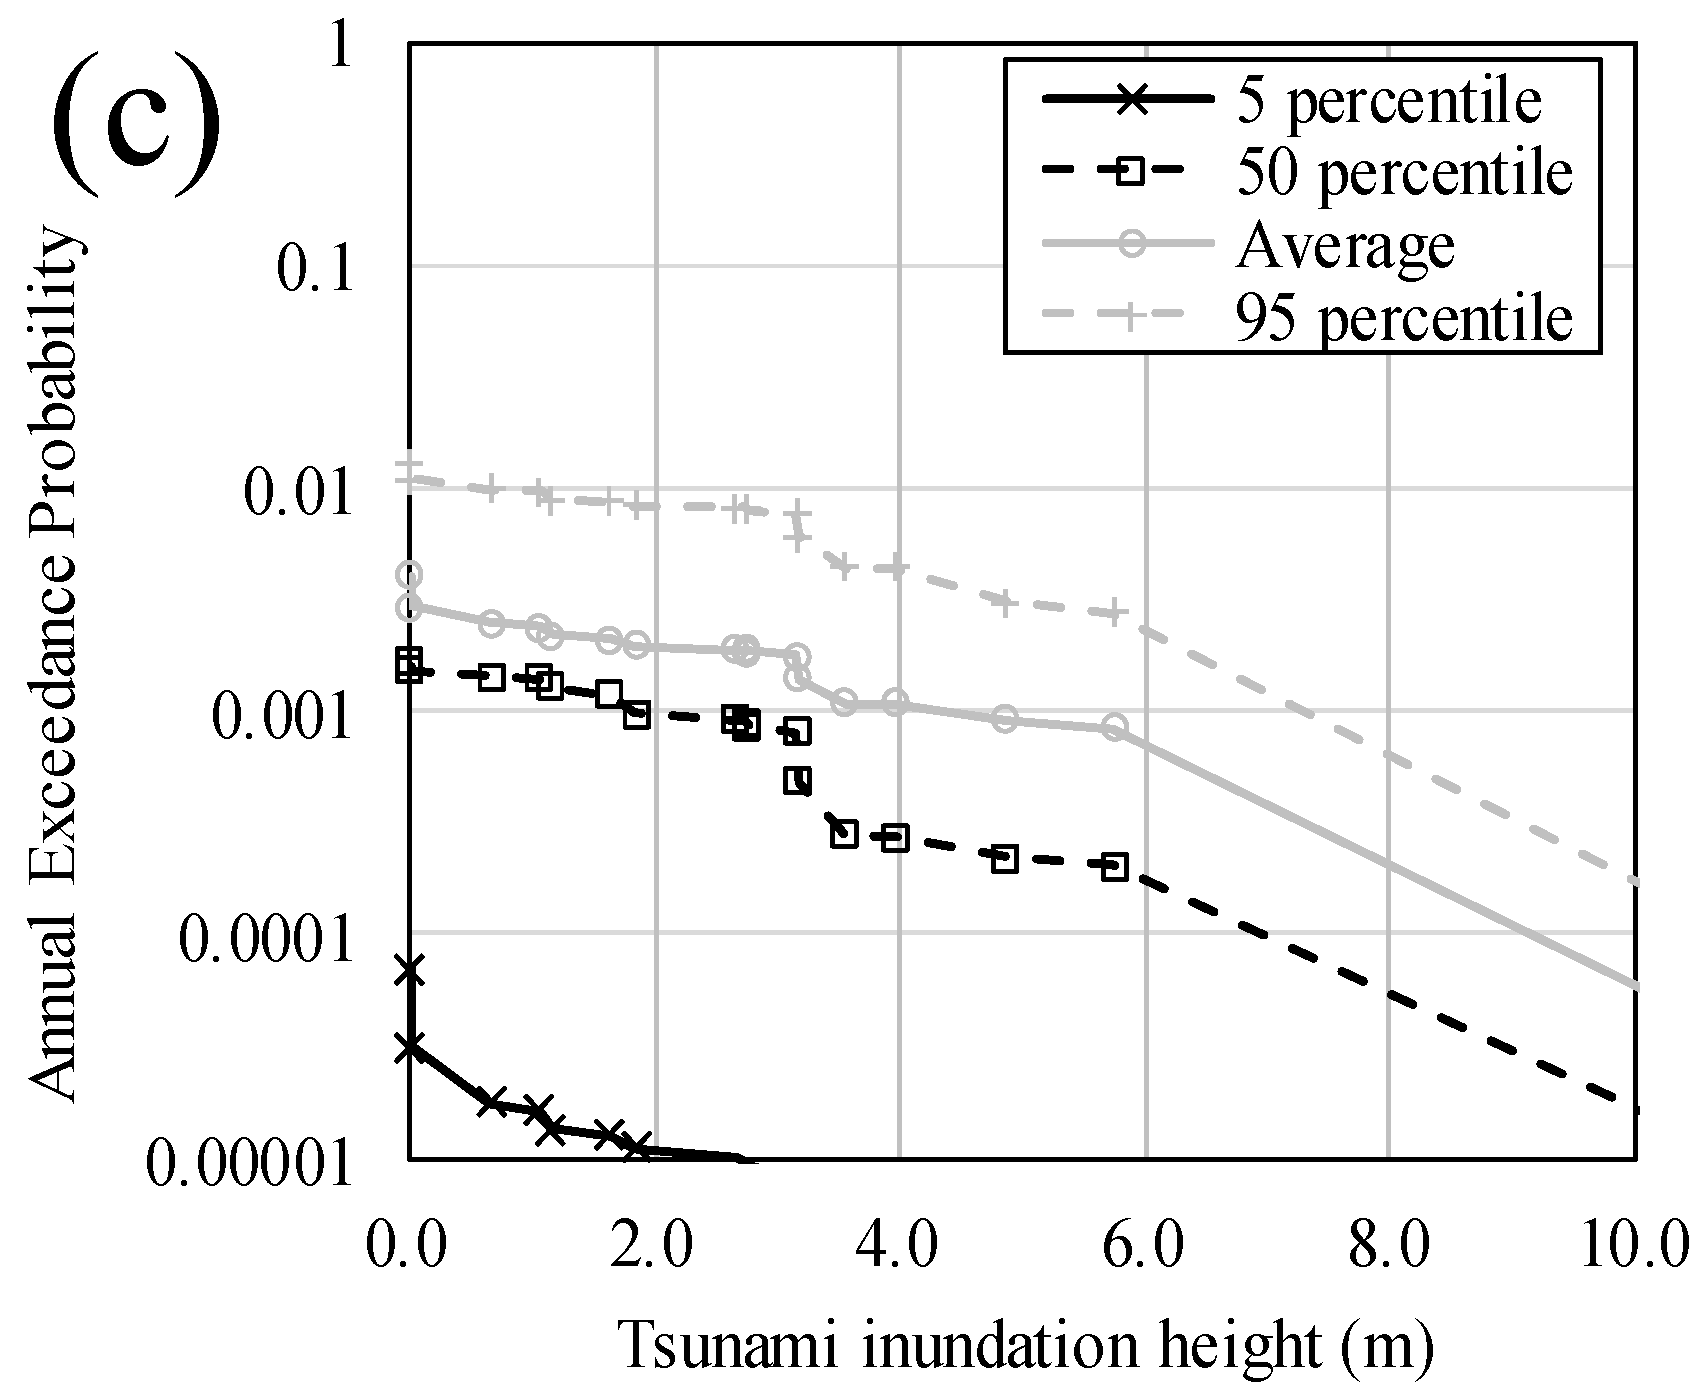
First, in each case of the tsunami numerical simulation, we assumed that the probability density of the tsunami wave height was equal to the probability density of the inundation depth. Then, after normalizing the probability density of the inundation depth so that the maximum value of the annual exceedance probability of the inundation depth represents the annual exceedance probability of the tsunami wave height in the case where the inundation depth is zero, we calculated the annual exceedance probability of the inundation depth from the corresponding probability density data (see Figure 12). From Table 6, Table 7 and Table 8, the tsunami wave height (in the case where the inundation depth at each evaluation point is zero) and the annual exceedance probability are respectively 2.01 m and 0.007986 (average value) for Soma, 4.30 m and 0.006729 (average value) for Sendai and 3.63 m and 0.004062 (average value) for Kesennuma. In this study, although the procedure is not entirely probabilistic because the tsunami numerical simulations are performed only discretely with a limited number, we constructed the annual exceedance probability curve of the inundation depth by regressing each plot with a straight line. The average values in addition to the 5th percentile, 50th percentile and 95th percentile curves created using the same method are also shown in Figure 12.
3.4. Fragility Assessment
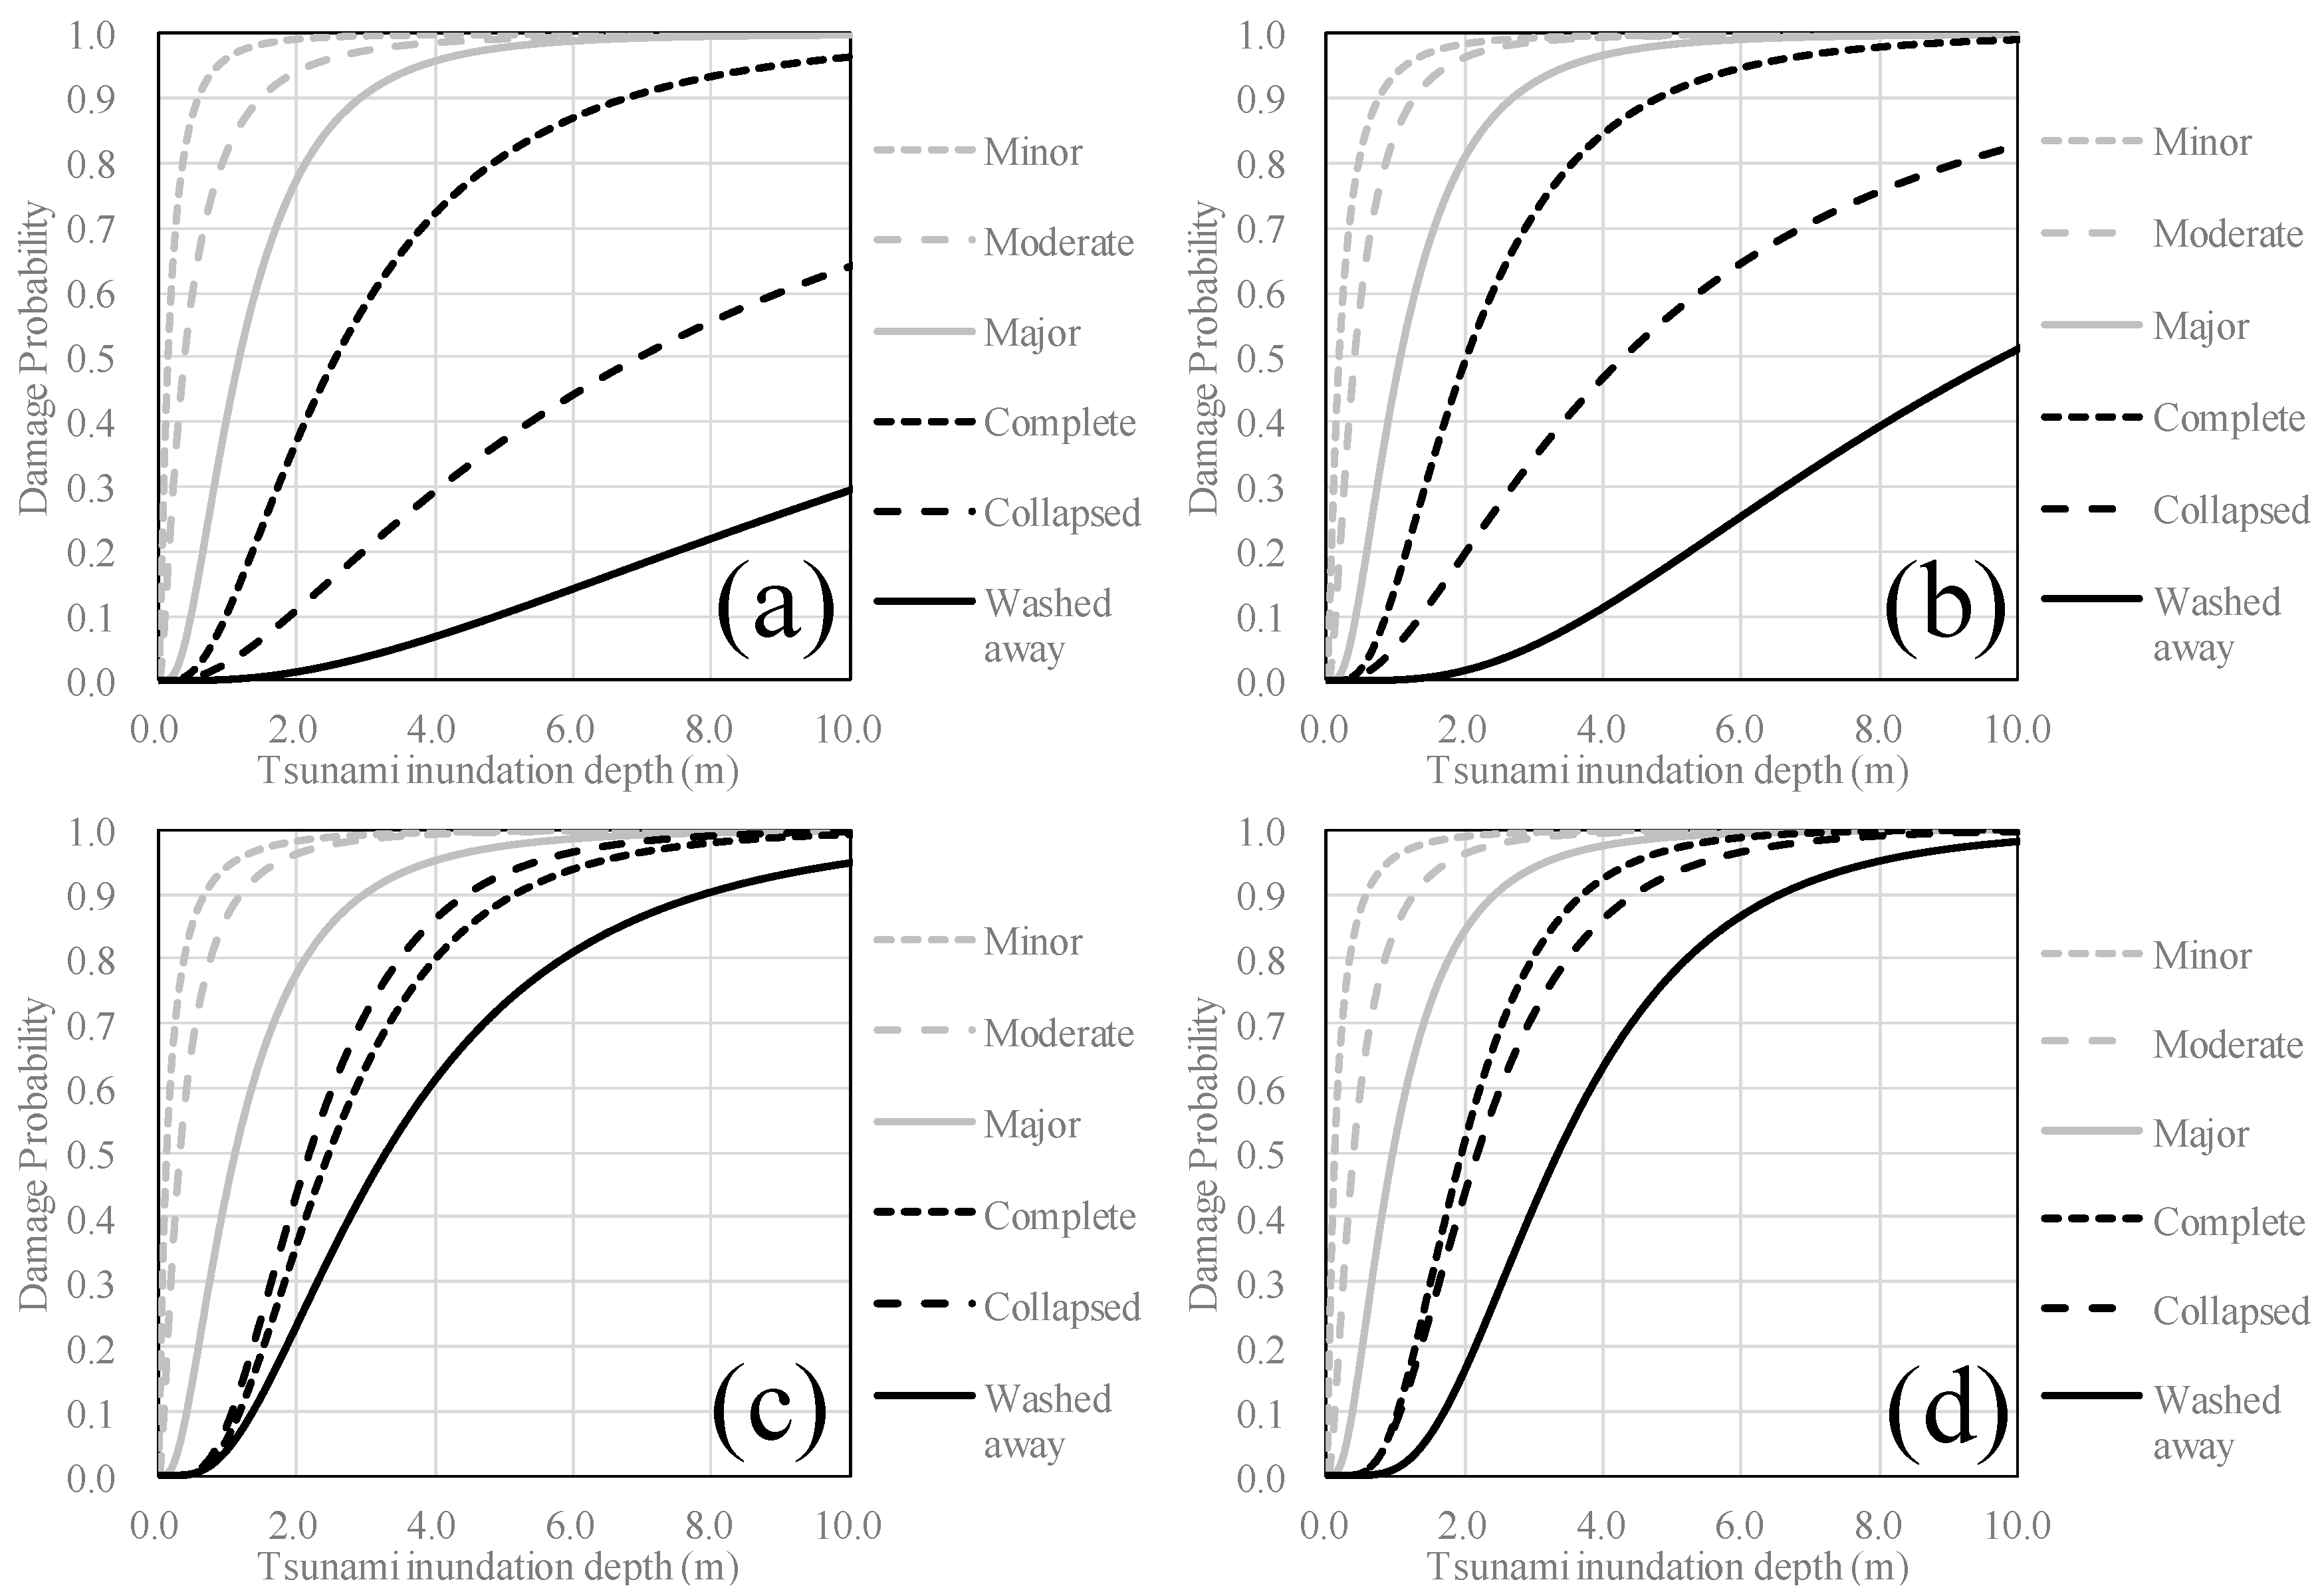
To evaluate the fragilities of buildings with respect to tsunamis, we used the fragility curve studied by Suppasri et al. [20], who performed regression analyses using damage data from buildings that suffered from tsunami inundation during the 3.11 Tohoku earthquake. Their study proposed various fragility curves for different building structures (i.e. reinforced concrete, steel, brick and wood) according to six different damage levels: minor damage, moderate damage, major damage, complete damage, collapsed damage and washed away (Figure 13). Although there are numerous studies about tsunami fragility functions [21], we selected the before-mentioned curves in this time. That is, why we also need to investigate uncertainties of tsunami risk due to the difference of tsunami fragility functions in the future study.
3.5. Risk Assessment and Quantitative Effects of the Hazard Assessment
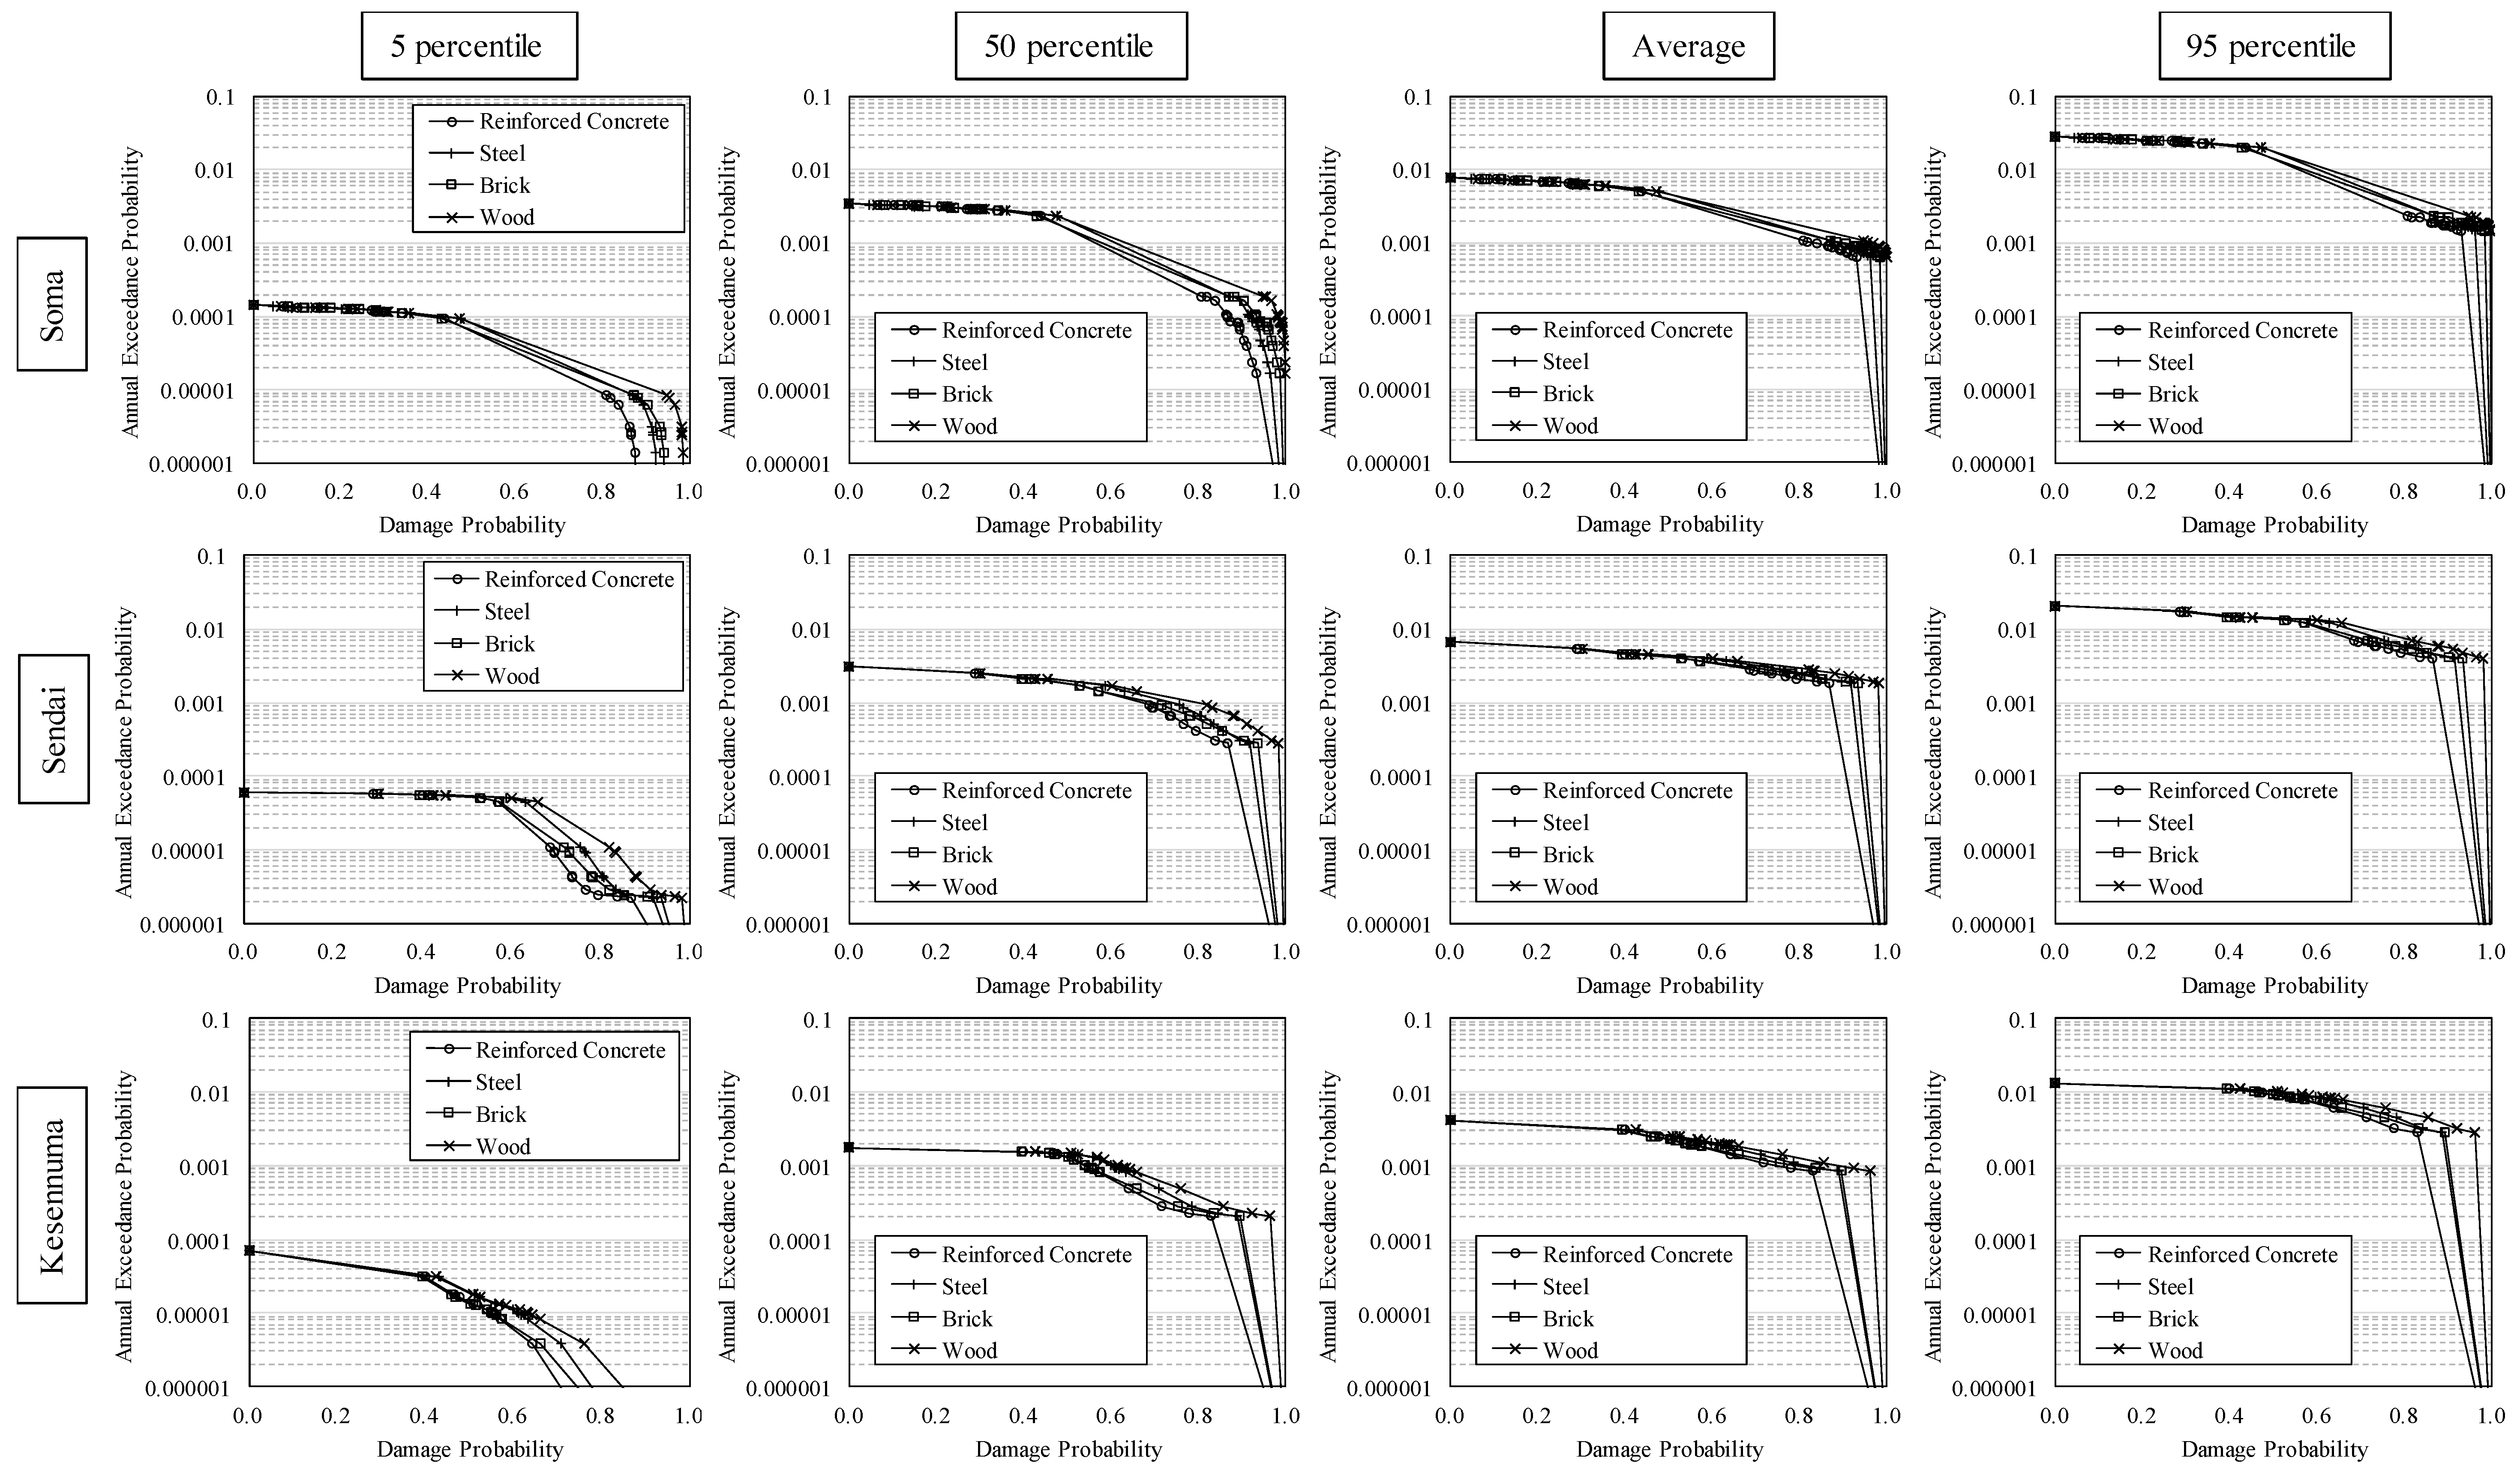
To quantify the tsunami risk with regard to the direct damage of a building located at a risk assessment point, we eliminated the tsunami inundation depth axis from Figure 12 and Figure 13 and obtained the tsunami risk curve represented by the relationship between the damage probability of a building and the annual exceedance probability. The tsunami risk curve for each type of building structure is shown in Figure 14. In calculating the damage probability of a building, the six different types of destruction were united using each damage probability. We set the damage probabilities of minor damage to 0.1, moderate damage to 0.3, major damage to 0.5, complete damage to 0.8, collapsed damage to 0.9 and washed away to 1.0. As indicated in the abovementioned methodology, we note that we have not performed a tsunami risk estimation that includes variability in the building response and uncertainties in the loss estimates because the main objective of this study is to quantify epistemic uncertainties in the tsunami hazards affecting the building risk.
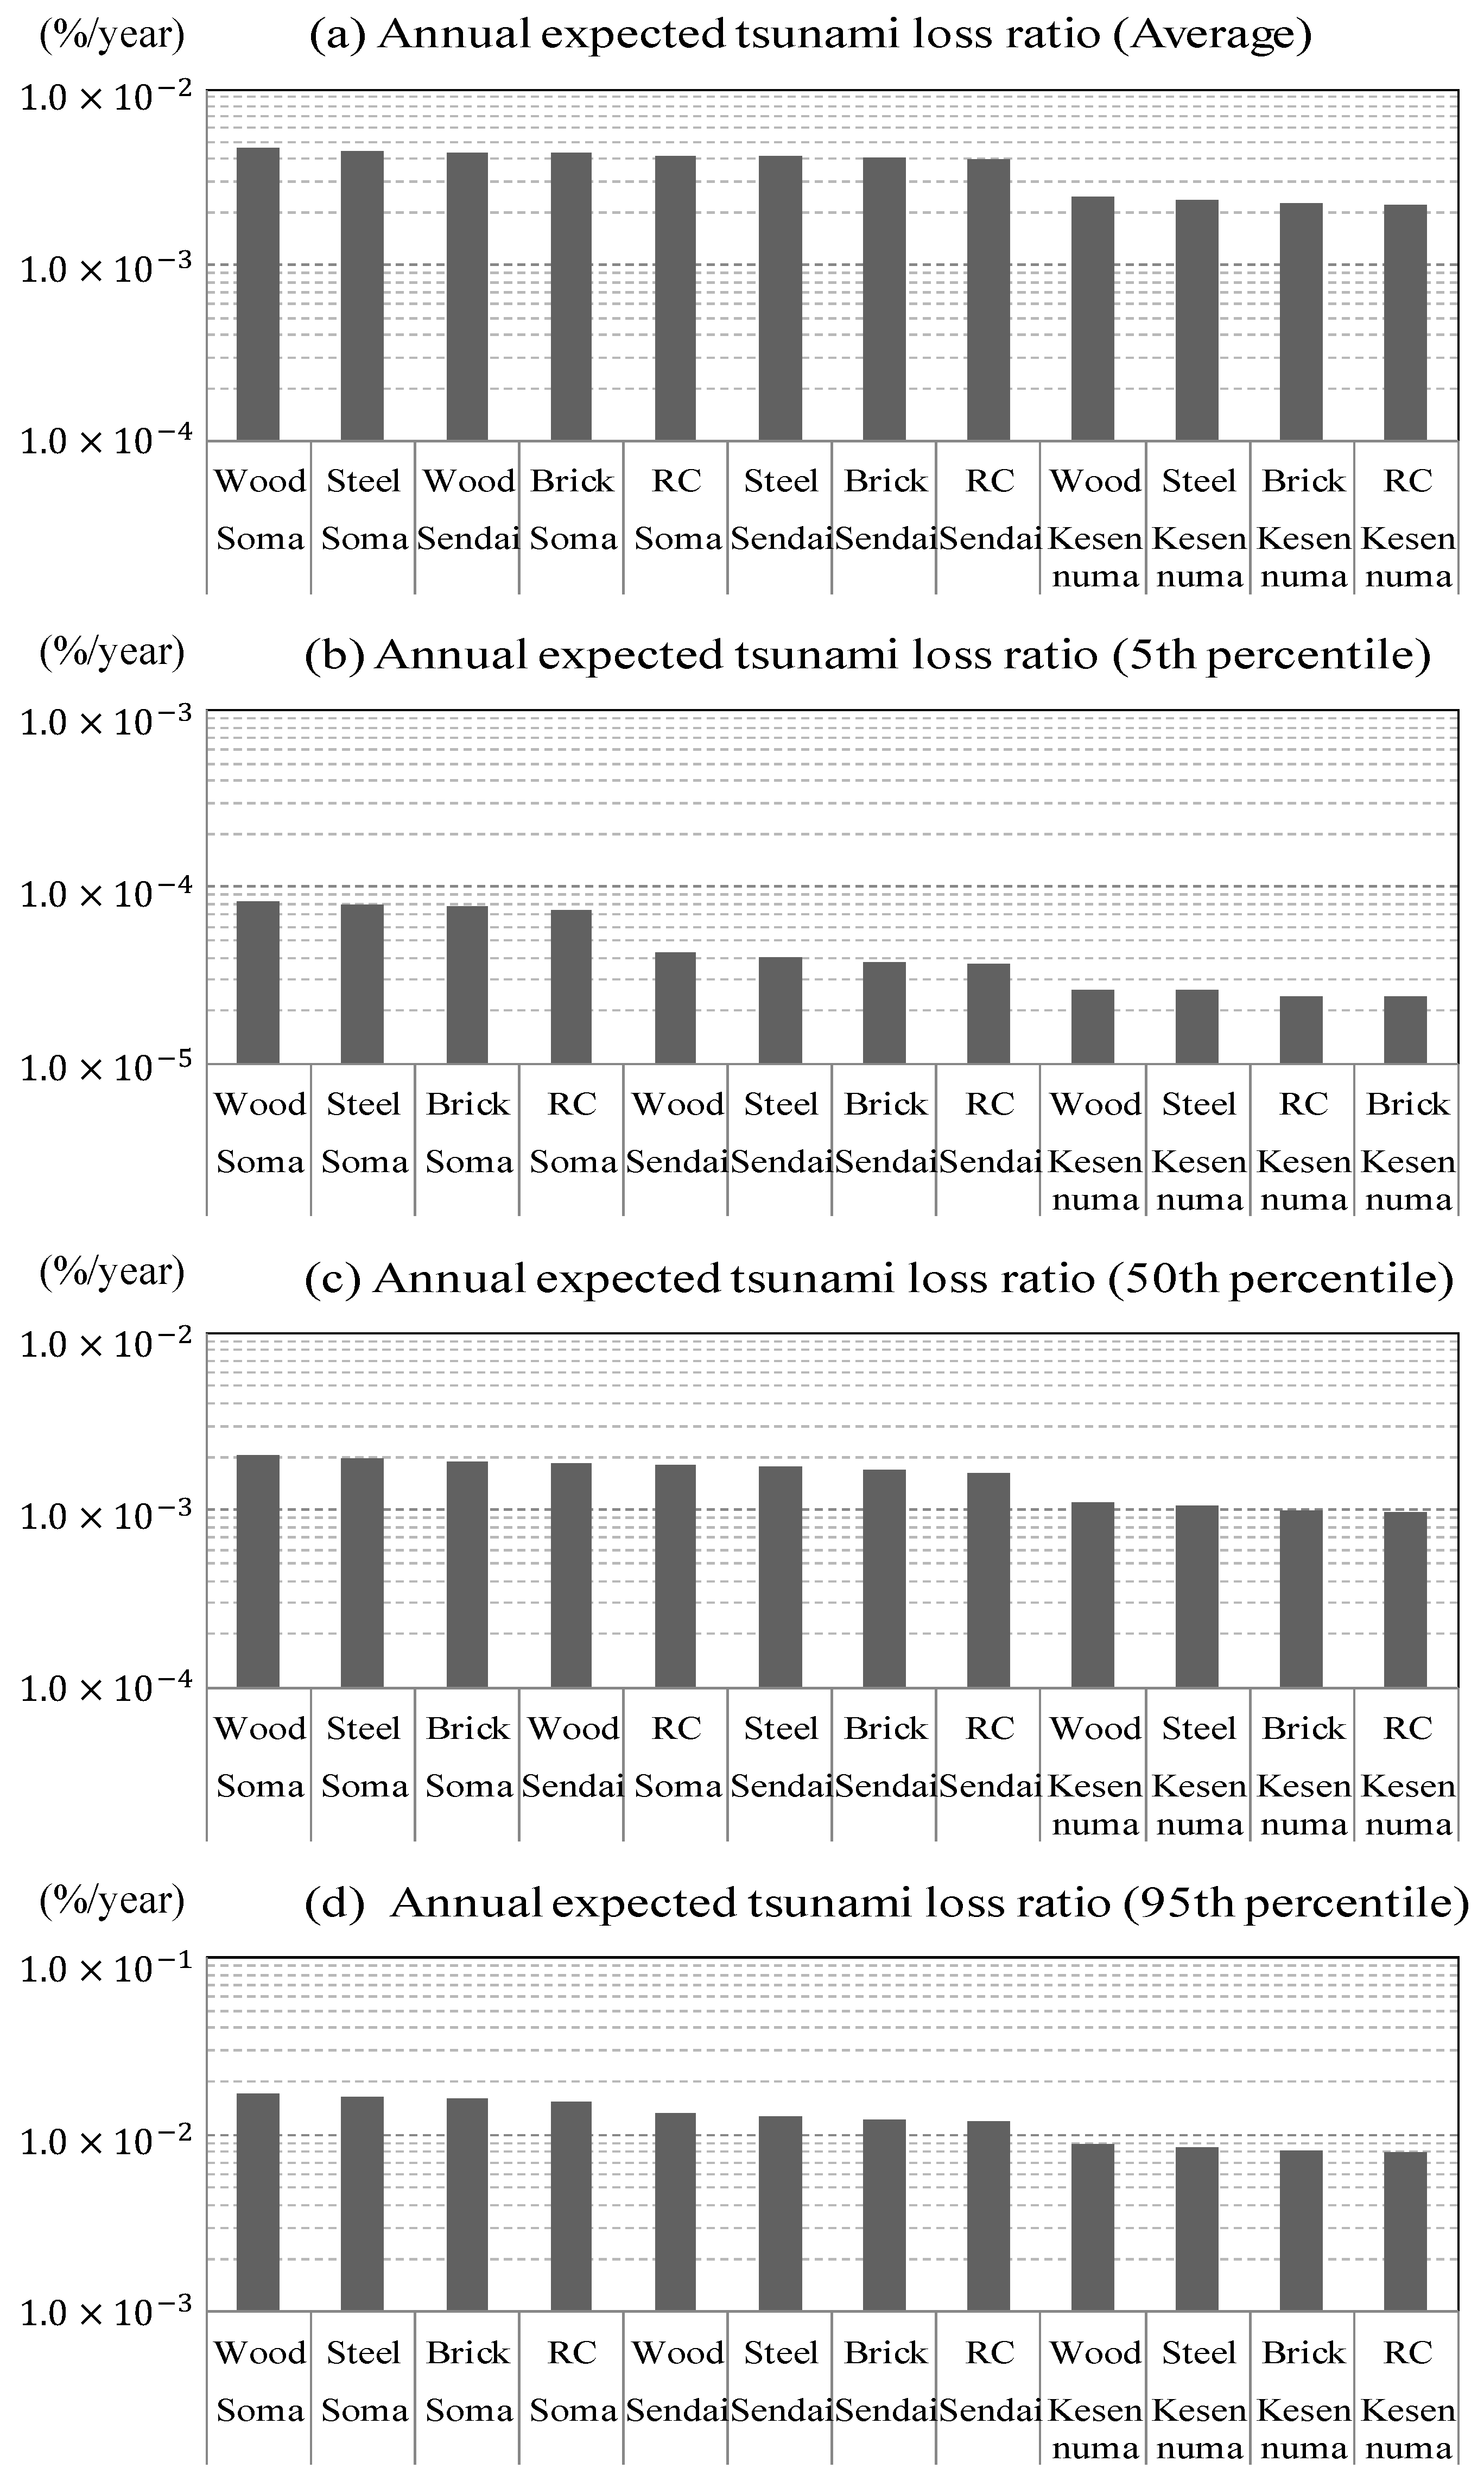
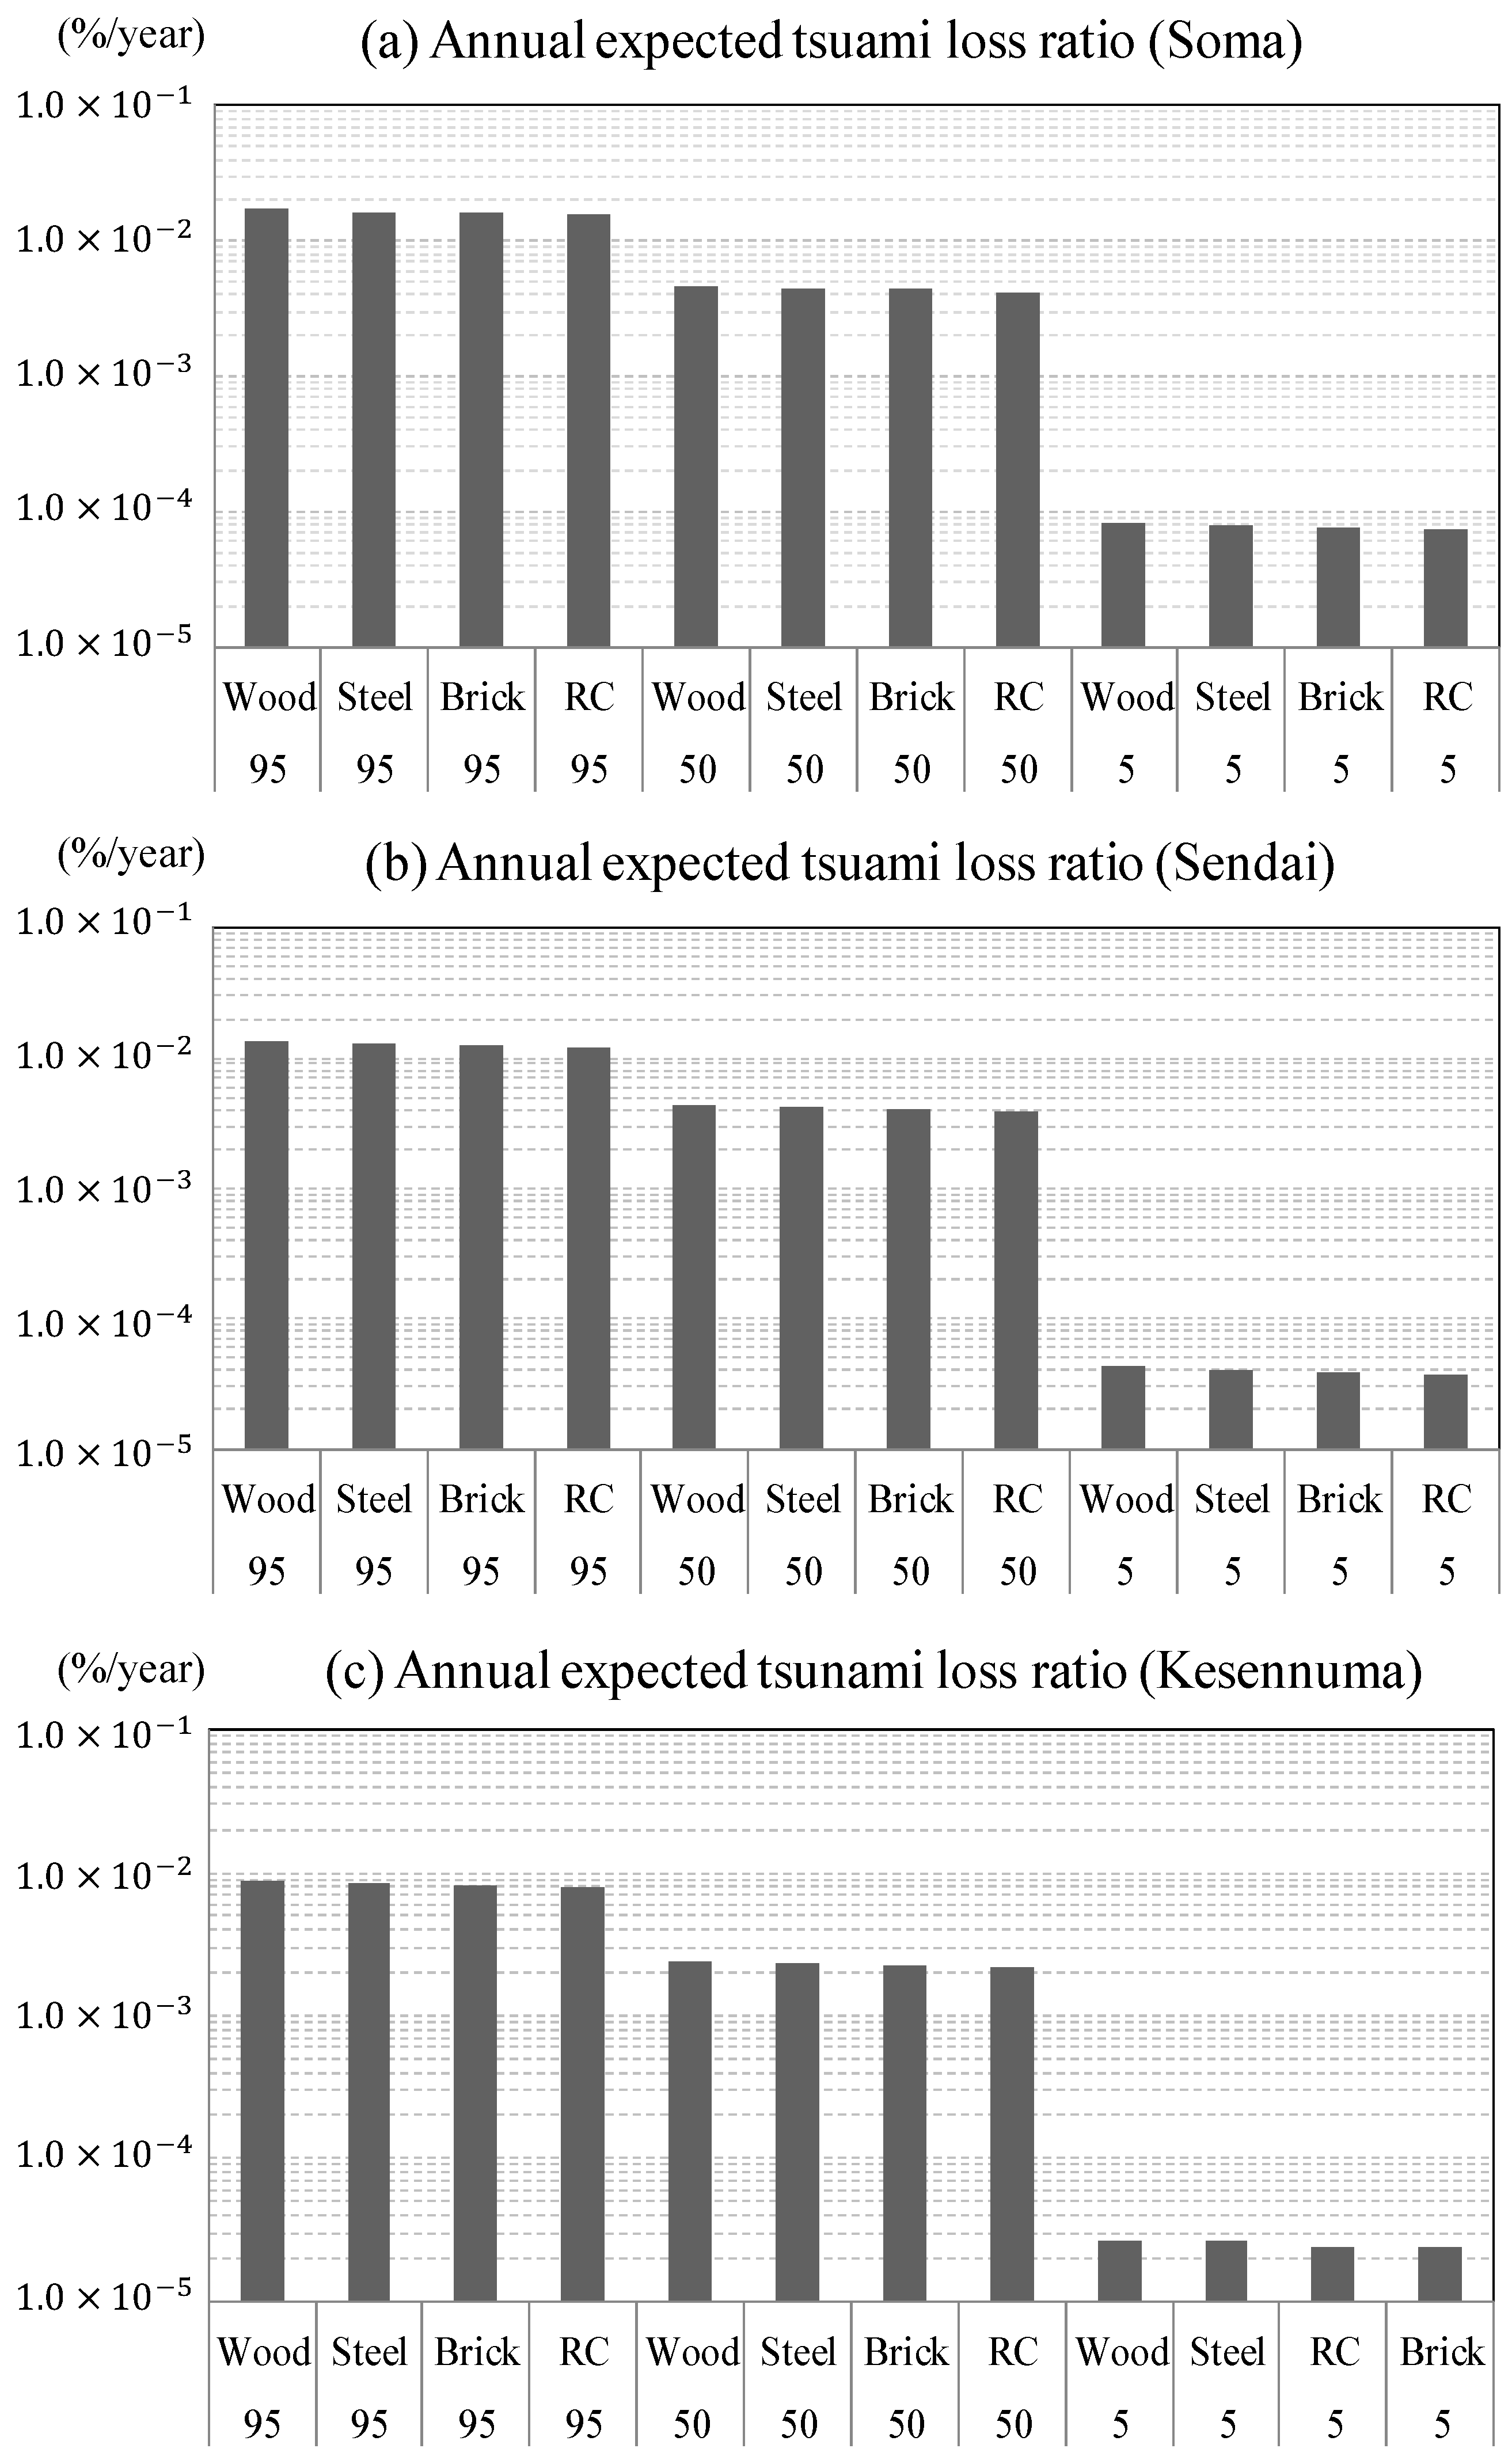
Generally, risk is expressed by the product of the degree of loss with its occurrence probability. Applying this idea, if we consider that the tsunami risk for direct damage to a building is the product of “the probability of destruction of a building by a tsunami” and its “generation probability”, we can estimate the tsunami risk using the product of the horizontal axis and the vertical axis of the risk curve. Therefore, we can quantify the tsunami risk by integrating the derived risk curve, calculating the area under the curve and estimating the annual expected tsunami loss ratio (i.e. the Tsunami Risk Index, or TRI). Figure 15 shows the calculation results obtained by integrating the area under the regressed exponential function for (a) the average value of the tsunami hazard and for each percentile value ((b) the 5th percentile value, (c) the 50th percentile value and (d) the 95th percentile value). Figure 16 shows the calculation results for each area.
3.6. Discussion
Based on the results shown in Figure 15, we can quantitatively understand the tsunami risk imposed on different types of buildings, that is, a reinforced concrete building located in Kesennuma is the safest (the lowest risk) while a wooden building located in Soma is the insecure (the highest risk) except for the case when average hazard values are used.
Focusing on the magnitude, we can see that the results using the 5th percentile hazard values and the results using the 50th percentile hazard values differ by approximately one order of magnitude and that the results using the 50th percentile values and the results using the 95th percentile values also differ by approximately one order of magnitude. A difference of approximately two orders of magnitude is observed between the 5th percentile values and the 95th percentile values. These results clearly show that tsunami risks have substantial hazard uncertainties.
Overall, the risk of a tsunami tends to increase successively from Soma to Sendai and then to Kesennuma because the impact of the tsunami hazard is large in that same order. In addition, a wood building located in Kesennuma has a lower tsunami risk than a reinforced concrete building located in either Soma or Sendai and a steel building located in Soma is at a higher tsunami risk than a wood building located in Kesennuma. We understand that we cannot properly comprehend the extent of the tsunami risk by evaluating the tsunami fragility only.
From the results shown in Figure 16, we can compare the results from evaluating the Tsunami Risk Index As mentioned previously, the tsunami risk changes dramatically depending on the percentile hazard that is considered. Among them, the difference between the tsunami risk using the 50th percentile hazard and the 5th percentile hazard is much greater than the difference between the tsunami risk using the 95th hazard and the 50th percentile hazard. As a matter of course, these results show that it is necessary to use hazard information from the same percentile when comparing the tsunami risks among different regions.
In this way, we can stochastically interpret and compare the evaluation results of the Tsunami Risk Index among several target regions.
4. Conclusions
In this study, through the process of quantifying the uncertainty in tsunami hazard effecting on building risk assessment, we proposed two new evaluation methods that are essential to implement tsunami risk assessment.
We first proposed a method that can be used to comprehensively address the uncertainties (epistemic uncertainty and aleatory uncertainty) in tsunami hazard assessments by probabilistically evaluating the tsunami inundation area and tsunami inundation depth using tsunami hazard curves. In this method, we can estimate the tsunami inundation area with each return period by performing tsunami numerical simulations using fault parameters after specifying the return period of the fault from the coastal tsunami hazard curve. This calculation method is advantageous because it is possible to easily perform the calculations by appropriately changing the information regarding the initial tide levels or artificial structures. In addition, we visualized the uncertainty in the tsunami hazard assessment in an easy-to-understand manner by indicating several tsunami inundation areas corresponding to the return periods of several earthquakes rather than using conventional tsunami hazard maps generated from single earthquakes.
Next, we proposed a method to evaluate the annual expected tsunami loss ratio (i.e. the tsunami risk index, or TRI) targeting buildings located in Soma, Sendai and Kesennuma by combining probabilistic tsunami inundation information and building fragility information. We used the fragility curves of different construction building derived from using the damaged data of buildings during the 3.11 Tohoku earthquake, which were regressed by log-normal distribution. In addition, then, we derived various tsunami risk curves, which represent the relationship between the damage probability of the building and the annual exceedance probability. Based on the definition of the risk, we considered the tsunami risk for direct damage to buildings as the product of the damage probability of a building destroyed by the tsunami and its generation probability. Therefore, we can quantify the tsunami risk by integrating the derived risk curve, that is, calculating the area under the curve and estimating the annual expected tsunami loss ratio (Tsunami Risk Index: TRI).
Focusing on the magnitude of the calculated TRI, we clearly showed that the results using the 5th percentile hazard values and the results using the 95th percentile hazard values differ by approximately two orders of magnitude. Furthermore, for example, based on the results using the average values, A wood building located in Kesennuma is at a lower tsunami risk than a reinforced concrete building located in Soma and Sendai. We cannot appropriately understand the extent of the tsunami risk if the information regarding tsunami hazards and tsunami fragility evaluations are individually captured. Through this study, we quantitatively showed for that we can understand the tsunami risk by combining hazard and fragility information. The proposed method in this study can be applied to various regions regardless of the area and therefore, the Tsunami Risk Index can be an effective index for ranking priority investments in disaster prevention endeavors by comparing the magnitudes of the tsunami risks of several targets located across several regions.
Acknowledgments
This research was supported by Specific Project Research from the International Research Institute of Disaster Science (IRIDeS) at Tohoku University. This research was also supported by funding from Tokio Marine & Nichido Fire Insurance Co., Ltd. through the IRIDeS. The authors also greatly appreciate the questions and valuable comments of the anonymous reviewers that helped improve the manuscript.
Author Contributions
Yo Fukutani conceived and designed the experiments, analyzed the data and wrote the paper; Anawat Suppasri and Fumihiko Imamura advised the experimental design.
Conflicts of Interest
The authors declare no conflict of interest.
Appendix A
If we assume a Poisson process, the confidence interval of the earthquake occurrence interval is established based on the study of Weichert [22], as shown in Table A1. That is, if the number of records of the earthquake occurrence is N (N in the table), μU and μL are determined based on the information in Table A1. If the sample period is T, the confidence interval is as follows:
Meanwhile, the confidence interval of the earthquake occurrence interval assuming an updating process using a BPT distribution is as follows:
where the variation coefficient of the earthquake occurrence interval is α and the number of records of the earthquake occurrence interval is n.

Table A1.
Lower and upper ±1.0 standard deviation confidence intervals for a Poisson variable [22].
Table A1.
Lower and upper ±1.0 standard deviation confidence intervals for a Poisson variable [22].
| N | ||
|---|---|---|
| 1.84 | 0 | 0 |
| 3.30 | 1 | 0.173 |
| 4.64 | 2 | 0.708 |
| 5.92 | 3 | 1.37 |
| 7.16 | 4 | 2.09 |
| 8.38 | 5 | 2.84 |
| 9.58 | 6 | 3.62 |
| 10.8 | 7 | 4.42 |
| 12.0 | 8 | 5.23 |
| 13.1 | 9 | 6.06 |
| 14.3 | 10 | 6.89 |
References
- United Nations Department of Humanitarian Affairs. Glossary: Internationally Agreed Glossary of Basic Terms Related to Disaster Management, Geneva, Switzerland. Available online: https://reliefweb.int/sites/reliefweb.int/files/resources/004DFD3E15B69A67C1256C4C006225C2-dha-glossary-1992.pdf (accessed on 28 September 2017).
- González, F.I.; Geist, E.L.; Jaffe, B.; Kânoğlu, U.; Mofjeld, H.; Synolakis, C.E.; Titov, V.V.; Arcas, D.; Bellomo, D.; Carlton, D.; et al. Probabilistic tsunami hazard assessment at seaside, Oregon, for near-and far-field seismic sources. J. Geophys. Res. Oceans 2009, 114, C11023. [Google Scholar] [CrossRef]
- Løvholt, F.; Pedersen, G.; Bazin, S.; Kuhn, D.; Bredesen, R.E.; Harbitz, C. Stochastic analysis of tsunami runup due to heterogeneous coseismic slip and dispersion. J. Geophys. Res. 2012, 117, C03047. [Google Scholar] [CrossRef]
- Goda, K.; Mai, P.M.; Yasuda, T.; Mori, N. Sensitivity of tsunami wave profiles and inundation simulations to earthquake slip and fault geometry for the 2011 Tohoku earthquake. Earth Planets Space 2014, 66, 105. [Google Scholar] [CrossRef] [Green Version]
- Park, H.; Cox, D.T. Probabilistic assessment of near-field tsunami hazards: Inundation depth, velocity, momentum flux, arrival time, and duration applied to Seaside, Oregon. Coast. Eng. 2016, 117, 79–96. [Google Scholar] [CrossRef]
- Thio, H.K.; Somerville, P.G.; Polet, J. Probabilistic Tsunami Hazard in California; College of Engineering, University of California: Los Angeles, CA, USA, 2010. [Google Scholar]
- Horspool, N.; Pranantyo, I.; Griffin, J.; Latief, H.; Natawidjaja, D.H.; Kongko, W.; Cipta, A.; Bustaman, B.; Anugrah, S.D.; Thio, H.K. A probabilistic tsunami hazard assessment for Indonesia. Nat. Hazards Earth Syst. Sci. 2014, 14, 3105–3122. [Google Scholar] [CrossRef]
- Davies, G.; Griffin, J.; Løvholt, F.; Glimsdal, S.; Harbitz, C.; Thio, H.K.; Lorito, S.; Basili, R.; Selva, J.; Geist, E.; et al. A global probabilistic tsunami hazard assessment from earthquake sources. Geol. Soc. Lond. Spec. Publ. 2017, 456, SP456-5. [Google Scholar] [CrossRef]
- Geist, E.L.; Parsons, T. Probabilistic analysis of tsunami hazards. Nat. Hazards 2006, 37, 277–314. [Google Scholar] [CrossRef]
- Annaka, T.; Satake, K.; Sakakiyama, T.; Yanagisawa, K.; Shuto, N. Logic-tree Approach for Probabilistic Tsunami Hazard Analysis and its Applications to the Japanese Coasts. Pure Appl. Geophys. 2007, 164, 577–592. [Google Scholar] [CrossRef]
- Cornell, C.A. Engineering Seismic Risk Analysis. Bull. Seism. Soc. Am. 1968, 58, 1583–1606. [Google Scholar]
- Suppasri, A.; Latcharote, P.; Bricker, J.D.; Leelawat, N.; Hayashi, A.; Yamashita, K.; Makinoshima, F.; Roeber, V.; Imamura, F. Improvement of Tsunami Countermeasures Based on Lessons from The 2011 Great East Japan Earthquake and Tsunami—Situation After Five Years. Coast. Eng. J. 2016, 58, 1640011. [Google Scholar] [CrossRef]
- Japan Society of Civil Engineers. A Method for Probabilistic Tsunami Hazard Analysis. The Tsunami Evaluation Subcommittee, The Nuclear Civil Engineering Committee, Japan Society of Civil Engineers: Tokyo, Japan. Available online: http://committees.jsce.or.jp/ceofnp/system/files/PTHA20111209_0.pdf (accessed on 28 September 2017). (In Japanese).
- National Research Institute for Earth Science and Disaster Resilience (NIED). Japan Seismic Hazard Information Station (JSHIS 2013). Available online: http://www.j-shis.bosai.go.jp/map/ (accessed on 28 September 2017).
- Fukutani, Y.; Suppasri, A.; Imamura, F. Stochastic analysis and uncertainty assessment of tsunami wave height using a random source parameter model that targets a Tohoku-type earthquake fault. Stoch. Environ. Res. Risk. Assess. 2015, 29, 1763–1779. [Google Scholar] [CrossRef]
- Headquarters for Earthquake Research Promotion, Probabilistic Seismic Hazard Maps for Japan. Available online: http://www.jishin.go.jp/evaluation/seismic_hazard_map/shm_report/ (accessed on 28 September 2017).
- Aida, I. Reliability of a tsunami source model derived from fault parameters. J. Phys. Earth 1978, 26, 57–73. [Google Scholar] [CrossRef]
- Okada, Y. Surface deformation due to shear and tensile faults in a half-space. Bull. Seism. Soc. Am. 1985, 75, 1135–1154. [Google Scholar]
- IUGG/IOC TIME Project. Numerical Method of Tsunami Simulation with the Leap-Frog Scheme; Intergovernmental Oceanographic Commission Manuals and Guides 35; UNESCO: Paris, France, 1997. [Google Scholar]
- Suppasri, A.; Mas, E.; Charvet, I.; Gunasekera, R.; Imai, K.; Fukutani, Y.; Abe, Y.; Imamura, F. Building damage characteristics based on surveyed data and fragility curves of the 2011 Great East Japan tsunami. Nat. Hazards 2013, 66, 319–341. [Google Scholar] [CrossRef]
- Charvet, I.; Macabuag, J.; Rossetto, T. Estimating Tsunami-Induced Building Damage through Fragility Functions: Critical Review and Research Needs. Front. Built Environ. 2017, 3, 36. [Google Scholar] [CrossRef]
- Weichert, D.H. Estimation of the earthquake recurrence parameters for unequal observation periods for different magnitudes. Bull. Seism. Soc. Am. 1980, 70, 1337–1356. [Google Scholar]
Figure 1.
A diagram of the evaluation methods for the (a) epistemic uncertainty using a logic tree [10] and (b) aleatory uncertainty using a probabilistic density function [13].

Figure 2.
Flow of the tsunami risk quantification. (a) The probabilistic tsunami wave height is converted to (b) the probabilistic tsunami inundation information, and (d,e) the risk assessment is carried out by combining the hazard information with (c) fragility assessment.
Figure 2.
Flow of the tsunami risk quantification. (a) The probabilistic tsunami wave height is converted to (b) the probabilistic tsunami inundation information, and (d,e) the risk assessment is carried out by combining the hazard information with (c) fragility assessment.

Figure 3.
Locations of the target buildings.

Figure 4.
The selected earthquakes that could generate a tsunami based on the occurrence region of the trench-type earthquake along the Japan Trench, which is used in the probabilistic seismic motion prediction map [14].
Figure 4.
The selected earthquakes that could generate a tsunami based on the occurrence region of the trench-type earthquake along the Japan Trench, which is used in the probabilistic seismic motion prediction map [14].

Figure 5.
Logic trees constructed for the eleven fault regions. The numbers appended onto the branches of the logic trees are the weights of the branches.
Figure 5.
Logic trees constructed for the eleven fault regions. The numbers appended onto the branches of the logic trees are the weights of the branches.


Figure 6.
Mesh consisting of 10 km points encompassing the Japan Trench area (black dots).

Figure 7.
Calculation area for the tsunami numerical simulation (450 m mesh).

Figure 8.
Relationships between the annual exceedance probability and tsunami wave height at (a) a water depth of 10 m (37.85127° N, 140.96812° E) off the port of Soma; (b) a water depth of 10 m (37.85127° N, 140.96812° E) off the coast of Sendai Plain; and (c) a water depth of 10 m (37.85127° N, 140.96812° E) off the coast of the city of Kesennuma.

Figure 9.
Five regions of terrain data used for the tsunami numerical run-up simulations in the Soma area (Domain 1, Domain 2, Domain 3, Domain 4 and Domain 5). The numbers in parentheses are the east-west and north-south mesh dimensions.
Figure 9.
Five regions of terrain data used for the tsunami numerical run-up simulations in the Soma area (Domain 1, Domain 2, Domain 3, Domain 4 and Domain 5). The numbers in parentheses are the east-west and north-south mesh dimensions.

Figure 10.
Five regions of terrain data used for the tsunami numerical run-up simulations in the Sendai and Kesennuma areas (Domain 1, Domain 2, Domain 3, Domain 4 and Domain 5). The numbers in parentheses are the east-west and north-south mesh dimensions.
Figure 10.
Five regions of terrain data used for the tsunami numerical run-up simulations in the Sendai and Kesennuma areas (Domain 1, Domain 2, Domain 3, Domain 4 and Domain 5). The numbers in parentheses are the east-west and north-south mesh dimensions.

Figure 11.
Results of tsunami inundation assessments for (a) Soma; (b) Sendai and (c) Kesennuma at return periods of approximately 200, 700 and 1500 years.
Figure 11.
Results of tsunami inundation assessments for (a) Soma; (b) Sendai and (c) Kesennuma at return periods of approximately 200, 700 and 1500 years.

Figure 12.
Relationships between the annual exceedance probability and tsunami inundation height for (a) Soma; (b) Sendai and (c) Kesennuma.
Figure 12.
Relationships between the annual exceedance probability and tsunami inundation height for (a) Soma; (b) Sendai and (c) Kesennuma.


Figure 13.
Tsunami fragility curves for different building structures ((a) Reinforced concrete; (b) Steel; (c) Brick and (d) Wood) and different damage levels, which were created by regressing the damage data from the 3.11 Tohoku earthquake [20].
Figure 13.
Tsunami fragility curves for different building structures ((a) Reinforced concrete; (b) Steel; (c) Brick and (d) Wood) and different damage levels, which were created by regressing the damage data from the 3.11 Tohoku earthquake [20].

Figure 14.
Tsunami risk curves for different types of building construction with different percentile of tsunami hazard for three target points.
Figure 14.
Tsunami risk curves for different types of building construction with different percentile of tsunami hazard for three target points.

Figure 15.
Expected value of the tsunami risk using each tsunami hazard value ((a) average value; (b) 5th percentile value; (c) 50th percentile value and (d) 95th percentile value) indicated according to the structure (upper horizontal axis) and the region (lower horizontal axis).
Figure 15.
Expected value of the tsunami risk using each tsunami hazard value ((a) average value; (b) 5th percentile value; (c) 50th percentile value and (d) 95th percentile value) indicated according to the structure (upper horizontal axis) and the region (lower horizontal axis).

Figure 16.
Expected value of the tsunami risk at each risk assessment point ((a) Soma; (b) Sendai; and (c) Kesennuma) according to the structure (upper horizontal axis) and the percentile value of the tsunami hazard (lower horizontal axis).
Figure 16.
Expected value of the tsunami risk at each risk assessment point ((a) Soma; (b) Sendai; and (c) Kesennuma) according to the structure (upper horizontal axis) and the percentile value of the tsunami hazard (lower horizontal axis).

Table 1.
Location information for the target buildings in each city.
| Target Location | Latitude (°) | Longitude (°) | Elevation (m) | Distance from Coastline (m) |
|---|---|---|---|---|
| Soma | 37.84829 | 140.95052 | 3.7 | 390 |
| Sendai | 38.23349 | 140.98479 | 1.1 | 1040 |
| Kesennuma | 38.87447 | 141.58775 | 1.4 | 90 |
Table 2.
Abbreviation explanations.
| Abbreviation | Earthquake Name |
|---|---|
| JTN1-1 | Large interplate earthquakes in Northern Sanriku-Oki (repeating earthquakes) |
| JTN1-2 | Large interplate earthquakes in Northern Sanriku-Oki (other than repeating earthquakes) |
| JTN2 | Miyagi-ken-Oki earthquake (repeating earthquakes) |
| JTN3-1 | Earthquakes close to the offshore trenches in Southern Sanriku-Oki (repeating earthquakes) |
| JTN3-2 | Earthquakes close to the offshore trenches in Southern Sanriku-Oki (other than repeating earthquakes) |
| JTN2 + JTN3 | Miyagi-ken-Oki, earthquakes close to the offshore trenches in Southern Sanriku-Oki consolidated-type-earthquake |
| TOHOKU | Great East Japan Earthquake (2011 Tohoku-type earthquake) |
| JTT | Large interplate earthquakes close to the offshore trenches in the Sanriku-Oki to Boso-Oki regions (tsunami earthquakes) |
| JTNR | Large intraplate earthquakes close to the offshore trenches in the Sanriku-Oki to Boso-Oki regions (normal fault-type) |
| JTS1 | Interplate earthquakes in Fukushima-ken-Oki |
| IBRK | Interplate earthquakes in Ibaraki-ken-Oki (other than repeating earthquakes) |
Table 3.
Model names for the generation intervals of earthquakes, α values of the BPT distribution, average return periods, sample periods, earthquake generation times within the periods used to determine the average occurrence intervals and lower and upper limits of the confidence intervals for the eleven earthquakes, which are shown in the Headquarters for Earthquake Research Promotion [16].
| Earthquake Name (Abbreviation) | Model for Generation Interval of Earthquake | α Value of BPT Distribution | Average Return Period (Year) | Sample Period (Year) | Earthquake Generation Time | Lower Limit of Confidence Interval for the Return Period | Upper Limit of Confidence Interval for the Return Period |
|---|---|---|---|---|---|---|---|
| JTN1-1 | BPT | 0.08 | 97 | 412 | 4 | 93 | 101 |
| 0.18 | 97 | 412 | 4 | 89 | 106 | ||
| 0.28 | 97 | 412 | 4 | 84 | 112 | ||
| JTN2 | Poisson process | - | 38 | 110 | 4 | 15 | 53 |
| JTN3-1 | BPT | 0.12 | 109 | 220 | 3 | 102 | 117 |
| 0.22 | 109 | 220 | 3 | 96 | 124 | ||
| 0.32 | 109 | 220 | 3 | 91 | 131 | ||
| JTN2 + JTN3 | Poisson process | - | 218 | 218 | 1 | 66 | 1260 |
| JTT | Poisson process | - | 103 | 400 | 4 | 56 | 191 |
| JTNR | Poisson process | - | 575 | 575 | 1 | 174 | 3324 |
| JTN1-2 | Poisson process | - | 14 | 127 | 9 | 10 | 21 |
| JTN3-2 | Poisson process | - | 42 | 127 | 3 | 21 | 93 |
| JTS1 | Poisson process | - | 206 | 412 | 2 | 89 | 582 |
| IBRK | Poisson process | - | 26 | 127 | 5 | 15 | 45 |
| TOHOKU | BPT | 0.14 | 600 | 2400 | 4 | 559 | 644 |
| 0.24 | 600 | 2400 | 4 | 532 | 676 | ||
| 0.34 | 600 | 2400 | 4 | 506 | 711 |
Table 4.
Fault parameters for the reference magnitude of each assumed fault.
| Earthquake Name (Abbreviation) | Moment Magnitude (Mw) | Number of Earthquake Faults | Earthquake Fault Parameter | Earthquake Moment Mo (Nm) | Shear Modulus μ (N/m2) | Average Slip (m) | |||||||
|---|---|---|---|---|---|---|---|---|---|---|---|---|---|
| Longitude (°) | Lattitude (°) | Depth (km) | Length (km) | Width (km) | Strike (°) | Rake (°) | Dip (°) | ||||||
| JTN1-1 | 8.2 | 1 | 143.096 | 41.603 | 9.0 | 170 | 100 | 156 | 90 | 20 | 2.51 × 10²¹ | 3.50 × 10¹⁰ | 3.30 |
| JTN2 | 7.6 | 1 | 142.388 | 38.454 | 30.8 | 60 | 60 | 194 | 90 | 22 | 2.72 × 10²⁰ | 7.00 × 10¹⁰ | 1.10 |
| JTN3-1 | 7.9 | 1 | 143.203 | 38.74 | 16.8 | 50 | 165 | 191 | 90 | 10 | 9.43 × 10²⁰ | 5.00 × 10¹⁰ | 3.30 |
| JTN2+JTN3 | 8.1 | 1 | The fault parameters were assumed as JTN2, JTN3-1 Consolidated Type Earthquake | 1.78 × 10²¹ | 5.00 × 10¹⁰ | 2.20 | |||||||
| TOHOKU | 9.0 | 1 | 144.139 | 39.9 | 4.1 | 500 | 200 | 193 | 90 | 13 | 3.98 × 10²² | Shallow part: 3.60 × 10¹⁰, Deep part: 5.20 × 10¹⁰ | Shallow part: 18.1, Deep part: 6.0 |
| JTT | 8.0 | 1 | 144.729 | 41.087 | 6.5 | 200 | 50 | 192 | 90 | 6 | 1.26 × 10²¹ | 3.50 × 10¹⁰ | 3.60 |
| 2 | 144.428 | 41.187 | 8.1 | 200 | 50 | 192 | 90 | 9 | 1.26 × 10²¹ | 3.50 × 10¹⁰ | 3.60 | ||
| 3 | 144.278 | 39.351 | 6.8 | 200 | 50 | 190 | 90 | 7 | 1.26 × 10²¹ | 3.50 × 10¹⁰ | 3.60 | ||
| 4 | 143.928 | 39.401 | 10.3 | 200 | 50 | 190 | 90 | 8 | 1.26 × 10²¹ | 3.50 × 10¹⁰ | 3.60 | ||
| 5 | 143.915 | 37.46 | 7.0 | 200 | 50 | 211 | 90 | 7 | 1.26 × 10²¹ | 3.50 × 10¹⁰ | 3.60 | ||
| 6 | 143.6 | 37.572 | 10.3 | 200 | 50 | 210 | 90 | 9 | 1.26 × 10²¹ | 3.50 × 10¹⁰ | 3.60 | ||
| 7 | 142.44 | 36.058 | 7.0 | 200 | 50 | 189 | 90 | 8 | 1.26 × 10²¹ | 3.50 × 10¹⁰ | 3.60 | ||
| 8 | 142.21 | 36.031 | 10.8 | 200 | 50 | 193 | 90 | 10 | 1.26 × 10²¹ | 3.50 × 10¹⁰ | 3.60 | ||
| JTNR | 8.3 | 1 | 144.706 | 41.088 | 0.0 | 200 | 100 | 192 | 270 | 45 | 3.55 × 10²¹ | 7.00 × 10¹⁰ | 2.50 |
| 2 | 144.226 | 39.353 | 0.0 | 200 | 100 | 190 | 270 | 45 | 3.55 × 10²¹ | 7.00 × 10¹⁰ | 2.50 | ||
| 3 | 143.856 | 37.458 | 0.0 | 200 | 100 | 211 | 270 | 45 | 3.55 × 10²¹ | 7.00 × 10¹⁰ | 2.50 | ||
| 4 | 142.407 | 36.058 | 0.0 | 200 | 100 | 189 | 270 | 45 | 3.55 × 10²¹ | 7.00 × 10¹⁰ | 2.50 | ||
| 5 | 145.486 | 40.988 | 0.0 | 200 | 100 | 192 | 270 | 45 | 3.55 × 10²¹ | 7.00 × 10¹⁰ | 2.50 | ||
| 6 | 145.006 | 39.253 | 0.0 | 200 | 100 | 190 | 270 | 45 | 3.55 × 10²¹ | 7.00 × 10¹⁰ | 2.50 | ||
| 7 | 144.736 | 37.358 | 0.0 | 200 | 100 | 211 | 270 | 45 | 3.55 × 10²¹ | 7.00 × 10¹⁰ | 2.50 | ||
| 8 | 143.186 | 35.958 | 0.0 | 200 | 100 | 189 | 270 | 45 | 3.55 × 10²¹ | 7.00 × 10¹⁰ | 2.50 | ||
| JTN1-2 | 7.5 | 1 | 143.717 | 41.43 | 17.5 | 60 | 60 | 206 | 90 | 13 | 2.24 × 10²⁰ | 5.00 × 10¹⁰ | 1.50 |
| 2 | 142.966 | 41.726 | 34.4 | 60 | 60 | 207 | 90 | 17 | 2.24 × 10²⁰ | 5.00 × 10¹⁰ | 1.50 | ||
| 3 | 143.405 | 41.099 | 19.3 | 60 | 60 | 185 | 90 | 14 | 2.24 × 10²⁰ | 5.00 × 10¹⁰ | 1.50 | ||
| 4 | 142.658 | 41.304 | 35.4 | 60 | 60 | 184 | 90 | 19 | 2.24 × 10²⁰ | 5.00 × 10¹⁰ | 1.50 | ||
| 5 | 143.313 | 40.654 | 20.1 | 60 | 60 | 184 | 90 | 14 | 2.24 × 10²⁰ | 5.00 × 10¹⁰ | 1.50 | ||
| 6 | 142.605 | 40.754 | 35.4 | 60 | 60 | 184 | 90 | 19 | 2.24 × 10²⁰ | 5.00 × 10¹⁰ | 1.50 | ||
| 7 | 143.222 | 40.194 | 21.3 | 60 | 60 | 186 | 90 | 14 | 2.24 × 10²⁰ | 5.00 × 10¹⁰ | 1.50 | ||
| 8 | 142.556 | 40.2 | 34.9 | 60 | 60 | 185 | 90 | 20 | 2.24 × 10²⁰ | 5.00 × 10¹⁰ | 1.50 | ||
| JTN3-2 | 7.4 | 1 | 143.267 | 38.727 | 16 | 50 | 50 | 192 | 90 | 10 | 1.58 × 10²⁰ | 5.00 × 10¹⁰ | 1.30 |
| 2 | 143.121 | 38.332 | 16.5 | 50 | 50 | 191 | 90 | 10 | 1.58 × 10²⁰ | 5.00 × 10¹⁰ | 1.30 | ||
| 3 | 142.997 | 37.922 | 16.9 | 50 | 50 | 193 | 90 | 10 | 1.58 × 10²⁰ | 5.00 × 10¹⁰ | 1.30 | ||
| JTS1 | 7.4 | 1 | 142.804 | 37.298 | 17.3 | 50 | 50 | 204 | 90 | 10 | 1.58 × 10²⁰ | 5.00 × 10¹⁰ | 1.30 |
| 2 | 142.372 | 37.445 | 23.4 | 50 | 50 | 201 | 90 | 15 | 1.58 × 10²⁰ | 5.00 × 10¹⁰ | 1.30 | ||
| 3 | 141.948 | 37.564 | 34.6 | 50 | 50 | 204 | 90 | 23 | 1.58 × 10²⁰ | 5.00 × 10¹⁰ | 1.30 | ||
| 4 | 142.556 | 36.877 | 15.7 | 50 | 50 | 212 | 90 | 13 | 1.58 × 10²⁰ | 5.00 × 10¹⁰ | 1.30 | ||
| 5 | 142.12 | 37.036 | 24.6 | 50 | 50 | 205 | 90 | 16 | 1.58 × 10²⁰ | 5.00 × 10¹⁰ | 1.30 | ||
| 6 | 141.697 | 37.149 | 35.3 | 50 | 50 | 207 | 90 | 22 | 1.58 × 10²⁰ | 5.00 × 10¹⁰ | 1.30 | ||
| IBRK | 7.5 | 1 | 142.2 | 36.515 | 16 | 55 | 55 | 207 | 90 | 15 | 2.24 × 10²⁰ | 5.00 × 10¹⁰ | 1.40 |
| 2 | 141.467 | 36.77 | 34.7 | 55 | 55 | 205 | 90 | 21 | 2.24 × 10²⁰ | 5.00 × 10¹⁰ | 1.40 | ||
| 3 | 141.881 | 36.149 | 17.5 | 55 | 55 | 201 | 90 | 15 | 2.24 × 10²⁰ | 5.00 × 10¹⁰ | 1.40 | ||
| 4 | 141.222 | 36.367 | 36.1 | 55 | 55 | 194 | 90 | 19 | 2.24 × 10²⁰ | 5.00 × 10¹⁰ | 1.40 | ||
| 5 | 141.714 | 35.99 | 18.4 | 55 | 55 | 197 | 90 | 17 | 2.24 × 10²⁰ | 5.00 × 10¹⁰ | 1.40 | ||
| 6 | 141.299 | 36.127 | 31.6 | 55 | 55 | 194 | 90 | 20 | 2.24 × 10²⁰ | 5.00 × 10¹⁰ | 1.40 | ||
Table 5.
Calculation conditions for the tsunami numerical simulation.
| Item | Calculation Condition |
|---|---|
| Governing equation | 2D non-linear shallow water equation (Tohoku University TUNAMI model) [19] |
| Numerical integration method | Staggered leap-frog differential method |
| Initial condition | Okada equation [18] |
| Boundary condition | Open boundary |
| Coordination system | Spherical coordinate system |
| Tidal setting | T.P. +0.0 m |
| Mesh size | 450 m |
| Time step | 0.9 s |
| Calculation time | 3 h |
Table 6.
Calculation results for Soma. (a) Earthquake source name; (b) moment magnitude of the earthquake; (c) position of the asperity; (d) tsunami wave height at a water depth of 10 m; (e) annual exceedance probability estimated using the tsunami hazard curve; (f) return period calculated from the annual exceedance probability; (g) tsunami inundation height at the risk assessment point simulated using a nonlinear longwave equation with the fault parameters.
| (a) | (b) | (c) | (d) | (e) | (f) | (g) | (h) |
|---|---|---|---|---|---|---|---|
| Earthquake Source | Moment Magnitude (Mw) | Position of Asperity | Tsunami Height (m) (10 m Water Depth Point) | Annual Exceedance Probability | Return Period (year) | Tsunami Inundation Height (m) (Risk Assessment Point) | Tsunami Inundation Depth (m) (Risk Assessment Point) |
| TOHOKU | 9.1 | Center | 8.58 | 0.000294 | 3405 | 13.63 | 9.96 |
| 9.1 | Between south and center | 7.84 | 0.000423 | 2363 | 10.33 | 6.66 | |
| 9.1 | South | 7.84 | 0.000425 | 2355 | 12.54 | 8.87 | |
| 9.0 | Center | 7.10 | 0.000579 | 1728 | 11.54 | 7.87 | |
| 9.1 | Between north and center | 6.78 | 0.000655 | 1526 | 10.56 | 6.89 | |
| 9.0 | South | 6.58 | 0.000702 | 1425 | 11.13 | 7.46 | |
| 9.1 | North | 6.51 | 0.000720 | 1388 | 10.68 | 7.01 | |
| 9.0 | Between south and center | 6.48 | 0.000725 | 1379 | 10.41 | 6.74 | |
| 9.0 | Between north and center | 5.49 | 0.000992 | 1008 | 9.38 | 5.71 | |
| 8.9 | Center | 5.44 | 0.001009 | 991 | 9.27 | 5.60 | |
| 9.0 | North | 5.42 | 0.001015 | 986 | 9.35 | 5.68 | |
| 8.9 | South | 5.28 | 0.001052 | 950 | 9.65 | 5.98 | |
| 8.9 | Between south and center | 4.93 | 0.001171 | 854 | 8.54 | 4.87 | |
| 8.9 | Between north and center | 4.40 | 0.001381 | 724 | 8.08 | 4.41 | |
| 8.9 | North | 4.08 | 0.001538 | 650 | 7.89 | 4.22 | |
| JTNR | 8.4 | North | 2.50 | 0.004316 | 232 | 4.30 | 0.63 |
| 8.4 | Center | 2.47 | 0.004464 | 224 | 3.97 | 0.30 | |
| 8.4 | South | 2.37 | 0.005014 | 199 | 3.84 | 0.17 | |
| JTN2 + JTN3 | 8.2 | South | 2.29 | 0.005459 | 183 | 4.51 | 0.84 |
| 8.2 | Center | 2.26 | 0.005667 | 176 | 4.36 | 0.69 | |
| JTT | 8.1 | Center | 2.25 | 0.005738 | 174 | 4.15 | 0.48 |
| 8.1 | North | 2.23 | 0.005885 | 170 | 4.10 | 0.43 | |
| 8.1 | Center | 2.23 | 0.005961 | 168 | 3.93 | 0.26 | |
| JTNR | 8.4 | South | 2.23 | 0.005961 | 168 | 4.28 | 0.61 |
| 8.4 | North | 2.20 | 0.006195 | 161 | 4.88 | 1.21 | |
| 8.4 | Center | 2.19 | 0.006275 | 159 | 4.35 | 0.68 | |
| JTT | 8.1 | North | 2.14 | 0.006612 | 151 | 3.78 | 0.11 |
| 8.0 | Center | 2.01 | 0.007986 | 125 | 0.00 | 0.00 | |
| 8.1 | South | 1.96 | 0.008441 | 118 | 0.00 | 0.00 | |
| 8.0 | Center | 1.96 | 0.008441 | 118 | 0.00 | 0.00 |
Table 7.
Calculation results for Sendai. (a) Earthquake source name; (b) moment magnitude of the earthquake; (c) position of the asperity; (d) tsunami wave height at a water depth of 10 m; (e) annual exceedance probability estimated using the tsunami hazard curve; (f) return period calculated from the annual exceedance probability; (g) tsunami inundation height at the risk assessment point simulated using a nonlinear longwave equation with the fault parameters.
| (a) | (b) | (c) | (d) | (e) | (f) | (g) | (h) |
|---|---|---|---|---|---|---|---|
| Earthquake Source | Moment Magnitude (Mw) | Position of Asperity | Tsunami Height (m) (10 m Water Depth Point) | Annual Exceedance Probability | Return Period (year) | Tsunami Inundation Height (m) (Risk Assessment Point) | Tsunami Inundation Depth (m) (Risk Assessment Point) |
| TOHOKU | 9.1 | Center | 9.89 | 0.000220 | 4536 | 6.84 | 5.74 |
| 9.0 | Center | 8.50 | 0.000459 | 2177 | 5.97 | 4.87 | |
| 9.1 | Between north and center | 7.95 | 0.000603 | 1657 | 5.06 | 3.96 | |
| 9.1 | South | 7.58 | 0.000712 | 1404 | 4.66 | 3.56 | |
| 8.9 | Center | 6.82 | 0.001023 | 978 | 4.27 | 3.17 | |
| 9.0 | Between north and center | 6.78 | 0.001041 | 960 | 4.26 | 3.16 | |
| 9.1 | Between south and center | 6.64 | 0.001123 | 890 | 3.84 | 2.74 | |
| 9.0 | South | 6.52 | 0.001197 | 836 | 3.77 | 2.67 | |
| 9.1 | North | 6.38 | 0.001339 | 747 | 3.85 | 2.75 | |
| 8.9 | Between north and center | 5.62 | 0.002392 | 418 | 2.74 | 1.64 | |
| 9.0 | Between south and center | 5.56 | 0.002493 | 401 | 2.15 | 1.05 | |
| 9.0 | North | 5.52 | 0.002592 | 386 | 2.95 | 1.85 | |
| 8.9 | South | 5.30 | 0.003047 | 328 | 2.25 | 1.15 | |
| 8.9 | North | 4.49 | 0.005733 | 174 | 1.76 | 0.66 | |
| 8.9 | Between south and center | 4.30 | 0.006729 | 149 | 0.00 | 0.00 | |
| JTN2 + JTN3 | 8.2 | South | 4.16 | 0.007465 | 134 | 0.00 | 0.00 |
| 8.2 | Center | 4.04 | 0.008285 | 121 | 0.00 | 0.00 | |
| 8.2 | North | 3.79 | 0.010163 | 98 | 0.00 | 0.00 | |
| JTN3-1 | 8.0 | South | 3.76 | 0.010331 | 97 | 0.00 | 0.00 |
| 8.0 | Center | 3.61 | 0.011687 | 86 | 0.00 | 0.00 | |
| JTN2 + JTN3 | 8.1 | Center | 3.41 | 0.013891 | 72 | 0.00 | 0.00 |
| JTN3-1 | 8.0 | North | 3.36 | 0.014356 | 70 | 0.00 | 0.00 |
| JTN2 + JTN3 | 8.1 | South | 3.31 | 0.014959 | 67 | 0.00 | 0.00 |
| JTT | 8.1 | South | 3.16 | 0.017056 | 59 | 0.00 | 0.00 |
| JTN2 + JTN3 | 8.1 | North | 3.13 | 0.017479 | 57 | 0.00 | 0.00 |
| JTT | 8.1 | Center | 3.01 | 0.019274 | 52 | 0.00 | 0.00 |
| JTN3-1 | 7.9 | Center | 2.93 | 0.020564 | 49 | 0.00 | 0.00 |
| JTNR | 8.4 | South | 2.90 | 0.021068 | 47 | 0.00 | 0.00 |
| 8.4 | North | 2.87 | 0.021410 | 47 | 0.00 | 0.00 | |
| 8.4 | Center | 2.85 | 0.021757 | 46 | 0.00 | 0.00 |
Table 8.
Calculation results for Kesennuma. (a) Earthquake source name; (b) moment magnitude of the earthquake; (c) position of the asperity; (d) tsunami wave height at a water depth of 10 m; (e) annual exceedance probability estimated using the tsunami hazard curve; (f) return period calculated from the annual exceedance probability; (g) tsunami inundation height at the risk assessment point simulated using a nonlinear longwave equation with the fault parameters.
| (a) | (b) | (c) | (d) | (e) | (f) | (g) | (h) |
|---|---|---|---|---|---|---|---|
| Earthquake Source | Moment Magnitude (Mw) | Position of Asperity | Tsunami Height (m) (10 m Water Depth Point) | Annual Exceedance Probability | Return Period (year) | Tsunami Inundation Height (m) (Risk Assessment Point) | Tsunami Inundation Depth (m) (Risk Assessment Point) |
| TOHOKU | 9.1 | Between north and center | 19.44 | 0.000132 | 7574 | 2.91 | 1.51 |
| 9.1 | Center | 17.01 | 0.000254 | 634 | 2.97 | 1.57 | |
| 9.0 | Between north and center | 15.66 | 0.000334 | 531 | 3.18 | 1.78 | |
| 9.0 | Center | 14.21 | 0.000444 | 440 | 3.16 | 1.76 | |
| 9.1 | Between south and center | 12.41 | 0.000616 | 416 | 2.73 | 1.33 | |
| 9.1 | North | 12.24 | 0.000627 | 405 | 6.08 | 4.68 | |
| 8.9 | Between north and center | 10.50 | 0.000853 | 327 | 3.26 | 1.86 | |
| 8.9 | Center | 10.48 | 0.000855 | 326 | 3.08 | 1.68 | |
| 9.0 | North | 10.11 | 0.000896 | 318 | 5.13 | 3.73 | |
| 9.0 | Between south and center | 9.30 | 0.000992 | 309 | 2.78 | 1.38 | |
| 9.1 | South | 9.13 | 0.001019 | 309 | 4.35 | 2.95 | |
| 8.9 | North | 7.82 | 0.001191 | 309 | 4.34 | 2.94 | |
| 9.0 | South | 6.85 | 0.001320 | 307 | 3.71 | 2.31 | |
| 8.9 | Between south and center | 6.44 | 0.001383 | 305 | 2.46 | 1.06 | |
| 8.9 | South | 4.92 | 0.001951 | 194 | 3.14 | 1.74 | |
| JTT | 8.1 | South | 3.63 | 0.004062 | 78 | 0.00 | 0.00 |
| 8.1 | South | 3.61 | 0.004093 | 77 | 0.00 | 0.00 | |
| 8.1 | Center | 3.56 | 0.004288 | 73 | 0.00 | 0.00 | |
| 8.1 | North | 3.46 | 0.004608 | 68 | 0.00 | 0.00 | |
| 8.1 | Center | 3.37 | 0.005007 | 61 | 0.00 | 0.00 | |
| JTNR | 8.4 | South | 3.27 | 0.005458 | 55 | 0.00 | 0.00 |
| 8.4 | North | 3.26 | 0.005506 | 55 | 0.00 | 0.00 | |
| JTT | 8.1 | North | 3.19 | 0.005808 | 51 | 0.00 | 0.00 |
| JTNR | 8.4 | Center | 3.18 | 0.005860 | 50 | 0.00 | 0.00 |
| JTN2 + JTN3 | 8.2 | North | 3.05 | 0.006667 | 44 | 0.00 | 0.00 |
| JTNR | 8.4 | South | 2.86 | 0.008003 | 35 | 0.00 | 0.00 |
| 8.4 | Center | 2.82 | 0.008243 | 34 | 0.00 | 0.00 | |
| JTT | 8.0 | South | 2.82 | 0.008325 | 34 | 0.00 | 0.00 |
| 8.0 | Center | 2.78 | 0.008662 | 32 | 0.00 | 0.00 | |
| 8.0 | South | 2.78 | 0.008662 | 32 | 0.00 | 0.00 |
Table 9.
Calculation conditions for the nonlinear longwave equation used in the tsunami numerical simulation for Soma.
Table 9.
Calculation conditions for the nonlinear longwave equation used in the tsunami numerical simulation for Soma.
| Item | Calculation Condition |
|---|---|
| Governing equation | 2D non-linear shallow water equation (Tohoku University TUNAMI model) [19] |
| Numerical integration method | Staggered leap-frog differential method |
| Initial condition | Okada equation [18] |
| Boundary condition | Run-up boundary |
| Coordinate system | Plane rectangular coordinate system IX |
| Tidal setting | T.P. +0.0 m |
| Mesh size | 810 m, 270 m, 90 m, 30 m, 10 m |
| Time step | 0.9 s, 0.3 s, 0.1 s, 0.03 s, 0.01 s |
| Calculation time | 3 h |
Table 10.
Calculation conditions for the nonlinear longwave equation used in the tsunami numerical simulations for Sendai and Kesennuma.
Table 10.
Calculation conditions for the nonlinear longwave equation used in the tsunami numerical simulations for Sendai and Kesennuma.
| Item | Calculation Condition |
|---|---|
| Governing equation | 2D non-linear shallow water equation (Tohoku University TUNAMI model) [19] |
| Numerical integration method | Staggered leap-frog differential method |
| Initial condition | Okada equation [18] |
| Boundary condition | Run-up boundary |
| Coordinate system | Plane rectangular coordinate system X |
| Tidal setting | T.P. +0.0 m |
| Mesh size | 1215 m, 405 m, 135 m, 45 m, 15 m |
| Time step | 0.9 s, 0.3 s, 0.1 s, 0.03 s, 0.01 s |
| Calculation time | 3 h |
© 2018 by the authors. Licensee MDPI, Basel, Switzerland. This article is an open access article distributed under the terms and conditions of the Creative Commons Attribution (CC BY) license (http://creativecommons.org/licenses/by/4.0/).
Share and Cite
MDPI and ACS Style
Fukutani, Y.; Suppasri, A.; Imamura, F. Quantitative Assessment of Epistemic Uncertainties in Tsunami Hazard Effects on Building Risk Assessments. Geosciences 2018, 8, 17. https://doi.org/10.3390/geosciences8010017
AMA Style
Fukutani Y, Suppasri A, Imamura F. Quantitative Assessment of Epistemic Uncertainties in Tsunami Hazard Effects on Building Risk Assessments. Geosciences. 2018; 8(1):17. https://doi.org/10.3390/geosciences8010017
Chicago/Turabian StyleFukutani, Yo, Anawat Suppasri, and Fumihiko Imamura. 2018. "Quantitative Assessment of Epistemic Uncertainties in Tsunami Hazard Effects on Building Risk Assessments" Geosciences 8, no. 1: 17. https://doi.org/10.3390/geosciences8010017
Note that from the first issue of 2016, this journal uses article numbers instead of page numbers. See further details here.