

Developing Mobile Applications with Augmented Reality and 3D Photogrammetry for Visualisation of Cold-Water Coral Reefs and Deep-Water Habitats
 , , , and
Abstract
:1. Introduction
2. Materials and Methods
2.1. Data Acquisition
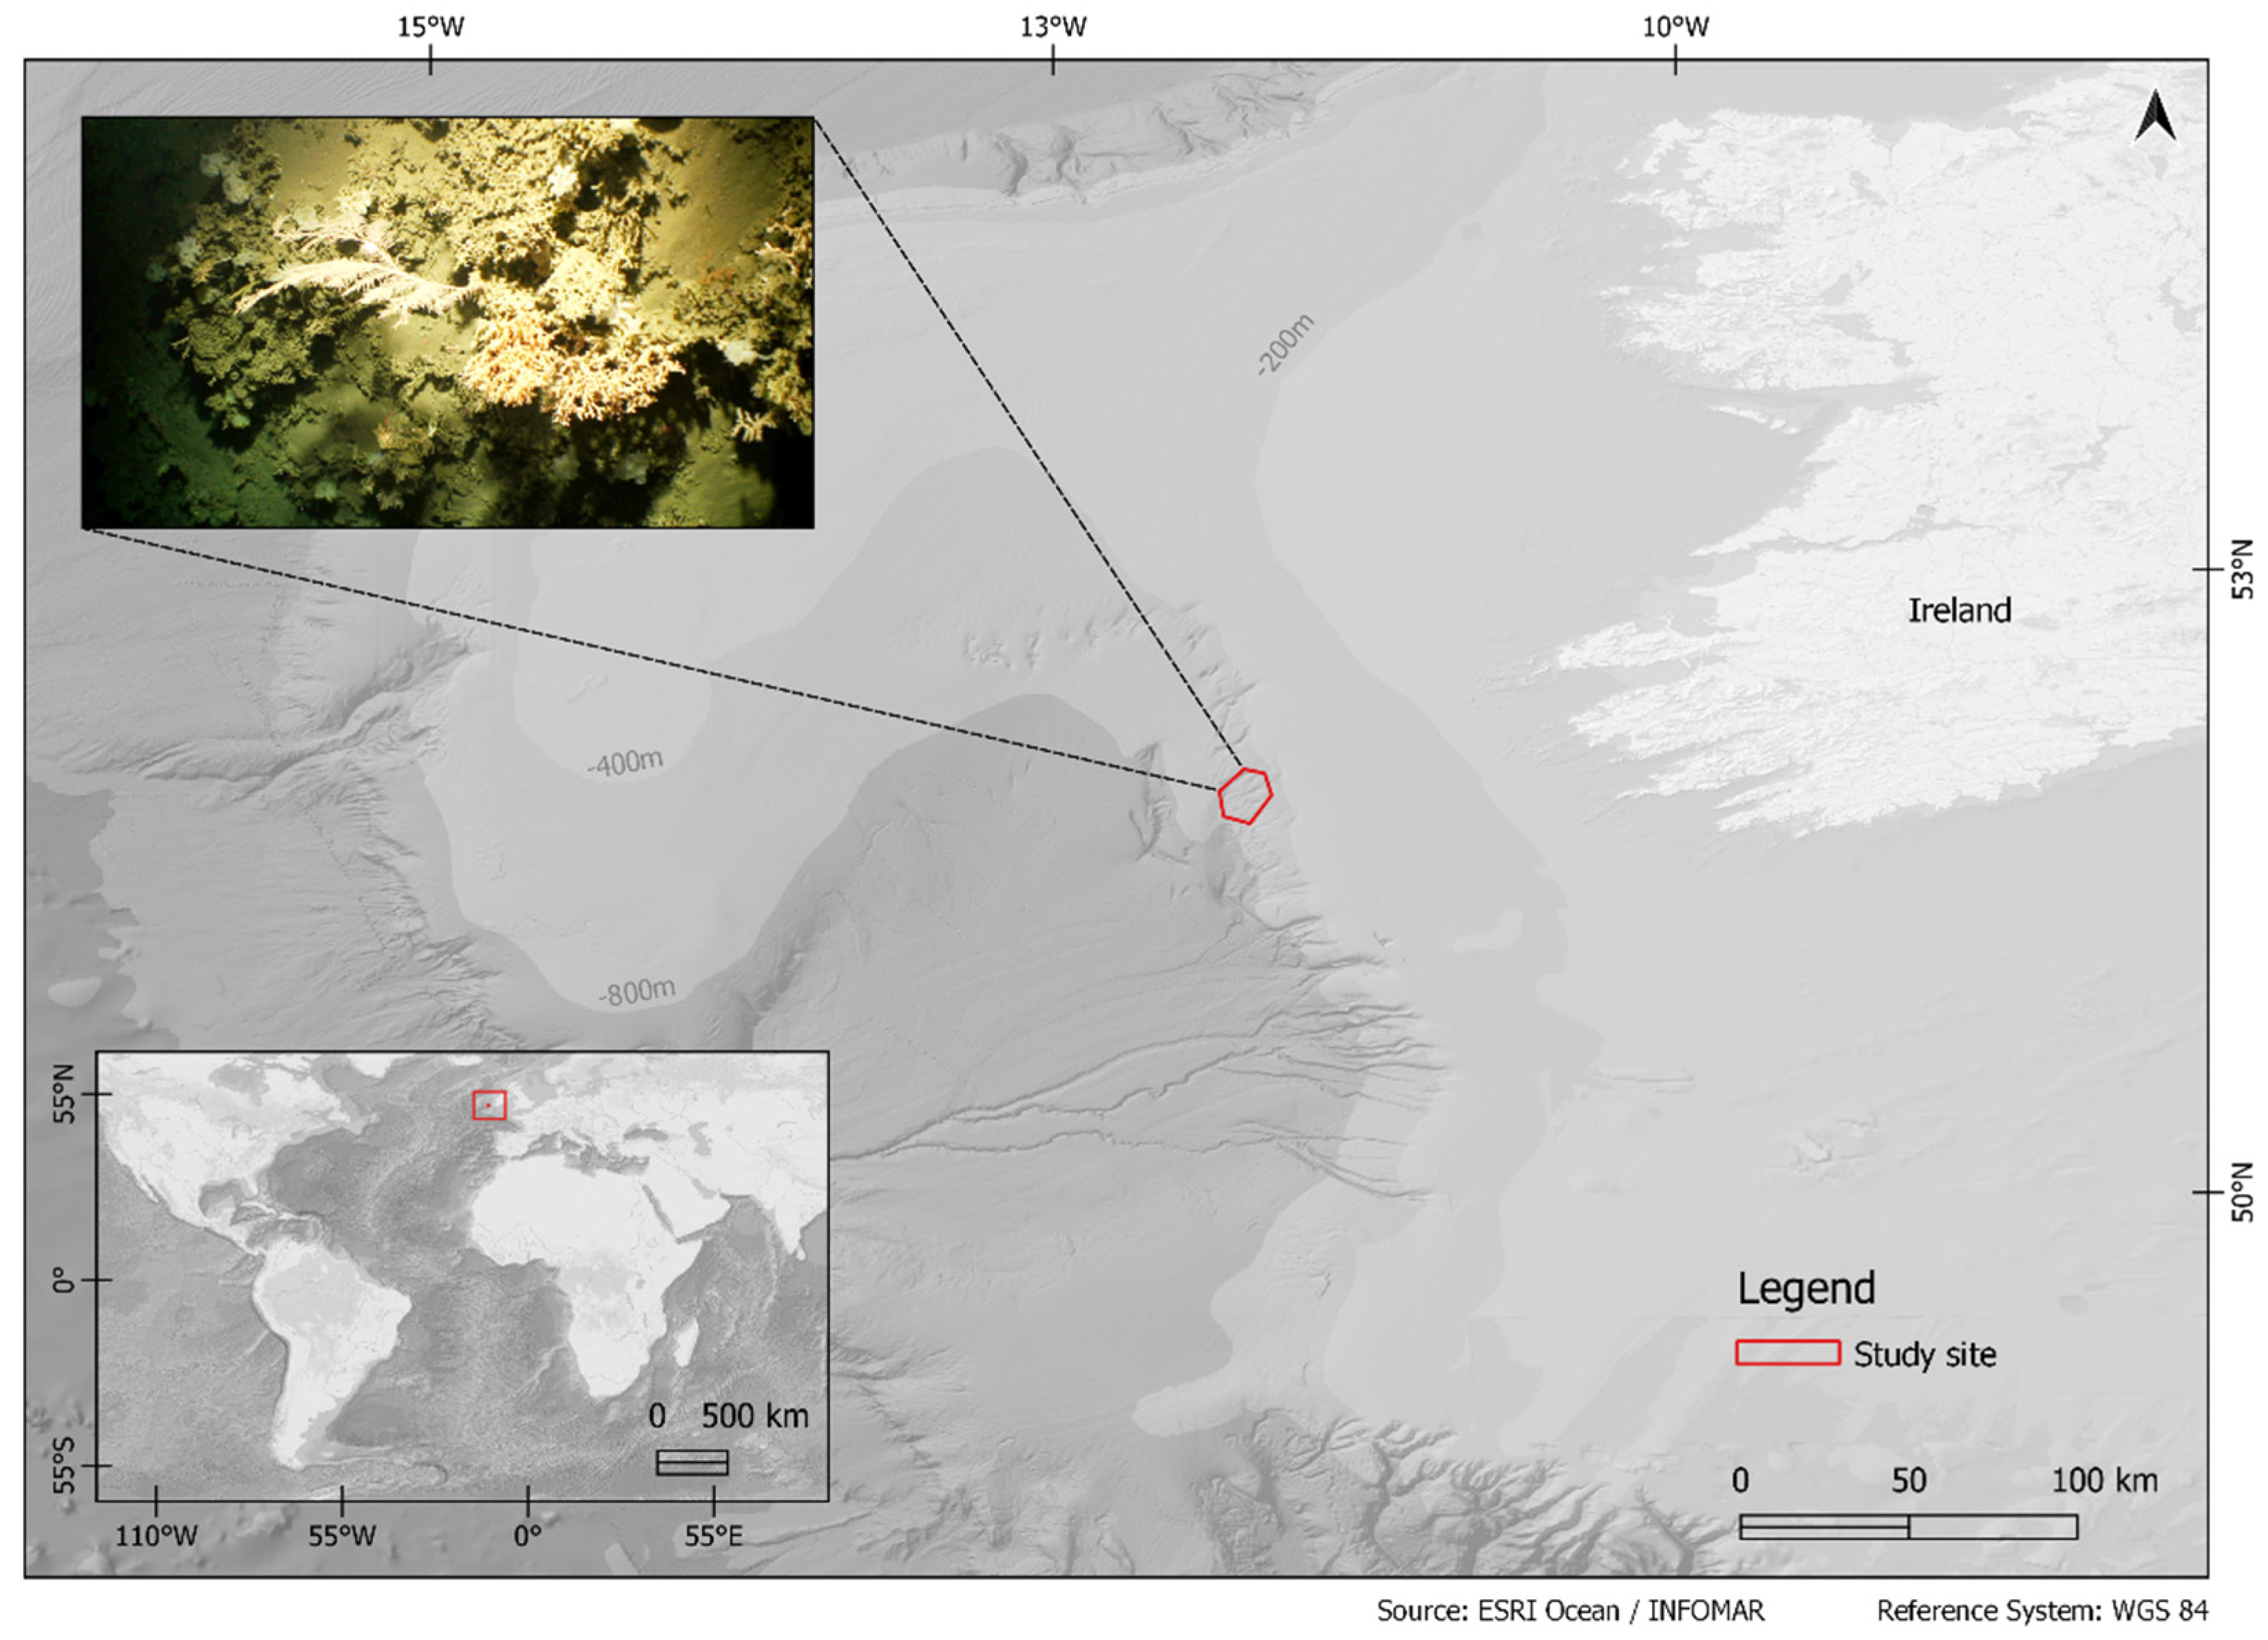
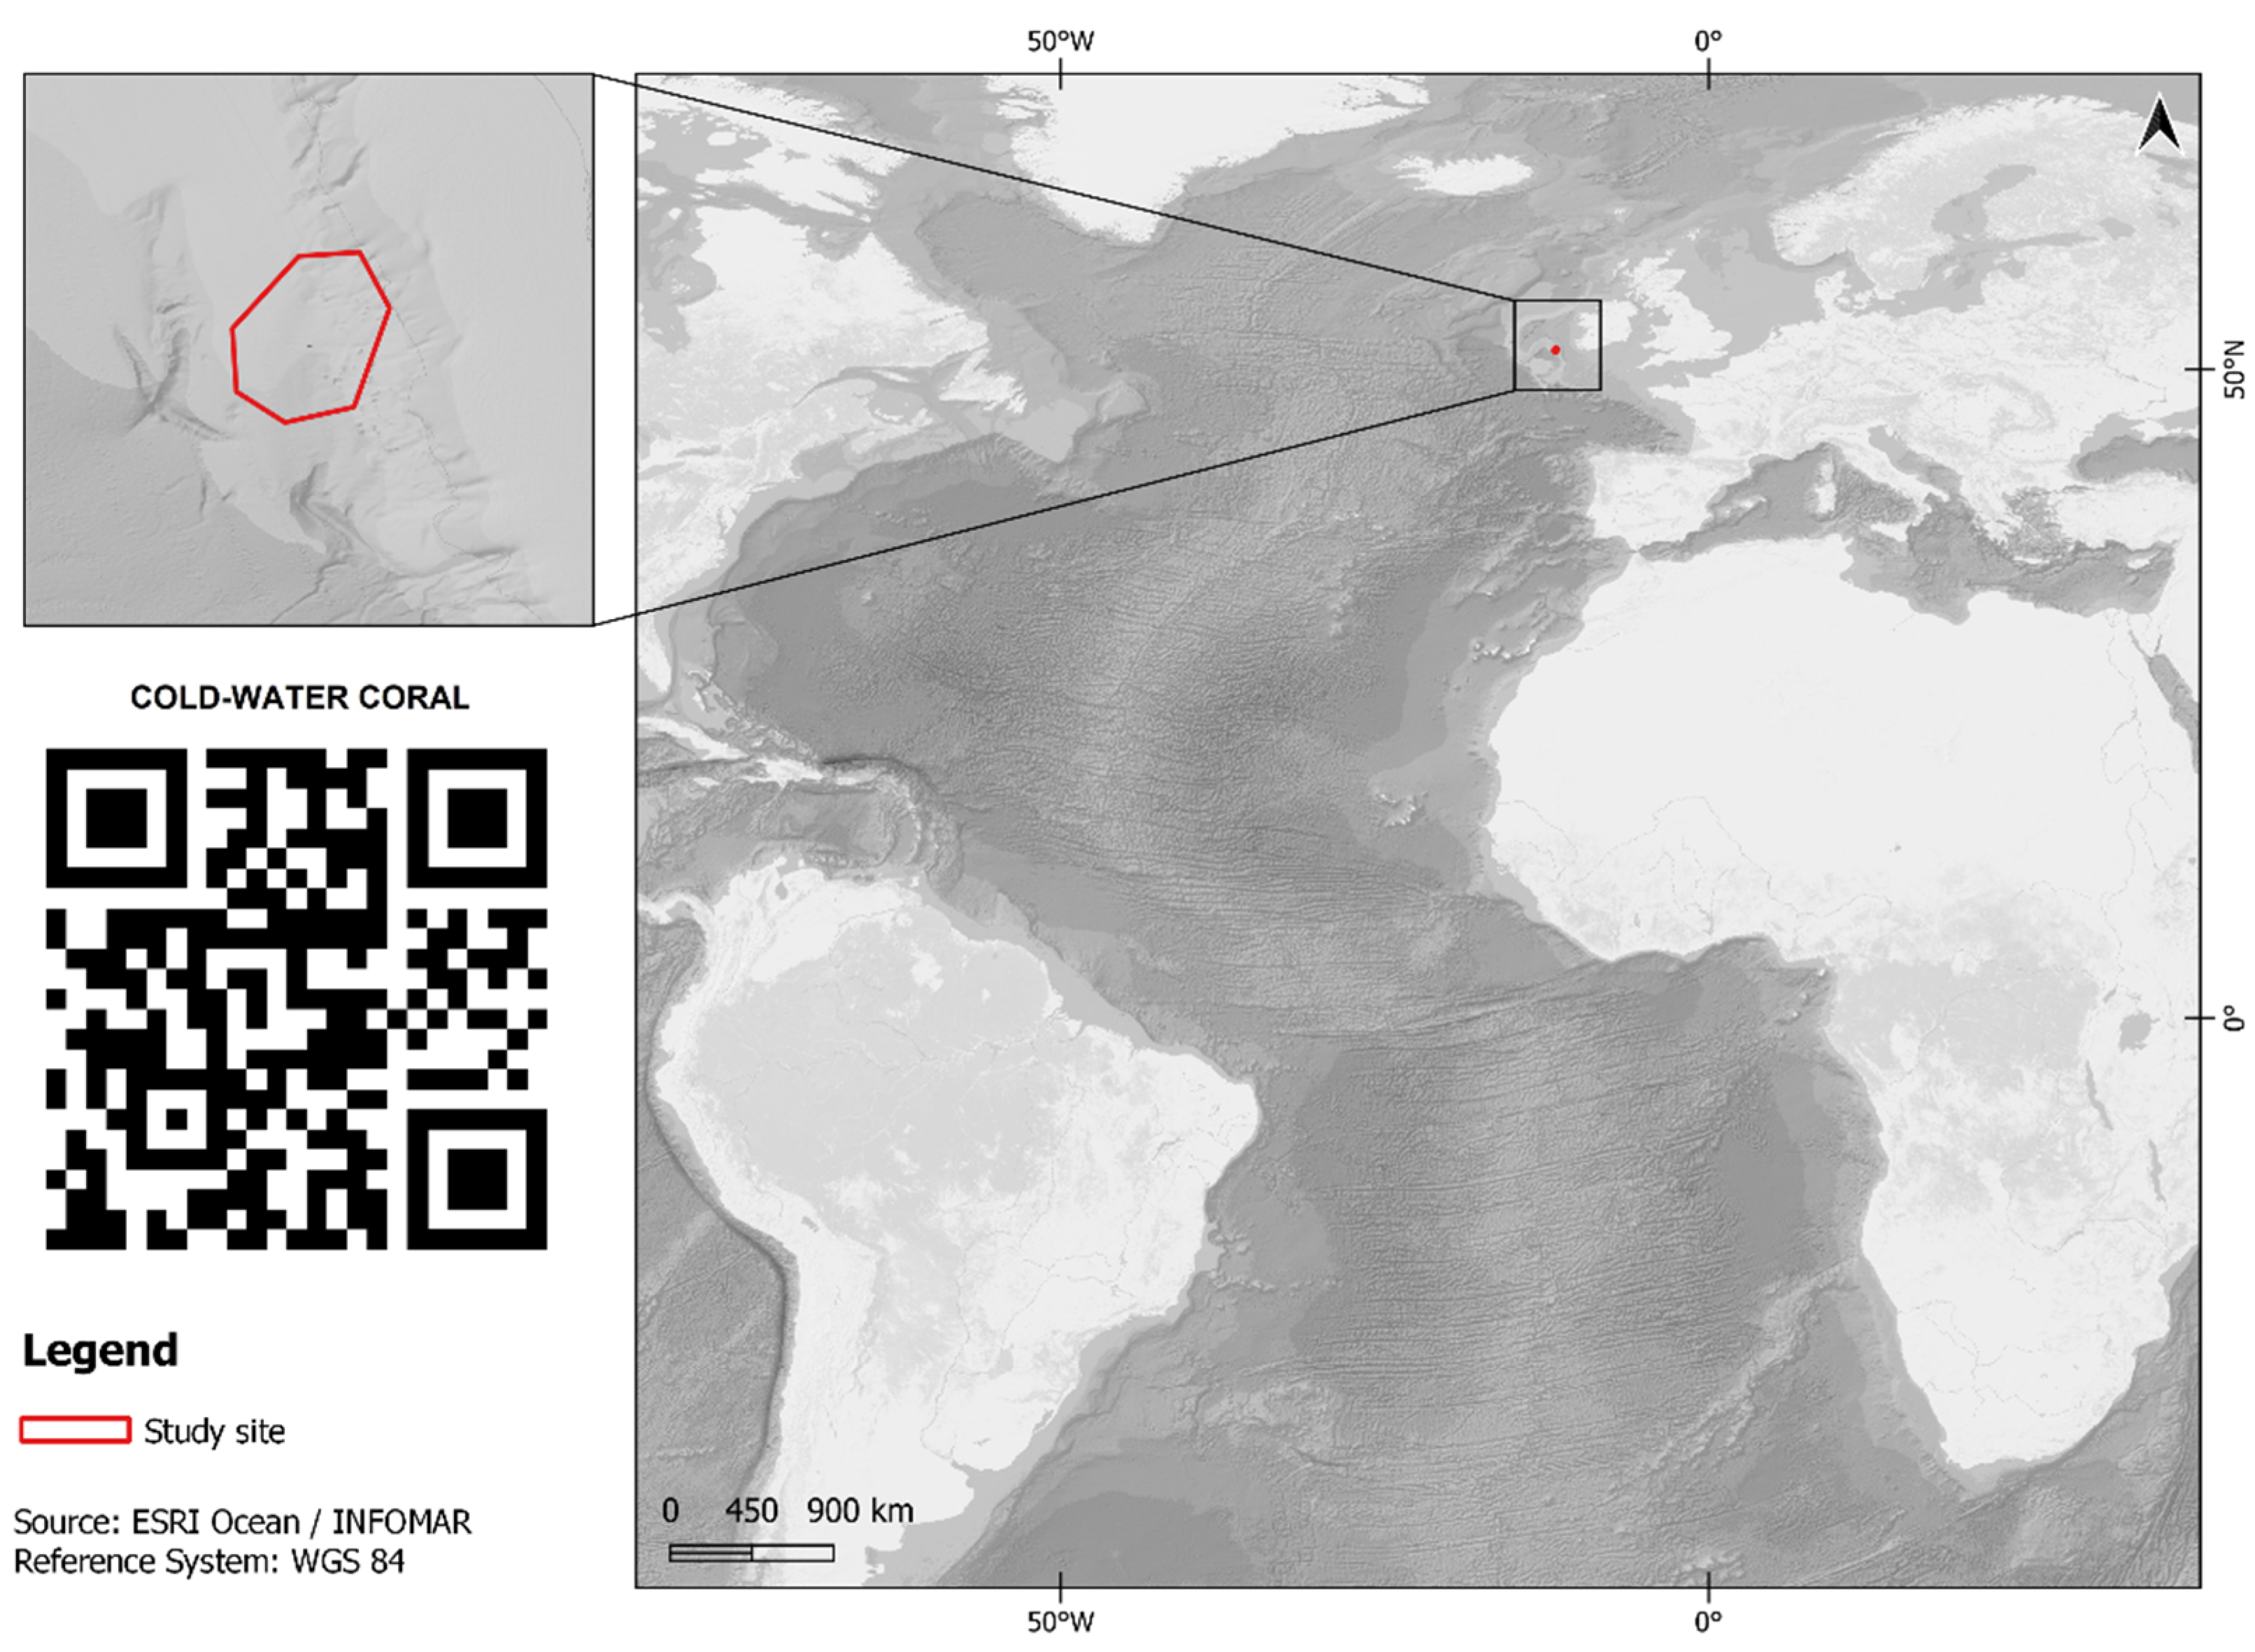
2.1.1. Study Area
2.1.2. Video Survey
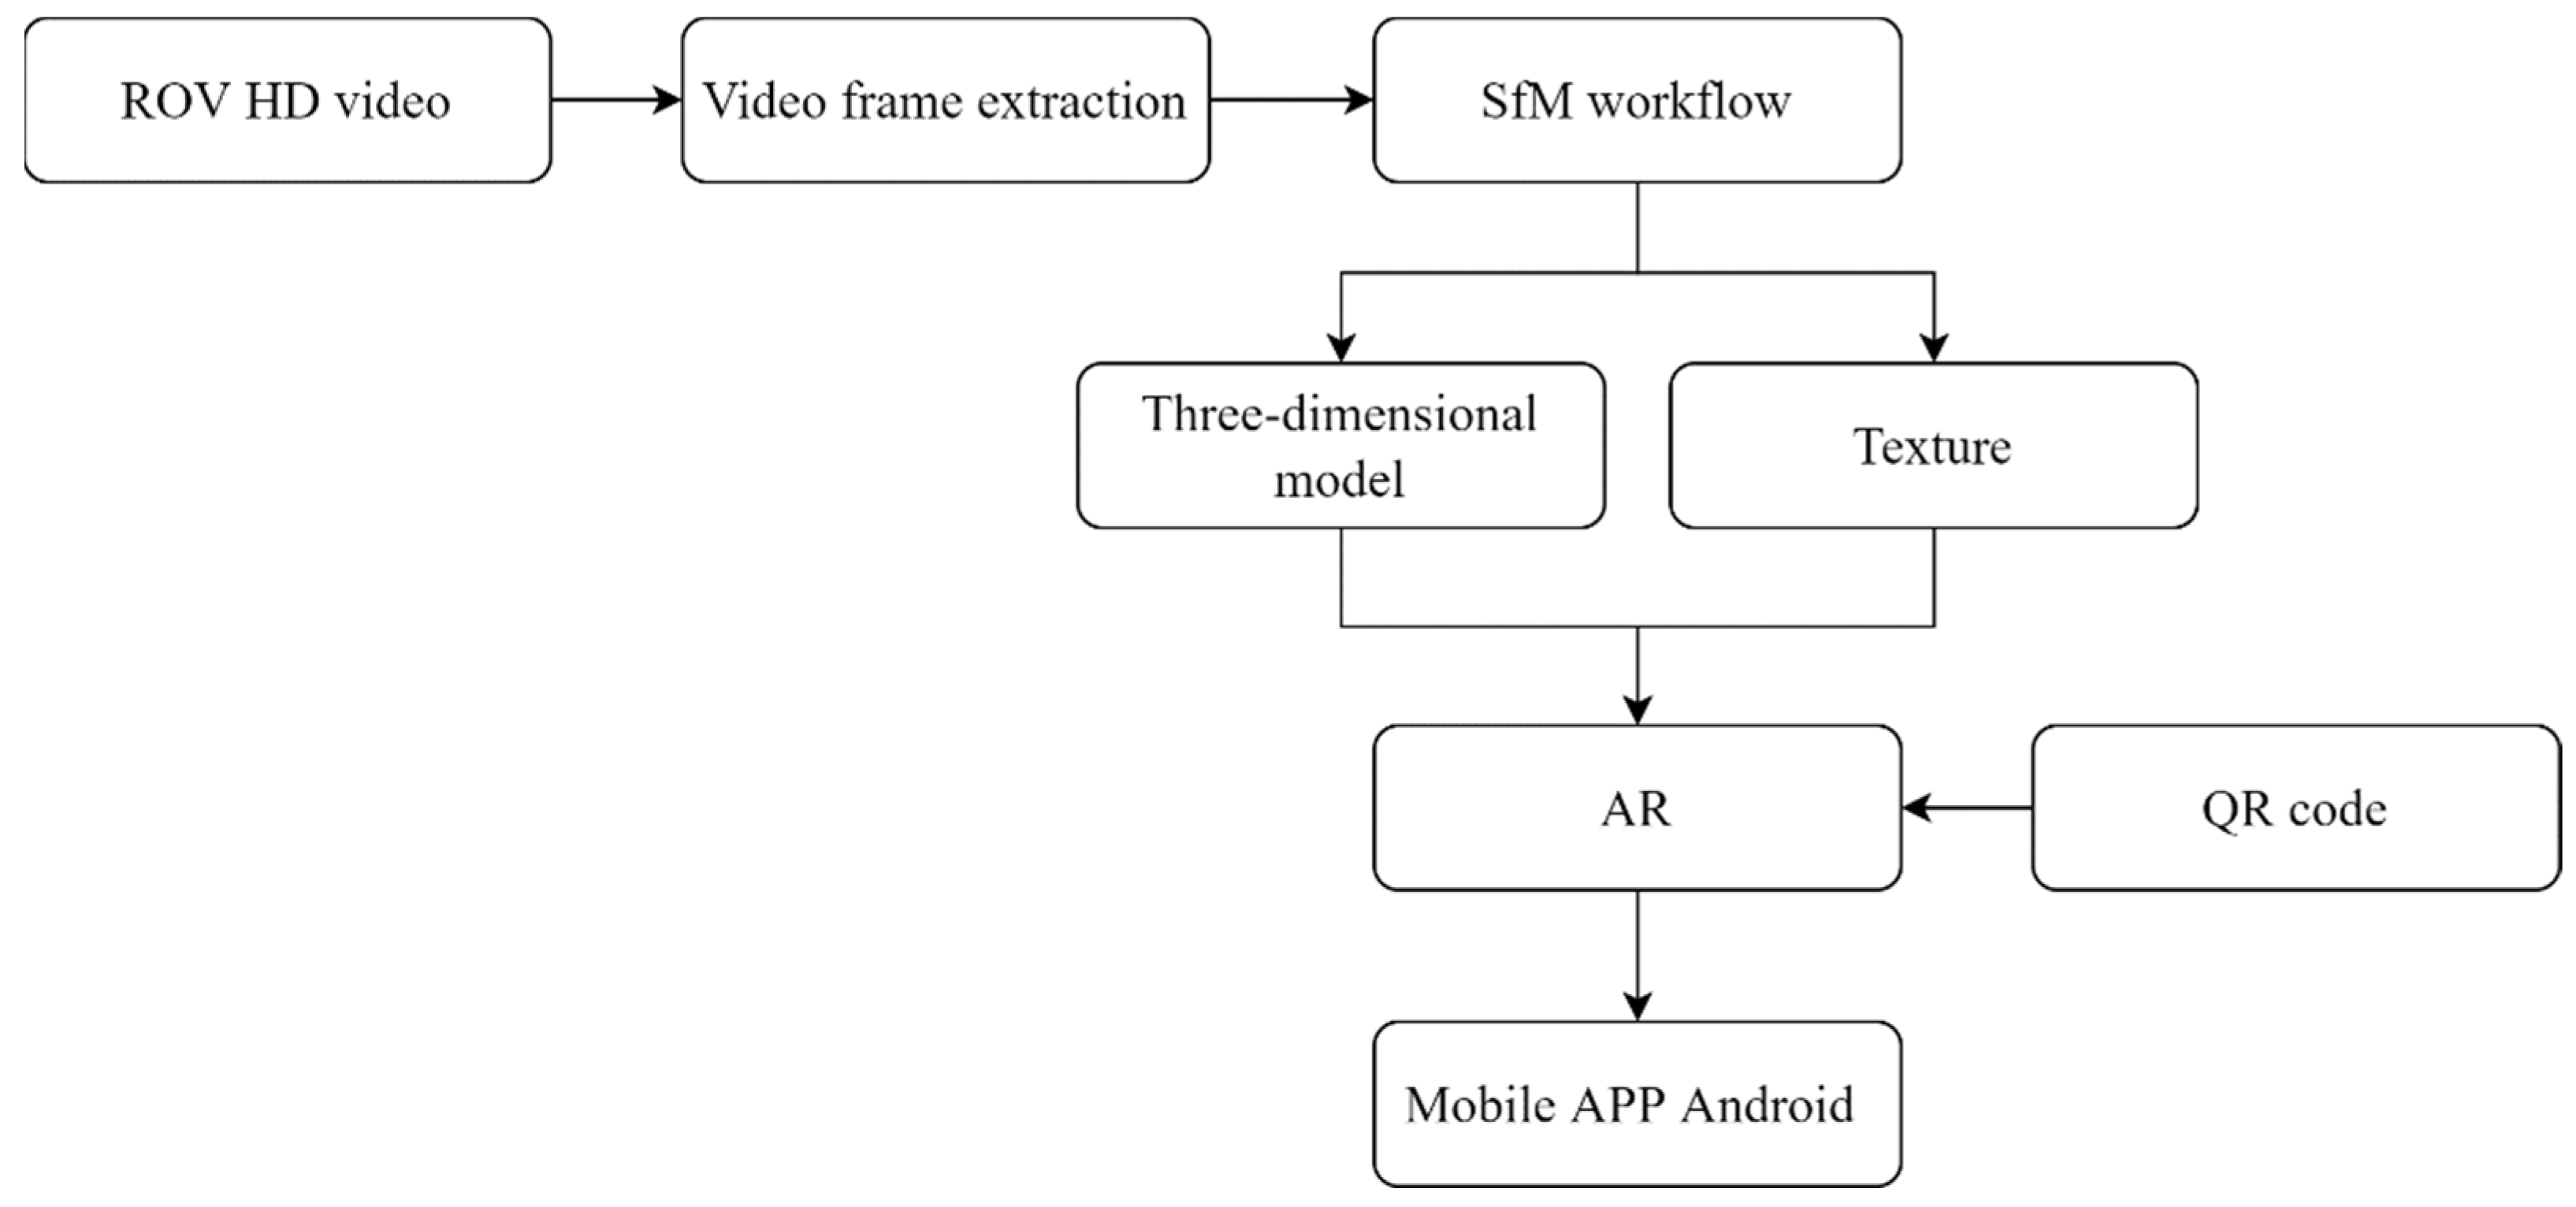
2.2. 3D Models with Structure-from-Motion Photogrammetry
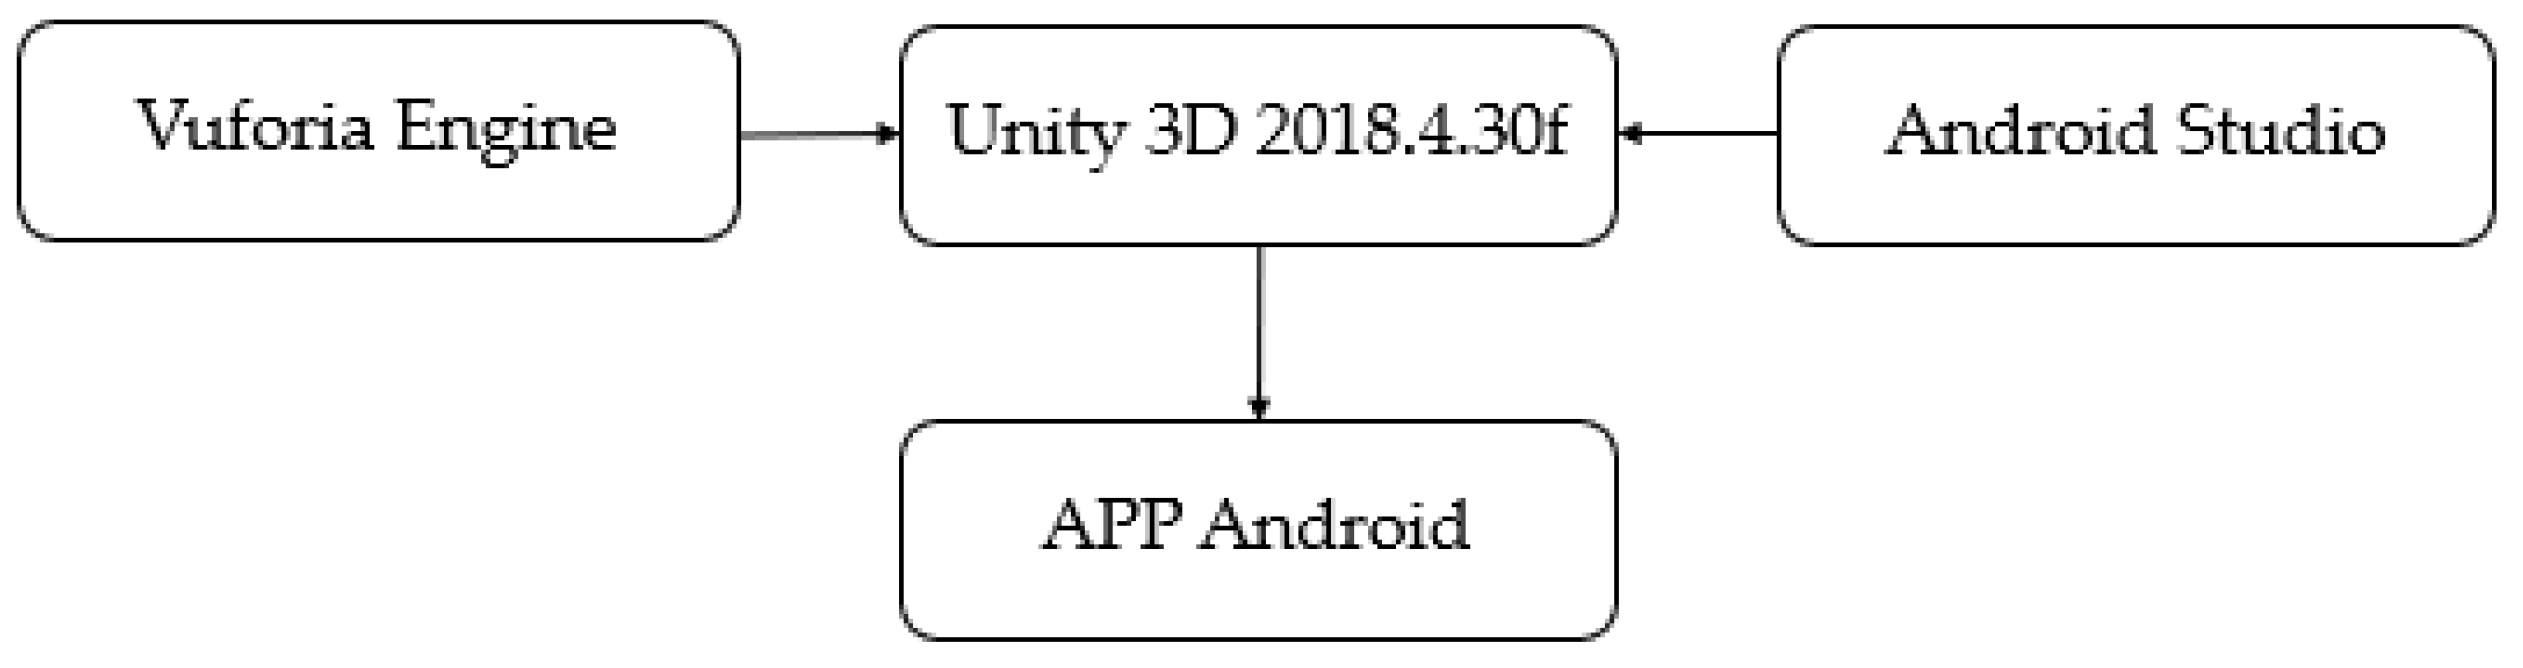
2.3. Three-Dimenisonal Android APP Development
3. Results
3.1. Photogrammetry
Habitat Characterisation
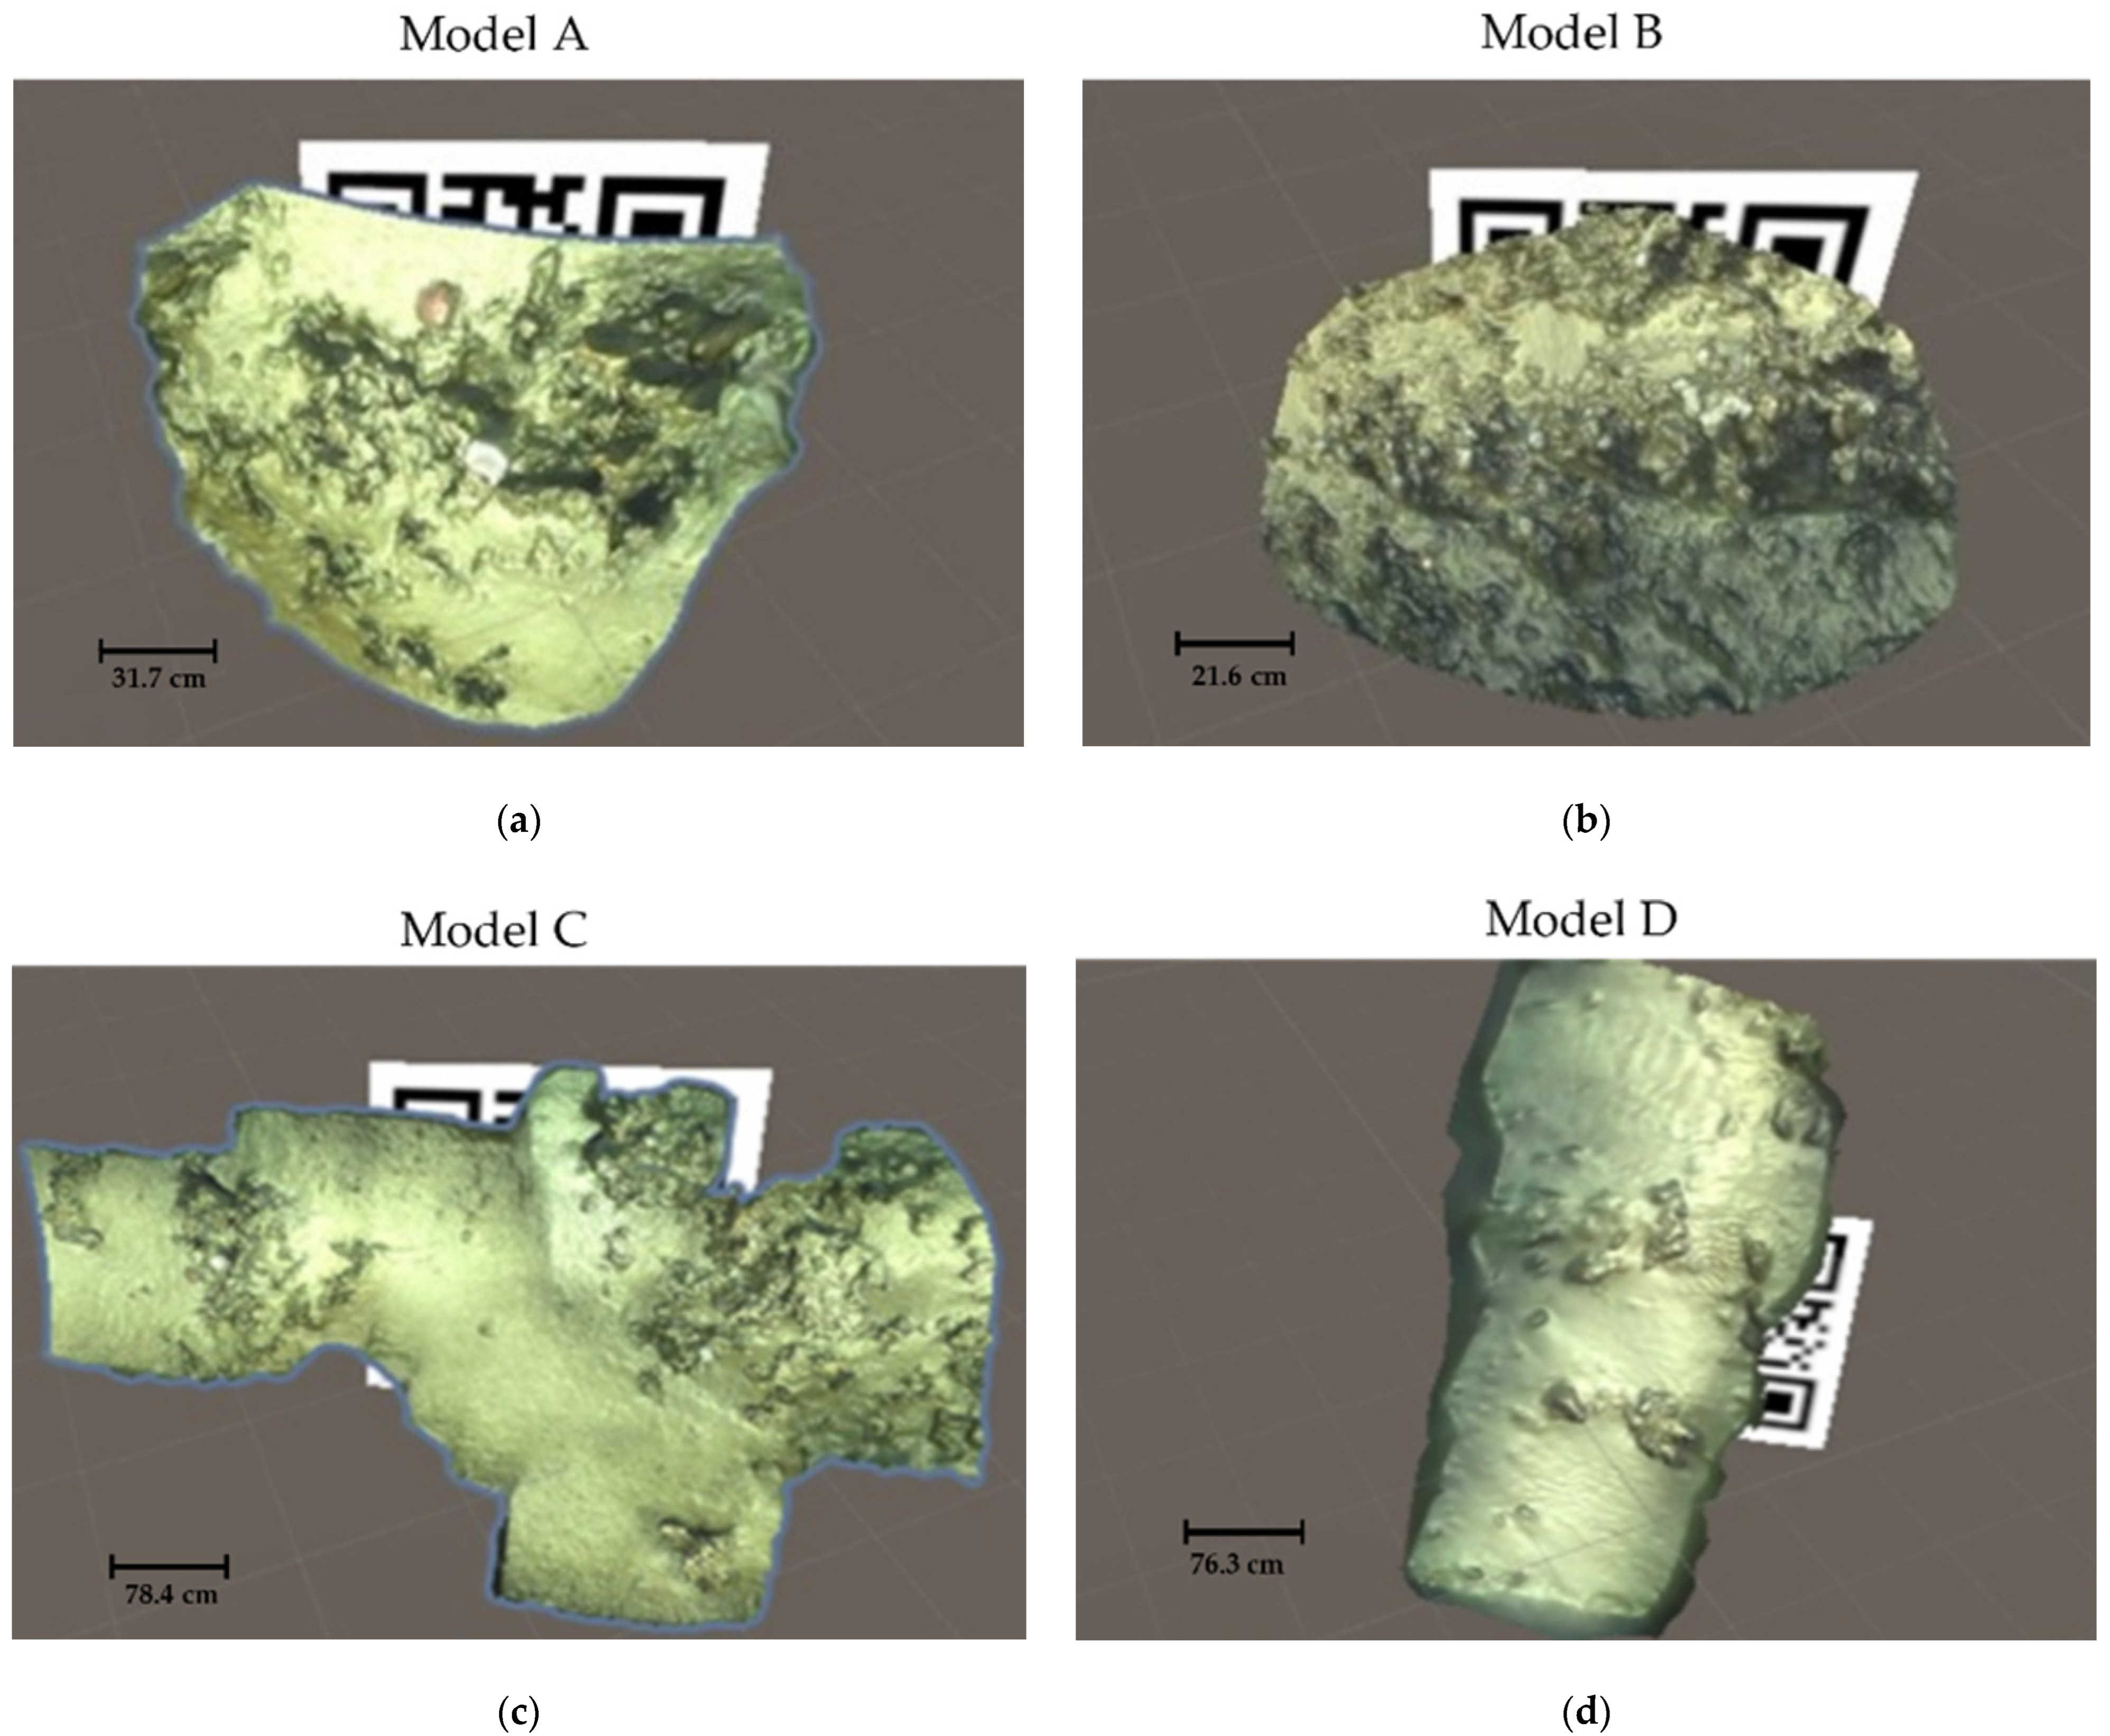
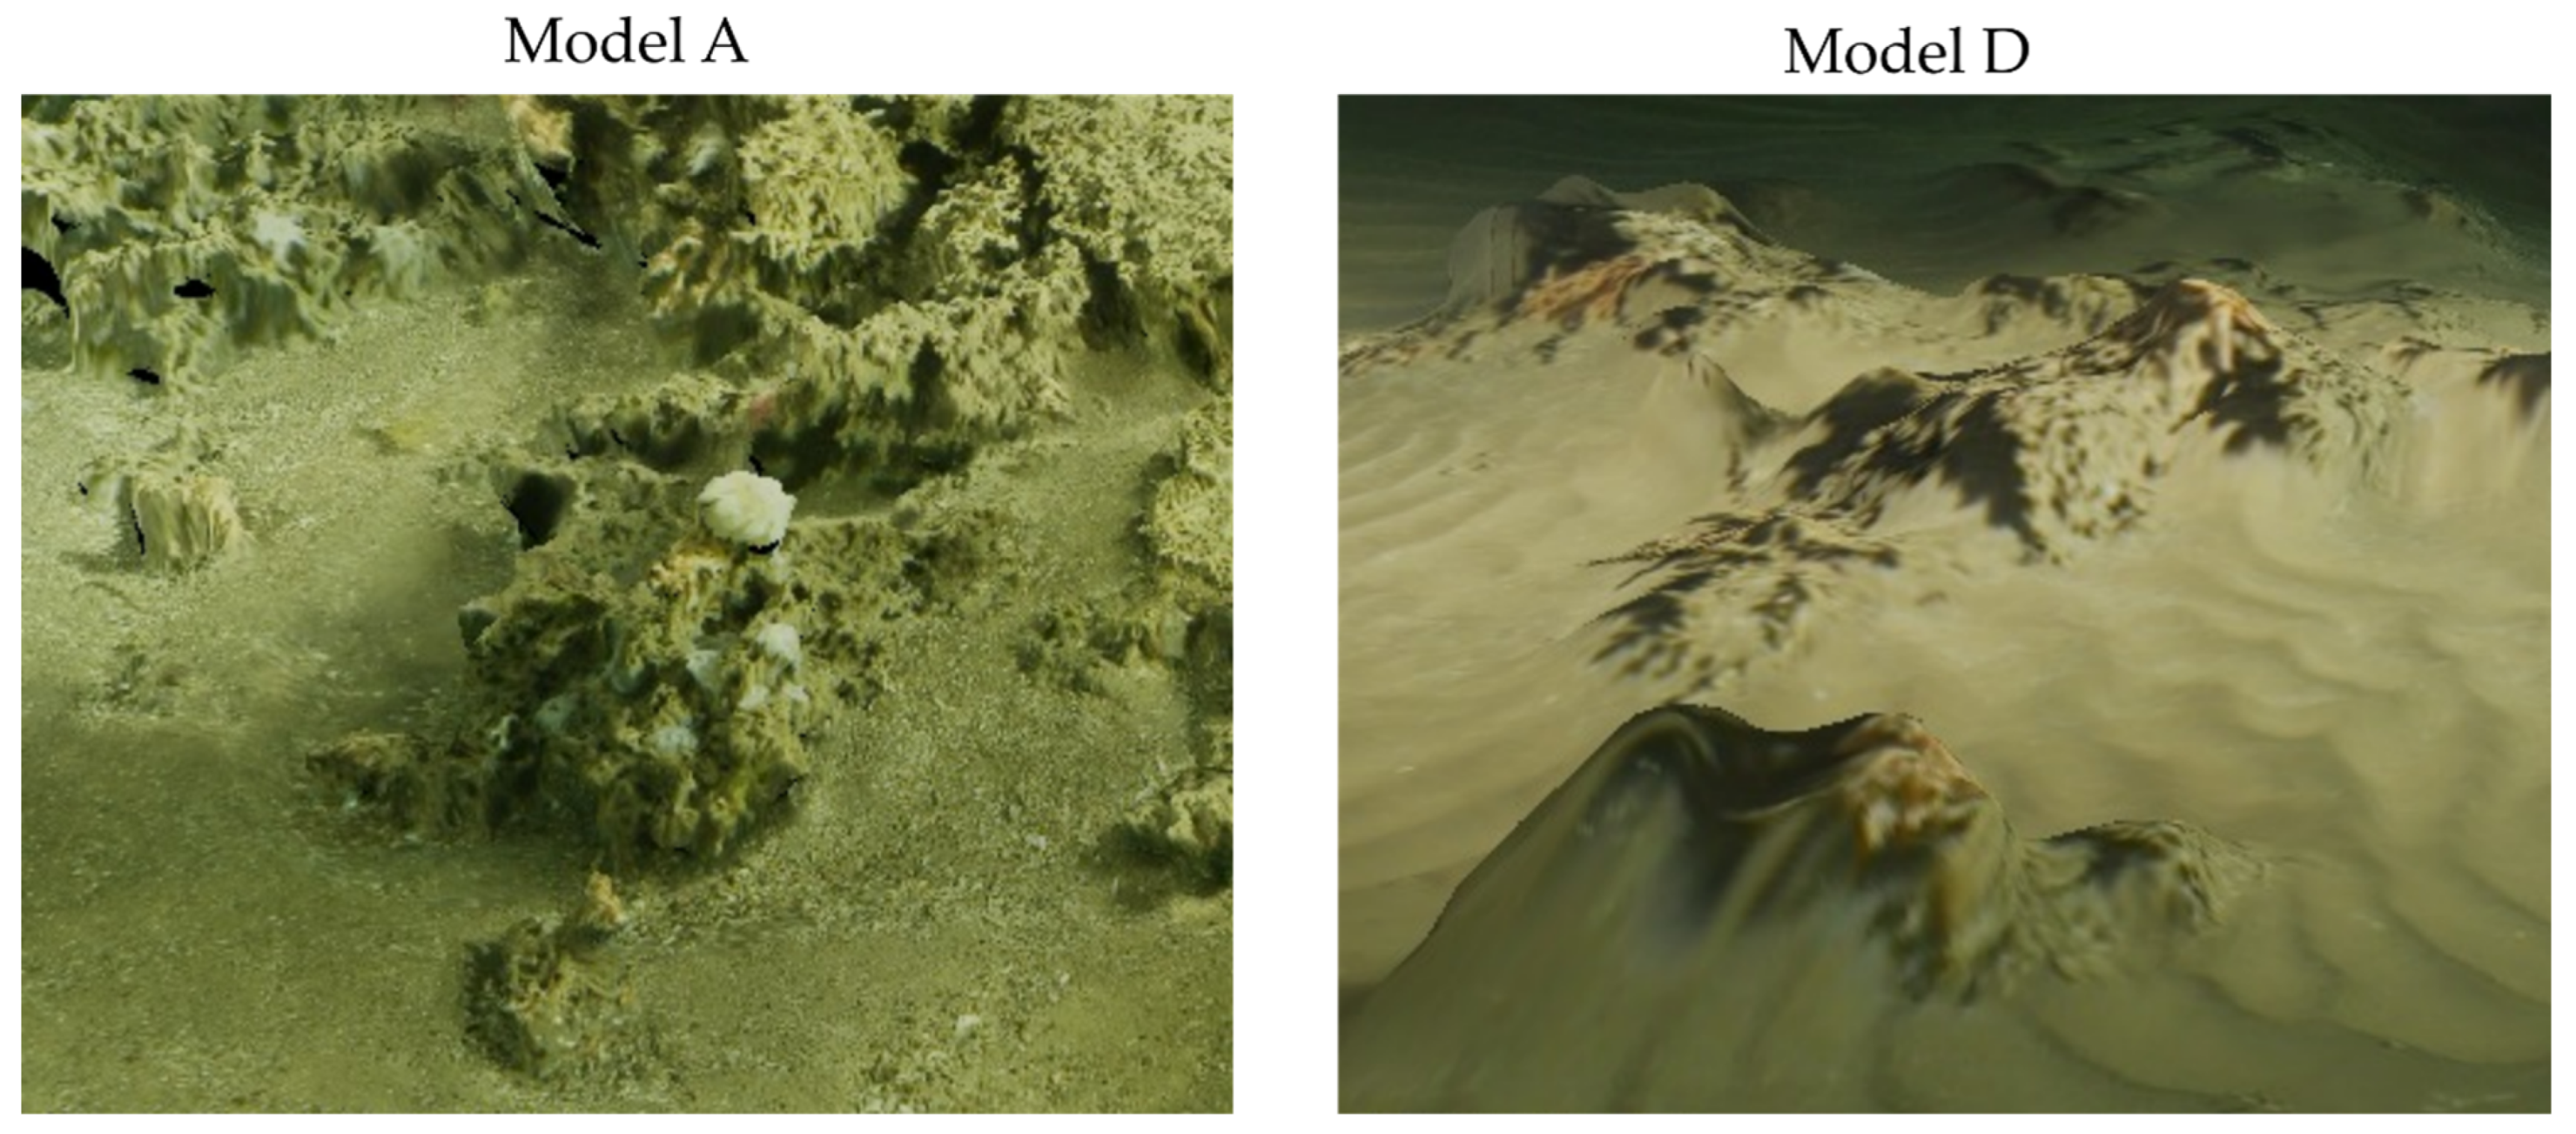
Model A
Model B
Model C
Model D
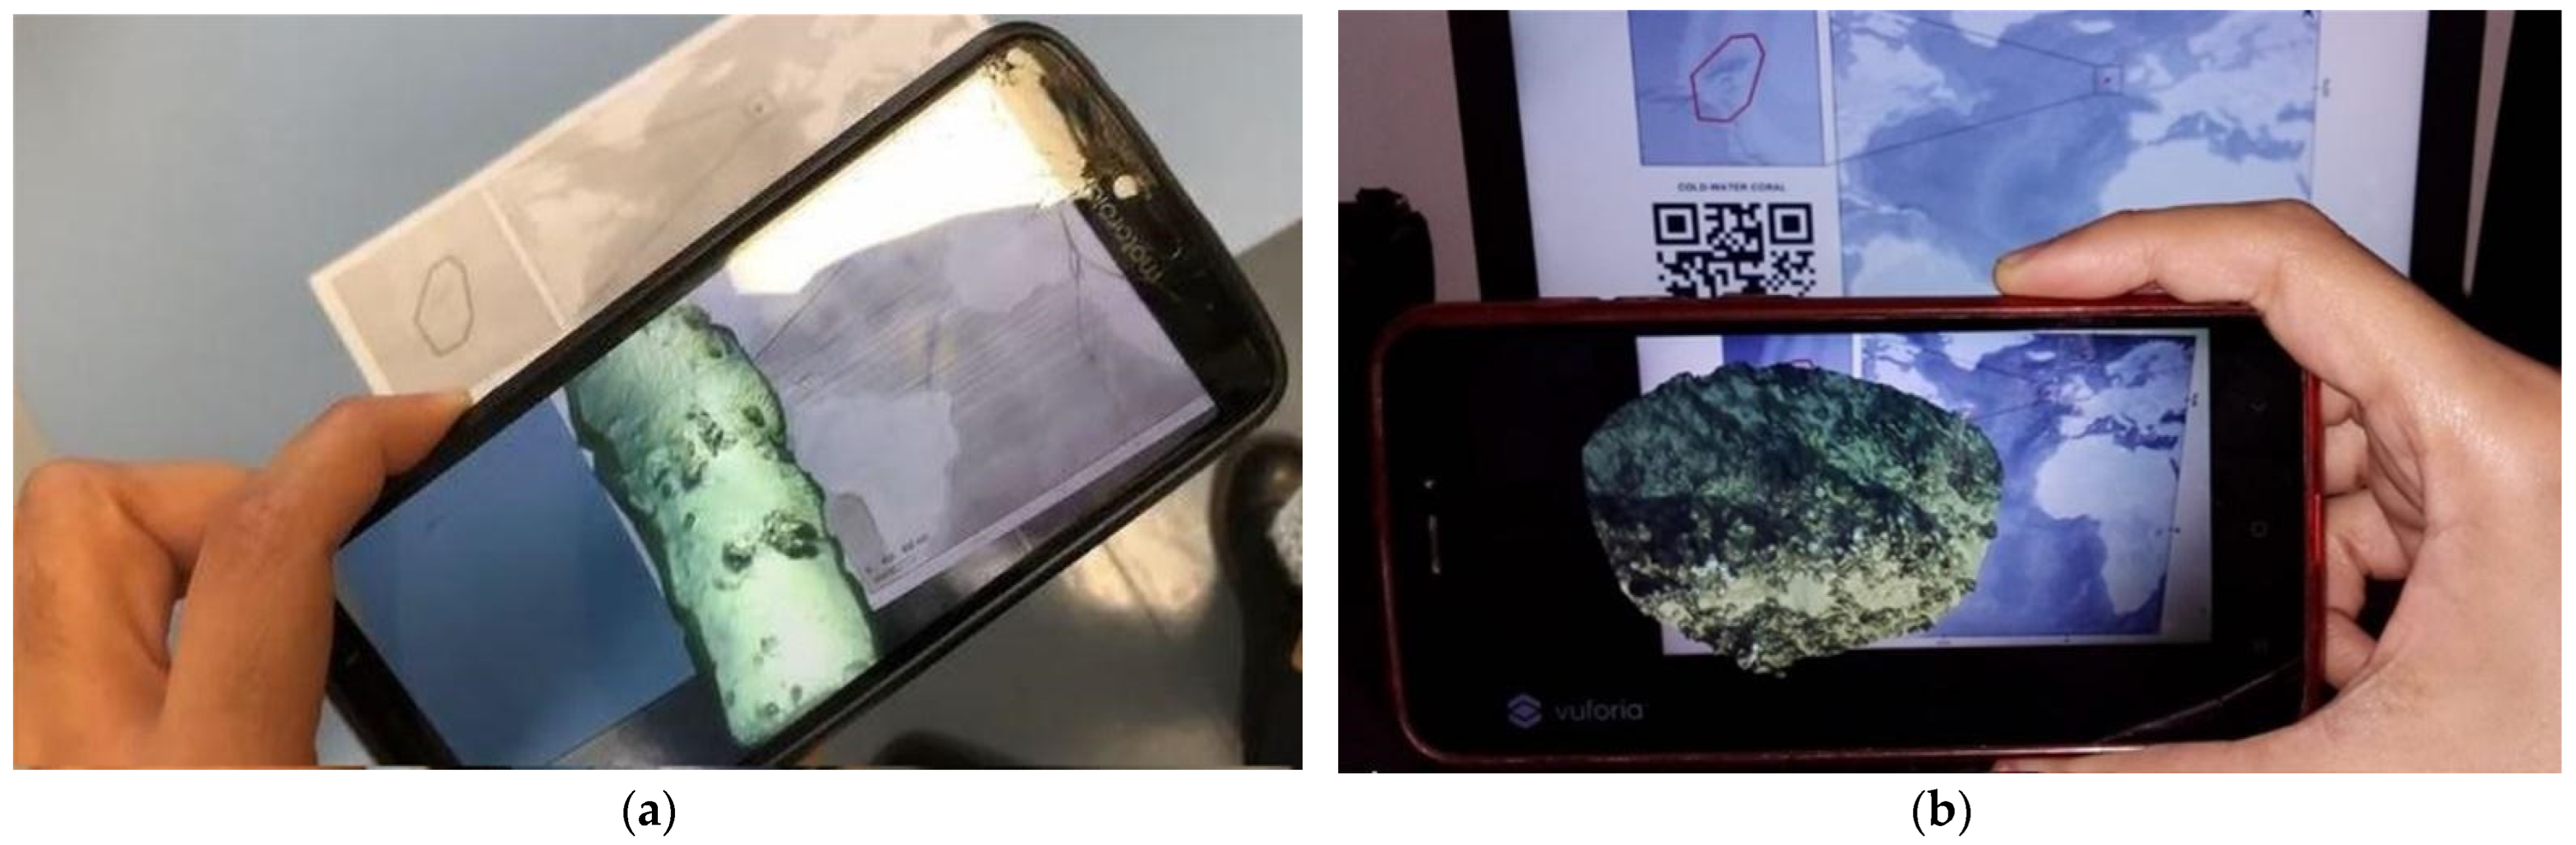
3.2. The Coral APP
4. Discussion
5. Conclusions
Author Contributions
Funding
Data Availability Statement
Acknowledgments
Conflicts of Interest
References
- Robert, K.; Huvenne, V.A.I.; Georgiopoulou, A.; Jones, D.O.B.; Marsh, L.; Carter, D.O.G.; Chaumillon, L. New Approaches to High-Resolution Mapping of Marine Vertical Structures. Sci. Rep. 2017, 7, 9005. [Google Scholar] [CrossRef] [PubMed]
- Conti, L.A.; Lim, A.; Wheeler, A.J. High Resolution Mapping of a Cold Water Coral Mound. Sci. Rep. 2019, 9, 1016. [Google Scholar] [CrossRef]
- Price, D.M.; Robert, K.; Callaway, A.; Lo lacono, C.; Hall, R.A.; Huvenne, V.A.I. Using 3D Photogrammetry from ROV Video to Quantify Cold-Water Coral Reef Structural Complexity and Investigate Its Influence on Biodiversity and Community Assemblage. Coral Reefs 2019, 38, 1007–1021. [Google Scholar] [CrossRef]
- Hebbeln, D.; da Costa Portilho-Ramos, R.; Wienberg, C.; Titschack, J. The Fate of Cold-Water Corals in a Changing World: A Geological Perspective. Front. Mar. Sci. 2019, 6, 119. [Google Scholar] [CrossRef]
- Hebbeln, D.; Wienberg, C.; Dullo, W.C.; Freiwald, A.; Mienis, F.; Orejas, C.; Titschack, J. Cold-Water Coral Reefs Thriving under Hypoxia. Coral Reefs 2020, 39, 853–859. [Google Scholar] [CrossRef]
- Henry, L.-A.; Roberts, J.M. Global Biodiversity in Cold-Water Coral Reef Ecosystems. In Marine Animal Forests; Springer International Publishing: Cham, Switzerland, 2016; pp. 1–21. [Google Scholar]
- Miller, R.J.; Hocevar, J.; Stone, R.P.; Fedorov, D.V. Structure-Forming Corals and Sponges and Their Use as Fish Habitat in Bering Sea Submarine Canyons. PLoS ONE 2012, 7, e33885. [Google Scholar] [CrossRef]
- Roberts, J.M.; Wheeler, A.J.; Freiwald, A. Reefs of the Deep: The Biology and Geology of Cold-Water Coral Ecosystems. Science 2006, 312, 543–547. [Google Scholar] [CrossRef]
- Wheeler, A.J.; Beyer, A.; Freiwald, A.; De Haas, H.; Huvenne, V.A.I.; Kozachenko, M.; Roy, O.L.; Opderbecke, J. Morphology and Environment of Cold-Water Coral Carbonate Mounds on the NW European Margin. Int. J. Earth Sci. 2007, 96, 37–56. [Google Scholar] [CrossRef]
- Aanesen, M.; Armstrong, C.; Czajkowski, M.; Falk-Petersen, J.; Hanley, N.; Navrud, S. Willingness to Pay for Unfamiliar Public Goods: Preserving Cold-Water Coral in Norway. Ecol. Econ. 2015, 112, 53–67. [Google Scholar] [CrossRef]
- Armstrong, C.W.; Foley, N.S.; Kahui, V.; Grehan, A. Cold Water Coral Reef Management from an Ecosystem Service Perspective. Mar. Policy 2014, 50, 126–134. [Google Scholar] [CrossRef]
- Miller, G.T.; Spoolman, S. Environmental Science; Cengage Learning: Boston, MA, USA, 2015; ISBN 1305090446. [Google Scholar]
- Lim, A.; Wheeler, A.J.; Conti, L. Cold-Water Coral Habitat Mapping: Trends and Developments in Acquisition and Processing Methods. Geosciences 2020, 11, 9. [Google Scholar] [CrossRef]
- van Oevelen, D.; Duineveld, G.; Lavaleye, M.; Mienis, F.; Soetaert, K.; Heip, C.H.R. The Cold-water Coral Community as Hotspot of Carbon Cycling on Continental Margins: A Food-web Analysis from Rockall Bank (Northeast Atlantic). Limnol. Oceanogr. 2009, 54, 1829–1844. [Google Scholar] [CrossRef]
- Danovaro, R.; Dell’Anno, A.; Pusceddu, A. Biodiversity Response to Climate Change in a Warm Deep Sea. Ecol. Lett. 2004, 7, 821–828. [Google Scholar] [CrossRef]
- Auster, P.J.; Gjerde, K.; Heupel, E.; Watling, L.; Grehan, A.; Rogers, A.D. Definition and Detection of Vulnerable Marine Ecosystems on the High Seas: Problems with the “Move-on” Rule. ICES J. Mar. Sci. 2011, 68, 254–264. [Google Scholar] [CrossRef]
- Fabri, M.-C.; Pedel, L.; Beuck, L.; Galgani, F.; Hebbeln, D.; Freiwald, A. Megafauna of Vulnerable Marine Ecosystems in French Mediterranean Submarine Canyons: Spatial Distribution and Anthropogenic Impacts. Deep Sea Res. Part II Top. Stud. Oceanogr. 2014, 104, 184–207. [Google Scholar] [CrossRef]
- Cathalot, C.; Van Oevelen, D.; Cox, T.J.S.; Kutti, T.; Lavaleye, M.; Duineveld, G.; Meysman, F.J.R. Cold-Water Coral Reefs and Adjacent Sponge Grounds: Hotspots of Benthic Respiration and Organic Carbon Cycling in the Deep Sea. Front. Mar. Sci. 2015, 2, 37. [Google Scholar] [CrossRef]
- Frank, N.; Freiwald, A.; López Correa, M.; Wienberg, C.; Eisele, M.; Hebbeln, D.; Van Rooij, D.; Henriet, J.P.; Colin, C.; van Weering, T.; et al. Northeastern Atlantic Cold-Water Coral Reefs and Climate. Geology 2011, 39, 743–746. [Google Scholar] [CrossRef]
- Roberts, J.M.; Cairns, S.D. Cold-Water Corals in a Changing Ocean. Curr. Opin. Environ. Sustain. 2014, 7, 118–126. [Google Scholar] [CrossRef]
- Turley, C.M.; Roberts, J.M.; Guinotte, J.M. Corals in Deep-Water: Will the Unseen Hand of Ocean Acidification Destroy Cold-Water Ecosystems? Coral Reefs 2007, 26, 445–448. [Google Scholar] [CrossRef]
- Huvenne, V.A.I.; Bett, B.J.; Masson, D.G.; Le Bas, T.P.; Wheeler, A.J. Effectiveness of a Deep-Sea Cold-Water Coral Marine Protected Area, Following Eight Years of Fisheries Closure. Biol. Conserv. 2016, 200, 60–69. [Google Scholar] [CrossRef] [Green Version]
- Althaus, F.; Williams, A.; Schlacher, T.A.; Kloser, R.J.; Green, M.A.; Barker, B.A.; Bax, N.J.; Brodie, P.; Schlacher-Hoenlinger, M.A. Impacts of Bottom Trawling on Deep-Coral Ecosystems of Seamounts Are Long-Lasting. Mar. Ecol. Prog. Ser. 2009, 397, 279–294. [Google Scholar] [CrossRef]
- Coughlan, M.; Wheeler, A.J.; Dorschel, B.; Lordan, C.; Boer, W.; Van Gaever, P.; De Haas, H.; Mörz, T. Record of Anthropogenic Impact on the Western Irish Sea Mud Belt. Anthropocene 2015, 9, 56–69. [Google Scholar] [CrossRef]
- Clark, M.R. Seamounts, Deep-Sea Corals and Fisheries: Vulnerability of Deep-Sea Corals to Fishing on Seamounts beyond Areas of National Jurisdiction; UNEP/Earthprint: Cambridge, UK, 2006; ISBN 978928072778-4. [Google Scholar]
- Davies, J.S.; Guillaumont, B.; Tempera, F.; Vertino, A.; Beuck, L.; Ólafsdóttir, S.H.; Smith, C.J.; Fosså, J.H.; van den Beld, I.M.J.; Savini, A.; et al. A New Classification Scheme of European Cold-Water Coral Habitats: Implications for Ecosystem-Based Management of the Deep Sea. Deep. Res. Part II Top. Stud. Oceanogr. 2017, 145, 102–109. [Google Scholar] [CrossRef]
- Liestoel, G. Augmented Reality Storytelling–Narrative Design and Reconstruction of a Historical Event in Situ. Int. J. Interact. Mob. Technol. 2019, 13, 196. [Google Scholar] [CrossRef]
- Chen, T.C.; Ku, K.C.; Ying, T.C. A Process-Based Collaborative Model of Marine Tourism Service System-The Case of Green Island Area, Taiwan. Ocean. Coast. Manag. 2012, 64, 37–46. [Google Scholar] [CrossRef]
- Barker, N.H.L.; Roberts, C.M. Scuba Diver Behaviour and the Management of Diving Impacts on Coral Reefs. Biol. Conserv. 2004, 120, 481–489. [Google Scholar] [CrossRef]
- Jameson, S.C.; Ammar, M.S.A.; Saadalla, E.; Mostafa, H.M.; Riegl, B. A Coral Damage Index and Its Application to Diving Sites in the Egyptian Red Sea. Coral Reefs 1999, 18, 333–339. [Google Scholar] [CrossRef]
- Sorice, M.G.; Oh, C.-O.; Ditton, R.B. Managing Scuba Divers to Meet Ecological Goals for Coral Reef Conservation. AMBIO A J. Hum. Environ. 2007, 36, 316–322. [Google Scholar] [CrossRef]
- Liestøl, G.; Bendon, M.; Hadjidaki-Marder, E. Augmented Reality Storytelling Submerged. Dry Diving to a World War II Wreck at Ancient Phalasarna, Crete. Heritage 2021, 4, 4647–4664. [Google Scholar] [CrossRef]
- Kwasnitschka, T.; Hansteen, T.H.; Devey, C.W.; Kutterolf, S. Doing Fieldwork on the Seafloor: Photogrammetric Techniques to Yield 3D Visual Models from ROV Video. Comput. Geosci. 2013, 52, 218–226. [Google Scholar] [CrossRef] [Green Version]
- De Clippele, L.H.; Gafeira, J.; Robert, K.; Hennige, S.; Lavaleye, M.S.; Duineveld, G.C.A.; Huvenne, V.A.I.; Roberts, J.M. Using Novel Acoustic and Visual Mapping Tools to Predict the Small-Scale Spatial Distribution of Live Biogenic Reef Framework in Cold-Water Coral Habitats. Coral Reefs 2017, 36, 255–268. [Google Scholar] [CrossRef] [PubMed]
- Lim, A.; Wheeler, A.J.; Price, D.M.; O’Reilly, L.; Harris, K.; Conti, L. Influence of Benthic Currents on Cold-Water Coral Habitats: A Combined Benthic Monitoring and 3D Photogrammetric Investigation. Sci. Rep. 2020, 10, 19433. [Google Scholar] [CrossRef] [PubMed]
- de Oliveira, L.M.C.; Lim, A.; Conti, L.A.; Wheeler, A.J. 3D Classification of Cold-Water Coral Reefs: A Comparison of Classification Techniques for 3D Reconstructions of Cold-Water Coral Reefs and Seabed. Front. Mar. Sci. 2021, 8, 640713. [Google Scholar] [CrossRef]
- Laranjeira, M.; Arnaubec, A.; Brignone, L.; Dune, C.; Opderbecke, J. 3D Perception and Augmented Reality Developments in Underwater Robotics for Ocean Sciences. Curr. Robot. Rep. 2020, 1, 123–130. [Google Scholar] [CrossRef]
- House, J.E.; Brambilla, V.; Bidaut, L.M.; Christie, A.P.; Pizarro, O.; Madin, J.S.; Dornelas, M. Moving to 3D: Relationships between Coral Planar Area, Surface Area and Volume. PeerJ 2018, 2018, e4280. [Google Scholar] [CrossRef] [PubMed]
- Cunliffe, A.M.; Brazier, R.E.; Anderson, K. Ultra-Fine Grain Landscape-Scale Quantification of Dryland Vegetation Structure with Drone-Acquired Structure-from-Motion Photogrammetry. Remote Sens. Environ. 2016, 183, 129–143. [Google Scholar] [CrossRef]
- Panagiotidis, D.; Surový, P.; Kuželka, K. Accuracy of Structure from Motion Models in Comparison with Terrestrial Laser Scanner for the Analysis of DBH and Height Influence on Error Behaviour. J. For. Sci. 2016, 62, 357–365. [Google Scholar] [CrossRef]
- Otero, V.; Van De Kerchove, R.; Satyanarayana, B.; Martínez-Espinosa, C.; Fisol, M.A.B.; Ibrahim, M.R.B.; Sulong, I.; Mohd-Lokman, H.; Lucas, R.; Dahdouh-Guebas, F. Managing Mangrove Forests from the Sky: Forest Inventory Using Field Data and Unmanned Aerial Vehicle (UAV) Imagery in the Matang Mangrove Forest Reserve, Peninsular Malaysia. For. Ecol. Manag. 2018, 411, 35–45. [Google Scholar] [CrossRef]
- Navarro, A.; Young, M.; Allan, B.; Carnell, P.; Macreadie, P.; Ierodiaconou, D. The Application of Unmanned Aerial Vehicles (UAVs) to Estimate above-Ground Biomass of Mangrove Ecosystems. Remote Sens. Environ. 2020, 242, 111747. [Google Scholar] [CrossRef]
- Warfield, A.D.; Leon, J.X. Estimating Mangrove Forest Volume Using Terrestrial Laser Scanning and UAV-Derived Structure-from-Motion. Drones 2019, 3, 32. [Google Scholar] [CrossRef] [Green Version]
- Weidner, L.; Walton, G.; Krajnovich, A. Classifying Rock Slope Materials in Photogrammetric Point Clouds Using Robust Color and Geometric Features. ISPRS J. Photogramm. Remote Sens. 2021, 176, 15–29. [Google Scholar] [CrossRef]
- Smith, M.W.; Carrivick, J.L.; Quincey, D.J. Structure from Motion Photogrammetry in Physical Geography. Prog. Phys. Geogr. 2016, 40, 247–275. [Google Scholar] [CrossRef]
- Li, R.; Li, H.; Zou, W.; Smith, R.G.; Curran, T.A. Quantitative Photogrammetric Analysis of Digital Underwater Video Imagery. IEEE J. Ocean. Eng. 1997, 22, 364–375. [Google Scholar] [CrossRef]
- Burns; Delparte, D.; Gates, R.D.; Takabayashi, M. Integrating Structure-from-Motion Photogrammetry with Geospatial Software as a Novel Technique for Quantifying 3D Ecological Characteristics of Coral Reefs. PeerJ 2015, 2015, e1077. [Google Scholar] [CrossRef] [PubMed]
- Burns; Fukunaga, A.; Pascoe, K.H.; Runyan, A.; Craig, B.K.; Talbot, J.; Pugh, A.; Kosaki, R.K. 3D Habitat Complexity of Coral Reefs in the Northwestern Hawaiian Islands Is Driven by Coral Assemblage Structure. ISPRS Ann. Photogramm. Remote Sens. Spat. Inf. Sci. 2019, 42, 61–67. [Google Scholar] [CrossRef]
- Anelli, M.; Julitta, T.; Fallati, L.; Galli, P.; Rossini, M.; Colombo, R. Towards New Applications of Underwater Photogrammetry for Investigating Coral Reef Morphology and Habitat Complexity in the Myeik Archipelago, Myanmar. Geocarto Int. 2019, 34, 459–472. [Google Scholar] [CrossRef]
- Storlazzi, C.D.; Dartnell, P.; Hatcher, G.A.; Gibbs, A.E. End of the Chain? Rugosity and Fine-Scale Bathymetry from Existing Underwater Digital Imagery Using Structure-from-Motion (SfM) Technology. Coral Reefs 2016, 35, 889–894. [Google Scholar] [CrossRef]
- Carrivick, J.L.; Smith, M.W.; Quincey, D.J. Structure from Motion in the Geosciences; John Wiley & Sons, Ltd.: Chichester, UK, 2016; ISBN 9781118895818. [Google Scholar]
- Foucault, M.; Miskowiec, J. Of Other Spaces. Diacritics 1986, 16, 22–27. [Google Scholar] [CrossRef]
- Lowe, G. Sift-the Scale Invariant Feature Transform. Int. J. 2004, 2, 2. [Google Scholar]
- Čejka, J.; Zsíros, A.; Liarokapis, F. A Hybrid Augmented Reality Guide for Underwater Cultural Heritage Sites. Pers. Ubiquitous Comput. 2020, 24, 815–828. [Google Scholar] [CrossRef]
- Bruno, F.; Barbieri, L.; Mangeruga, M.; Cozza, M.; Lagudi, A.; Čejka, J.; Liarokapis, F.; Skarlatos, D. Underwater Augmented Reality for Improving the Diving Experience in Submerged Archaeological Sites. Ocean Eng. 2019, 190, 106487. [Google Scholar] [CrossRef]
- Loureiro, S.M.C.; Guerreiro, J.; Ali, F. 20 Years of Research on Virtual Reality and Augmented Reality in Tourism Context: A Text-Mining Approach. Tour. Manag. 2020, 77, 104028. [Google Scholar] [CrossRef]
- Cristobal, F.R.; Dodge, M.; Noll, B.; Rosenberg, N.; Burns, J.; Sanchez, J.; Gotshalk, D.; Pascoe, K.; Runyan, A. Exploration of Coral Reefs in Hawai‘i through Virtual Reality: Hawaiian Coral Reef Museum VR. In Practice and Experience in Advanced Research Computing; ACM: New York, NY, USA, 2020; pp. 545–546. [Google Scholar]
- Barrile, V.; Fotia, A.; Bernardo, E. The Submerged Heritage: A Virtual Journey in Our. Int. Arch. Photogramm. Remote Sens. Spat. Inf. Sci. 2019, XLII-2/W10, 17–24. [Google Scholar] [CrossRef]
- Han, X.; Liu, J.; Tan, B.; Duan, L. Design and Implementation of Smart Ocean Visualization System Based on Extended Reality Technology. J. Web Eng. 2021, 20, 557–574. [Google Scholar] [CrossRef]
- Markowitz, D.M.; Laha, R.; Perone, B.P.; Pea, R.D.; Bailenson, J.N. Immersive Virtual Reality Field Trips Facilitate Learning About Climate Change. Front. Psychol. 2018, 9, 2364. [Google Scholar] [CrossRef]
- Monteiro, J.H.F.; Montanha, G.K. Desenvolvimento de Aplicação Em Realidade Virtual. Tekhne Logos 2019, 10, 99–111. [Google Scholar]
- Bimber, O.; Raskar, R. Spatial Augmented Reality: Merging Real and Virtual Worlds; CRC Press: New York, NY, USA, 2005; ISBN 1439864942. [Google Scholar]
- Kaufmann, H. Collaborative Augmented Reality in Education. Inst. Softw. Technol. Interact. Syst. Vienna Univ. Technol. 2003, 2–4. [Google Scholar]
- Scholz, J.; Smith, A.N. Augmented Reality: Designing Immersive Experiences That Maximize Consumer Engagement. Bus. Horiz. 2016, 59, 149–161. [Google Scholar] [CrossRef]
- Borba, E.Z. Imersão Visual e Corporal: Paradigmas Da Percepção Em Simuladores. Narrat. Comun. Complexificadas II–A Forma. SantaCruz do Sul Edunisc 2014, 239–256. [Google Scholar]
- Lee, K. Augmented Reality in Education and Training. TechTrends 2012, 56, 13–21. [Google Scholar] [CrossRef]
- Arena, F.; Collotta, M.; Pau, G.; Termine, F. An Overview of Augmented Reality. Computers 2022, 11, 28. [Google Scholar] [CrossRef]
- Carmigniani, J.; Furht, B. Augmented Reality: An Overview. Handb. Augment. Real. 2011, 3–46. [Google Scholar]
- Billinghurst, M.; Duenser, A. Augmented Reality in the Classroom. Computer 2012, 45, 56–63. [Google Scholar] [CrossRef]
- Cipresso, P.; Giglioli, I.A.C.; Raya, M.A.; Riva, G. The Past, Present, and Future of Virtual and Augmented Reality Research: A Network and Cluster Analysis of the Literature. Front. Psychol. 2018, 9. [Google Scholar] [CrossRef] [PubMed]
- Dunleavy, M.; Dede, C.; Mitchell, R. Affordances and Limitations of Immersive Participatory Augmented Reality Simulations for Teaching and Learning. J. Sci. Educ. Technol. 2009, 18, 7–22. [Google Scholar] [CrossRef]
- Feiner, S.; MacIntyre, B.; Seligmann, D. Knowledge-Based Augmented Reality. Commun. ACM 1993, 36, 53–62. [Google Scholar] [CrossRef]
- Fernández-Batanero, J.M.; Montenegro-Rueda, M.; Fernández-Cerero, J. Use of Augmented Reality for Students with Educational Needs: A Systematic Review (2016–2021). Societies 2022, 12, 36. [Google Scholar] [CrossRef]
- Labster Reimagining the Future of Education. Available online: https://www.labster.com (accessed on 15 March 2022).
- ClassVR Student Wearing ClassVR Headset Virtual Reality for Schools. Available online: https://www.classvr.com/ (accessed on 9 August 2022).
- Denoyel, A.; Pinson, C.; Passet, P.A. Sketchfab-The Best 3D Viewer on the Web. Available online: https://sketchfab.com/ (accessed on 15 September 2022).
- VRgeoscience Digital Outcrop Modelling. Available online: https://www.vrgeoscience.com/ (accessed on 15 March 2022).
- Rizvic, S.; Boskovic, D.; Okanovic, V.; Sljivo, S.; Zukic, M. Interactive Digital Storytelling: Bringing Cultural Heritage in a Classroom. J. Comput. Educ. 2019, 6, 143–166. [Google Scholar] [CrossRef]
- Doležal, M.; Vlachos, M.; Secci, M.; Demesticha, S.; Skarlatos, D.; Liarokapis, F. Understanding Underwater Photogrammetry for Maritime Archaeology Through Immersive Virtual Reality. ISPRS Ann. Photogramm. Remote Sens. Spat. Inf. Sci. 2019, 42, 85–91. [Google Scholar] [CrossRef]
- I-MareCulture–H2020 Funded EU Research and Innovation Project. Available online: https://imareculture.eu/ (accessed on 15 September 2022).
- Shelton, B.E.; Hedley, N.R. Exploring a Cognitive Basis for Learning Spatial Relationships with Augmented Reality. Technol. Instr. Cogn. Learn. 2004, 1, 323. [Google Scholar]
- Sotiriou, S.; Bogner, F.X. Visualizing the Invisible: Augmented Reality as an Innovative Science Education Scheme. Adv. Sci. Lett. 2008, 1, 114–122. [Google Scholar] [CrossRef]
- Boolukos, C.M.; Lim, A.; O’Riordan, R.M.; Wheeler, A.J. Cold-Water Corals in Decline–A Temporal (4 Year) Species Abundance and Biodiversity Appraisal of Complete Photomosaiced Cold-Water Coral Reef on the Irish Margin. Deep Sea Res. Part I Oceanogr. Res. Pap. 2019, 146, 44–54. [Google Scholar] [CrossRef]
- European Union Habitats Directive. European Union Habitats (Porcupine Bank Canyon Special Area of Conservation 003001) Regulations; Irish Statute Book: Dublin, Ireland, 2016. [Google Scholar]
- Wheeler, A.J.; Kozachenko, M.; Beyer, A.; Foubert, A.; Huvenne, V.A.I.; Klages, M.; Masson, D.G.; Olu-Le Roy, K.; Thiede, J. Sedimentary Processes and Carbonate Mounds in the Belgica Mound Province, Porcupine Seabight, NE Atlantic. In Cold-Water Corals and Ecosystems; Springer: Berlin/Heidelberg, Germany, 2005; pp. 571–603. [Google Scholar]
- Lim, A.; Wheeler, A.J.; Arnaubec, A. High-Resolution Facies Zonation within a Cold-Water Coral Mound: The Case of the Piddington Mound, Porcupine Seabight, NE Atlantic. Mar. Geol. 2017, 390, 120–130. [Google Scholar] [CrossRef]
- Addamo, A.M.; Vertino, A.; Stolarski, J.; Garc\’\ia-Jiménez, R.; Taviani, M.; Machordom, A. Merging Scleractinian Genera: The Overwhelming Genetic Similarity between Solitary Desmophyllum and Colonial Lophelia. BMC Evol. Biol 2016, 16, 1–17. [Google Scholar]
- De Mol, B.; Van Rensbergen, P.; Pillen, S.; Van Herreweghe, K.; Van Rooij, D.; McDonnell, A.; Huvenne, V.; Ivanov, M.; Swennen, R.; Henriet, J. Large Deep-Water Coral Banks in the Porcupine Basin, Southwest of Ireland. Mar. Geol. 2002, 188, 193–231. [Google Scholar] [CrossRef]
- Lim, A.; Huvenne, V.A.I.; Vertino, A.; Spezzaferri, S.; Wheeler, A.J. New Insights on Coral Mound Development from Groundtruthed High-Resolution ROV-Mounted Multibeam Imaging. Mar. Geol. 2018, 403, 225–237. [Google Scholar] [CrossRef]
- Dorschel, B.; Hebbeln, D.; Foubert, A.; White, M.; Wheeler, A.J. Hydrodynamics and Cold-Water Coral Facies Distribution Related to Recent Sedimentary Processes at Galway Mound West of Ireland. Mar. Geol. 2007, 244, 184–195. [Google Scholar] [CrossRef]
- Foubert, A.; Huvenne, V.A.I.; Wheeler, A.; Kozachenko, M.; Opderbecke, J.; Henriet, J.-P. The Moira Mounds, Small Cold-Water Coral Mounds in the Porcupine Seabight, NE Atlantic: Part B---Evaluating the Impact of Sediment Dynamics through High-Resolution ROV-Borne Bathymetric Mapping. Mar. Geol. 2011, 282, 65–78. [Google Scholar] [CrossRef]
- Lim, A.; O’Reilly, L.; Summer, G.; de Oliveira, L.M.C.; Strachan, R. CE20011-Systematic Monitoring Survey of the Moira Mound Chain (SyMonS_MoM); University College Cork: Cork, Ireland, 2020; Available online: https://www.ucc.ie/en/media/research/marinegeo/mgpdfs/SyMonS_MoM__CE20011_Cruise_Report.pdf (accessed on 15 August 2021).
- Agisoft Agisoft Metashape User Manual: Professional Edition, Version 1.7; Agisoft LLC: St. Petersburg, Russia, 2021; p. 160.
- Unity Technologies Real-Time Solutions. Endless Opportunities. Available online: https://unity.com/ (accessed on 20 August 2021).
- Vuforia Vuforia Engine. Available online: https://developer.vuforia.com/ (accessed on 20 August 2021).
- Microsoft Android Studio | Android Developers. Available online: https://developer.android.com/studio (accessed on 15 August 2021).
- Cieza, E.; Lujan, D. Educational Mobile Application of Augmented Reality Based on Markers to Improve the Learning of Vowel Usage and Numbers for Children of a Kindergarten in Trujillo. Procedia Comput. Sci. 2018, 130, 352–358. [Google Scholar] [CrossRef]
- Liu, X.; Sohn, Y.-H.; Park, D.-W. Application Development with Augmented Reality Technique Using Unity 3D and Vuforia. Int. J. Appl. Eng. Res. 2018, 13, 15068–15071. [Google Scholar]
- Leon, J.X.; Roelfsema, C.M.; Saunders, M.I.; Phinn, S.R. Measuring Coral Reef Terrain Roughness Using ‘Structure-from-Motion’ Close-Range Photogrammetry. Geomorphology 2015, 242, 21–28. [Google Scholar] [CrossRef]
- Mienis, F.; Bouma, T.; Witbaard, R.; van Oevelen, D.; Duineveld, G. Experimental Assessment of the Effects of Coldwater Coral Patches on Water Flow. Mar. Ecol. Prog. Ser. 2019, 609, 101–117. [Google Scholar] [CrossRef]
- McKinnon, D.; He, H.; Upcroft, B.; Smith, R.N. Towards Automated and In-Situ, near-Real Time 3-D Reconstruction of Coral Reef Environments. In Proceedings of the OCEANS’11 MTS/IEEE KONA, Waikoloa, HI, USA, 19–22 September 2011. [Google Scholar] [CrossRef]
- Roberts, S.; Hirshfield, M. Deep-Sea Corals: Out of Sight, but No Longer out of Mind. Front. Ecol. Environ. 2004, 2, 123–130. [Google Scholar] [CrossRef]
- Pizarro, O.; Friedman, A.; Bryson, M.; Williams, S.B.; Madin, J. A Simple, Fast, and Repeatable Survey Method for Underwater Visual 3D Benthic Mapping and Monitoring. Ecol. Evol. 2017, 7, 1770–1782. [Google Scholar] [CrossRef]
- Buchner, J.; Buntins, K.; Kerres, M. The Impact of Augmented Reality on Cognitive Load and Performance: A Systematic Review. J. Comput. Assist. Learn. 2022, 38, 285–303. [Google Scholar] [CrossRef]
- Kasinathan, V.; Al-Sharafi, A.T.A.; Zamnah, A.; Appadurai, N.K.; Thiruchelvam, V.; Mustapha, A. Augmented Reality in Ocean’s Secrets: Educational Application with Attached Book for Students. Linguist. Cult. Rev. 2021, 5, 1123–1137. [Google Scholar] [CrossRef]
- Cimperman, R. UAT Defined: A Guide to Practical User Acceptance Testing (Digital Short Cut); Pearson Education: London, UK, 2006; ISBN 0132702622. [Google Scholar]
- Jung, T.H.; Lee, H.; Chung, N.; tom Dieck, M.C. Cross-Cultural Differences in Adopting Mobile Augmented Reality at Cultural Heritage Tourism Sites. Int. J. Contemp. Hosp. Manag. 2018, 30, 1621–1645. [Google Scholar] [CrossRef]


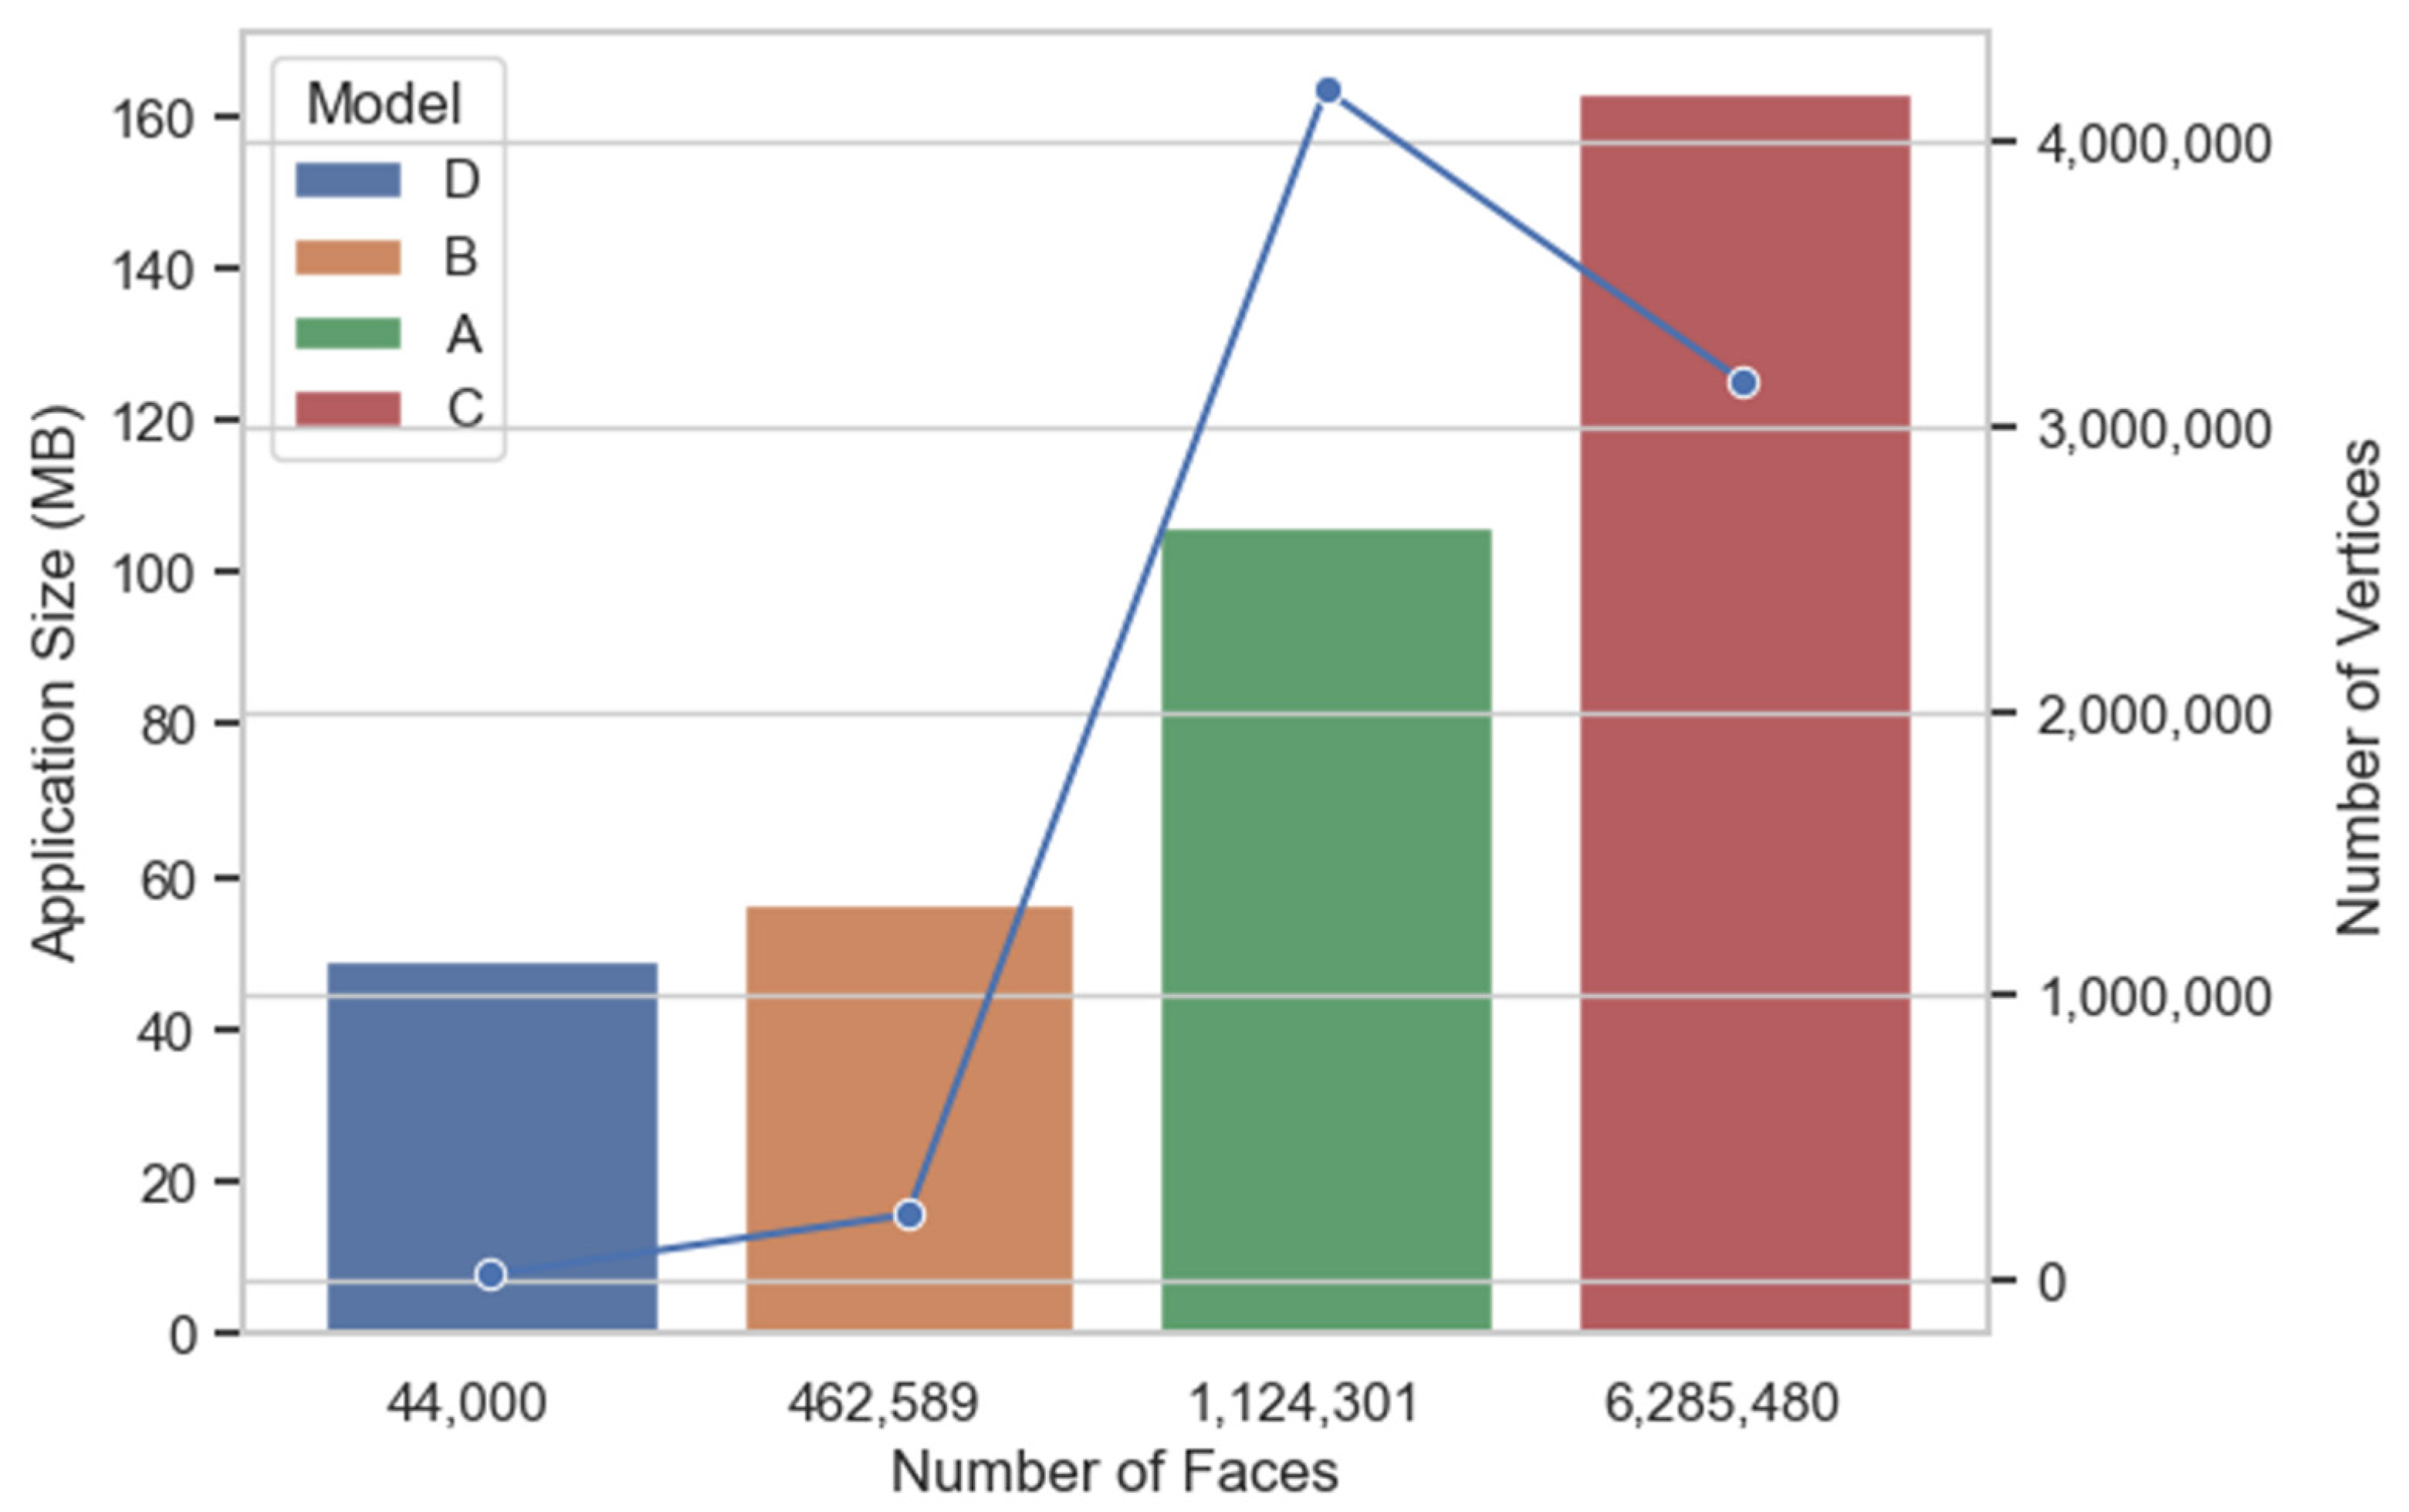
| 3D Model Name | Number of Faces | Number of Vertices | Area (m2) | Resolution (Number of Faces/Area (m2) | Texture Size (Pixels) | Total Number of Frames | Scale Error (m) | Android Application Size (MB) |
|---|---|---|---|---|---|---|---|---|
| A | 1,124,301 | 4,177,311 | 3.776 | 297,749.21 | 4096 × 4096 | 613 | 0.07513 | 106 |
| B | 462,589 | 232,453 | 14.535 | 31,825.87 | 4096 × 4096 | 1122 | 0.05767 | 56.5 |
| C | 6,285,480 | 3,154,610 | 21.477 | 292,660.99 | 4096 × 4096 | 613 | 0.038187 | 163 |
| D | 44,000 | 22,122 | 10.71 | 4108.31 | 4096 × 4097 | 1159 | 0.07513 | 49.3 |
Publisher’s Note: MDPI stays neutral with regard to jurisdictional claims in published maps and institutional affiliations. |
© 2022 by the authors. Licensee MDPI, Basel, Switzerland. This article is an open access article distributed under the terms and conditions of the Creative Commons Attribution (CC BY) license (https://creativecommons.org/licenses/by/4.0/).
Share and Cite
de Oliveira, L.M.C.; Oliveira, P.A.d.; Lim, A.; Wheeler, A.J.; Conti, L.A. Developing Mobile Applications with Augmented Reality and 3D Photogrammetry for Visualisation of Cold-Water Coral Reefs and Deep-Water Habitats. Geosciences 2022, 12, 356. https://doi.org/10.3390/geosciences12100356
de Oliveira LMC, Oliveira PAd, Lim A, Wheeler AJ, Conti LA. Developing Mobile Applications with Augmented Reality and 3D Photogrammetry for Visualisation of Cold-Water Coral Reefs and Deep-Water Habitats. Geosciences. 2022; 12(10):356. https://doi.org/10.3390/geosciences12100356
Chicago/Turabian Stylede Oliveira, Larissa Macedo Cruz, Priscila Almeida de Oliveira, Aaron Lim, Andrew J. Wheeler, and Luis Americo Conti. 2022. "Developing Mobile Applications with Augmented Reality and 3D Photogrammetry for Visualisation of Cold-Water Coral Reefs and Deep-Water Habitats" Geosciences 12, no. 10: 356. https://doi.org/10.3390/geosciences12100356