Article

Probiotic Lactobacillus Paracasei Expressing a Nucleic Acid-Hydrolyzing Minibody (3D8 Scfv) Enhances Probiotic Activities in Mice Intestine as Revealed by Metagenomic Analyses

1
Department of Genetic Engineering, Sungkyunkwan University, 2066, Seobu-ro, Jangan-gu, Suwon 16419, Korea
2
Animal Biotechnology Division, National Institute of Animal Science (NIAS), Rural Development Administration (RDA), 1500, Kongjwipatjwi-ro, Iseomyeon, Wanju 55365, Korea
3
Research Institute of Agriculture and Life Sciences, College of Agriculture and Life Sciences, Seoul National University, 1, Gwanak-ro, Gwanak-gu, Seoul 08826, Korea
*
Authors to whom correspondence should be addressed.
Present address: Department of Microbiology, College of Medicine, Korea University, 73, Inchon-ro, Seoul 08826, Korea.
Genes 2018, 9(6), 276; https://doi.org/10.3390/genes9060276
Submission received: 8 March 2018 / Revised: 17 May 2018 / Accepted: 17 May 2018 / Published: 29 May 2018
(This article belongs to the Section Microbial Genetics and Genomics)

Abstract

:
Probiotics are well known for their beneficial effects for animals, including humans and livestock. Here, we tested the probiotic activity of Lactobacillus paracasei expressing 3D8 scFv, a nucleic acid-hydrolyzing mini-antibody, in mice intestine. A total of 18 fecal samples derived from three different conditions at two different time points were subjected to high-throughput 16S ribosomal RNA (rRNA) metagenomic analyses. Bioinformatic analyses identified an average of 290 operational taxonomic units. After administration of L. paracasei, populations of the probiotics L. paracasei, Lactobacillus reuteri, and Pediococcus acidilactici increased, whereas the population of harmful bacteria such as Helicobacter species decreased. Furthermore, continuous administration of L. paracasei resulted in L. paracasei emerging as the dominant probiotic after competition with other existing probiotics. Expression of 3D8 scFv protein specifically increased the population of P. acidilactici, which is another probiotic. In summary, our results showed that L. paracasei expressing 3D8 scFv protein enhanced probiotic activity in mice intestine with no observable side effects. Thus, the system developed in this study may be a good tool for the expression of recombinant protein using probiotics.

1. Introduction

The microbiota in the gastrointestinal (GI) tracts of mammals are complex, and their composition can be influenced by several factors, including diets and environmental changes. Among known microbiota in the GI tracts, some bacteria species are regarded as probiotics, which can be defined as microorganisms providing beneficial effects when consumed by humans and animals [1]. Of known probiotics, many members of Lactobacillus spp. are consumed as health supplementary foods [2] and are used in the food fermentation industry to ferment cereals inhibiting pathogenic bacteria [3]. Lactobacillus are gram-positive bacteria with a rod-like shape that participate in glucose fermentation resulting in the production of lactic acid as well as small amounts of acetic and succinic acids [4]. Lactobacillus usually inhabits the mouth and GI tract [5]. In particular, the GI tracts of diverse mammals are preferentially colonized by Lactobacillus spp. such as Lactobacillus brevis, Lactobacillus casei, Lactobacillus acidophilus, Lactobacillus plantarum, Lactobacillus fermentum, and Lactobacillus salivariu [6]. To date, more than 70 different species of Lactobacillus have been identified.
The 3D8 single-chain variable fragment referred as 3D8 scFv is a nucleic acid hydrolyzing mini-antibody without sequence specificity [7]. The 3D8 scFv protein that was purified from Escherichia coli was subsequently shown to penetrate the cytosol of HeLa cells via caveolae-mediated endocytosis. Previous studies demonstrated that 3D8 scFv exhibits antiviral effects against a broad range of viruses, including the herpes simplex virus (HSV), pseudorabies virus (PRV), classical swine fever virus (CSFV), murine norovirus (MNV) and H1N1 influenza virus in various hosts [8,9,10,11]. Therefore, it is clear that 3D8 scFv engages in direct antiviral activities against various DNA and RNA viruses by penetrating into cells and directly hydrolyzing the viral genome based on previous findings. In addition, a previous study has shown that Lactobacillus paracasei expressing 3D8 scFV can be used as a preventive probiotic against norovirus infection [8]. In order to use L. paracasei expressing 3D8 scFV as a preventive probiotic, it is necessary to examine the possible impact of L. paracasei expressing 3D8 scFV in microbiota of the GI tracts. Because nothing is known about whether L. paracasei expressing 3D8 scFV will be beneficial or harmful to other microbiota. For this reason, metagenomics might be a good approach.
The rapid development of next-generation sequencing (NGS) has promoted studies associated with metagenomics, which reveals the composition of living microorganisms in a wide range of environmental samples [12]. In the case of bacteria, amplification of a partial 16S ribosomal RNA (rRNA) gene sequence followed by NGS is widely used as a culture-independent microbiological method. NGS-based 16S rRNA target sequencing allows identification of numerous bacteria species present in the intestine of animals. For example, it is estimated that there are approximately 40,000 bacterial species in the gastrointestinal microbiome of humans [13], and a recent study generated a reference mouse gut metagenome derived from fecal samples of 184 mice with different genetic backgrounds revealing 541 bacteria species [14]. Of known NGS systems, many previous studies used the FLX 454 system (454 Life Sciences, Branford, Connecticut, US), which produces long length sequence reads [15], whereas recent studies preferentially adopted the MiSeq system (Illumina, San Diego, California, US), which can produce reads up to 300 bases in length for 16S rRNA target sequencing [16].
In this study, we carried out high-throughput 16S rRNA metagenomic analyses to investigate the effects of the probiotic L. paracasei ATCC334 expressing 3D8 scFv in microbiota of the mouse intestine. A total of 18 fecal samples derived from three different conditions at two different time points were subjected to high-throughput 16S rRNA metagenomic analyses. Our results showed that L. paracasei expressing 3D8 scFv promoted probiotic activity in the mouse intestine.

2. Methods

2.1. Animals and Bacteria

Six-week-old female specific pathogen-free (SPF) BALB/c mice (Orient Bio Laboratories, Seongnam, Korea) weighing 18–20 g were housed under standard laboratory conditions. All animal procedures performed in this study were reviewed, approved, and supervised by the Institutional Animal Care and Use Committee (IACUC) of Kunkuk University (Ethical code: KU16080) and all experimental procedures performed here were in accordance with the guidelines of the Institute of Laboratory Animal Resources (ILAR). L. paracasei ATCC 334 was kindly provided by Dr. Jos Seegers (Falcobio, Lieden, Netherland). Wildtype (WT) L. paracasei and transgenic (TG) L. paracasei were anaerobically cultured in antibiotic-free de Man, Rogosa, and Sharpe (MRS) media and MRS media supplemented with 3 μg/mL chloramphenicol, respectively.

2.2. Construction of a Vector Expressing Recombinant Protein and Transformation

A pSLP111.3 vector for expression in Lactobacillus (provided by Dr. Jos Seegers) was modified to replace the xylose-inducible promoter with a lactate dehydrogenase (LDH) constitutive promoter [17]. Codon-optimized 3D8 scFv was chemically synthesized (IDT, Coralville, IA, USA). Cloning of the 3D8 scFv gene into L. paracasei was performed as previously described [8].

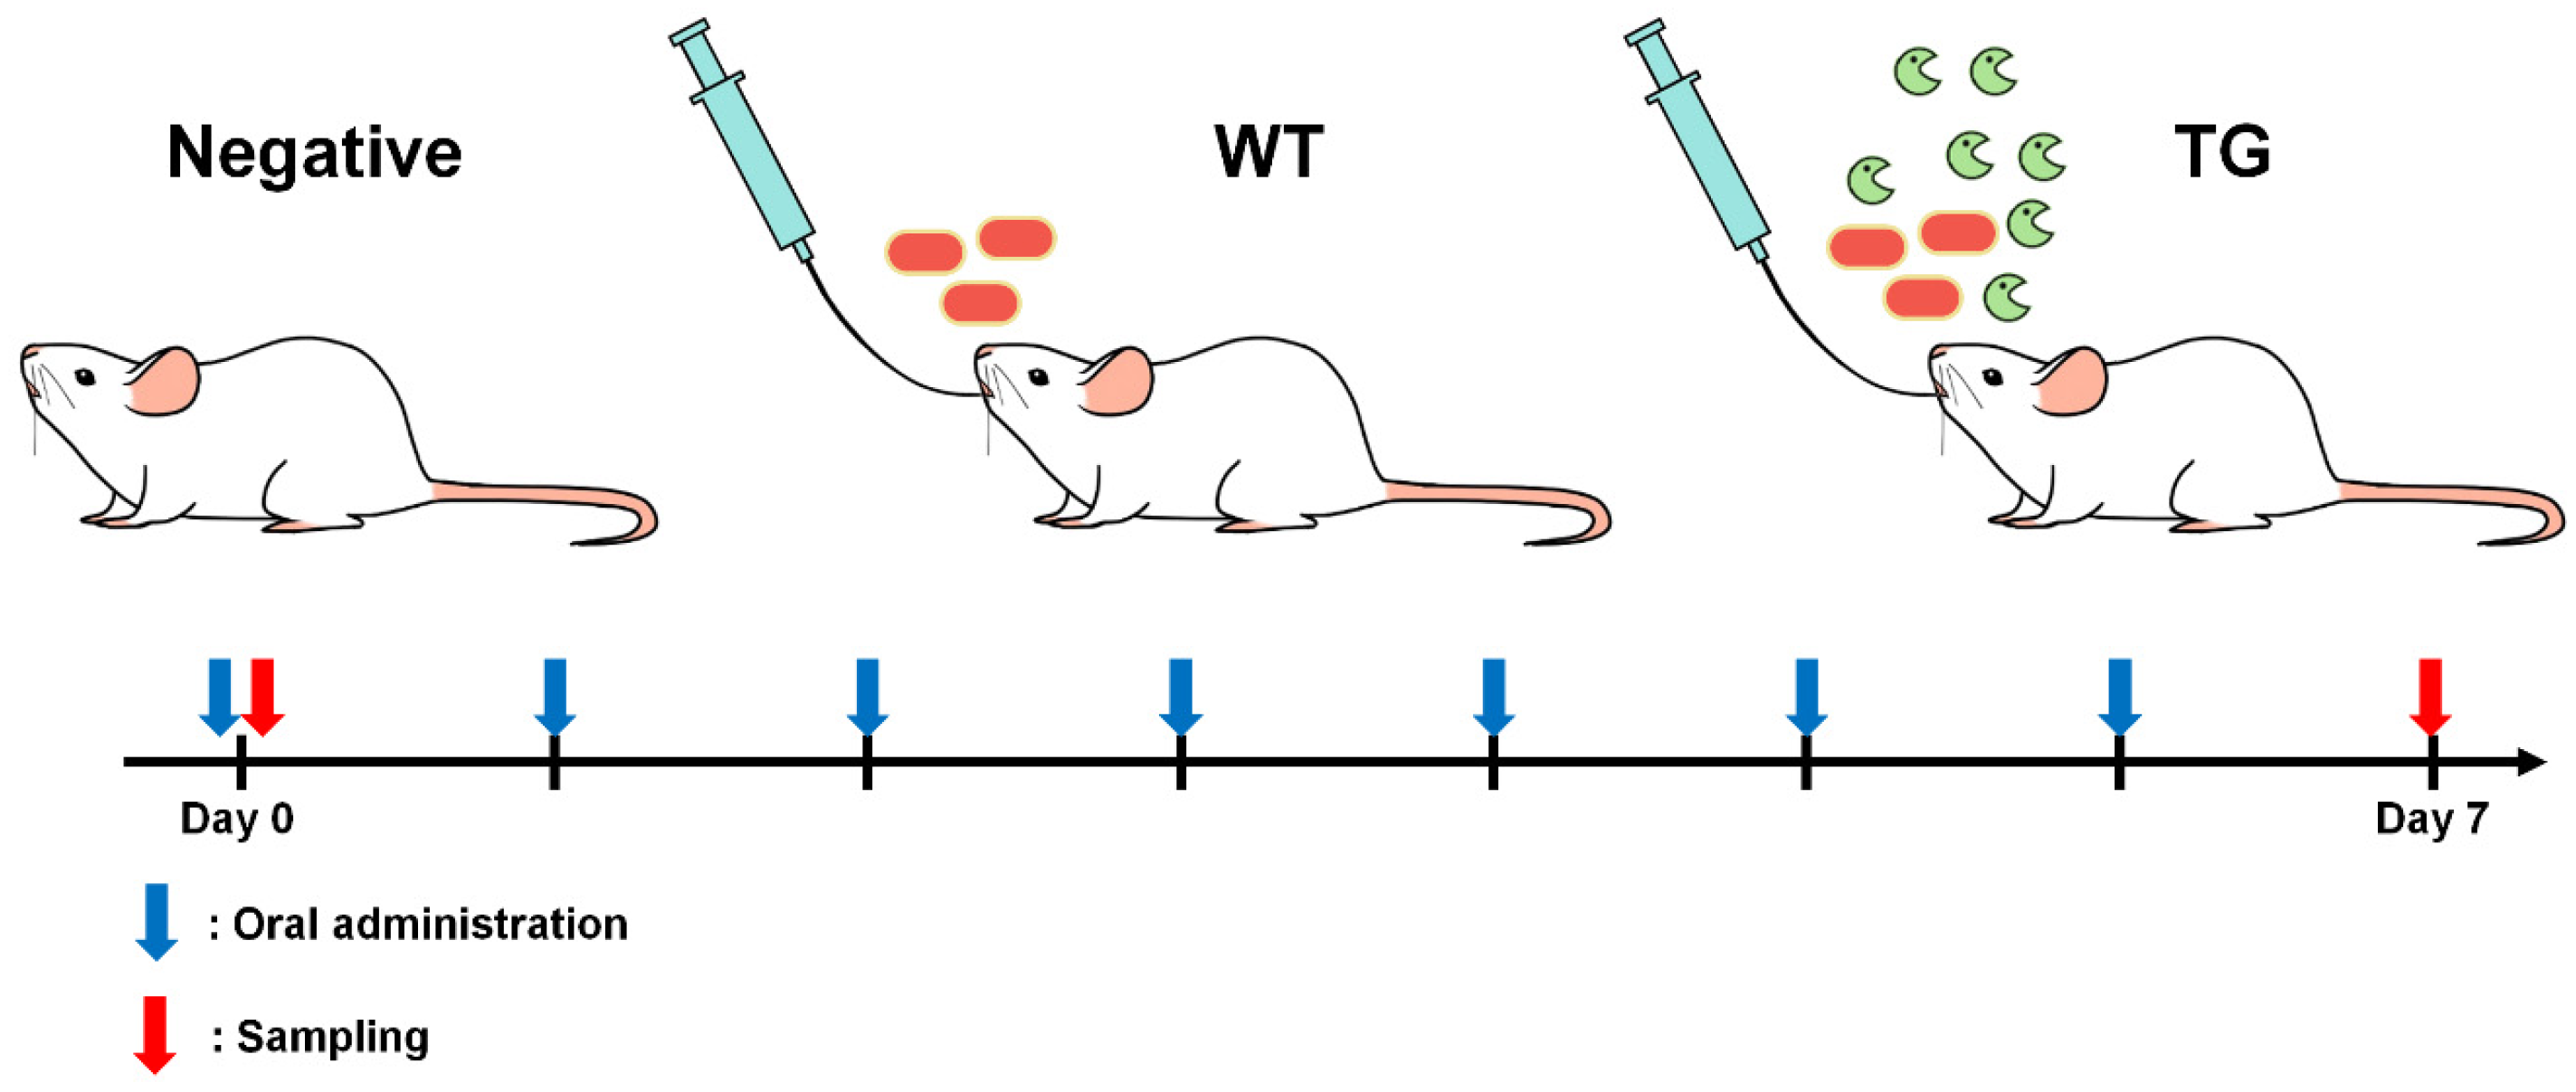
2.3. Oral Administration of Lactobacillus to BALB/c mice

Mice were assigned to three experimental groups, with three mice per group. The administration scheme is illustrated in Figure 1. For the three experimental groups, 6-week-old female BALB/c mice were fed 108 colony forming units (CFU) of WT and TG L. paracasei once a day for 7 days using oral zonde needle. Mice in the negative control group were fed only with PBS once a day for 7 days.

2.4. Sample Preparation and DNA Extraction

Fecal samples were collected from the mice 7 days after administration. Genomic DNA was extracted from a total of 18 samples, including three biological replicates for each condition, using ExtractMaster™ Fecal DNA Extraction Kit according to the manufacturer’s instructions (Epicentre, Madison, WI, USA).

2.5. Preparation of Libraries for 16S Ribosomal RNA Sequencing and Paired-End Sequencing Using the MiSeq System

Libraries were constructed following the Illumina 16S metagenomics sequencing library preparation guide. In brief, the V3 and V4 regions of the 16S rRNA gene were targeted for PCR amplification using isolated DNA as a template. The 7-bp barcoded PCR primers were used to label 16S rRNA amplicons for each individual sample. Paired-end sequencing (2 × 300 bp) was conducted using the MiSeq system (Illumina Inc., San Diego, CA, USA) at Macrogen (Seoul, Korea). The raw images generated by Illumina MiSeq system were processed using MiSeq Control Software (MCS, v2.2, Illumina Inc.) for system control with base calling by integrated primary analysis software called Real Time Analysis (RTA, v1.18, Illumina Inc.). The binary base calls (BCL) is converted into FASTQ using the Illumina package MiSeq Reporter (MSR). The obtained raw data were deposited in Sequence Read Archive (SRA) database in National Center for Biotechnology Information NCBI with project number PRJNA352304.

2.6. Preprocessing of Raw Data, Clustering, and Taxonomic Assignment

Data analyses consisted of three steps: preprocessing and clustering, taxonomic assignment, and statistical analyses for diversity. Paired-end reads were merged using the FLASH program [18]. The filtered clean reads were subjected to clustering at 100% identity to identify operational taxonomic units (OTUs) using the CD-HIT-OUT program [19]. Clustering was comprised of three steps. First, short reads and extra-long tails were removed from the raw data. The second step was to identify error-free reads. In the third step, the remaining representative reads from non-chimeric clusters were clustered using a greedy algorithm into OTUs with 97% identity at species level. Taxonomical composition from phylum to species level for each sample was analyzed using the quantitative insight into microbial ecology (QIIME) pipeline [20]. Community richness and diversity (α diversity) were analyzed by diverse α diversity metrics: Chao1, Shannon, Simpson, and Good’s coverage using the QIIME pipeline.

2.7. Statistical Analyses

We have conducted a power test using the G*Power program (version 3.1.9.2) to calculate the power of the study [21]. Post hoc testing to compute the achieved power was conducted by one-way analysis of variance (ANOVA) using an F-test with the following parameters: Repeated measures, within-between interaction, effect size f 0.4 (large), α error probability 0.05, number of groups 3, number of measurements 2, correlation among replicate measures 0.05, nonsphericity correction 1, resulting in a power of 0.7882055 (78.82). In order to achieve a power higher than 0.8 (80) with the same parameters, the sample size should be more than 42, with an expected power of 0.8034136.
In addition, a t-test was conducted on five major species of Helicobacter sp., Pediococcus acidilactici, L. paracasei, L. reuteri, and Bifidobacterium using the following parameters: difference between two dependent means (matched pairs), correlation between groups 0.5, α error probability 0.05, total sample size 6, and respective effect size. Effect sizes for two different groups was determined from group parameters (mean value group 1, mean value group 2, standard deviation (SD) value group 1, SD value group 2) using the G*Power program.
Next, we conducted a two-way ANOVA with replication using Excel's Data Analysis (version 2016, Microsoft, Redmond, WA, USA) to find bacteria species significantly changed under three different conditions (negative (N), TG and WT) and two time points.
The differences in abundance of bacterial genera among 18 samples, the ANOVA was performed using the Statistical Analysis of Metagenomic Profiles (STAMP v. 2.1.3) software package [22]. For comparison between two different conditions, two-sided Fisher’s exact test with confidence interval (CI) method (DP: Asymptotic-CC with 0.95) was conducted using STAMP software package.

3. Results

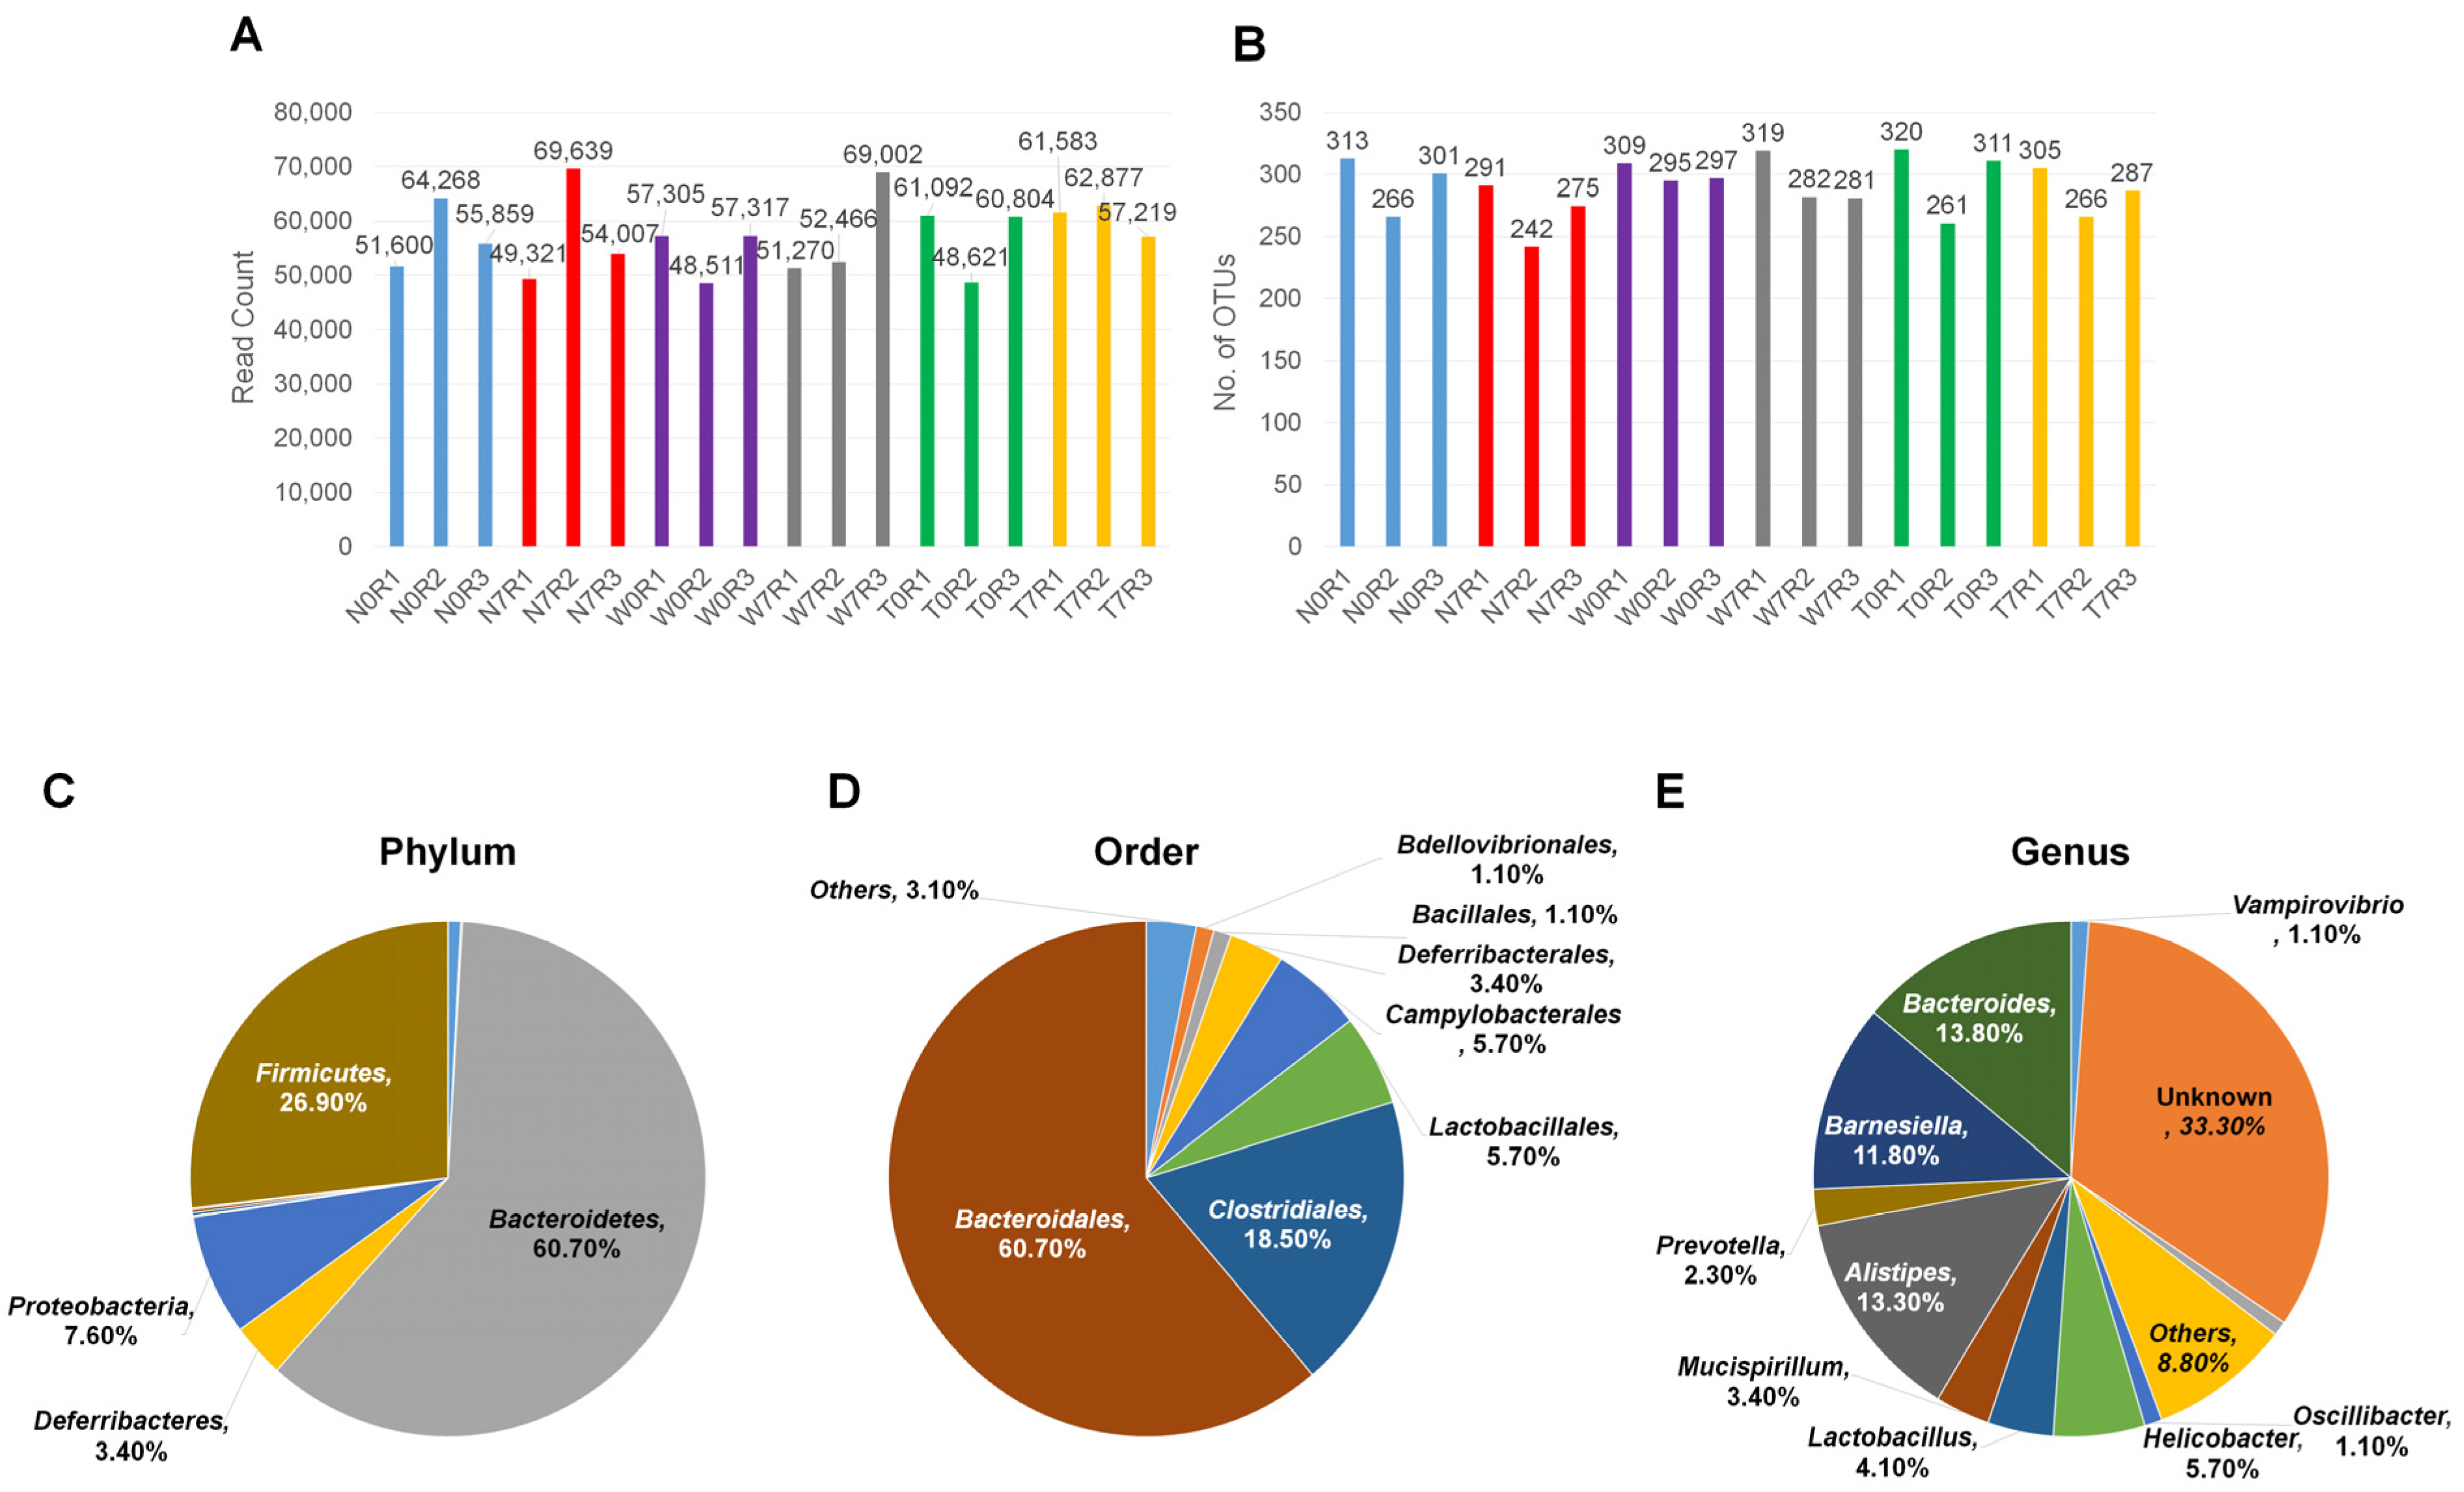
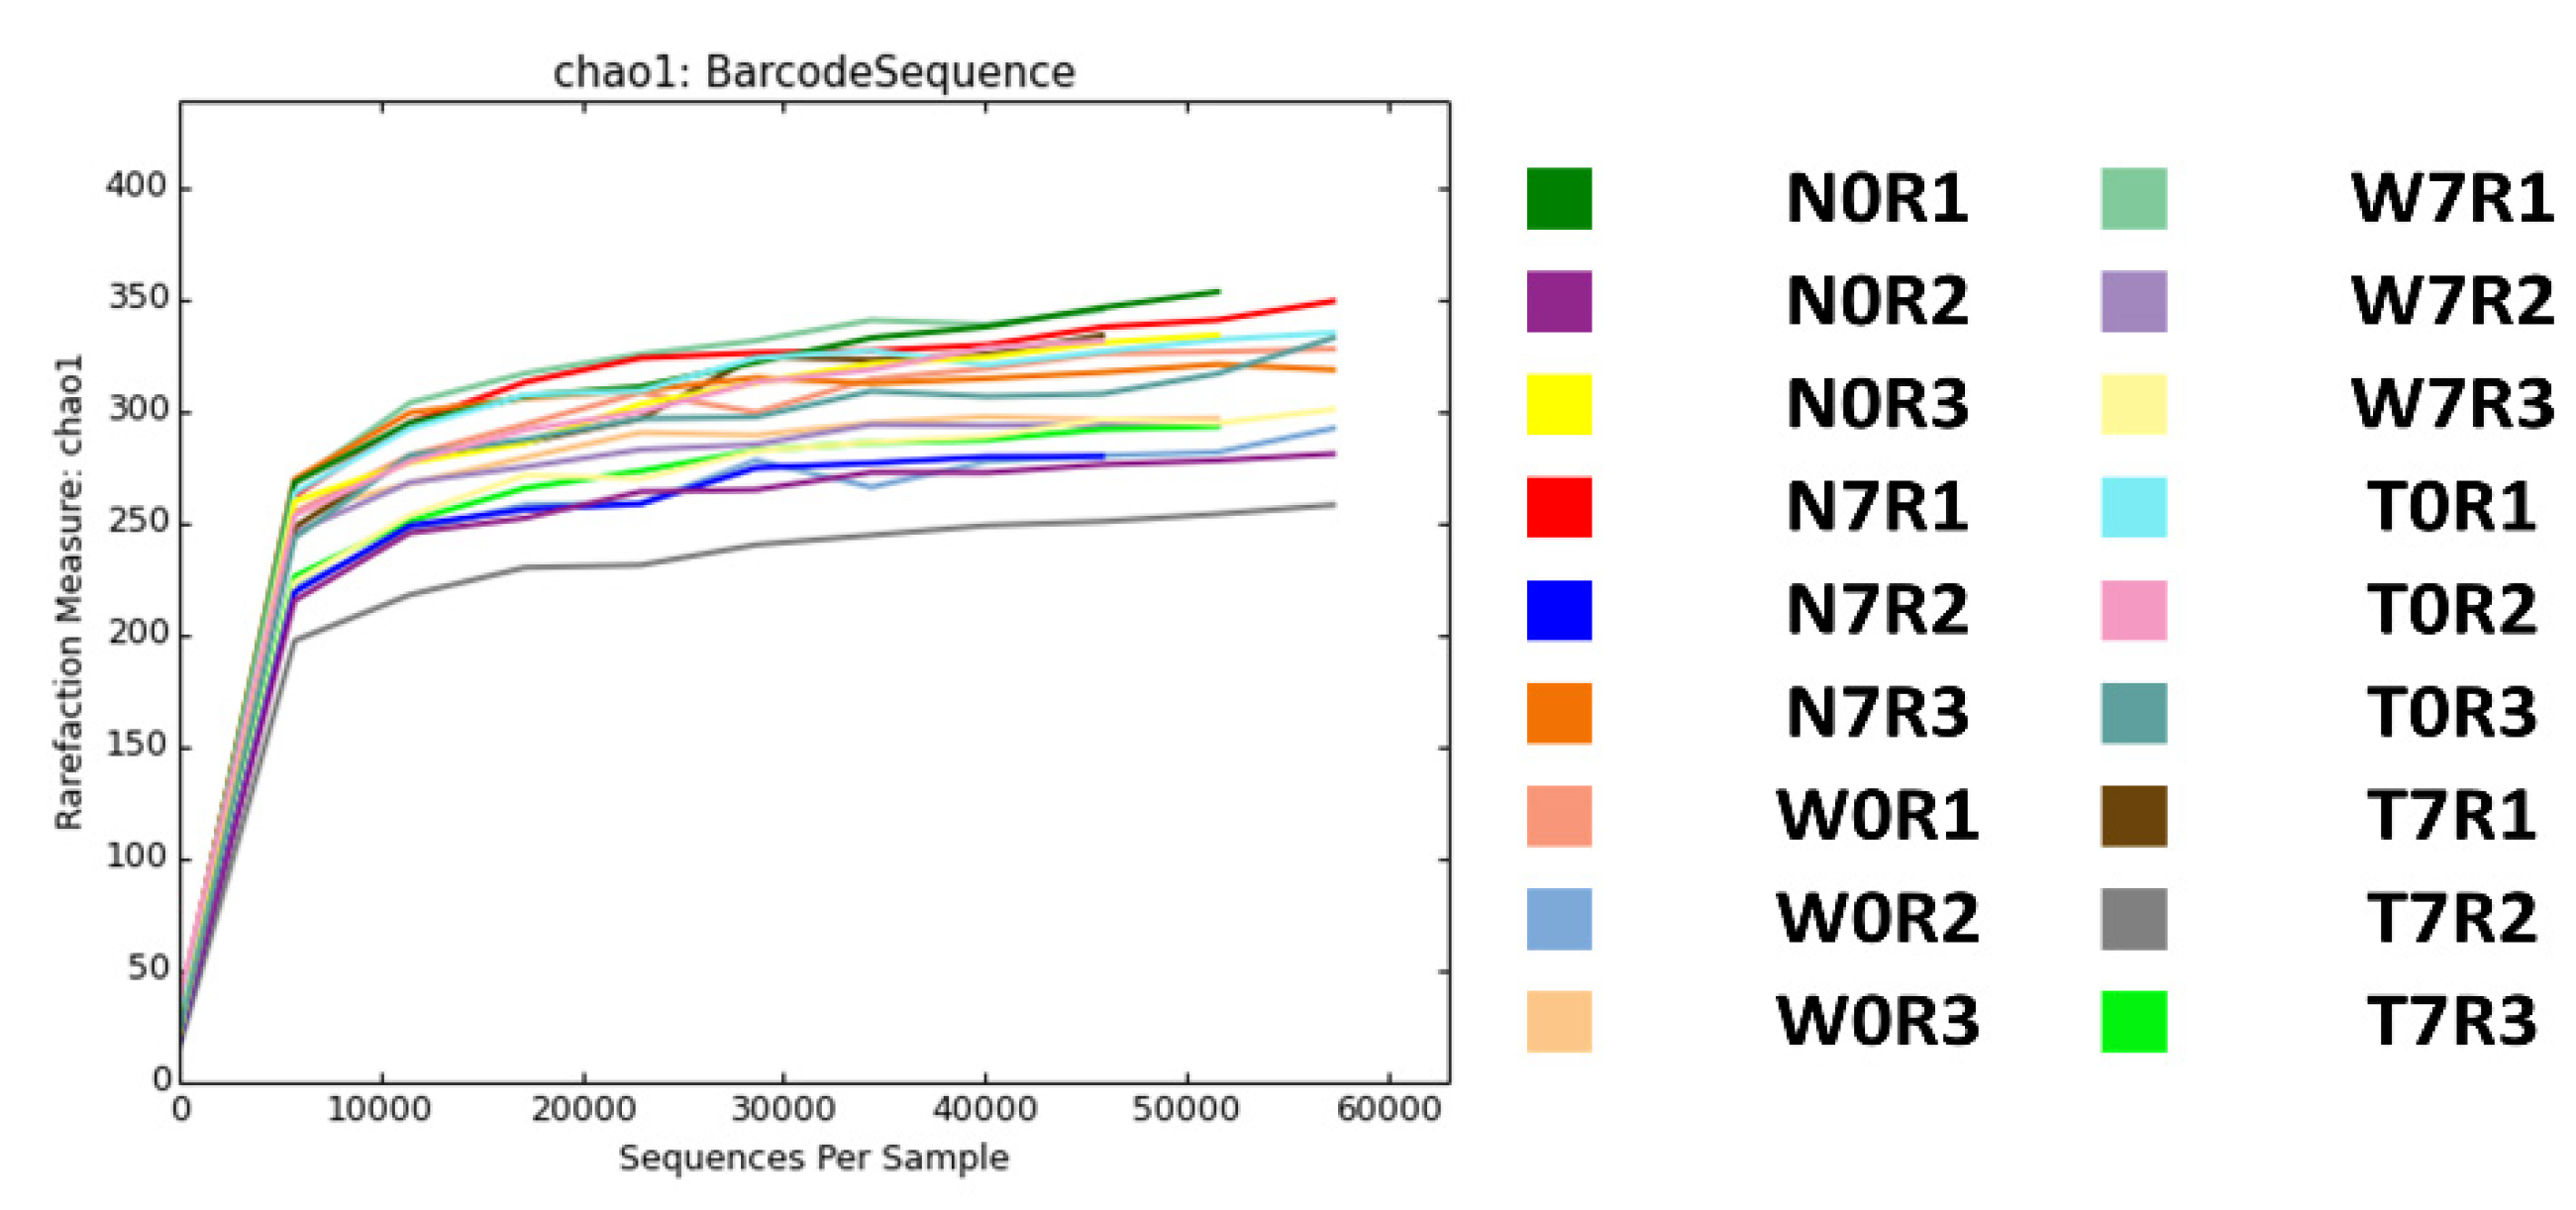
3.1. Sample Preparation and High-Throughput 16S ribosomal RNA Metagenomic Analyses Using MiSeq System

Negative samples were obtained from the mice fed with PBS buffer or fed a diet containing WT samples were from mice fed L. paracasei, and TG samples were from mice fed L.paracasei expressing 3D8 scFv, as established in a previous study [8]. To examine changes in the microbiota in mice intestines among different conditions, we harvested fecal samples at two different time points (day 0 and day 7) for each condition (Figure 1 and Table 1). Finally, a total of 18 samples derived from three different conditions at two different time points with three biological replicates were subjected to metagenome profiling. A total of 5,089,513 reads (2,302,478,088 bp) were obtained from 18 libraries (Table 1). Between 224,927 reads (102,570,095 bp) and 326,110 reads (148,592,201 bp) were obtained from each sample (Table 1). The power of our study was 0.7882055 (78.82) with three number of groups (three conditions), two number of measurements (two time points), and three replicates for each group.

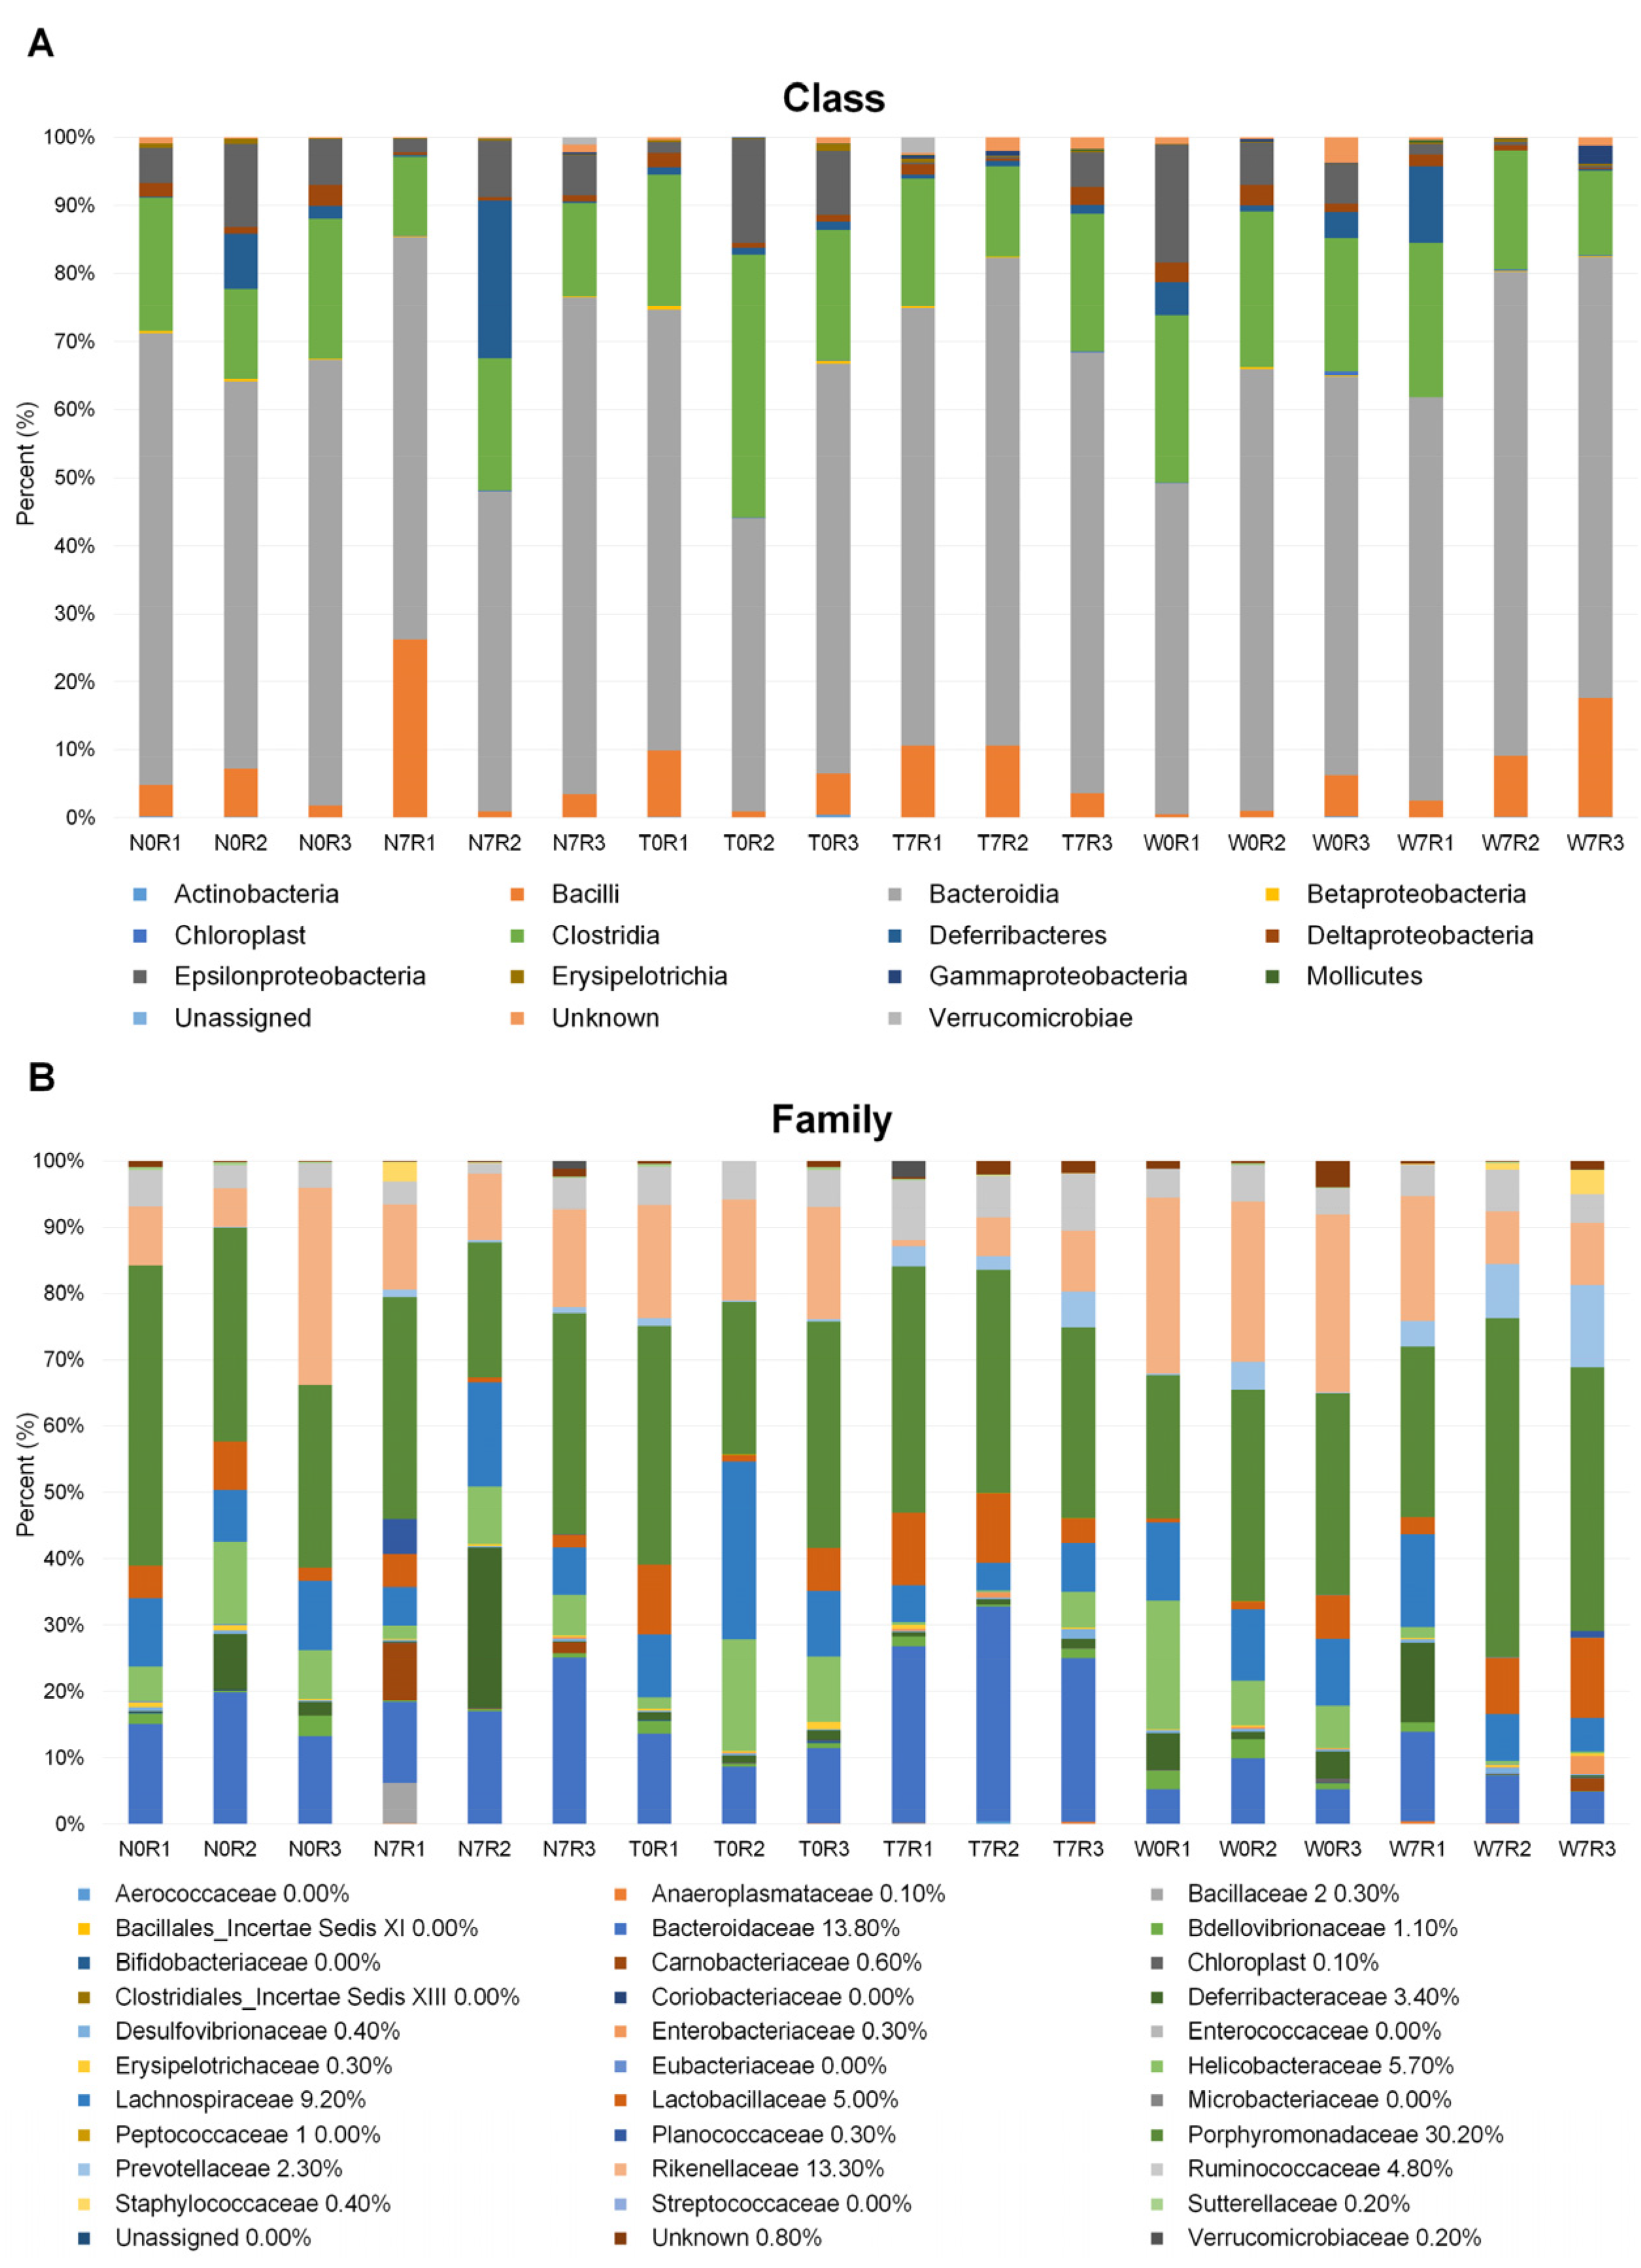
3.2. Microbial Composition in Mice Intestine

We carried out bioinformatics analyses for NGS data as described in methods section. Because of the stringent criteria for filtering sequenced reads, approximately 21% to 27% of sequenced raw data were further used for the identification of OTUs. We obtained from 48,511 reads (W0R2) to 69,639 reads (N7R2), which was enough for OTU analyses (Figure 2A). There was some bias for the number of filtered reads among replicates. In total, we identified 396 OTUs from 18 libraries (Table S1). In detail, between 242 OTUs (N7R2) and 320 OTUs (T0R1) were identified, with an average of 290 OTUs (Figure 2B). Based on our results, there was no correlation between number of reads and number of OTUs.
To reveal microbial composition in the mice intestine, we combined all data and classified the microbes into phylum, order and genus. We identified 9 phyla, 13 classes, 16 orders, 31 families, and 52 genera. Based on phylum, Bacteroidetes (60.70%) was dominant followed by Firmicutes (26.90%), Proteobacteria (7.60%), and Deferribacteres (3.40%) (Figure 2C). According to the order, most bacteria belonged to the Bacteroidales (60.70%) followed by Clostridiales (18.50%), Lactobacillales (5.70%), Campylobacterales (5.70%), and Deferribacterales (3.40%) (Figure 2D). However, many bacteria (33.30%) were not assigned into any known bacteria genera. The Lactobacillus accounted for 4.10% of all identified bacteria in the mice intestine.
Among 13 identified known classes, the proportion of bacteria belonging to an unknown class ranged from 0.5% (W0R1) to 26.10% (N7R1) (Figure 3A). The proportion of the class Bacteroidia ranged from 42.6% (T0R2) to 72.7% (N7R3). The second dominant bacterial class was Clostridia ranging from 11.5% (N7R1) to 38.2% (T0R2). The class Epsilonproteobacteria was also abundantly present in all samples. The class Deferribacteres was identified in most samples except W7R2, and compared with other samples, the proportion of class Deferribacteres was very high in the N7R2 sample.
Among the 31 known bacterial families, only 0.8% of bacteria were identified as unknown (Figure 3B). The three bacterial families Porphyromonadaceae, Bacteroidaceae, and Rikenellaceae were abundantly present in all samples. Rarefaction curves based on the Chao1 index were generated for 18 libraries and showed that the rarefaction curves nearly reached a plateau (Figure 4). Sequencing coverage for the 18 samples ranged from 0.9991079 to 0.999704 (Table 2). Both rarefaction and sequencing coverage indicate sufficient coverage of 16S rRNA sequencing. In addition, we calculated the richness estimate and diversity index using the Mothur program [23]. Although there was significant bias for the richness estimate and diversity index among biological replicates in the same condition, we did not find any significant differences among conditions (Table 2).

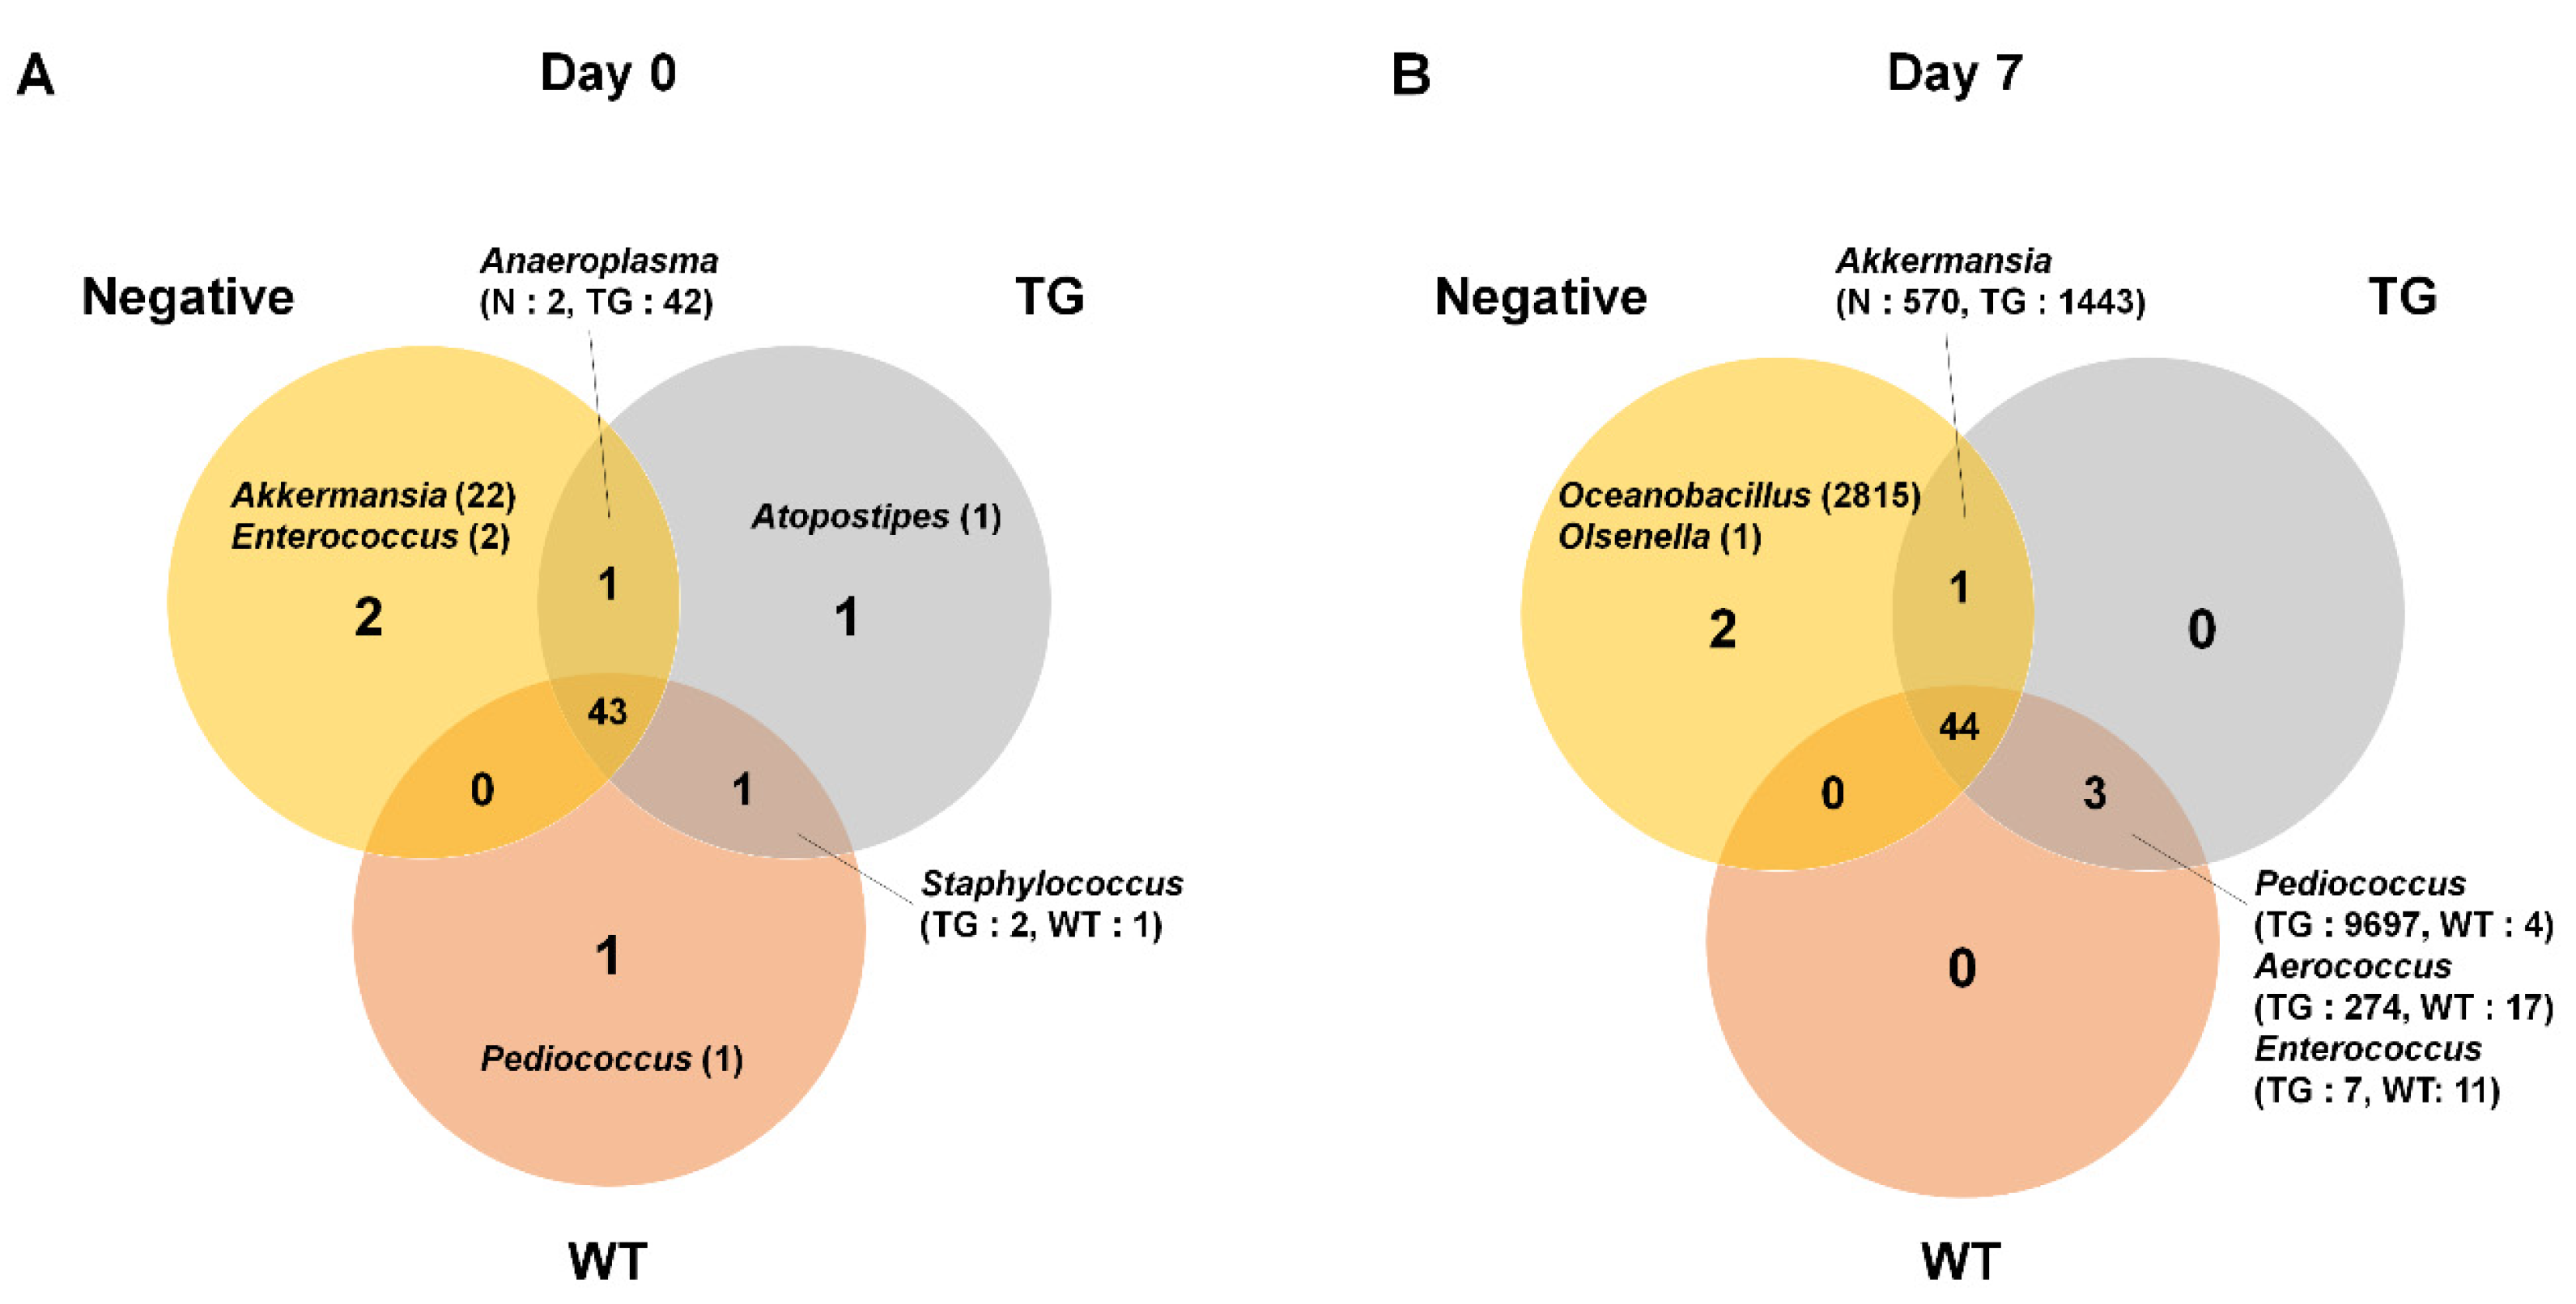
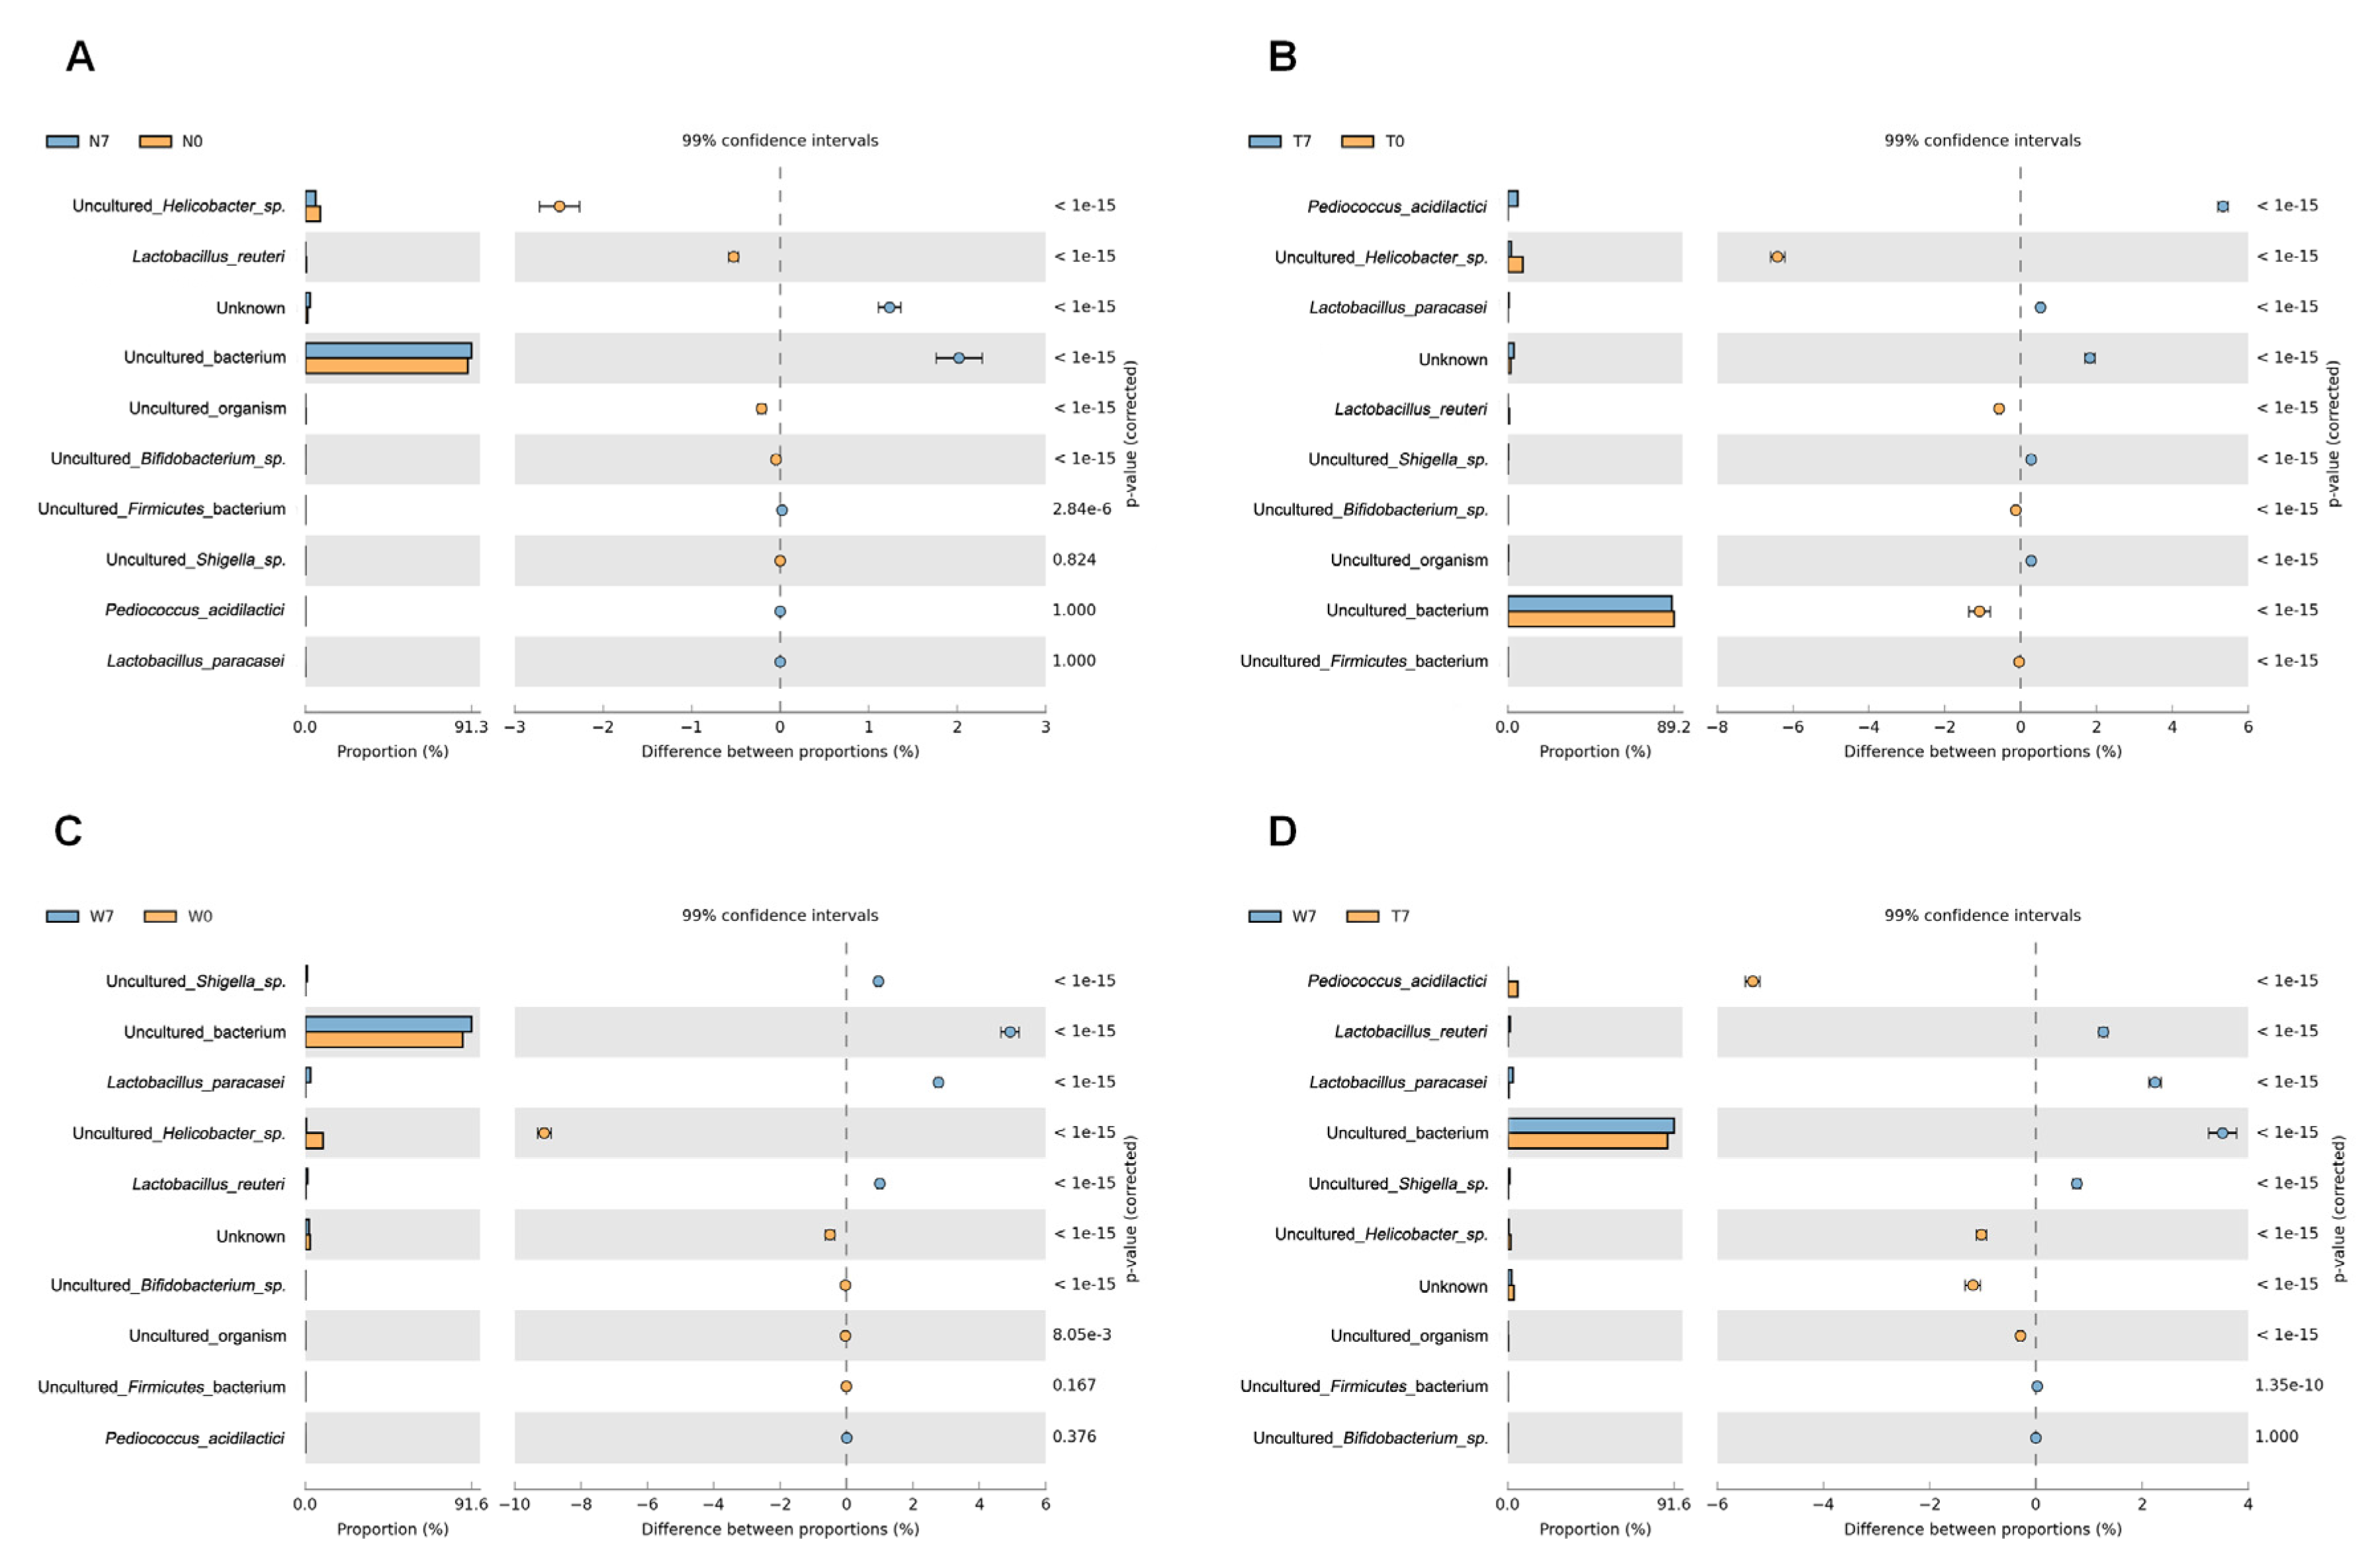
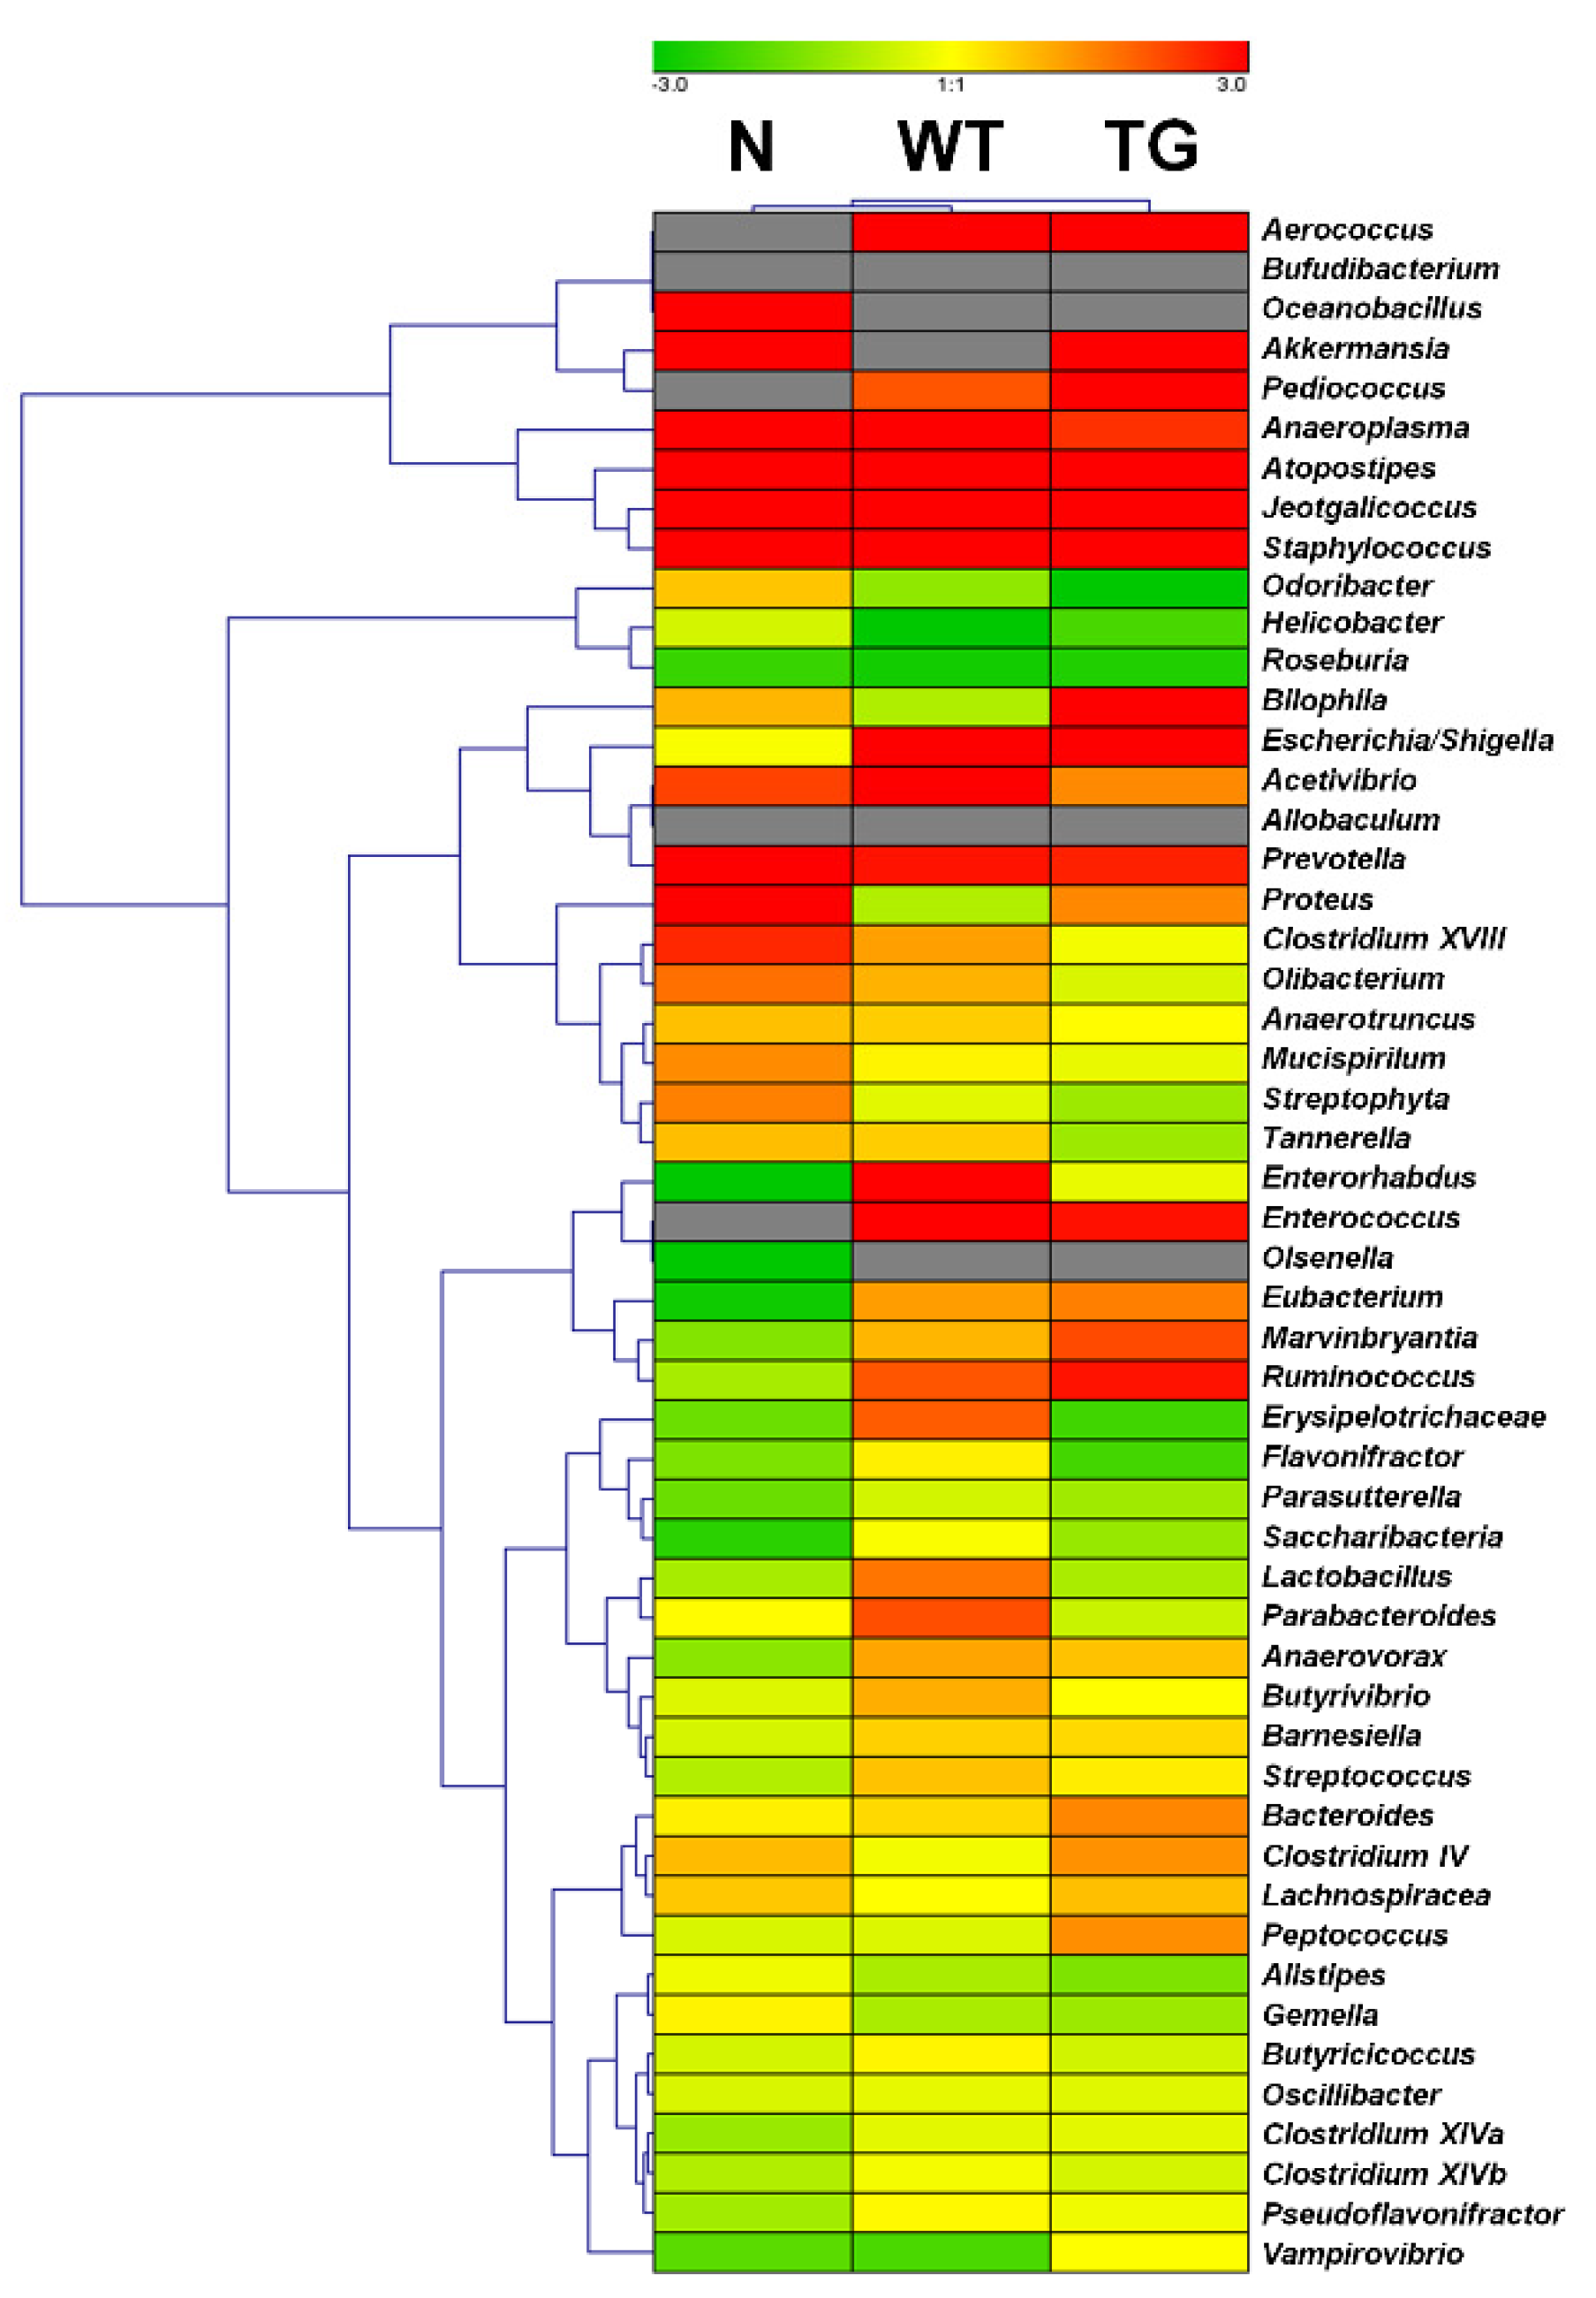
3.3. Comparison of Bacterial Compositions Among the Three Different Conditions

To identify condition-specific bacterial genera, we analyzed the composition of bacterial genera in three conditions at two different time points (Figure 5). A total of 49 and 50 genera were identified at day 0 and day 7, respectively. Most of the identified bacterial genera were commonly identified in all three conditions. For example, 43 genera (87.8%) and 44 genera (88%) were commonly identified at day 0 and day 7, respectively. At day 0, the two genera Akkermansia and Enterococcus were specific for the negative condition whereas Atopostipes and Pediococcus were specific for TG and WT, respectively. The read counts for condition specific bacterial genera were very low, ranging from only 1 count to 22 counts. At day 7, the genera Oceanobacillus and Olsenella were specific for negative condition. Interestingly, the read count for the genus Oceanobacillus was very high (2815 reads). The genus Akkermansia was commonly identified in negative and TG conditions relatively high read counts (N: 570, TG: 1443). Furthermore, between TG and WT conditions, the three genera Pediococcus (TG: 9697, WT: 4), Aerococcus (TG: 274, WT: 17), and Enterococcus (TG: 7, WT: 11) were identified. In particular, the number of reads associated with the genus Pediococcus was very high in the TG condition.
We further analyzed the identified bacteria according to species in order to decipher changes in bacterial composition among the three different conditions (Table 3). In total, 1,032,761 reads were identified from 18 samples. Of these, 89.37% of reads were derived from uncultured bacteria, followed by uncultured Helicobacter sp. (5.63%), and unknown species (2.35%). At the species level, there were dramatic changes in microbial composition among conditions (Figure 6). L. paracasei that was used for feeding was not found in N0, N7, T0, or W0, as expected (Table 3 and Figure 6A–C). At 7 days after feeding, a large number of L. paracasei were found in both TG and WT samples (Figure 6B,C). The number of L. paracasei in WT at day 7 (4,790 reads) was about five times larger than that in TG at day 7 (953 reads). Interestingly, we also identified another lactobacillus, L. reuteri that was not fed to the mice. The amount of L. reuteri was decreased in negative and transgenic samples at day 7 compared day 0, whereas the amount of L. reuteri was increased in wildtype at day 7 (Figure 6B,C). In addition, we identified P. acidilactici, which is a known probiotic. Surprisingly, the population of P. acidilactici was dramatically increased in the transgenic condition at day 7 (Figure 6D). However, the number of uncultured Bifidobacterium species was decreased in all three conditions at day 7 compared with day 0 (Figure 6A–C).
We identified not only probiotics, but also potential pathogenic bacteria such as uncultured Firmicutes bacterium, uncultured Helicobacter species, and uncultured Shigella species. Of these, the number of Helicobacter species was decreased in all conditions at day 7 compared with day 0 (Figure 6A–C).
We calculated the power based on five major species of Helicobacter sp., P. acidilactici, L. paracasei, L. reuteri, and Bifidobacterium. As a result, we obtained a power greater than 0.8 following three bacteria species in a given comparison, such as a power of 0.8556975 (T0 vs. T7) and 0.8820874 (W0 vs. W7) for Helicobacter sp., a power of 0.9914611 (N7 vs. T7) and 0.9825466 (W0 vs. W7) for P. acidilactici, and a power of 0.8329246 (W0 vs. W7), 0.9139413 (T7 vs. W7), and 0.9370286 (W7 vs. N7) for Lactobacillus reuteri. Furthermore, a two-way ANOVA test demonstrated that the abundance of Helicobacter sp. (p = 0.020955727) was significantly changed among the three conditions, while P. acidilactici showed significant changes in abundance by time (p = 0.007410375), condition (p = 0.00245994), and by the interaction between time and condition (p = 0.002458016).
We examined the relative abundance of the 52 known bacteria genera in three conditions at two different time points. The relative abundance of selected bacteria at day 7 was compared to that at day 0. The heat map shows changes in bacteria abundance under the three conditions (Figure 7). Bacteria belonging to the genera Aeroccus (p = 0.237), Pediococcus (p = 0.093), and Enterococcus (p = 0.060) were highly present in WT and TG, but not in the N sample (Table S2). Genera Oceanobacillus (p = 0.332) and Olsenella (p = 0.006) were only present in N samples; however, Oceanobacillus (p = 0.332) was highly abundant at day 7, whereas Olsenella (p = 0.006) was highly abundant at day 0. The abundance of bacteria belonging to the genera Anaeroplasma (p = 0.067), Atopostipes (p = 0.167), Jeotgalicoccus (p = 0.176), Staphylococcus (p = 0.105), and Prevotella (p = 0.024) was high at day 7 in all three conditions.

4. Discussion

Mice are frequently used as a model animal to examine the changes in microbiota in various tissues in response to diverse environmental stimuli. Modulation of the microbiota under a given condition results in a beneficial or harmful effect on the host life. For instance, many studies have shown the effects of antibiotic treatment on the mouse intestinal microbiome [24,25,26]. In addition, some studies have demonstrated the influence of dietary ingredients on the fecal microbial community in mice [27,28]. Moreover, the change of mouse intestinal microbiota in response to different environmental changes such as irradiation [29], acclimatization-induced stress [30], and exposure to arsenic and iron [31] has been studied. Gut microbiota from mice with different genetic backgrounds such as wildtype mice and gnotobiotic mice have also been previously examined [32,33].
In this study, we performed metagenome sequencing of a mouse model to examine the impact of consumption of lactobacillus expressing a recombinant protein on mouse intestine microbiota. We identified approximately 300 species from a single source mouse which represents about 60% of known bacteria species in a reference mouse gut metagenome derived from 184 mice [14]. Based on this result, our metagenomic approach was successful for revealing the microbiota in the intestine of a single source mouse. Among three biological replicates used for each condition, the microbial compositions among different replicates for the same condition were similar, but the abundance of identified bacteria was diverse. These results indicate that each individual mouse has a unique complex of microbiota, as previously shown [14].
Of the known top core genera in the mouse gut metagenome, three genera, Bacteroides, Alistipes, and Lactobacillus, were identified in our study; however, we additionally identified Barnesiella, Mucispirillum, and Oscillibacter genera. Of these, bacteria in the genus Bacteroides are clinical pathogens present in most anaerobic infections and have a beneficial relationship with the host [34]. In addition, Barnesiella is an obligatory anaerobic bacteria belonging to the Bacteroidetes and is one of the bacteria most frequently identified in the gut microbiota of BALB/c mice, which were used in our study [35].
Numerous studies have demonstrated that many factors influence the composition of microbiota. Of factors known to influence the composition of microbiota, probiotics are the main living factors that positively affect host health. For example, a transcriptome-based study showed that B. bifidum, a probiotic, reduced the cholesterol level in mice [36]. Colonization of B. bifidum in the intestine of different mice was monitored by quantitative real-time PCR [37]. Other studies using lactobacillus species showed a reduction in obesity [38] and inhibition of alcohol-induced pathogenic activity in the liver [39]. In addition, several previous studies using metagenomic approaches showed that probiotics modulate the intestinal microbiota [40]. Furthermore, a recent study demonstrated that the probiotic L. casei expressing human lactoferrin confers antibacterial activity in the GI tract of mouse [41].
In this study, we found that the administration of lactobacillus resulted in an increased population of the introduced L. paracasei. However, the populations of other probiotics L. reuteri and uncultured Bifidobacterium spp., which were already present in the intestine of the mouse, were decreased. We suppose that this result reflects competition among different probiotics, with the introduced L. paracasei becoming the dominant probiotic as a result of its continuous administration. In contrast, the population of uncultured Helicobacter sp., which are harmful bacteria, was decreased by administration of lactobacillus. These results are highly consistent with the known ability of probiotics to increase populations of probiotics and decrease populations of harmful bacteria.
The heat map identified several bacteria genera whose abundance was dramatically increased by the administration of lactobacillus. In particular, several round-shaped bacteria such as the genera Aerococcus, Pediococcus, Enterococcus, and Ruminococcus were identified. In general, members of the genera Pediococcus and Enterococcus are lactic acid bacteria of the phylum Firmicutes [42]. Therefore, we cautiously presume that the identified bacteria belonging to the genera Aerococcus and Ruminococcus might be similar to other lactic acid bacteria.
We also identified a large number of uncultured bacteria that are unknown. Although these included several bacteria species that might be involved in probiotic activity, most of them were unknown bacteria for which genome and basic characteristics are not currently available. Therefore, identification and characterization of unknown bacteria residing in the mouse intestine should be intensively conducted.
The most interesting result was a dramatic increase in the population of P. acidilactici, which is a probiotic in the T7 condition. The number of reads for P. acidilactici was one in W0 and four in W7 conditions. This result indicates the presence of P. acidilactici in the BALB/c mouse. Interestingly, administration of L. paracasei expressing 3D8 scFv facilitated growth by P. acidilactici, whereas administration of L. paracasei without 3D8 scFv did not change the population of P. acidilactici. Based on this result, we cautiously propose a positive relationship between expressions of 3D8 scFv and P. acidilactici.
We hypothesized that the newly developed system composed of lactobacillus expressing 3D8 scFv would not affect the microbial composition in the mouse intestine. However, the influence of lactobacillus expressing 3D8 scFv was very species specific. It might be of interest to further examine the correlation between expression of 3D8 scFv and P. acidilactici. Furthermore, it would also be interesting to test other recombinant proteins for the ability to change the microbiota in the intestine of mice. We believe that the newly established system expressing a recombinant protein might be a useful tool for probiotics-related research or industry.
Taken together, our results showed that probiotic L. paracasei expressing 3D8 scFv protein enhances probiotic activity in the mice intestine without any observable side effects. Thus, the system developed in this study might be a good tool for expression of recombinant protein using probiotics in the near future.

Supplementary Materials

The following are available online at https://www.mdpi.com/2073-4425/9/6/276/s1, Table S1: Classification of identified 396 OTUs identified from 18 samples with respective bacteria taxonomy and read number., Table S2: Statistical analyses of 53 bacterial genera in 18 different samples by ANOVA implemented in STAMP program., Table S3: Read number, mean value, and standard deviation for the identified 396 species in each condition.

Author Contributions

S.C. and S.L. conceived and designed the experiments; S.C. and D.K. carried out the experiments; S.C., Y.L., E.-J.K., and M.-J.C. analyzed the data; S.-J.B. contributed reagents/materials/analysis tools; S.C. and W.K.C. drafted the paper. All authors contributed to subsequent drafts of the manuscript. All authors read and approved the final manuscript.

Acknowledgments

This work was supported by a grant from the Agenda (No. PJ0102012016) from the Rural Development Administration (RDA) of Korea.

Conflicts of Interest

The authors declare that the research was conducted in the absence of any commercial or financial relationships that could be construed as a potential conflict of interest.

Data Availability

The obtained raw data were deposited in Sequence Read Archive (SRA) database in NCBI with project number PRJNA352304.

References

  1. Hill, C.; Guarner, F.; Reid, G.; Gibson, G.R.; Merenstein, D.J.; Pot, B.; Morelli, L.; Canani, R.B.; Flint, H.J.; Salminen, S. Expert consensus document: The international scientific association for probiotics and prebiotics consensus statement on the scope and appropriate use of the term probiotic. Nat. Rev. Gastroenterol. Hepatol. 2014, 11, 506–514. [Google Scholar] [CrossRef] [PubMed]
  2. Parvez, S.; Malik, K.; Ah Kang, S.; Kim, H.Y. Probiotics and their fermented food products are beneficial for health. J. Appl. Microbiol. 2006, 100, 1171–1185. [Google Scholar] [CrossRef] [PubMed]
  3. Bartkiene, E.; Zavistanaviciute, P.; Lele, V.; Ruzauskas, M.; Bartkevics, V.; Bernatoniene, J.; Gallo, P.; Tenore, G.C.; Santini, A. Lactobacillus plantarum LUHS135 and paracasei LUHS244 as functional starter cultures for the food fermentation industry: Characterisation, mycotoxin-reducing properties, optimisation of biomass growth and sustainable encapsulation by using dairy by-products. LWT Food Sci. Technol. 2018, 93, 649–658. [Google Scholar]
  4. Valeriano, V.D.V.; Balolong, M.P.; Kang, D.K. Probiotic roles of Lactobacillus spp. in swine: Insights from gut microbiota. J. Appl. Microbiol. 2016, 122, 554–567. [Google Scholar] [CrossRef] [PubMed]
  5. Lähteinen, T.; Malinen, E.; Koort, J.M.; Mertaniemi-Hannus, U.; Hankimo, T.; Karikoski, N.; Pakkanen, S.; Laine, H.; Sillanpää, H.; Söderholm, H. Probiotic properties of Lactobacillus isolates originating from porcine intestine and feces. Anaerobe 2010, 16, 293–300. [Google Scholar] [CrossRef] [PubMed]
  6. Claesson, M.J.; Van Sinderen, D.; O’Toole, P.W. The genus Lactobacillus—A genomic basis for understanding its diversity. FEMS Microbiol. Lett. 2007, 269, 22–28. [Google Scholar] [CrossRef] [PubMed]
  7. Kim, Y.-R.; Kim, J.-S.; Lee, S.-H.; Lee, W.-R.; Sohn, J.-N.; Chung, Y.-C.; Shim, H.-K.; Lee, S.-C.; Kwon, M.-H.; Kim, Y.-S. Heavy and light chain variable single domains of an anti-DNA binding antibody hydrolyze both double-and single-stranded DNAs without sequence specificity. J. Biol. Chem. 2006, 281, 15287–15295. [Google Scholar] [CrossRef] [PubMed]
  8. Hoang, P.M.; Cho, S.; Kim, K.E.; Byun, S.J.; Lee, T.-K.; Lee, S. Development of Lactobacillus paracasei harboring nucleic acid-hydrolyzing 3D8 scFv as a preventive probiotic against murine norovirus infection. Appl. Microbiol. Biotechnol. 2015, 99, 2793–2803. [Google Scholar] [CrossRef] [PubMed]
  9. Jun, H.-R.; Pham, C.D.; Lim, S.-I.; Lee, S.-C.; Kim, Y.-S.; Park, S.; Kwon, M.-H. An RNA-hydrolyzing recombinant antibody exhibits an antiviral activity against classical swine fever virus. Biochem. Biophys. Res. Commun. 2010, 395, 484–489. [Google Scholar] [CrossRef] [PubMed]
  10. Lee, G.; Cho, S.; Hoang, P.M.; Kim, D.; Lee, Y.; Kil, E.-J.; Byun, S.-J.; Lee, T.-K.; Kim, D.-H.; Kim, S. Therapeutic strategy for the prevention of pseudorabies virus infection in C57BL/6 mice by 3D8 scFv with intrinsic nuclease activity. Mol. Cells 2015, 38, 773. [Google Scholar] [CrossRef] [PubMed]
  11. Lee, G.; Yu, J.; Cho, S.; Byun, S.-J.; Kim, D.H.; Lee, T.-K.; Kwon, M.-H.; Lee, S. A nucleic-acid hydrolyzing single chain antibody confers resistance to DNA virus infection in HeLa cells and C57BL/6 mice. PLoS Pathog. 2014, 10, e1004208. [Google Scholar] [CrossRef] [PubMed]
  12. Scholz, M.B.; Lo, C.-C.; Chain, P.S. Next generation sequencing and bioinformatic bottlenecks: The current state of metagenomic data analysis. Curr. Opin. Biotechnol. 2012, 23, 9–15. [Google Scholar] [CrossRef] [PubMed]
  13. Frank, D.N.; Pace, N.R. Gastrointestinal microbiology enters the metagenomics era. Curr. Opin. Gastroenterol. 2008, 24, 4–10. [Google Scholar] [CrossRef] [PubMed]
  14. Xiao, L.; Feng, Q.; Liang, S.; Sonne, S.B.; Xia, Z.; Qiu, X.; Li, X.; Long, H.; Zhang, J.; Zhang, D. A catalog of the mouse gut metagenome. Nat. Biotechnol. 2015, 33, 1103–1108. [Google Scholar] [CrossRef] [PubMed]
  15. Droege, M.; Hill, B. The genome sequencer flx™ system—Longer reads, more applications, straight forward bioinformatics and more complete data sets. J. Biotechnol. 2008, 136, 3–10. [Google Scholar] [CrossRef] [PubMed]
  16. Oulas, A.; Pavloudi, C.; Polymenakou, P.; Pavlopoulos, G.A.; Papanikolaou, N.; Kotoulas, G.; Arvanitidis, C.; Iliopoulos, I. Metagenomics: Tools and insights for analyzing next-generation sequencing data derived from biodiversity studies. Bioinform. Biol. Insights 2015, 9, 75. [Google Scholar] [CrossRef] [PubMed] [Green Version]
  17. Oozeer, R.; Furet, J.; Goupil-Feuillerat, N.; Anba, J.; Mengaud, J.; Corthier, G. Differential activities of four Lactobacillus casei promoters during bacterial transit through the gastrointestinal tracts of human-microbiota-associated mice. Appl. Environ. Microbiol. 2005, 71, 1356–1363. [Google Scholar] [CrossRef] [PubMed]
  18. Magoč, T.; Salzberg, S.L. FLASH: Fast length adjustment of short reads to improve genome assemblies. Bioinformatics 2011, 27, 2957–2963. [Google Scholar] [CrossRef] [PubMed]
  19. Li, W.; Fu, L.; Niu, B.; Wu, S.; Wooley, J. Ultrafast clustering algorithms for metagenomic sequence analysis. Brief Bioinform. 2012, 13, 656–668. [Google Scholar] [CrossRef] [PubMed]
  20. Caporaso, J.G.; Kuczynski, J.; Stombaugh, J.; Bittinger, K.; Bushman, F.D.; Costello, E.K.; Fierer, N.; Pena, A.G.; Goodrich, J.K.; Gordon, J.I. QIIME allows analysis of high-throughput community sequencing data. Nat. Methods 2010, 7, 335–336. [Google Scholar] [CrossRef] [PubMed]
  21. Faul, F.; Erdfelder, E.; Buchner, A.; Lang, A.-G. Statistical power analyses using G*Power 3.1: Tests for correlation and regression analyses. Behav Res Methods 2009, 41, 1149–1160. [Google Scholar] [CrossRef] [PubMed]
  22. Parks, D.H.; Beiko, R.G. Identifying biologically relevant differences between metagenomic communities. Bioinformatics 2010, 26, 715–721. [Google Scholar] [CrossRef] [PubMed]
  23. Schloss, P.D.; Westcott, S.L.; Ryabin, T.; Hall, J.R.; Hartmann, M.; Hollister, E.B.; Lesniewski, R.A.; Oakley, B.B.; Parks, D.H.; Robinson, C.J. Introducing mothur: Open-source, platform-independent, community-supported software for describing and comparing microbial communities. Appl. Environ. Microbiol. 2009, 75, 7537–7541. [Google Scholar] [CrossRef] [PubMed]
  24. Brown, K.; Godovannyi, A.; Ma, C.; Zhang, Y.; Ahmadi-Vand, Z.; Dai, C.; Gorzelak, M.A.; Chan, Y.; Chan, J.M.; Lochner, A. Prolonged antibiotic treatment induces a diabetogenic intestinal microbiome that accelerates diabetes in nod mice. ISME J. 2015. [Google Scholar] [CrossRef] [PubMed]
  25. Yin, J.; Zhang, X.-X.; Wu, B.; Xian, Q. Metagenomic insights into tetracycline effects on microbial community and antibiotic resistance of mouse gut. Ecotoxicology 2015, 24, 2125–2132. [Google Scholar] [CrossRef] [PubMed]
  26. Nobel, Y.R.; Cox, L.M.; Kirigin, F.F.; Bokulich, N.A.; Yamanishi, S.; Teitler, I.; Chung, J.; Sohn, J.; Barber, C.M.; Goldfarb, D.S. Metabolic and metagenomic outcomes from early-life pulsed antibiotic treatment. Nat. Commun. 2015, 6, 7486. [Google Scholar] [CrossRef] [PubMed]
  27. Garcia-Mazcorro, J.F.; Ivanov, I.; Mills, D.A.; Noratto, G. Influence of whole-wheat consumption on fecal microbial community structure of obese diabetic mice. PeerJ 2016, 4, e1702. [Google Scholar] [CrossRef] [PubMed]
  28. Everard, A.; Lazarevic, V.; Gaïa, N.; Johansson, M.; Ståhlman, M.; Backhed, F.; Delzenne, N.M.; Schrenzel, J.; François, P.; Cani, P.D. Microbiome of prebiotic-treated mice reveals novel targets involved in host response during obesity. ISME J. 2014, 8, 2116–2130. [Google Scholar] [CrossRef] [PubMed]
  29. Kim, Y.S.; Kim, J.; Park, S.-J. High-throughput 16s rRNA gene sequencing reveals alterations of mouse intestinal microbiota after radiotherapy. Anaerobe 2015, 33, 1–7. [Google Scholar] [CrossRef] [PubMed]
  30. Yap, I.K.; Kho, M.T.; Lim, S.H.E.; Ismail, N.H.; Yam, W.K.; Chong, C.W. Acclimatisation-induced stress influenced host metabolic and gut microbial composition change. Mol. BioSyst. 2015, 11, 297–306. [Google Scholar] [CrossRef] [PubMed]
  31. Guo, X.; Liu, S.; Wang, Z.; Zhang, X.-X.; Li, M.; Wu, B. Metagenomic profiles and antibiotic resistance genes in gut microbiota of mice exposed to arsenic and iron. Chemosphere 2014, 112, 1–8. [Google Scholar] [CrossRef] [PubMed]
  32. Faith, J.J.; Ahern, P.P.; Ridaura, V.K.; Cheng, J.; Gordon, J.I. Identifying gut microbe–host phenotype relationships using combinatorial communities in gnotobiotic mice. Sci. Transl. Med. 2014, 6, 220ra211. [Google Scholar] [CrossRef] [PubMed]
  33. Wang, J.; Linnenbrink, M.; Künzel, S.; Fernandes, R.; Nadeau, M.-J.; Rosenstiel, P.; Baines, J.F. Dietary history contributes to enterotype-like clustering and functional metagenomic content in the intestinal microbiome of wild mice. Proc. Natl. Acad. Sci. USA 2014, 111, E2703–E2710. [Google Scholar] [CrossRef] [PubMed]
  34. Wexler, H.M. Bacteroides: The good, the bad, and the nitty-gritty. Clin. Microbiol. Rev. 2007, 20, 593–621. [Google Scholar] [CrossRef] [PubMed]
  35. Zhao, Y.; Wu, J.; Li, J.V.; Zhou, N.-Y.; Tang, H.; Wang, Y. Gut microbiota composition modifies fecal metabolic profiles in mice. J. Proteome Res. 2013, 12, 2987–2999. [Google Scholar] [CrossRef] [PubMed]
  36. Zanotti, I.; Turroni, F.; Piemontese, A.; Mancabelli, L.; Milani, C.; Viappiani, A.; Prevedini, G.; Sanchez, B.; Margolles, A.; Elviri, L. Evidence for cholesterol-lowering activity by Bifidobacterium bifidum PRL2010 through gut microbiota modulation. Appl. Microbiol. Biotechnol. 2015, 99, 6813–6829. [Google Scholar] [CrossRef] [PubMed]
  37. Singh, N.; Arioli, S.; Wang, A.; Villa, C.R.; Jahani, R.; Song, Y.S.; Mora, D.; Guglielmetti, S.; Comelli, E.M. Impact of Bifidobacterium bifidum MIMBB75 on mouse intestinal microorganisms. FEMS Microbiol. Ecol. 2013, 85, 369–375. [Google Scholar] [CrossRef] [PubMed]
  38. Park, D.-Y.; Ahn, Y.-T.; Park, S.-H.; Huh, C.-S.; Yoo, S.-R.; Yu, R.; Sung, M.-K.; McGregor, R.A.; Choi, M.-S. Supplementation of Lactobacillus curvatus KY1032 in diet-induced obese mice is associated with gut microbial changes and reduction in obesity. PLoS ONE 2013, 8, 59470. [Google Scholar]
  39. Bull-Otterson, L.; Feng, W.; Kirpich, I.; Wang, Y.; Qin, X.; Liu, Y.; Gobejishvili, L.; Joshi-Barve, S.; Ayvaz, T.; Petrosino, J. Metagenomic analyses of alcohol induced pathogenic alterations in the intestinal microbiome and the effect of Lactobacillus rhamnosus GG treatment. PloS ONE 2013, 8, e53028. [Google Scholar] [CrossRef] [PubMed]
  40. Li, J.; Sung, C.Y.J.; Lee, N.; Ni, Y.; Pihlajamäki, J.; Panagiotou, G.; El-Nezami, H. Probiotics modulated gut microbiota suppresses hepatocellular carcinoma growth in mice. Proc. Natl. Acad. Sci. USA 2016, 113, E1306–E1315. [Google Scholar] [CrossRef] [PubMed]
  41. Chen, H.-L.; Lai, Y.-W.; Chen, C.-S.; Chu, T.-W.; Lin, W.; Yen, C.-C.; Lin, M.-F.; Tu, M.-Y.; Chen, C.-M. Probiotic Lactobacillus casei expressing human lactoferrin elevates antibacterial activity in the gastrointestinal tract. Biometals 2010, 23, 543–554. [Google Scholar] [CrossRef] [PubMed]
  42. Haakensen, M.; Dobson, C.M.; Hill, J.E.; Ziola, B. Reclassification of Pediococcus dextrinicus (coster and white 1964) back 1978 (approved lists 1980) as Lactobacillus dextrinicus comb. Nov., and emended description of the genus Lactobacillus. Int. J. Syst. Evolut. Microbiol. 2009, 59, 615–621. [Google Scholar] [CrossRef] [PubMed]
Figure 1. Experimental scheme of sample preparation for metagenomic study. Three different conditions were used: negative, WT, and TG. Syringes indicate normal oral administration. Orange rods and green shapes indicate Lactobacillus and Lactobacillus expressing 3D8 scFv, respectively. Blue arrows indicate time points for oral administration while red arrows indicate sampling time points of day 0 and day 7. WT: Wildtype; TG: Transgenic
Genes 09 00276 g001
Figure 2. Analyses of sequenced reads in each library and assignment of all filtered reads according to bacterial taxonomy. (A) Number of analyzed reads in each library, (B) number of identified operational taxonomic units (OTUs) in each library, (CE) taxonomical classification of all analyzed reads from 18 libraries according to phylum (C), order (D), and genus (E).
Genes 09 00276 g002
Figure 3. Taxonomical classification of OTUs in 18 samples. The identified OTUs were classified according to class (A) and family (B). Each color bar indicates the relative proportion of identified bacteria.
Genes 09 00276 g003
Figure 4. Rarefaction curves for 18 samples based on the OTUs.
Genes 09 00276 g004
Figure 5. Comparison of identified bacteria in three different conditions based on genus. The identified bacterial genera in each condition were compared at two individual time points of day 0 (A) and day 7 (B) and visualized by Venn-diagram. Orange, gray, and pale red circles indicate N, TG, and WT conditions, respectively. Bacteria genera that were condition specific or commonly identified in two conditions were indicated with number of read counts. For each condition, bacterial genera from three replicates were combined regardless of number of read counts.
Genes 09 00276 g005
Figure 6. Comparison of bacterial species between two different groups. The difference in abundance of bacterial species between two different groups such as (A) N0 vs N7, (B) T0 vs T7, (C) W0 vs W7, and (D) T7 vs W7 were visualized by extended error bar plots implemented in STAMP program. The mean portions (%) and difference between portions were indicated with corrected p values.
Genes 09 00276 g006
Figure 7. Relative abundance of known bacterial genera in three different conditions. Read numbers for 52 known bacteria genera in the same condition were combined. For each condition, the number of reads at day 7 was compared with the number of reads at day 0. The fold changes were converted into log2 and imported into the Genesis program. Hierarchical clustering was performed using the complete linkage method. Red and green colors indicate up- and down-regulation, respectively. A gray color indicates that the number of reads associated with the respective bacterium was 0.
Genes 09 00276 g007
Table 1. Summary of treatment conditions and samples with respective sequencing results.
ConditionDayReplicateAbbreviationTotal Bases (bp)Read Count
N01N0R1117,395,034259,801
2N0R2129,075,064285,466
3N0R3128,072,181283,889
71N7R1102,570,095224,927
2N7R2147,077,671325,948
3N7R3113,530,929250,331
WT01W0R1129,201,892288,118
2W0R2125,601,235278,505
3W0R3140,795,712311,553
71W7R1121,644,286269,049
2W7R2123,340,544271,652
3W7R3148,592,201326,110
TG01T0R1138,288,303305,165
2T0R2107,080,820237,986
3T0R3135,852,937300,959
71T7R1139,324,032307,834
2T7R2131,123,910287,958
3T7R3123,911,242274,262
Samples were harvested from three conditions at two different time points with three biological replicates for each. Group name, sampling time, name of replicate, and abbreviated name for individual sample are provided. In addition, total sequenced nucleotide bases and read counts for each sample by NGS are provided. N: negative; WT: wildtype; TG: Transgenic.
Table 2. Richness estimate and diversity index for gut samples under different diets: community diversity index and richness estimate for 18 samples.
SampleOTUsChao1ShannonSimpsonGoods Coverage
N0R1313352.6675.81425970.95934550.999321705
N0R2266282.2355.06491920.93440730.999626564
N0R3301332.3165.50268270.95501860.999373422
N7R1291338.35.64581940.96550830.999107885
N7R2242264.2354.49747540.90358920.999597926
N7R3275295.3135.41400890.95215030.999518581
W0R1309335.45.41513590.94258950.999424134
W0R22953345.85695450.96702650.999175445
W0R3297332.7695.61029210.9556420.999459148
W7R1319338.8335.63874810.95691660.99931734
W7R2282295.0435.6102850.95727740.999523501
W7R3281307.1055.65194950.96413480.999536245
T0R13203495.84690240.9633160.999508937
T0R2261282.3684.91045040.92285630.99940355
T0R33113205.8106960.96408730.999703967
T7R1305330.5885.6310110.95544370.999512853
T7R2266295.0775.1401590.92310.999554686
T7R3287297.55.71087170.96022130.999632989
OTUs: Operational taxonomic unit is an operational definition of a species or group of species that is often used when only DNA sequence data are available; Chao1: The Chao calculator returns the Chao1 richness estimate for an OTU definition; Shannon: The Shannon index takes into account the number and evenness of species; Simpson: The Simpson index represents the probability that two randomly selected individuals in the habitat will belong to the same species; Goods Coverage: Goods Coverage calculated as C = 1 − (s/n), where s is the number of unique OTUs and n is the number of individuals in the sample. This index gives a relative measure of how well the sample represents the larger environment.
Table 3. Number of sequenced reads for known bacteria species in six conditions.
All *N0N7W0W7T0T7
Lactobacillus paracasei5743 (0.6%)0004790 (2.8%)0953 (0.5%)
Lactobacillus reuteri6120 (0.6%)1068 (0.6%)163 (0.1%)733 (0.4%)2518 (1.5%)1295 (0.8%)343 (0.2%)
Pediococcus acidilactici9702 (0.9%)001409697 (5.3%)
Uncultured bacterium922,984 (89.4%)153,395 (89.3%)158,000 (91.3%)141,368 (86.7%)158,205 (91.6%)152,017 (89.2%)159,999 (88.1%)
Uncultured Bifidobacterium sp.360820530225 (0.1%)0
Uncultured Firmicutes bacterium27514526553847
Uncultured Helicobacter sp.58,145 (5.6%)14,060 (8.2%)9849 (5.7%)16,001 (9.8%)1213 (0.7)13,879 (8.1%)3143 (1.7%)
Uncultured organism2469 (0.2%)594 (0.3%)236 (0.1%)307 (0.2%)260 (0.2%)274 (0.2%)798 (0.4%)
Uncultured Shigella sp.2669 (0.3%)4139168 (0.1%)1843 (1.1%)40538 (0.3%)
Unknown24,294 (2.4%)2473 (1.4%)4628 (2.7%)4437 (2.7%)3852 (2.2%)2703 (1.6%)6201 (3.4%)
Total1,032,761171,727172,967163,133172,738170,517181,679
At the species level, most identified bacteria were assigned as uncultured bacteria. Only a few bacteria species have been identified. Number of reads and percentage of respective bacteria species are indicated. * Six different conditions were used: Negative in Day 0 (N0), Negative in Day 7 (N7), WT in Day 0 (W0), WT in Day 7 (W7), TG in Day 0 (T0) and TG in Day 7 (T7).

