Article

Genomic Regions Associated with Milk Composition and Fertility Traits in Spring-Calved Dairy Cows in New Zealand

by
J. M. D. R. Jayawardana
1,2,
Nicolas Lopez-Villalobos
1,*,
Lorna R. McNaughton
3 and
Rebecca E. Hickson
4
1
School of Agriculture and Environment, Massey University, Palmerston North 4410, New Zealand
2
Department of Animal Science, Faculty of Animal Science and Export Agriculture, Uva Wellassa University, Badulla 90000, Sri Lanka
3
Livestock Improvement Corporation, Private Bag 3016, Hamilton 3240, New Zealand
4
Focus Genetics, 17C Mahia St, Ahuriri, Napier 4144, New Zealand
*
Author to whom correspondence should be addressed.
Genes 2023, 14(4), 860; https://doi.org/10.3390/genes14040860
Submission received: 6 March 2023 / Revised: 27 March 2023 / Accepted: 29 March 2023 / Published: 1 April 2023
(This article belongs to the Special Issue Genome-Wide Identifications: Recent Trends in Genomic Studies)

Abstract

:
The objective of this study was to identify genomic regions and genes that are associated with the milk composition and fertility traits of spring-calved dairy cows in New Zealand. Phenotypic data from the 2014–2015 and 2021–2022 calving seasons in two Massey University dairy herds were used. We identified 73 SNPs that were significantly associated with 58 potential candidate genes for milk composition and fertility traits. Four SNPs on chromosome 14 were highly significant for both fat and protein percentages, and the associated genes were DGAT1, SLC52A2, CPSF1, and MROH1. For fertility traits, significant associations were detected for intervals from the start of mating to first service, the start of mating to conception, first service to conception, calving to first service, and 6-wk submission, 6-wk in-calf, conception to first service in the first 3 weeks of the breeding season, and not in calf and 6-wk calving rates. Gene Ontology revealed 10 candidate genes (KCNH5, HS6ST3, GLS, ENSBTAG00000051479, STAT1, STAT4, GPD2, SH3PXD2A, EVA1C, and ARMH3) that were significantly associated with fertility traits. The biological functions of these genes are related to reducing the metabolic stress of cows and increasing insulin secretion during the mating period, early embryonic development, foetal growth, and maternal lipid metabolism during the pregnancy period.

1. Introduction

New Zealand dairy farming is pasture-based with cows calving in winter (June/July) in each production season. To retain a seasonal calving pattern, dairy farmers aim to maximise the proportion of cows mated and in-calf early in the breeding season to generate more days in milk. In New Zealand, the most common breeds used in dairy farming are Holstein Friesian (F; 32.5%), Jersey (J; 8.2%), and a crossbred of Holstein Friesian and Jersey (F × J; 49.6%) [1]. The milk production of New Zealand dairy cows has increased in recent production seasons due to improvements in management practices and genetic selection for milk production [1]. Since 2001, cow fertility has incorporated national genetic evaluation in New Zealand [2,3]. The New Zealand national averages for 3-wk submission (SR21), conception to first service (PRFS), 6-wk in-calf (PR42) were 81.3%, 52.7%, and 67.7% in the 2020–2021 production season, respectively [1]. Kerslake et al. [4] reported that reproductive failure is the primary cause of cow wastage in New Zealand dairy herds. About 31% of the annual cost of wastage (NZD 7279/100 cows) is associated with cow removal due to the failure to conceive or maintain a pregnancy.
Heritability estimates for fertility traits are low in New Zealand dairy cows (<10%) and antagonistic genetic correlations have been reported between production and fertility traits in New Zealand dairy cows [3,5,6]. The simultaneous improvement of milk production and fertility is difficult to achieve in dairy cattle breeding due to this antagonistic relationship. In this context, genomic selection can be used in dairy cattle breeding programs to improve the rate of genetic gain by increasing the accuracy of genomic breeding values [7,8,9] and reducing the generation intervals [10]. Genomic selection uses the information of genome-wide single nucleotide polymorphisms (SNPs) markers. Ma, et al. [11] reported that the development of genomic selection on fertility traits has stabilised and even reversed the declining trend of cow fertility.
Genome-wide association studies (GWAS) are a powerful tool for detecting genomic regions that explain the genetic variation of phenotypic traits. Identification of fertility-associated quantitative trait loci (QTL) would support the efficiency of genomic selection for fertility traits. Previous studies have identified several QTL regions and functional candidate genes associated with the milk composition and fertility traits of dairy cows in several countries [12,13,14,15,16]. Since 2008, genomically enhanced breeding values have been used for genomic selection in New Zealand dairy cattle [17,18].
In New Zealand, cows that produce milk with more fat and protein are more profitable for dairy farmers because the payment system rewards yields of fat and protein and penalises milk volume. It is important to identify the genomic regions and genes that are associated with fat and protein percentages to improve the genomic breeding values in those traits. The most important measures of the fertility performance of dairy cows are SR21, PR42, and the not in calf rate (NIC) at the end of the breeding season. However, no published GWAS were found in the literature reporting candidate genes associated with SR21, PR42, and NIC. There is little information available on GWAS for fertility traits in spring-calved dairy cows in New Zealand. Though the fertility performance of New Zealand dairy cattle is higher than the Irish, Australian, United Kingdom, and USA dairy cattle populations [19], it is well below New Zealand industry targets (SR21 = 90%, PRFS = 60% and PR42 = 78%) [20], and potentially, the existing fertility breeding values could be enhanced with the use of genomic information.
The objective of the present study was to identify the SNPs and candidate genes affecting milk composition and fertility traits in spring-calved dairy cows milked in Massey University dairy herds in New Zealand.

2. Materials and Methods

2.1. Data

Data from Massey University Dairy 1 and Dairy 4 herds, Palmerston North, New Zealand, were used for this study. Calving, mating, pregnancy diagnosis, herd testing milking dates, lactation yields, and pedigree records of spring-calved dairy cows were extracted from the Livestock Improvement Corporation (LIC), New Zealand. The initial dataset consists of 6931 records of 2270 cows from the 2014–2015 and 2021–2022 calving seasons. Both herds had at least three herd testing milk records per lactation during the study period. The breed distribution was 129 F, 117 J, and 239 F × J cows in Dairy 1 and 430 F, 23 J, and 696 F × J cows in Dairy 4. The management of the cows in Dairy 1 includes full-lactation once-daily milking with minimal supplementary feeding and a low stocking density (2.1 cows/ha). In contrast, the Dairy 4 herd is milked twice daily, with higher levels of supplementary feeding and a greater stocking density (2.8 cows/ha). Data from calving season 2014–2015 in the Dairy 1 herd were excluded from the present analysis because it was the transitional year of changing from milking twice daily to once daily.

2.2. Phenotypic Traits

The milk composition and fertility traits investigated in this study are presented in Table 1.
Fat percentage (FP), protein percentage (PP), and lactose percentage (LP) were calculated for each lactation record as the ratio between fat yield, protein yield, or lactose yield and milk yield multiplied by 100.
The mating start date and mating end date for each calving season were sourced from the LIC database. Cows (n = 161) with mating records outside the mating season in the Dairy 4 herd in the calving season of 2018–2019 were excluded for fertility traits calculation. Those cows were used for other experiments that demanded another mating strategy.
The average mating length of the breeding season was 71.0 days in Dairy 1 and 69.5 days for Dairy 4. Cows (n = 328) that were missing both a pregnancy diagnosis (PD) result and all herd tests after the end of the breeding period were assumed to have left the herd prior to the end of the mating period and were excluded from the analysis. Pregnancy diagnosis results where the foetal age was estimated and where cows were tested between 35–122 days (inclusive) from conception were used. Conception dates were calculated as the date of PD minus the estimated foetal age for cows with a pregnancy status of ‘pregnant’. In some cases, cows (n = 63) with positive PD had estimated pregnancy day counts outside the bounds (<35 days or >122 days) or no estimated foetal age results but calved in the subsequent season. In such cases, conception dates were calculated as subsequent calving dates minus the gestation length of 282 days. The conception date was not calculated for cows (n = 16) with a pregnancy status of ‘pregnant’ but without either estimated foetal age or subsequent calving date. These cows were culled due to mastitis, low production, and udder problems.
Cows (n = 29) with no recorded artificial breeding (AB) inseminations were retained with a penalty date in the analysis. The penalty date was assigned for the first service date as the end of the AB period in each herd within the calving season. The end of the AB period was defined for each herd as the date of the last AB insemination that was not followed by another AB insemination within 7 days [21]. Likewise, cows that had not conceived (n = 787) at the end of the breeding season were included, with a penalty date for conception as the mating end date in each herd plus 21 days [5,22]. The calving interval (CI) was calculated for cows that did not calve in the subsequent calving season but had a positive pregnancy diagnosis (n = 1113). The calving date was assigned as the conception date plus the gestation length of 282 days and the CI was calculated as the assigned calving date minus the calving date in the respective season.
Submission in the first 21 days (SR21) or 42 days (SR42) of the mating season was coded as 1 if a cow had at least one AB record in the first 21 days or 42 days from the start of the mating date, respectively, and 0 otherwise. Pregnant by 21 days (PR21) or 42 days (PR42) was coded as 1 if a cow was pregnant in the first 21 days or 42 days of from the mating start date, respectively, otherwise 0. Only cows whose first service was to AB and within first 21 days from the mating start date were used to determine pregnant to first service (PRFS), which was classified as 1 for cows whose date of first service coincided with their date of conception, and 0 otherwise. Not in calf (NIC) at end of the breeding season was coded as 1 for cows with the last PD outcome ‘empty’ and 0 for cows with the last PD outcome ‘pregnant’. Cows (n = 18) with the last pregnancy status ‘doubtful’ without subsequent calving were also coded as 1. The planned start of calving (PSC) date was calculated for a herd by adding 282 days to the herd’s mating start date in each calving season. If a cow calved less than 21 days or 42 days after the PSC, then 3-wk calving (CR21) or 6-wk calving (CR42) was coded as 1, otherwise 0.
The final phenotypic dataset comprised 6382 records. Five parity classes were defined, cows in their first four parities were considered separately and a parity number of five or higher was grouped into one class. The heterosis coefficient for each cow was calculated using the following equation [23]:
h F × J = α F S α J D + α J S α F D
where h F × J is the coefficient of heterosis between F and J in the progeny; α F S and α J S are the breed proportions of F and J in the sire; and α J D and α F D are the breed proportions of J and F in the dam, respectively.

2.3. Descriptive Statistics

Descriptive statistics for milk production and fertility traits were obtained using the MEANS procedure of SAS package 9.4 (SAS Institute Inc. 2013, Cary, NC, USA).

2.4. Genotypes and Quality Control

DNA was extracted from ear punch tissue samples for genotyping with Illumina Bovine Illumina 50K SNP-chips. The initial genotype data consisted of 1774 cows with 132,154 SNPs during the study period. The SNP & Variation Suite (SVS 8.8 [24]) software was used for quality control. The genotypes recorded in Illumina A/B allele format were converted to 0, 1, or 2, depending on the number of B alleles present at each locus. In the filtering process firstly, SNPs with a call rate ≤ 80% were excluded. Then, individuals with a call rate ≤ 80% or with a minor allele frequency (MAF) ≤ 5% and significant deviation from Hardy–Weinberg Equilibrium (HWE) p values (p < 10−6) were excluded from the dataset. After the quality control steps, a total of 1537 individuals with 42,667 SNPs were selected for association analysis.

2.5. Genome-Wide Association Analyses

The phenotypes used for the GWAS were pre-corrected using fixed effects, covariates, and random effects using the ASReml 4.1 software package [25]. A single-trait animal repeatability model was used to adjust repeated measures in the phenotypes. The models included the fixed effects of herd-year as a contemporary group, parity (1, 2, 3, 4, ≥5), the regression coefficient associated with the proportion of F, the regression coefficient associated with heterosis, and the regression coefficient associated with deviation of the calving date from the median calving date of the herd within the season as a covariate and the random effect of the animal, cow the permanent environment effect, and the random residual.
A genome-wide association analysis (GWAS) using a mixed linear model was used to test associations between individual SNP traits using GCTA software [26].
The following model was fitted for each trait:
y = μ + X β + g + e
where y was the pre-corrected phenotype for the cow, μ was the overall mean, β was the fixed effect of the candidate SNP to be tested for the association, X was the SNP genotype indicator variable coded as 0, 1, or 2, g was the random effect that captures the polygenic effect of the other SNPs with g ~ N 0 , G σ g 2 , where G was the genomic relationship matrix between the cows and σ g 2 was the additive genetic variance explained by markers, and e was the random residual effect with e ~ N 0 , I σ e 2 , where I was the identity matrix of order n = 1537 and σ e 2 was the residual variance. The variance of y was assumed as v a r y = G σ g 2 + I σ e 2 . Diagonal and off-diagonal values of G were calculated as follows:
G j k = 1 m i G i j k
= 1 + 1 m i = 1 m x i j 2 1 + 2 p i x i j + 2 p i 2 2 p i ( 1 p i ) , j = k 1 m i = 1 m ( x i j 2 p i ) ( x i k 2 p i ) 2 p i ( 1 p i ) ,     j k
where G i j k was the estimated genomic relationship between animal j and k at locus i and m was the total number of SNPs (m = 42,667), x i j and x i k were genotypes with the number of copies for reference of the copies and for reference of the allele for the i th SNP j th and k th animal, and p i was the allele frequency of the allele for which the homozygous genotype was coded as 2.
The estimated associations were represented in Manhattan plots in which −log10 (p-values) were plotted against the genomic locations of the markers using qqman package in R software 4.2.1 [27]. The significance threshold values for the GWAS were estimated using Bonferroni multiple-test correction, which adjusts p-values due to the increased risk of a type I error when making multiple statistical tests [28]. The Bonferroni-corrected genome-wide significance threshold was estimated as 0.05/m (0.05/42,667 = 1.17 × 10⁻⁶), which was 5.93 on a −log10 (p-value) scale. Bonferroni correction was considered too conservative; therefore, the suggestive significance threshold was also estimated as 1/m. The p-value threshold for suggestive associations was 2.34 × 10⁻⁵ (1/42,667), which corresponded to 4.63 in the −log10(p-value) scale. The genomic position, allele substitution effect and their standard errors, and the closest gene were described for the SNPs that exceeded the Bonferroni-adjusted p-value thresholds.

2.6. Candidate Genes and Functional Analysis

Potential candidate genes were explored using Ensembl (release 107) (http://www.ensembl.org/index.html, accessed on 10 September 2022) based on the Bos taurus reference genome in ARS-UCD1.2 genome assembly [29]. The individual significant SNPs for each trait were examined to locate the closest genes within 100 kb upstream and downstream from the identified SNP. Gene annotation was recorded if the gene was positioned 5 kb upstream or downstream from the gene boundaries. The biological functions of the associated candidate genes were reviewed using the Gene Ontology (GO) tool in Ensembl.

3. Results

3.1. Descriptive Statistics

Descriptive statistics for the milk composition and fertility traits of the selected cow population are presented in Table 2.
The cows produced on average a 4968 L milk yield, 232 kg fat yield, 188 kg protein yield, and 251 kg lactose yield during the study period. The average intervals for the first AB and conception after the herd’s start of mating dates were 10.9 days and 29.6 days, respectively. A higher proportion of cows were mated within the first 3 weeks and 6 weeks of the mating season (91% and 99%, respectively). Fifty-four % and seventy-six % of the cows conceived in the first 3 weeks and 6 weeks of the mating seasons, respectively, and forty-eight % were pregnant to their first service. Not in calf at the end of the breeding seasons was 12%. The calving by the first 3 weeks and 6 weeks from the PSC was 68% and 91%, respectively.

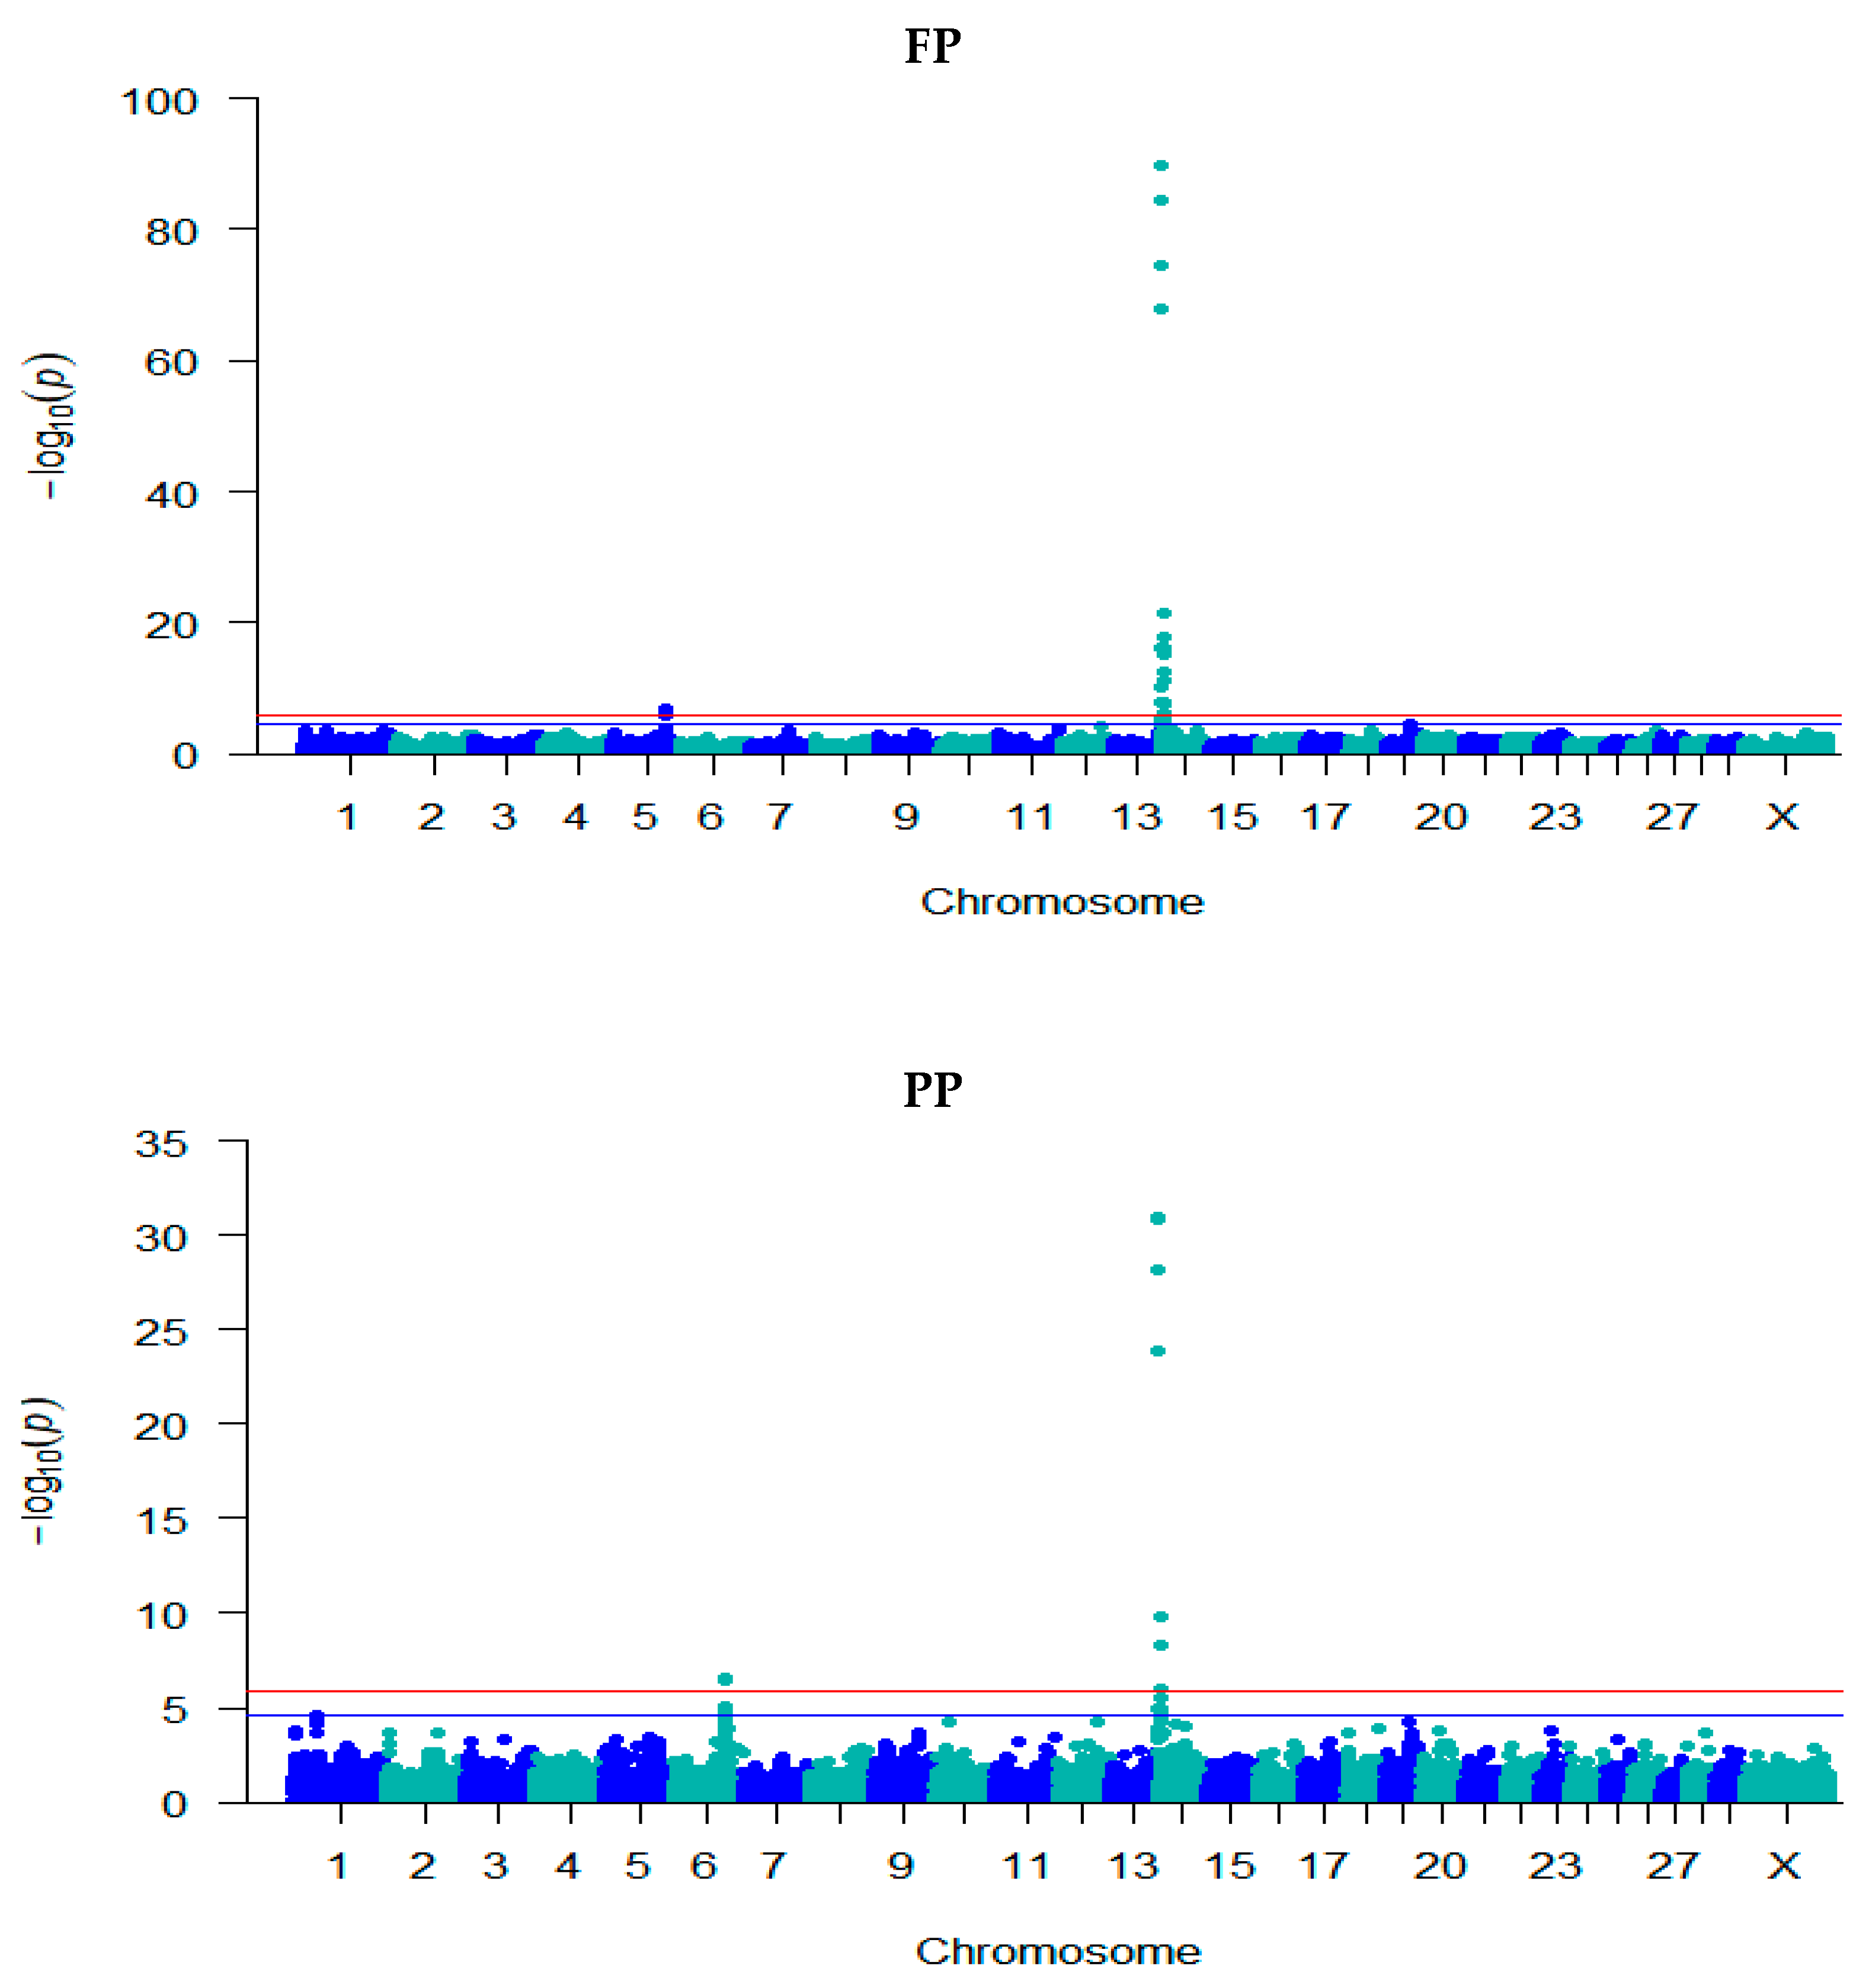
3.2. GWAS for Milk Composition Traits

Figure 1 shows the Manhattan plots for fat, protein, and lactose percentages. The SNPs that surpassed the genome-wide significance p-value threshold (p < 1.17 × 10⁻⁶) with position, allele substitution effect, gene annotation, and candidate gene name are presented in Table 3.
A total of 33 SNPs met the genome wide significance threshold, and they were across the traits FP, PP, and LP. According to the results, 19 SNPs from chromosomes 5 and 14 were significantly associated with FP, 13 SNPs from chromosomes 6 and 14 were significantly associated with PP, and one SNP on chromosome 29 was significantly associated with LP at genome-wide significance threshold. The majority of associations were found on chromosome 14 for both FP and PP. The four top SNPs on chromosome 14 (14:1,736,599, 14:1,765,835, 14:1,801,116, and 14:1,880,378) were highly significant for both FP and PP, with genome wide significance levels of −log10 (p) = 74.5, 84.4, 89.8, and 68.0 for FP and 28.1, 30.8, 31.0, and 23.9 for PP.
The associated SNP markers were annotated to 26 potential candidate genes for FP, PP, and LP at a genome-wide significance level. For both FP and PP, the majority of significant SNPs were mapped to introns (39%), followed by the intergenic regions (21%), missense variants (15%), upstream regions closest to the candidate genes (12%), synonymous variants (9%) and 3 prime UTR (3%). The highly significant peak on chromosome 14 mapped to the DGAT1 gene for FP and PP. The four most significant SNPs for both FP and PP that are located on chromosome 14 introduce a missense variant in the CPSF1 gene, a synonymous variant in the SLC52A2 gene, and an intron of the DGAT1 and MROH1 genes, respectively. Likewise, three significant SNPs on chromosome 14 are located within the intron of the IQANK1, ZC3H3, and RHPN1 genes for both FP and PP. The SNPs that are positioned on 14: 1,653,693, 14: 1,757,935, 14: 2,826,632, and 14: 4,078,923 were annotated upstream of genes FOXH1, ADCK5, LYPD2, and AGO2, respectively.
Two significant SNPs (5: 93,945,738 and 5: 93,949,810) on chromosome 5 for FP were found in the MGST1 gene, located within an intron region of the MGST1 gene. Likewise, four significantly associated SNPs (6:87,390,576, 6:8,7390,612, 6:87,390,673, and 6:87,390,681) on chromosome 6 for PP mapped to CSN3 and those are located on the missense, synonymous, and 3 prime UTR of the CSN3 gene.
Although there were strong peaks on chromosome 14 for both FP and PP, none of the SNPs on chromosome 14 were associated with LP. The single SNP detected a genome widely significant for LP on chromosome 29 and located within the intron of the gene PICALM. In addition, one peak on chromosome 19 was observed and two SNPs on this region were suggestively significant. The SNPs that surpassed the suggestive significance p-value threshold (p < 2.34 × 10⁻⁵) are explained in the Supplementary Materials (Table S1).

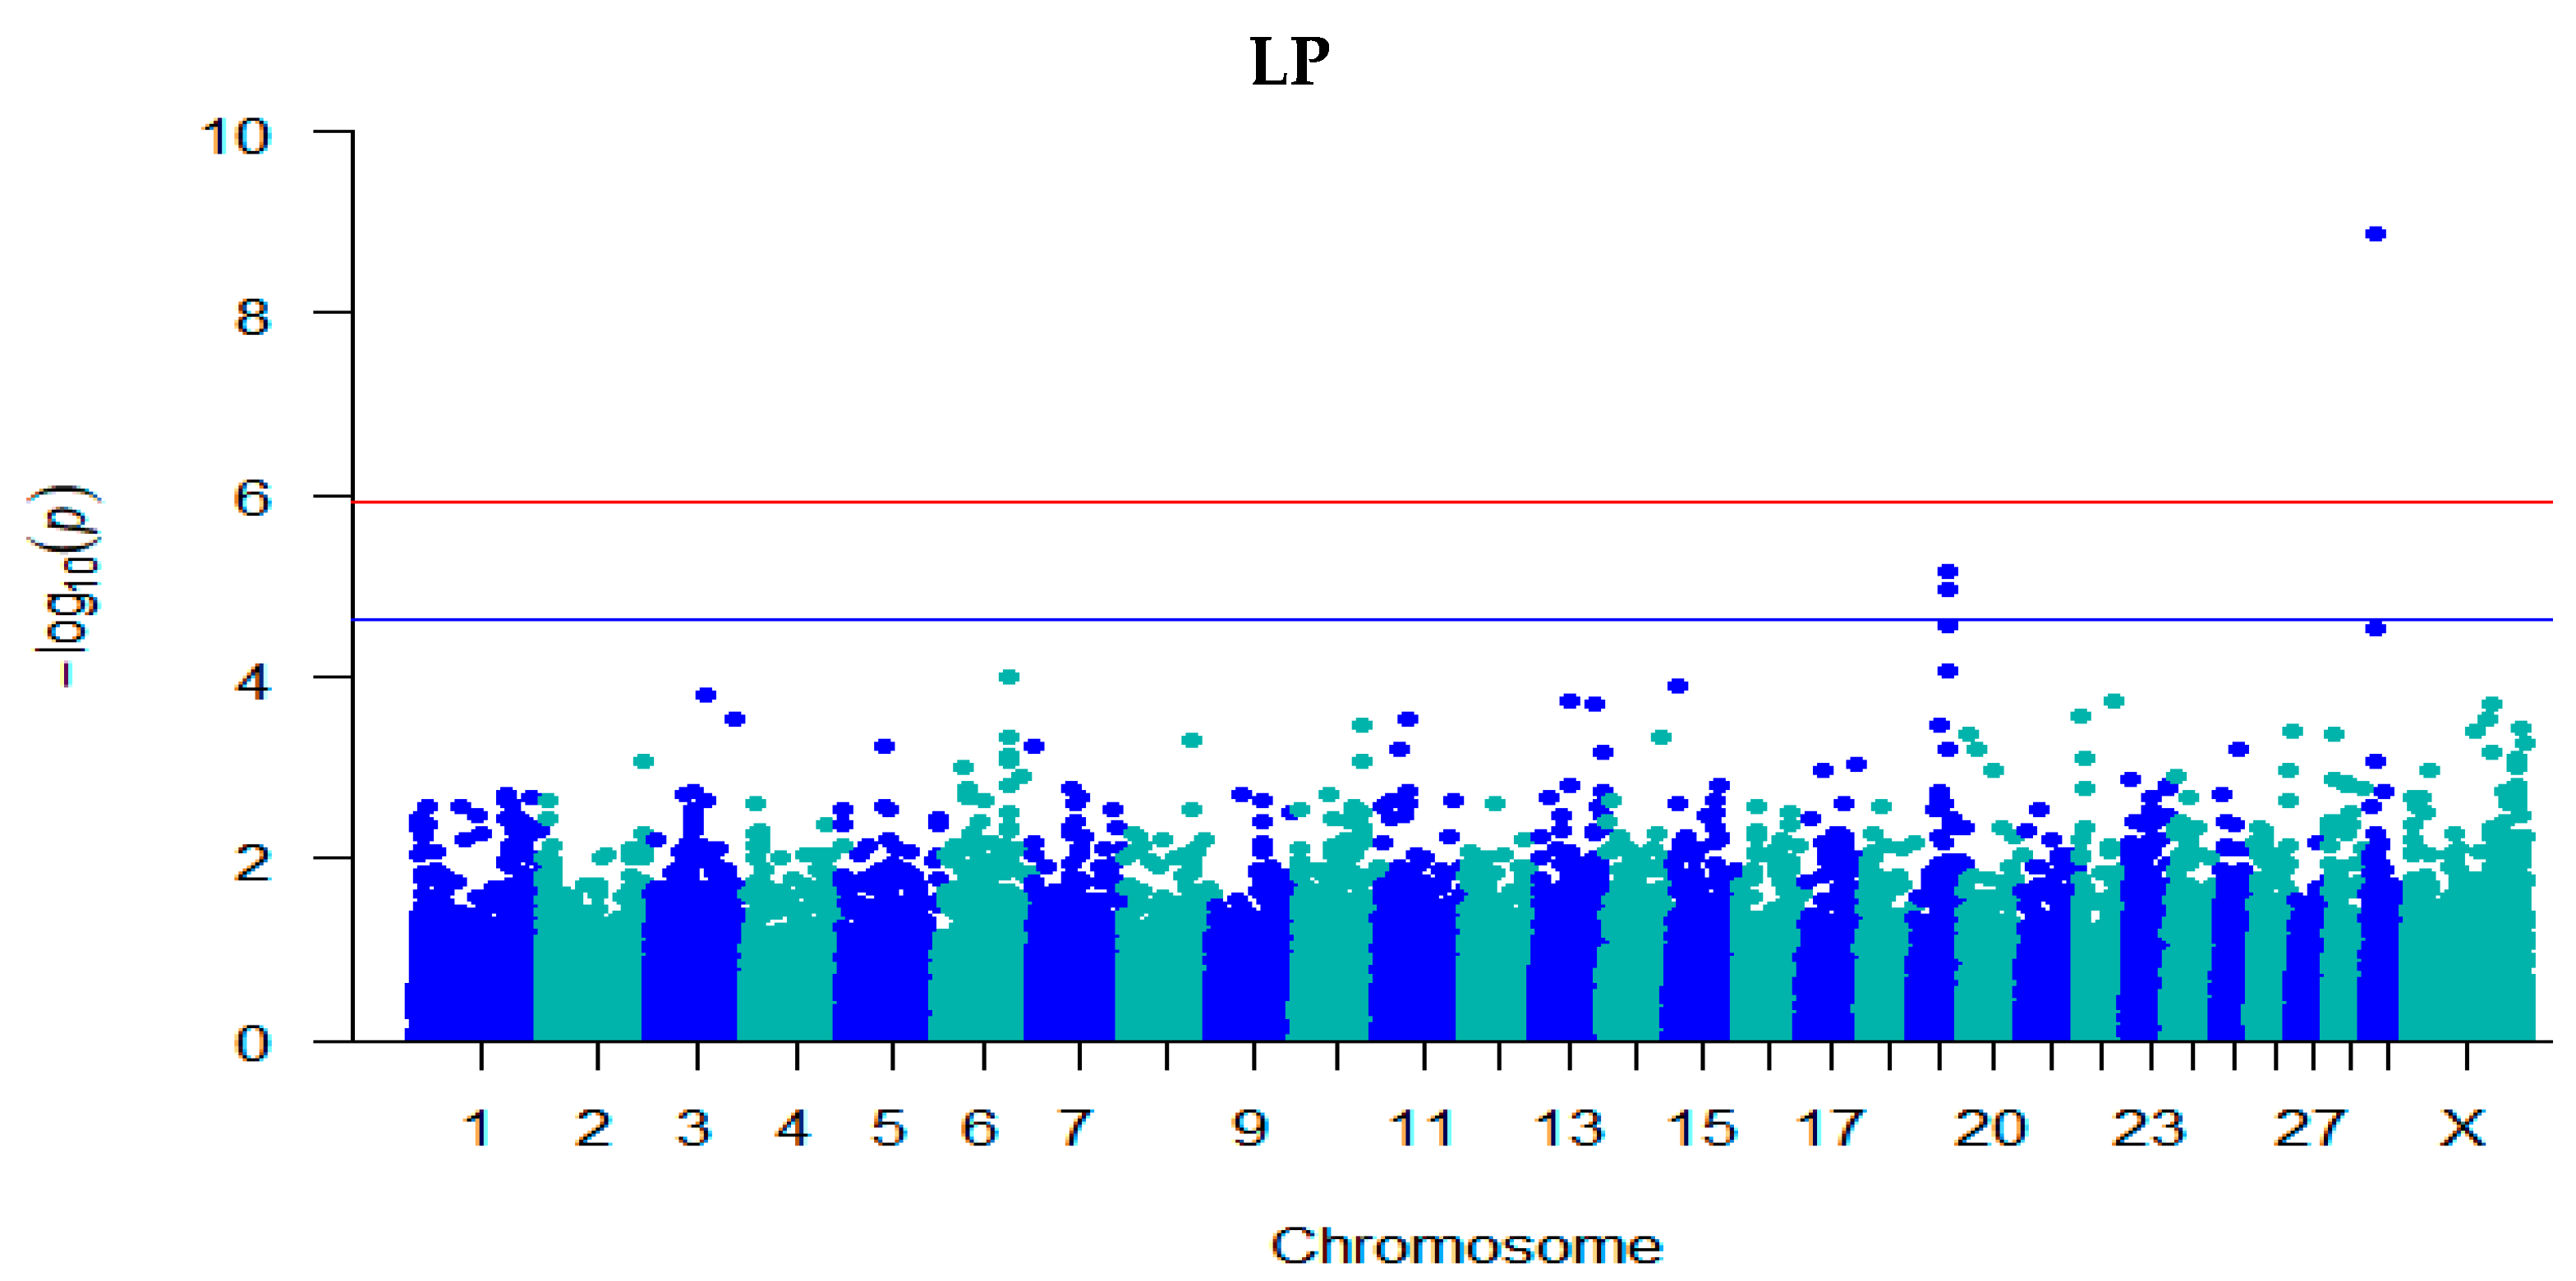
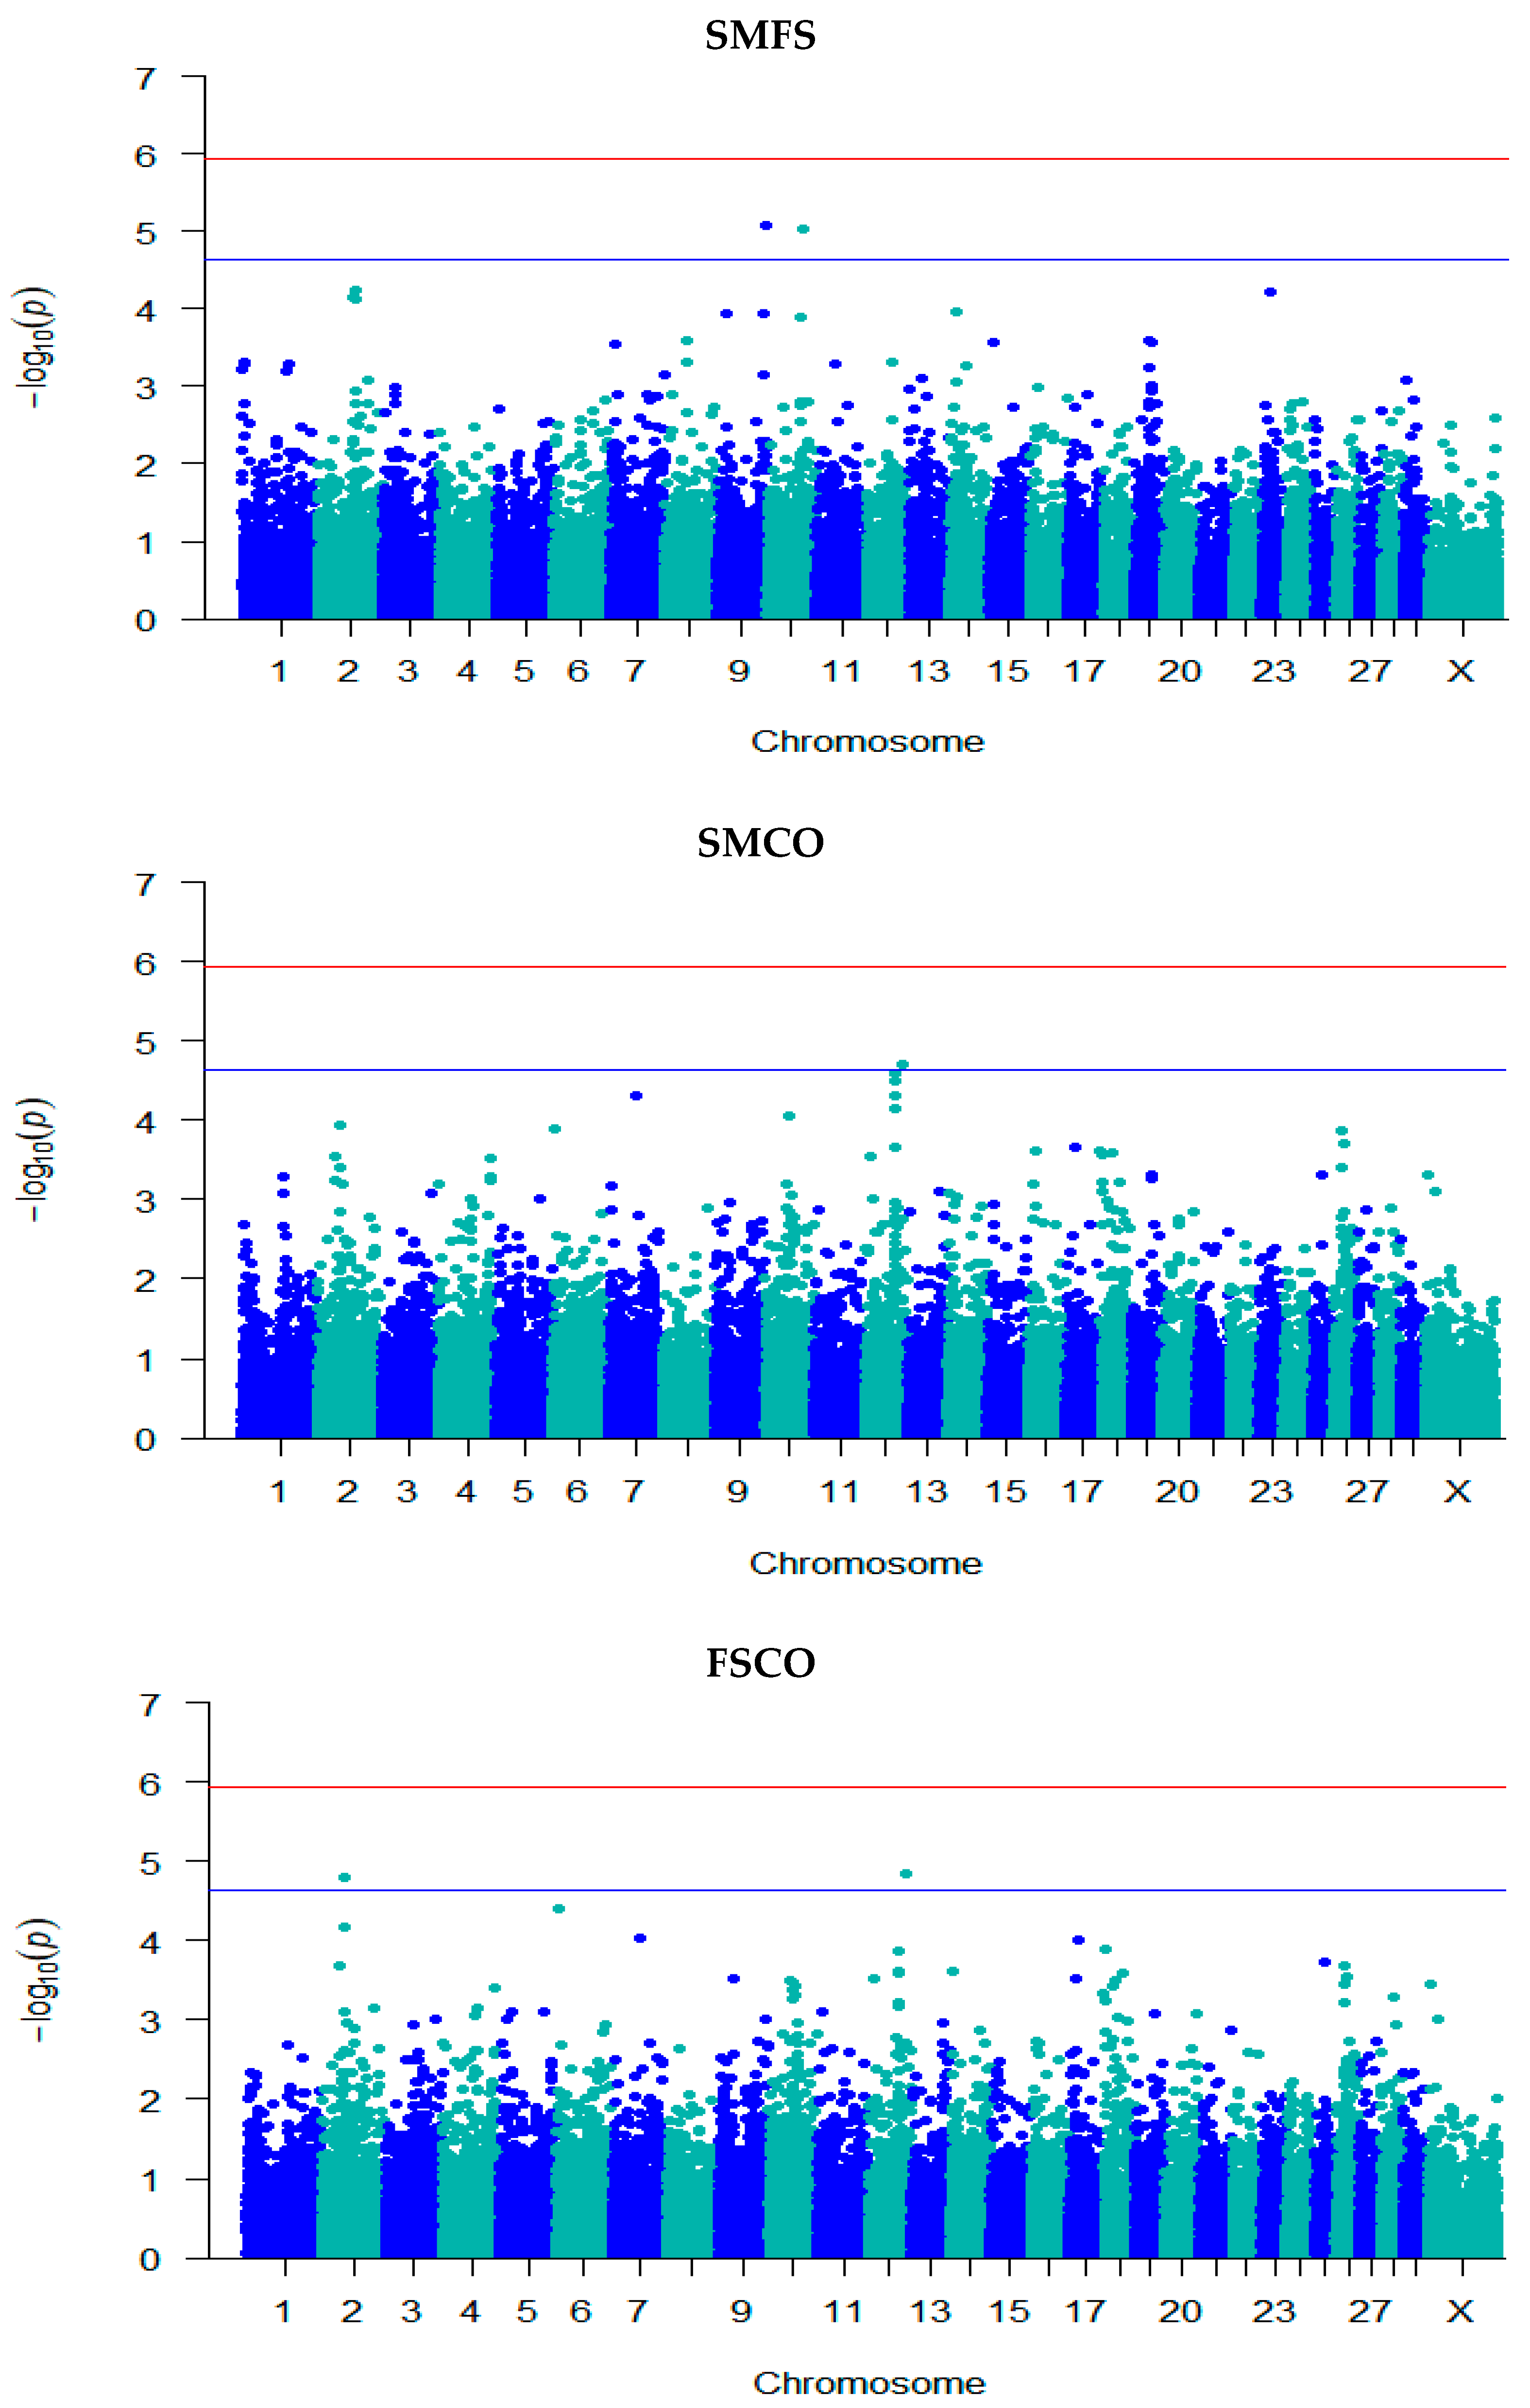
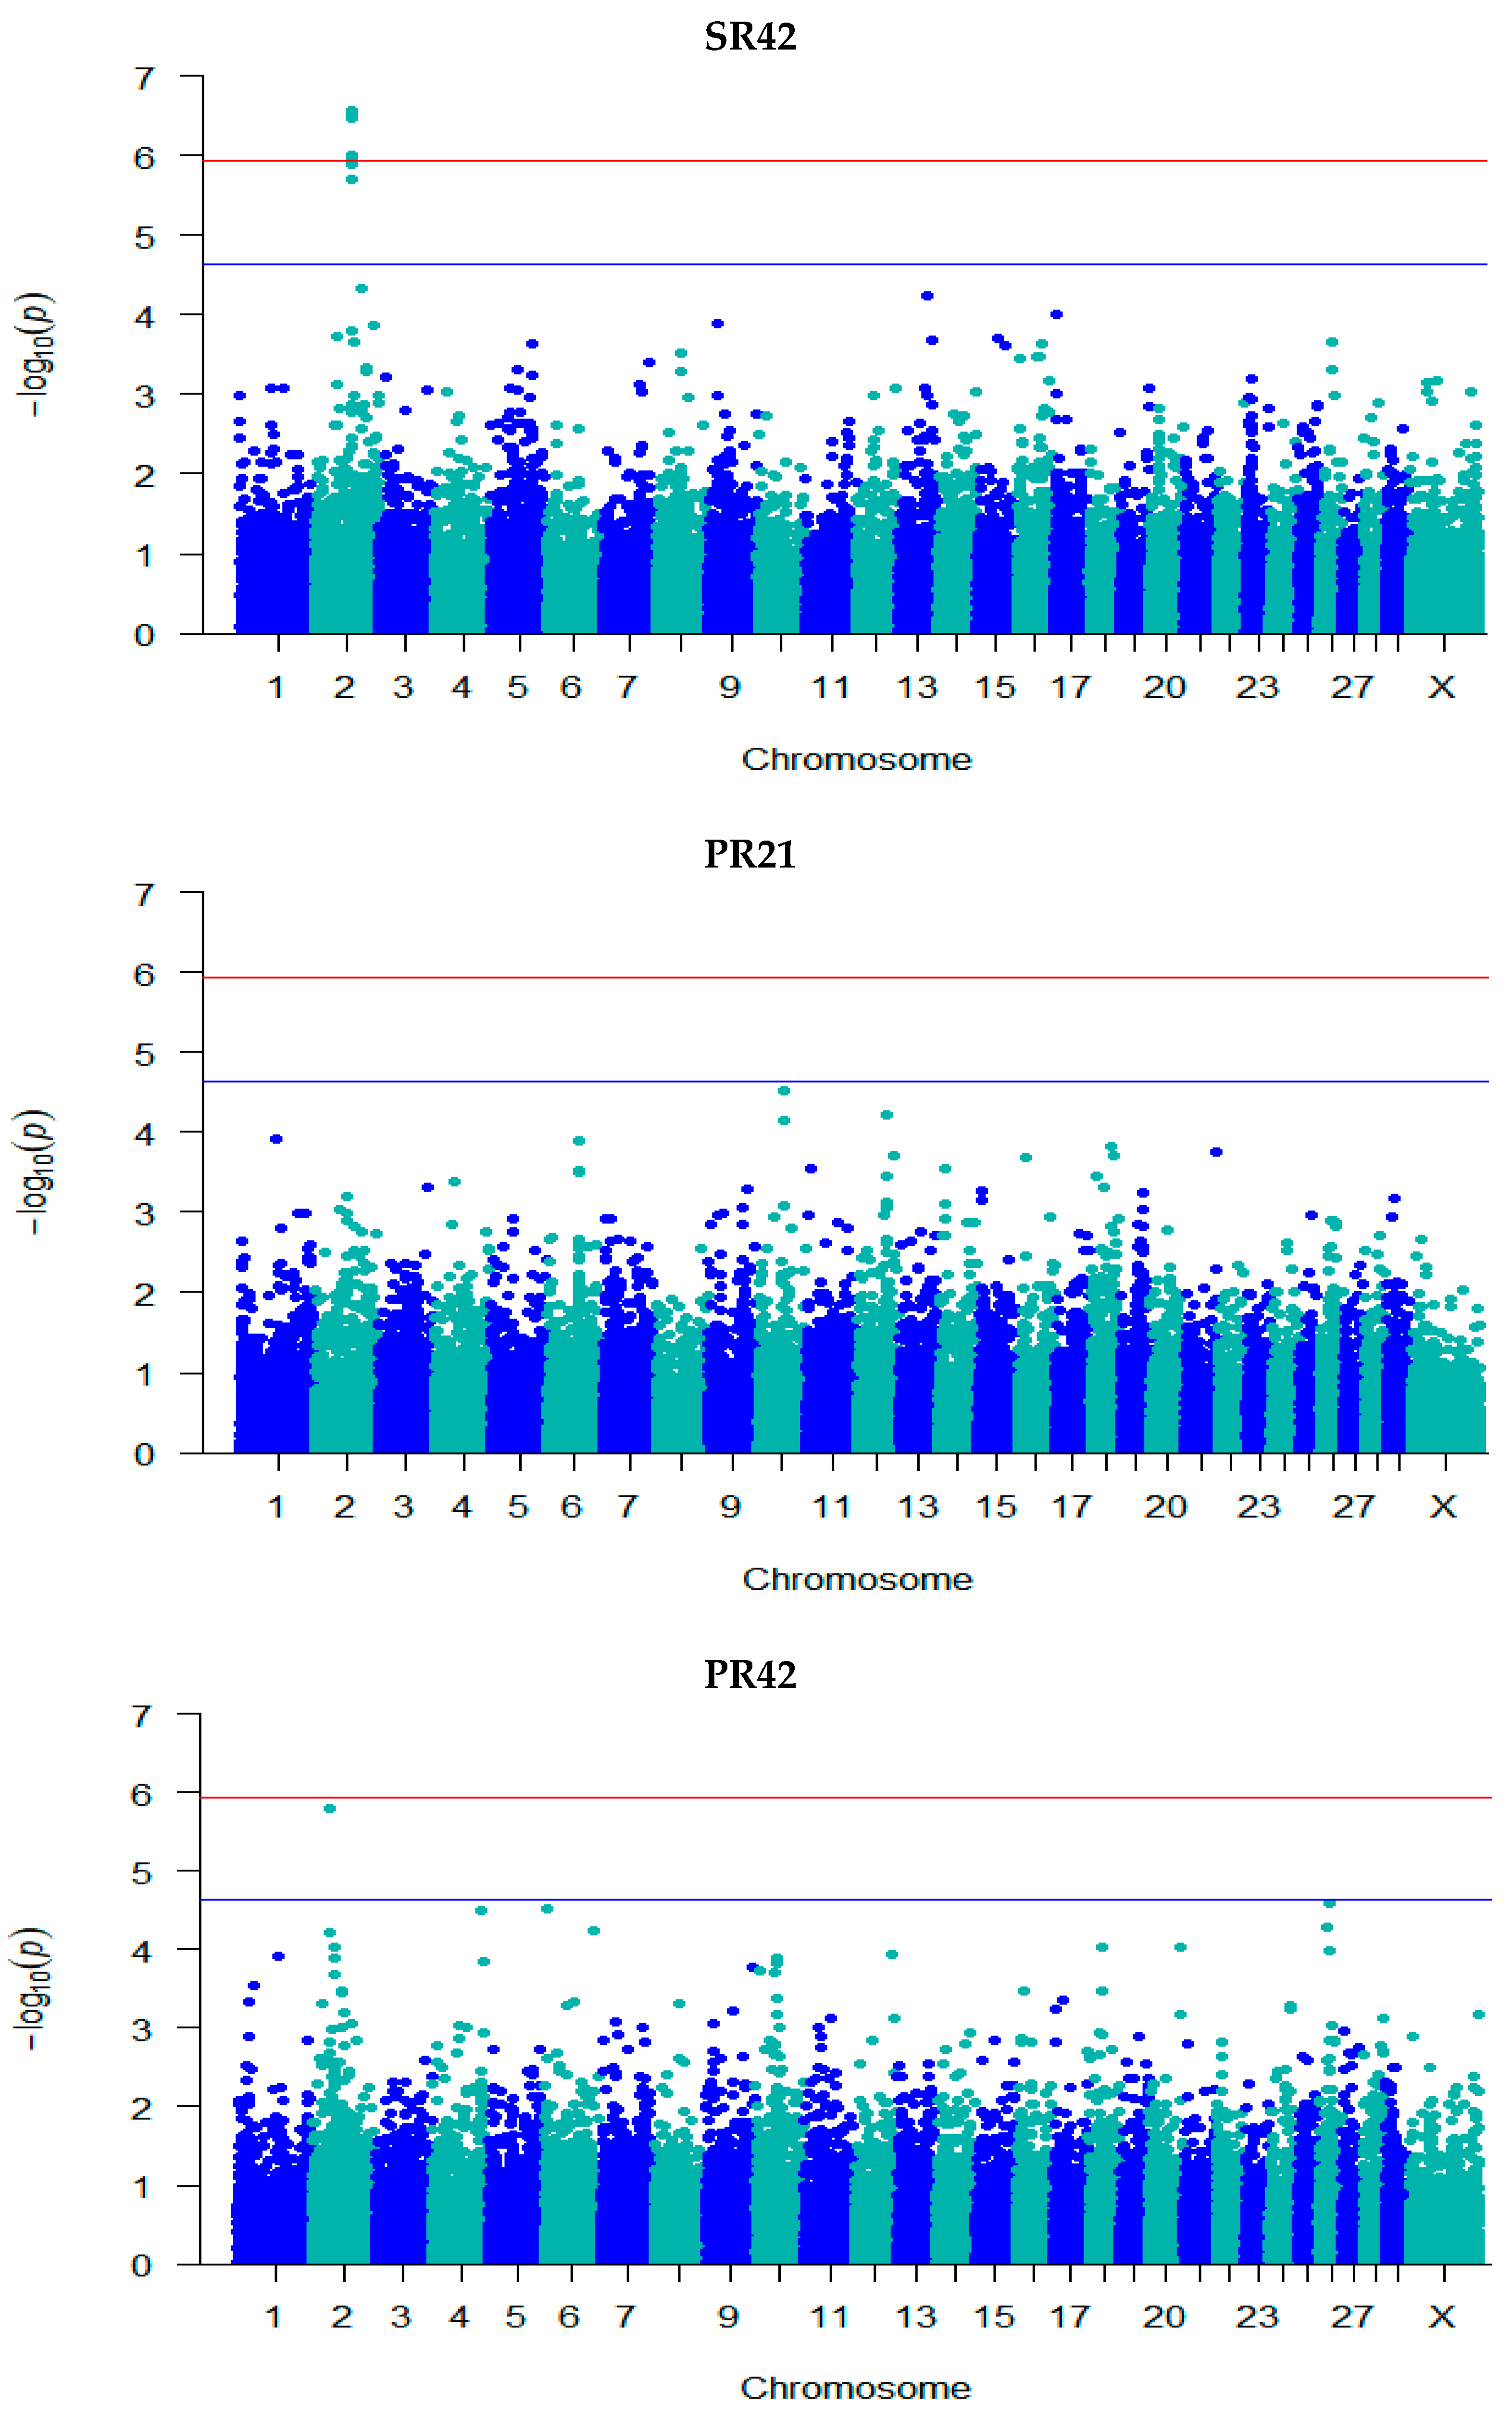
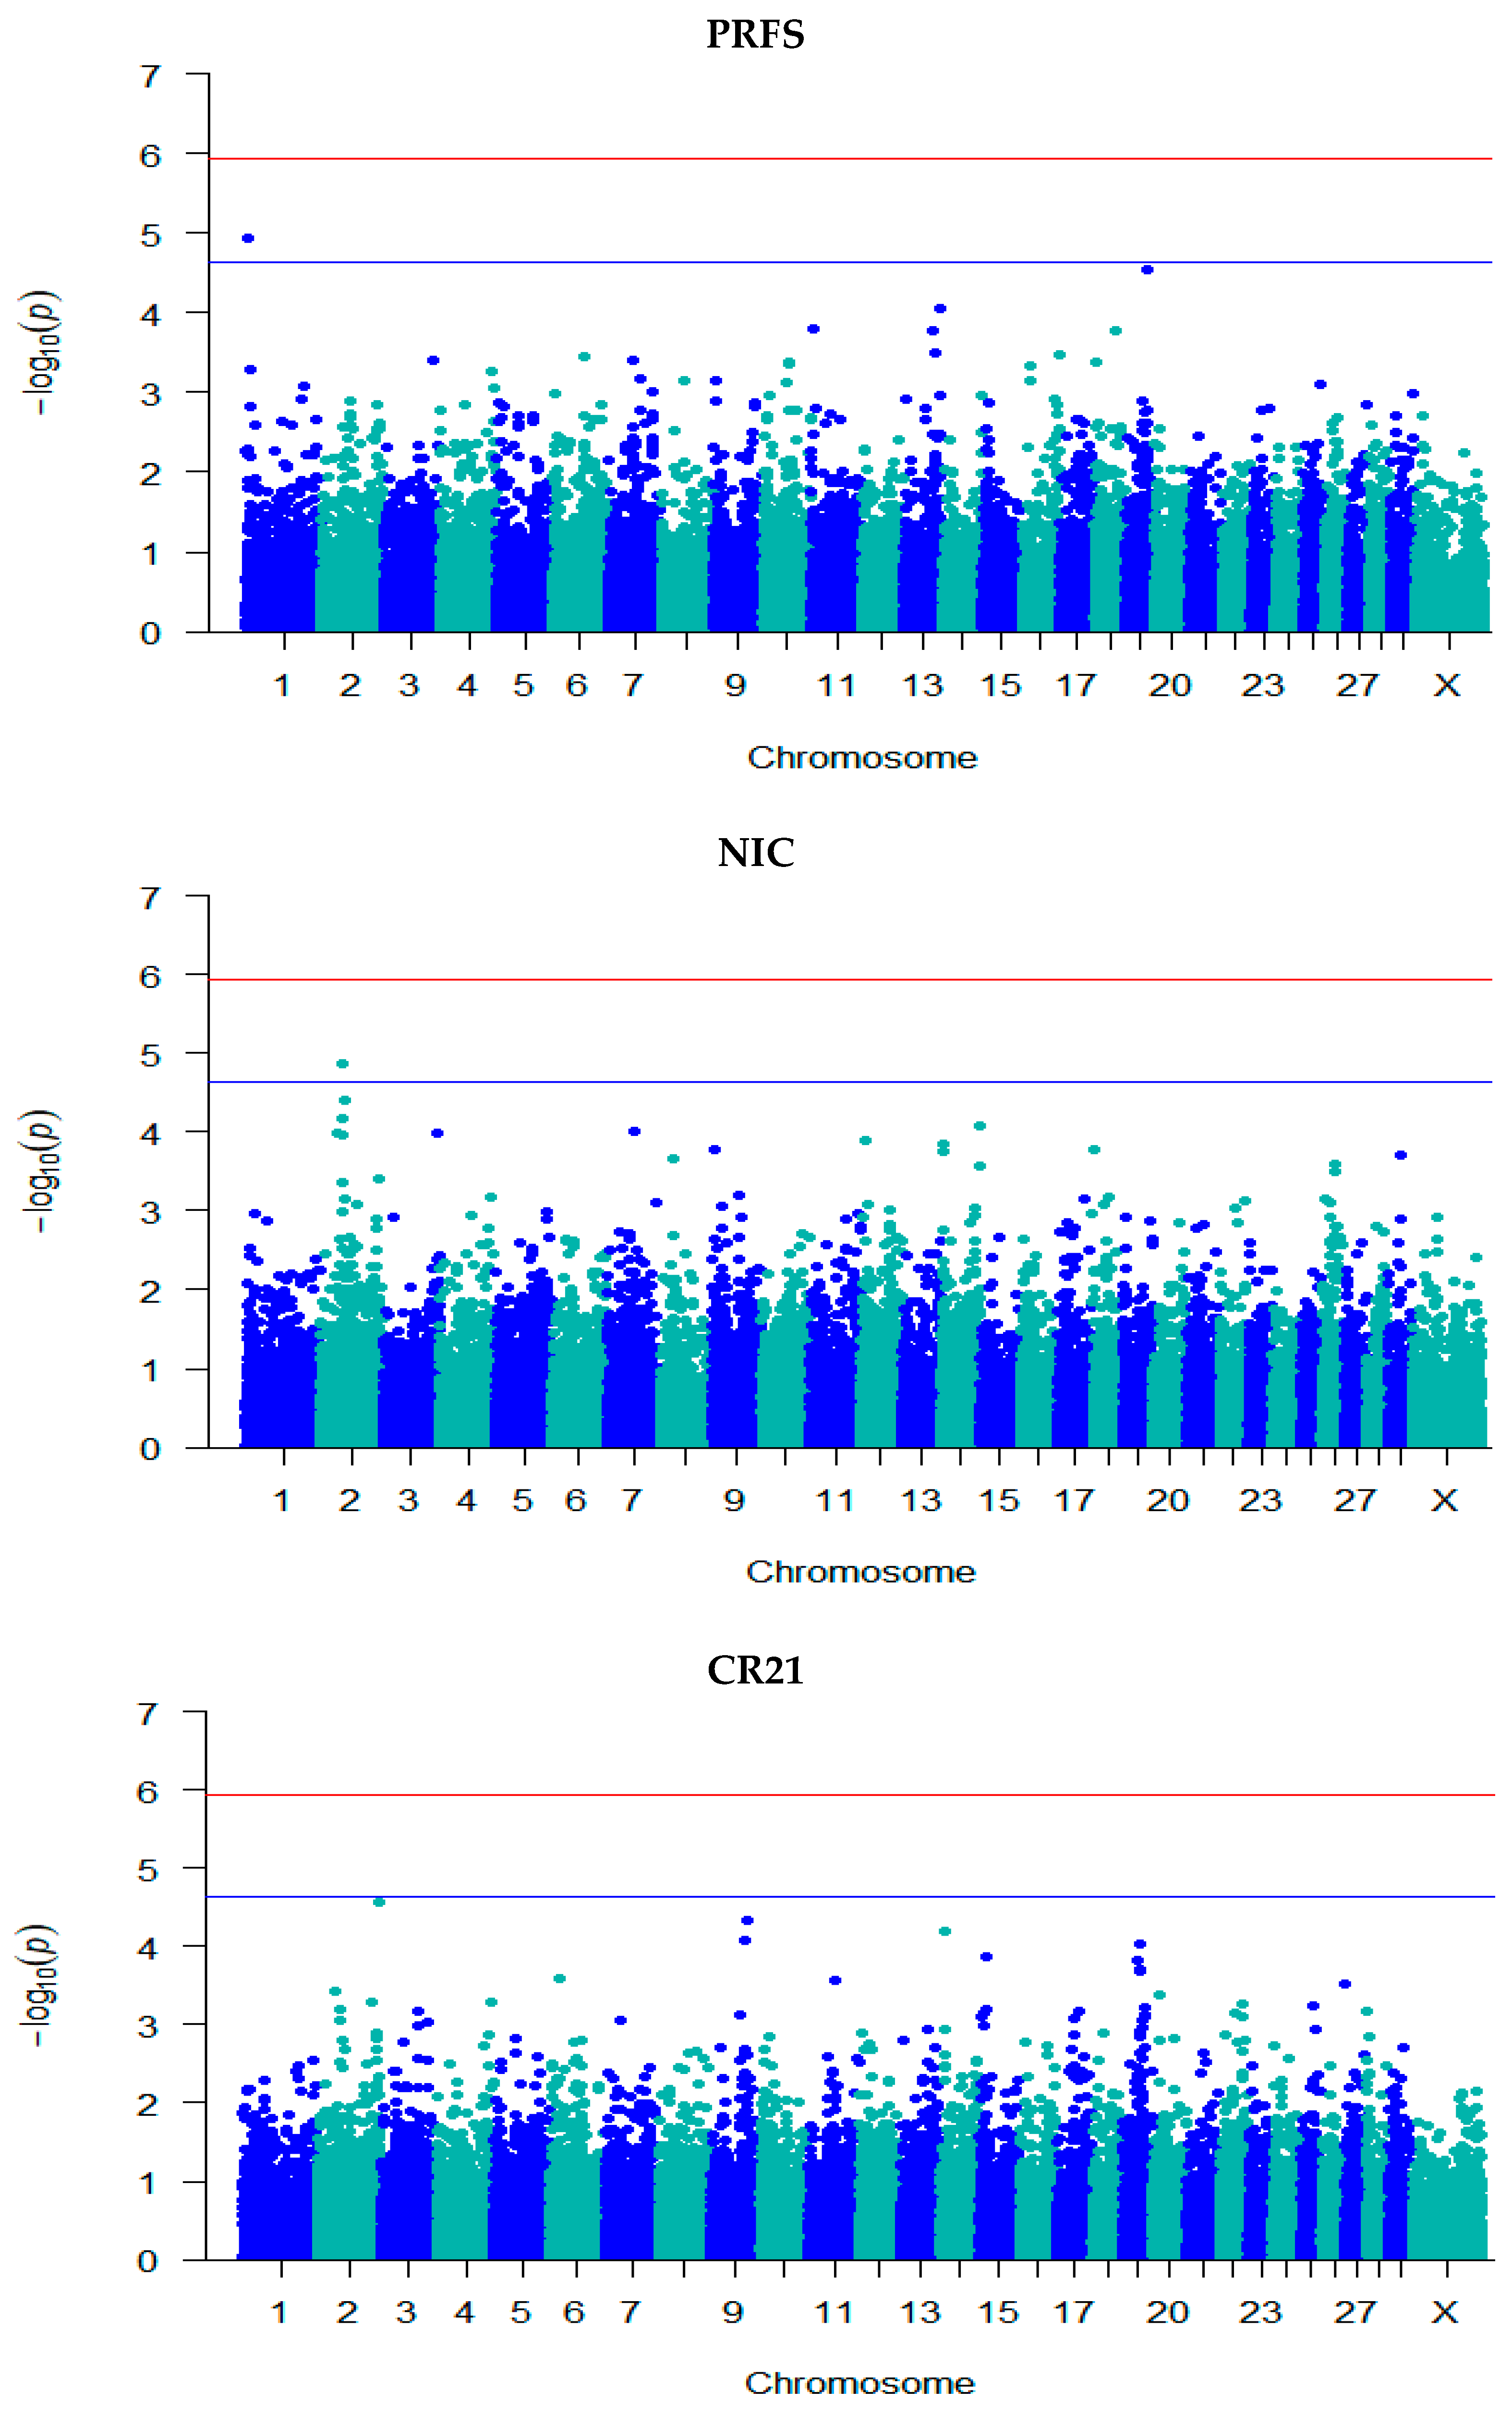
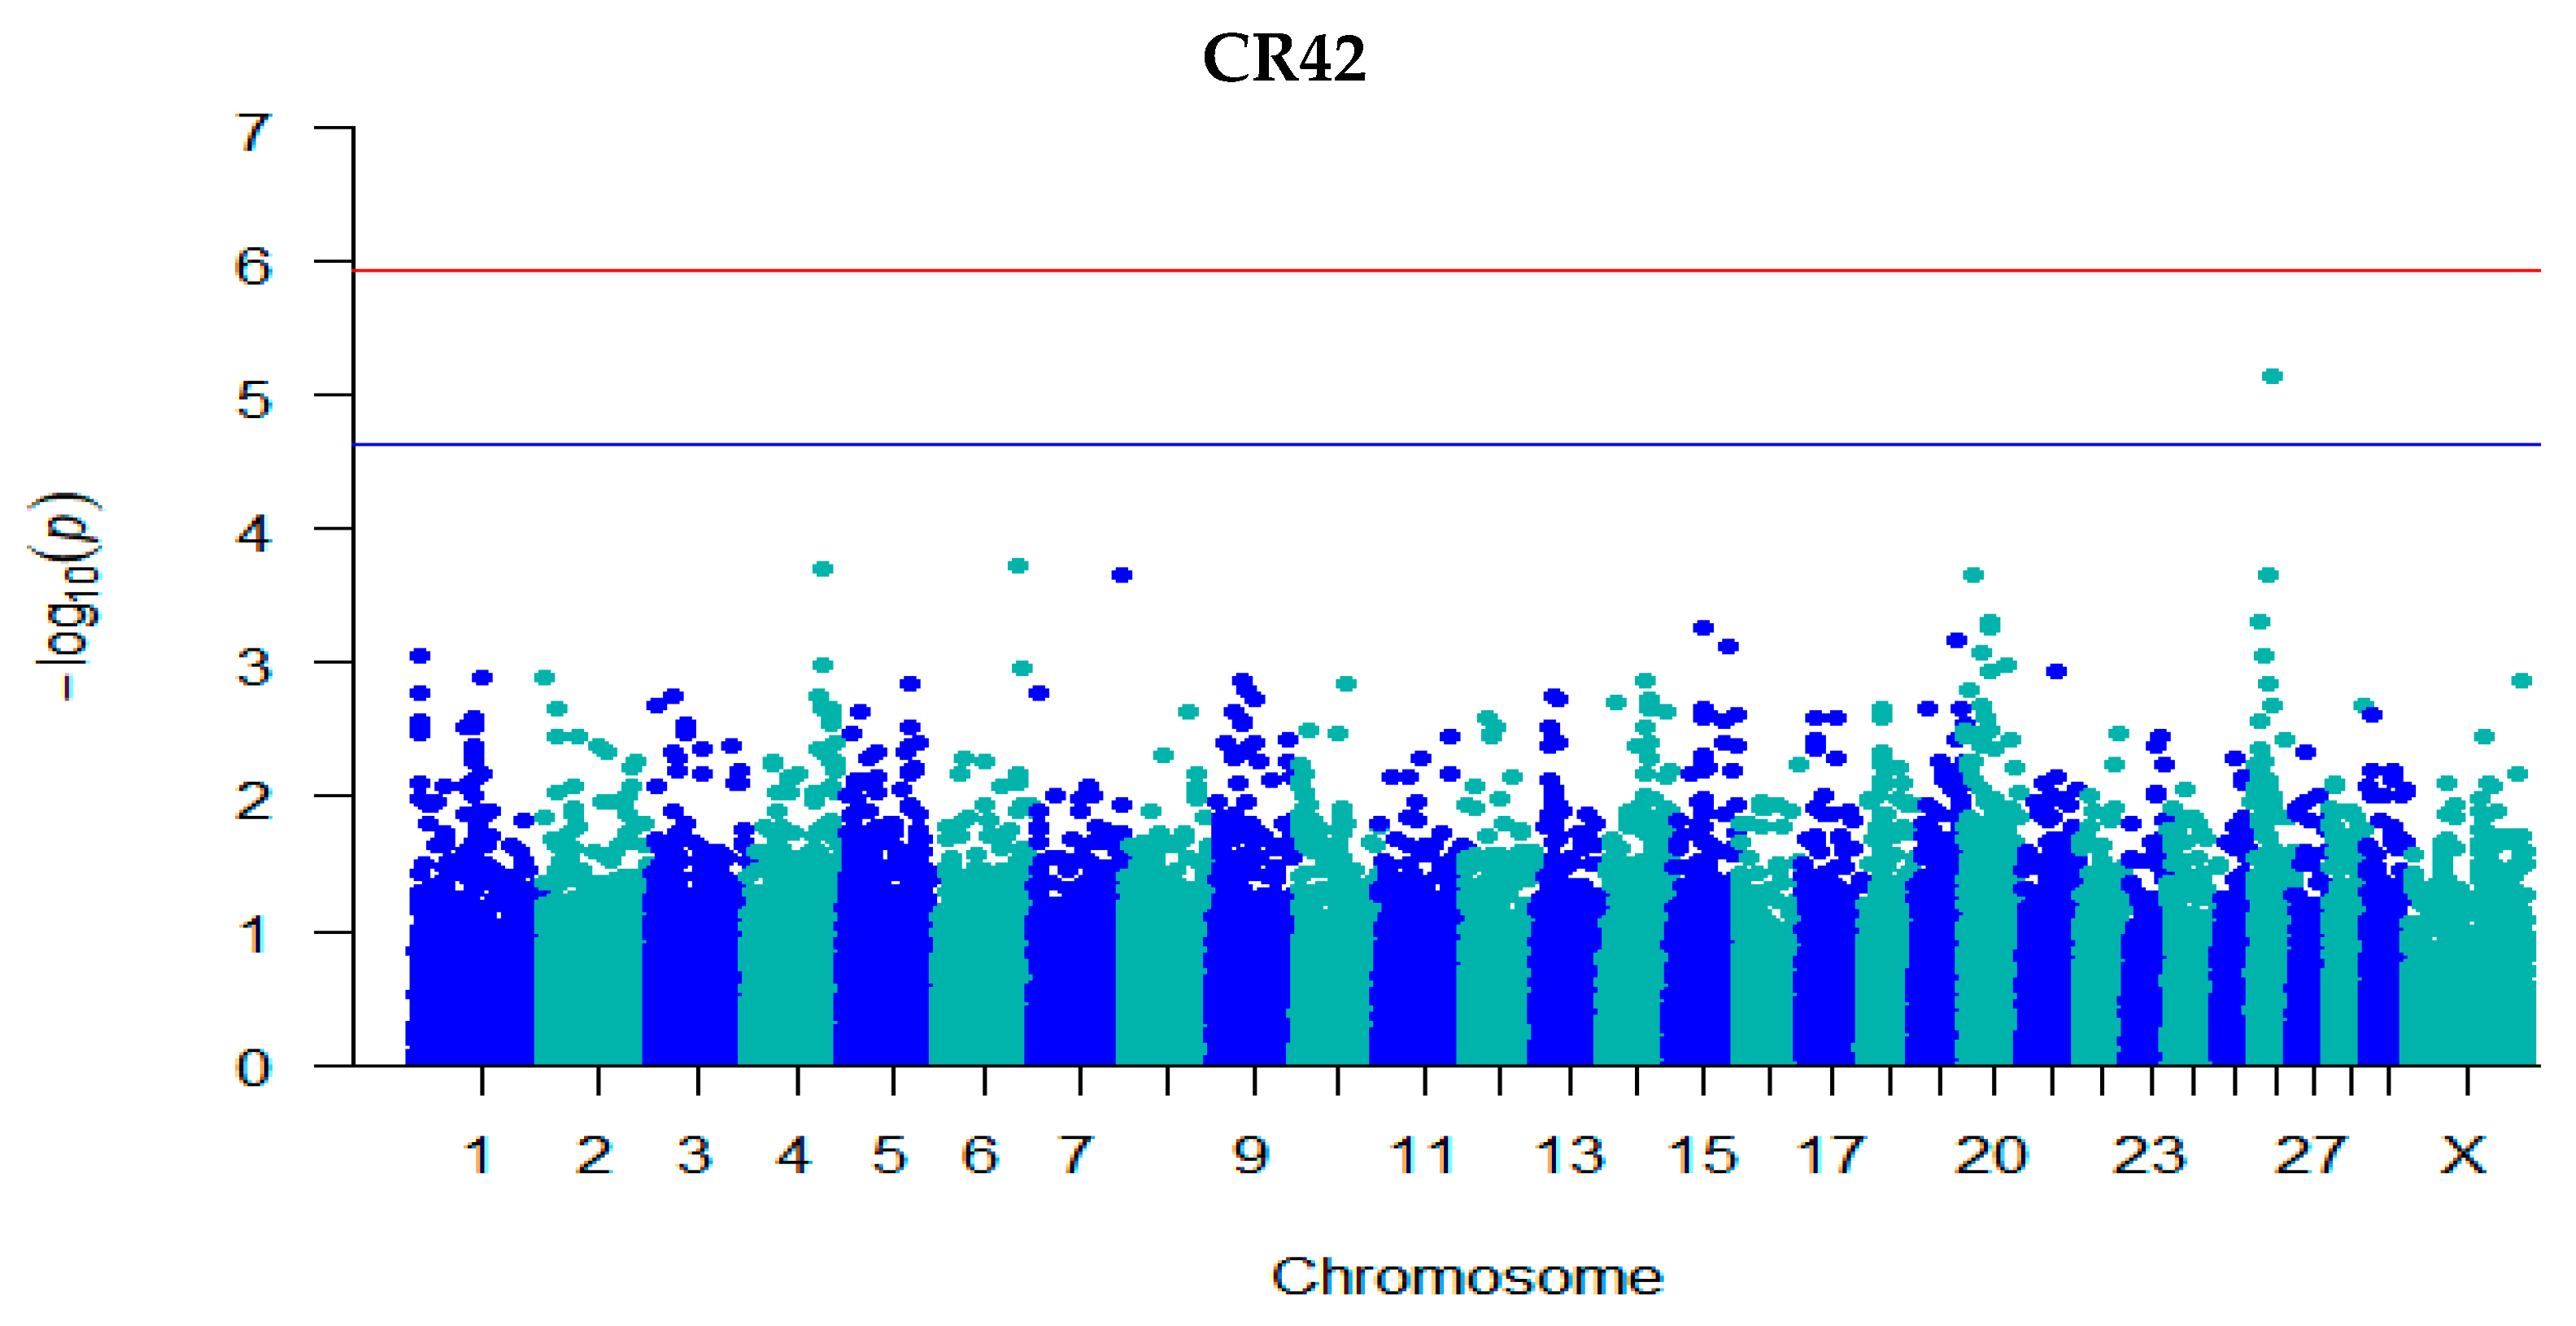
3.3. GWAS for Fertility Traits

The Manhattan plots from the GWAS with fertility traits are shown in Figure 2 and the SNPs that surpassed both genome-wide and suggestive significance thresholds are presented in Table 4 with the position, allele substitution effect, gene annotation, and candidate gene name.
Genome-wide significant associations were found only with the SR42 phenotype. Seven genome-wide significant SNPs (2:79,474,217, 2:79,486,672, 2:79,706,385, 2:79,817,588, 2:79,908,334, 2:79,946,595, and 2:79,975,164) were detected on chromosome 2 for SR42, which are located in intron variants within the genes GLS, ENSBTAG00000051479, STAT1, and STAT4. In total 22 SNPs were found to be associated with SMFS, SMCO, FSCO, CFS, SR42, PR42, PRFS, NIC, and CR42 at the suggestive significant threshold and the most significant SNPs for fertility traits were detected on chromosome 2. The association analysis did not detect any significant SNPs for the traits CI, SR21, PR21, and CR21 either at genome-wide significance or suggestive significance levels.
The significantly associated SNPs were annotated to 10 potential candidate genes on chromosomes 1, 2, 9, 10, 12, and 26. Most of the suggestive significant SNPs for fertility traits were mapped to introns (59%), 36% were mapped to intergenic regions and the remaining 5% were located upstream closest to the genes. The individual SNP 10:75,105,774 was significantly associated with SMFS and CFS and located within intron of the gene KCNH5. Likewise, the SNP at position 12:77,611,452 was significantly associated with both the SMCO and FSCO and mapped within the intron of the gene HS6ST3. Two SNPs on chromosome 2 (2: 39,681,141) and 26 (26: 24,432,758) were detected as significant for PR42, which are positioned within the intron of the gene GPD2 and upstream of the gene SH3PXD2A, respectively. One significant SNP (1: 2,262,097) was identified for PRFS and it is located within the intron of the gene EVA1C. Two significant SNPs for NIC on chromosome 2 were annotated as intergenic variants. The SNP at position 26: 22,526,369 was significantly associated with CR42 and it is located within the intron of the candidate gene ARMH3.

4. Discussion

The present study investigated the genome-wide associations and candidate genes for milk composition and fertility traits using 42,667 SNPs from 1,537 spring-calved dairy cows in two New Zealand herds. Cows milked in both Massey dairy herds had superior fertility performance compared with the national averages for New Zealand dairy cows in the calving season from 2014–2015 and 2021–2022 [1] (SR21 = 78.1–81.3%; PRFS = 52.4–54.2%; PR42 = 65.8–67.8%). Our results for SMFS, SR21, PR21, and PR42 are in agreement with the findings by Rodriguez-Cutzal et al. [30], who reported the fertility traits of SMFS (6.5–11.3 d), SMCO (15.2–21.6 d), SR21(92–98%), PR21(48–68%), and PR42 (74–89%) for the production seasons of 2016 and 2017 in the Massey University Dairy 1 and Dairy 4 herds. We identified 40 SNPs and 73 SNPs that were significantly associated with both milk composition and fertility traits with 32 and 58 potential candidate genes at genome-wide and suggestive significant levels, respectively, in this population.

4.1. GWAS for Milk Composition Traits

A very significant SNP associated with the diacylglycerol O-acyltransferase 1 (DGAT1) gene for both FP and PP in this study is widely reported with milk yield and composition traits in several dairy cattle populations [31,32,33,34]. The DGAT1 gene was reported to be involved in the biological functions of the monoacylglycerol biosynthetic process (GO:0006640), the triglyceride biosynthetic process (GO:0019432), lipid storage (GO:0019915), very-low-density lipoprotein particle assembly (GO:0034379), the long-chain fatty-acyl-CoA metabolic process (GO:0035336), the retinol metabolic process (GO:0042572), the diacylglycerol metabolic process (GO:0046339), the glycerolipid metabolic process (GO:0046486), and fatty acid homeostasis (GO:0055089). The DGAT1 gene plays an important role in triacylglycerol synthesis by catalyzing the formation of an ester linkage between a fatty acyl-CoA and the free hydroxyl group of diacylglycerol [35]; triacylglycerols are the major constituent of milk fat [36].
In addition, we identified three SNPs that are close to DGAT1 and significantly associated with FP and PP in this population. The associated candidate genes are CPSF1, SLC52A2, and MROH1. The genes CPSF1 and SLC52A2 are involved in mRNA polyadenylation (GO:0006378) and riboflavin transport (GO:0032218), respectively. Riboflavin is essential for the metabolism of fats and proteins. The strong association found between a riboflavin transporter gene and FP and PP suggests that the genetic control of riboflavin content is likely related to plasma transport rather than to factors related to microbial metabolism in the rumen. The biological function of the MROH1 gene has not been discovered; the association with FP and PP was identified in previous studies [37,38]. These four candidate genes (DGAT1, CPSF1, SLC52A2, and MROH1) have been previously reported as peak variants for Fourier-transformed mid-infrared wavenumbers with highly significant protein sequence association effects for FP and PP in New Zealand dairy cattle [39].
Other candidate genes identified for FP and PP in this population were IQANK1, ZC3H3, and RHPN1. The gene IQANK1 is related to the regulation of barbed-end actin filament capping (GO:2000812); this gene is a neighbour gene of DGAT1 and has been shown to have causal effects on milk production traits independent of linkage disequilibrium [40]. The gene ZC3H3 is involved in mRNA 3’-end processing (GO:0031124), positive regulation of the activin receptor signaling pathway (GO:0032927), and the regulation of mRNA polyadenylation (GO:1900363), whilst RHPN1 codes negative regulation of stress fiber assembly (GO:0051497). Similar to our findings, Oliveira et al. [41] reported that the genes ZC3H3 and RHPN1 were significantly associated with milk yield in Canadian Holstein and Jersey cattle. We found seven genes (DGAT1, CPSF1, SLC52A2, MROH1, IQANK1, ZC3H3, and RHPN1) that are significantly associated with both FP and PP in this population. This suggests that genes that influence multiple traits are likely to be the main source of genetic correlations between traits. The results of the SNP-marker-trait associations in the present study corroborate the strong positive genetic correlation (+0.72) between FP and PP in New Zealand dairy cows [42].
We found four significant SNPs on chromosome 14 for FP that are located upstream of the genes FOXH1, ADCK5, LYPD2, and AGO2. The associations of these genes with FP have not been identified in the New Zealand dairy cow population previously. The FOXH1 gene is a member of the family Forkhead box (Fox) O1, which is a primary transcription factor in glucose metabolism, in the regulation of hepatic lipid metabolism [43]. The association of FOXH1 with milk fatty acids composition, fat yield, and FP has been well documented in previous studies [15,44,45,46]. The biological functions of the genes ADCK5 and LYPD2 are unknown, but Ibeagha-Awemu et al. [47] reported that the candidate gene ADCK5 was associated with FP in Canadian Holstein cows whereas the LYPD2 gene was associated fat yield in polish Holstein Friesian bulls [48]. The biological functions of AGO2 are mostly related to the microRNAs (miRNAs) process (GO:0035196) and the miRNA metabolic process (GO:0010586), which regulate gene expression. A genome-wide association study by Freitas et al. [49] has shown that AGO2 is associated with short-chain, medium-chain, long-chain, saturated, and unsaturated milk fatty acid groups in North American Holstein cattle. The candidate genes CPSF1, SLC52A2, MROH, IQANK1, ZC3H3, RHPN1, FOXH1, ADCK5, LYPD2, and AGO2 found on chromosome 14 in this study could be used as a basis of linkage disequilibrium studies in the future to test whether any of these genes that neighbour DGAT1 are associated with variation in the milk fat percentage of New Zealand dairy cattle and to test the candidate status of DGAT1.
The MGST1 gene on chromosome 5 is associated with FP and has biological functions related to glutathione transport (GO:0034635), cellular oxidant detoxification (GO:0098869), and the cellular response to lipid hydroperoxide (GO:0071449), which is the highly reactive primary oxygenated product of polyunsaturated fatty acids. The functional relationship of this gene with FP has not previously been identified in New Zealand dairy cattle; however, an association study by Lopdell et al. [50] reported that MGST1 is a strong candidate gene for lactose yield in New Zealand dairy cows. The CSN3 associated with PP is in the casein gene family and improves milk protein quality and cheese production. This gene has biological functions related to regulating milk secretion from the mammary glands (GO:0007595) and protein stabilization (GO:0050821). We identified three SNPs on chromosomes 19 and 29 that were associated with LP. This supports previous association studies in New Zealand [39,50]. The most significant SNP was in the intron of the PICALM gene on chromosome 29 for LP and biological functions mostly code endocytosis activity (GO:0006897), receptor-mediated endocytosis (GO:0006898), and the regulation of endocytosis (GO:0030100). The functional relationship of the PICALM gene with milk protein content and cheesemaking properties has previously been reported in French dairy cows [51,52].

4.2. GWAS for Fertility Traits

We focused on both interval and binary fertility traits for association analysis in the present study since minimising the intervals from the start of mating to the first service and the start of mating to conception are key drivers of reproductive outcomes in seasonal calving systems. We found that the candidate gene KCNH5 is associated with SMFS and CFS in this population, which has not been previously reported with these two traits. KCNH5 codes ion transport (GO:0006811), potassium ion transport (GO:0006813), and potassium ion transmembrane transport (GO:0071805). Potassium is an essential micromineral component for the reproduction of early lactation dairy cows to counter metabolic acid load during heat stress [53].
Our results indicate that the candidate gene HS6ST3 is associated with SMCO and FSCO. The biological function of HS6ST3 is related to the heparan sulfate proteoglycan biosynthetic process (GO:0015012) and the heparan sulfate proteoglycan biosynthetic process with enzymatic modification (GO:0015012). Previous studies on heparan sulfate biosynthesis have revealed that heparan sulfate proteoglycans and their binding proteins play a critical role in embryonic development and growth factors [54,55,56]. Itoh and Sokol [57] demonstrated that heparan sulfate proteoglycans participate in gastrulation and mesoderm formation in the early embryo. Thus, associations of this gene with the early-stage conception-related traits of cows support the findings of improved fertility performance in this population. No previous study has identified the association of this gene with the fertility traits of dairy cows, but associations have been reported with this gene and fat yield of Italian and Swiss Brown Swiss dairy cows [58], fatty acids composition [59,60], and mastitis resistance traits in Holstein dairy cows [61].
Our results identified that four genes (GLS, ENSBTAG00000051479, STAT1, and STAT4) located on chromosome 2 are associated with SR42. However, none of those genes were associated with SR21. We do not have an explanation for this finding. The biological functions of GLS and ENSBTAG00000051479 are similar and related to glutamate biosynthetic processes (GO:0006537), glutamine metabolic processes (GO:0006541), and glutamine catabolic processes (GO:0006543). Glutamine is synthesised from glutamate, via glutamine synthetase [62]. Glutamine occupies a central role linking energy and protein metabolism whereas glutamine and glutamic acid are the most abundant amino acids in milk protein [63]. The infusion of glutamine has also been shown to modulate the immune response [64]. Metabolic stress in early lactation has been identified as a risk factor associated with a delayed return to ovarian cyclicity and the decreased fertility of dairy cows [65,66]. While a direct mechanism linking glutamine with reproductive outcomes has not been identified, we know that glutamine plays a critical role as a signaling molecule in amino acid- and glucose-stimulated insulin secretion and enhancing sensitivity to insulin [67,68]. The early lactation period of dairy cattle is characterised by a severe negative energy balance, with lower blood glucose and insulin concentrations and higher blood GH concentrations [69]. We hypothesis that GLS and ENSBTAG00000051479 promote increased insulin concentrations and potentially reduce the negative energy balance of dairy cows during early lactation.
Previous literature links STAT genes with reproductive outcomes in dairy cattle [70,71,72]. STAT1 and STAT4 are two genes of the STAT family that code for signal transduction (GO:0007165), the regulation of transcription activity (GO:0006355), and cytokine-mediated signaling pathways (GO:0019221). STAT genes are the main drivers of the growth factors, cytokines, and hormones involved in reproductive processes [73]. STAT1 plays a key role in activating the JAK/STAT signaling pathway, which regulates early embryonic development of dairy cattle [72]. STAT genes are involved in the regulation of implantation, establishing uterine receptivity, and regulation of the maternal immune response during pregnancy [74]. Khatib et al. [70] revealed that STAT1 was related to fertilization and early embryonic survival rates in Holstein cattle. Associations of STAT1 and STAT4 with milk production traits have also been reported in Holstein dairy cows [75,76]. Further investigations with a larger dataset are warranted to determine whether any of these genes are associated with pregnancy-related traits (PR21, PR42, and PRFS) in dairy cows in seasonal calving systems.
Two candidate genes, GPD2 and SH3PXD2A located on chromosomes 2 and 26, respectively, were associated with PR42 in this population. The gene GPD2, glycerol-3-phosphate dehydrogenase 2, catalyzes the conversion of glycerol-3-phosphate to dihydroxyacetone phosphate, which is then esterified with fatty acids to form triglycerides [77]. This gene is associated with fatty acid and triglyceride synthesis in early lactation dairy cows [77,78]. The gene SH3PXD2A codes in utero embryonic development (GO:0001701), the process whose specific outcome is the progression of the embryo through the uterus over time, from the formation of the zygote in the oviduct to the birth of calves. Associations of GPD2 and SH3PXD2A with PR42 have not been identified in previous GWAS for fertility traits; however, Palombo et al. [79] reported that SH3PXD2A was associated with milk fatty acid composition in Italian Holstein dairy cows.
A single gene, EVA1C, was associated with PRFS in this study. The biological function of this gene is as of yet unknown. We identified one candidate gene, ARMH3, for the trait CR42. The biological function of ARMH3 is related to the regulation of Golgi organization (GO:1903358), and the functions of the Golgi apparatus are the transport, sorting, and modification of both proteins and lipids [80].
The most significant SNPs for fertility traits in the current study were located on chromosome 2, in agreement with previously reported GWAS for fertility traits [16,81,82,83]. However, the candidate genes found to be associated with fertility traits show little agreement with the previously reported GWAS [84,85]. Fertility traits are polygenic in nature and also influenced by non-genetic factors, for example, the heat detection ability of the farmer. The studies reported by Minozzi et al. [84] and Parker Gaddis et al. [85] involved indoor year-around calving in Italy and US dairy cattle, whereas this study was carried out with spring-calving cows under grazing conditions.
No SNPs were significantly associated with CI, SR21, PR21, and CR21. A larger study population would increase the power to detect the significant effects associated with fertility. Although many associations were detected with milk compositional traits, associations with fertility traits are limited in this population. Fertility traits have low heritability (<10%) and the low contribution of individual QTL to the total phenotypic variance could also be attributed to the low detection of associations for fertility traits in this study. Furthermore, many significant associations detected with fertility traits were associated at the suggestive significance threshold in this study, which, on average, includes one false positive result across the genome. Lander and Kruglyak [86] documented that suggestive linkage facilitated in reporting the promising but unproven findings that were worth reporting for complex traits. In the present GWAS, the cows were genotyped using a medium density SNP panel (50K Illumina) and the study population consisted of J, F, and their crosses; however, the studied population consisted of multi-breed animals, which is a limitation of this study. The use of a high-density SNP panel would allow for less reliance on linkage disequilibrium span and structure.

5. Conclusions

The genome-wide association analysis in the present study detected several regions and candidate genes associated with FP, PP, LP, SMFS, SMCO, FSCO, CFS, SR42, PR42, PRFS, NIC, and CR42. The genomic regions and genes associated with milk composition traits FP, PP, and LP in this research have been identified in previous studies. We identified several genes, (KCNH5, HS6ST3, GLS, ENSBTAG00000051479, STAT1, STAT4, GPD2, and SH3PXD2A) that were significantly associated with fertility outcomes in this population. The findings of this study provide an important foundation for future genome-wide association and fine-mapping studies for fertility traits in New Zealand dairy cattle. These findings should be validated in a larger population size before they could be applied to the genomic selection of fertility traits in New Zealand dairy cattle.

Supplementary Materials

The following supporting information can be downloaded at: https://www.mdpi.com/article/10.3390/genes14040860/s1. Table S1: The suggestive significant single nucleotide polymorphisms (SNPs) for milk composition traits in dairy cattle.

Author Contributions

Conceptualization, N.L.-V., R.E.H. and L.R.M.; methodology, N.L.-V., R.E.H., L.R.M. and J.M.D.R.J.; formal analysis, J.M.D.R.J.; resources, N.L.-V. and L.R.M.; writing—original draft preparation, J.M.D.R.J.; writing—review and editing, N.L.-V., L.R.M. and R.E.H.; supervision, N.L.-V., R.E.H. and L.R.M. All authors have read and agreed to the published version of the manuscript.

Funding

The first author was funded by the Accelerating Higher Education Expansion and Development Project (AHEAD) by the Sri Lankan Government under the funds of the World Bank (Colombo 03, Sri Lanka; grant number AHEAD/ PhD/R2/AG/212). The Livestock Improvement Corporation (Hamilton, New Zealand) funded the genotyping costs and JerseyNZ (Hamilton, New Zealand) donated the Jersey cows to Massey University.

Institutional Review Board Statement

Not applicable.

Informed Consent Statement

Not applicable.

Data Availability Statement

Data is unavailable due to ethical restrictions.

Acknowledgments

The authors acknowledge Jessie Berends for extracting the phenotypic data provided by the Livestock Improvement Corporation (Hamilton, New Zealand).

Conflicts of Interest

The authors declare no conflict of interest.

References

  1. Dairy, N.Z. New Zealand Dairy Statistics 2020-21; Livestock Improvement Corporation Limited & DairyNZ Limited: Hamilton, New Zealand, 2021; Available online: https://www.dairynz.co.nz/publications/dairy-industry/new-zealand-dairy-statistics-2020-21/ (accessed on 30 August 2022).
  2. Harris, B.L.; Montgomerie, W.A. Fertility breeding values for seasonal dairying. Interbull Bull. 2001, 27, 139–142. [Google Scholar]
  3. Harris, B.L.; Pryce, J.E.; Xu, Z.Z.; Montgomerie, W.A. Development of new fertility breeding values in the dairy industry. N. Z. Soc. Anim. Prod. 2006, 66, 107–112. [Google Scholar]
  4. Kerslake, J.I.; Amer, P.R.; O’Neill, P.L.; Wong, S.L.; Roche, J.R.; Phyn, C.V.C. Economic costs of recorded reasons for cow mortality and culling in a pasture-based dairy industry. J. Dairy Sci. 2018, 101, 1795–1803. [Google Scholar] [CrossRef] [Green Version]
  5. Grosshans, T.; Xu, Z.Z.; Burton, L.J.; Johnson, D.L.; Macmillan, K.L. Performance and genetic parameters for fertility of seasonal dairy cows in New Zealand. Livest. Prod. Sci. 1997, 51, 41–51. [Google Scholar] [CrossRef]
  6. Jayawardana, J.M.D.R.; Lopez-Villalobos, N.; McNaughton, L.R.; Hickson, R.E. Heritabilities and genetic and phenotypic correlations for milk production and fertility traits of spring-calved once-daily or twice-daily milking cows in New Zealand. J. Dairy Sci. 2023, 106, 1910–1924. [Google Scholar] [CrossRef] [PubMed]
  7. Meuwissen, T.; Hayes, B.; Goddard, M. Accelerating improvement of livestock with genomic selection. Annu. Rev. Anim. Biosci. 2013, 1, 221–237. [Google Scholar] [CrossRef]
  8. Goddard, M.E.; Hayes, B.J. Genomic selection. J. Anim. Breed. Genet. 2007, 124, 323–330. [Google Scholar] [CrossRef] [PubMed]
  9. Hayes, B.J.; Bowman, P.J.; Chamberlain, A.J.; Goddard, M.E. Invited review: Genomic selection in dairy cattle: Progress and challenges. J. Dairy Sci. 2009, 92, 433–443. [Google Scholar] [CrossRef] [Green Version]
  10. Schaeffer, L.R. Strategy for applying genome-wide selection in dairy cattle. J. Anim. Breed. Genet. 2006, 123, 218–223. [Google Scholar] [CrossRef]
  11. Ma, L.; Cole, J.B.; Da, Y.; VanRaden, P.M. Symposium review: Genetics, genome-wide association study, and genetic improvement of dairy fertility traits. J. Dairy Sci. 2019, 102, 3735–3743. [Google Scholar] [CrossRef] [PubMed] [Green Version]
  12. Lu, H.; Wang, Y.; Bovenhuis, H. Genome-wide association study for genotype by lactation stage interaction of milk production traits in dairy cattle. J. Dairy Sci. 2020, 103, 5234–5245. [Google Scholar] [CrossRef]
  13. Boichard, D.; Grohs, C.; Bourgeois, F.; Cerqueira, F.; Faugeras, R.; Neau, A.; Rupp, R.; Amigues, Y.; Boscher, M.Y.; Levéziel, H. Detection of genes influencing economic traits in three French dairy cattle breeds. Genet. Sel. Evol. 2003, 35, 77. [Google Scholar] [CrossRef] [PubMed]
  14. Höglund, J.K.; Sahana, G.; Guldbrandtsen, B.; Lund, M.S. Validation of associations for female fertility traits in Nordic Holstein, Nordic Red and Jersey dairy cattle. BMC Genet. 2014, 15, 8. [Google Scholar] [CrossRef] [Green Version]
  15. Nayeri, S.; Sargolzaei, M.; Abo-Ismail, M.K.; May, N.; Miller, S.P.; Schenkel, F.; Moore, S.S.; Stothard, P. Genome-wide association for milk production and female fertility traits in Canadian dairy Holstein cattle. BMC Genet. 2016, 17, 1–11. [Google Scholar] [CrossRef] [PubMed] [Green Version]
  16. Berry, D.P.; Bastiaansen, J.W.M.; Veerkamp, R.F.; Wijga, S.; Wall, E.; Berglund, B.; Calus, M.P.L. Genome-wide associations for fertility traits in Holstein–Friesian dairy cows using data from experimental research herds in four European countries. Animal 2012, 6, 1206–1215. [Google Scholar] [CrossRef] [Green Version]
  17. Winkelman, A.M.; Johnson, D.L.; Harris, B.L. Application of genomic evaluation to dairy cattle in New Zealand. J. Dairy Sci. 2015, 98, 659–675. [Google Scholar] [CrossRef] [Green Version]
  18. Harris, B.L.; Johnson, D.L.; Spelman, J.R. Genomic selection in New Zealand and the implications for national genetic evaluation. In Proceedings of the Interbull Meeting, Niagara Falls, ON, Canada, 16-19 June 2008. [Google Scholar]
  19. Jayawardana, J.M.D.R.; Lopez-Villalobos, N.; McNaughton, L.R.; Hickson, R.E. Fertility of dairy cows milked once daily or twice daily in New Zealand. J. Dairy Sci. 2022, 105, 8911–8923. [Google Scholar] [CrossRef]
  20. Burke, C.R.; Fowler, C. Fertility in New Zealand Dairy Herds: Industry Situation and a Way Forward for Improving on-Farm Reproductive Performance. Proc. South Island Dairy Event (SIDE) 2007, 11, 194–202. [Google Scholar]
  21. DairyNZ. Incalf New Zealand Fertility Focus User’s Guide. 2019. Available online: https://www.dairynz.co.nz/media/5793532/incalf-nz-fertility-focus-users-guide_2020-update-v1.pdf (accessed on 15 June 2021).
  22. Johnston, D.J.; Bunter, K.L. Days to calving in Angus cattle: Genetic and environmental effects, and covariances with other traits. Livest. Prod. Sci. 1996, 45, 13–22. [Google Scholar] [CrossRef]
  23. Dickerson, G.E. Inbreeding and heterosis in animals. J. Anim. Sci. 1973, 1973, 54–77. [Google Scholar] [CrossRef]
  24. SVS. SNP & Variation Suite™ [Software], 8th ed.; Bozeman, M.T., Ed.; SVS Inc.: Boston, MA, USA; Golden Helix Inc.: Bozeman, MT, USA; Available online: https://www.goldenhelix.com/products/SNP_Variation/index.html (accessed on 10 July 2022).
  25. Gilmour, A.; Gogel, B.; Cullis, B.; Welham, S.; Thompson, R. ASReml User Guide Release 4.1 Structural Specification; VSN International Ltd.: Hemel Hempstead, UK, 2015. [Google Scholar]
  26. Yang, J.; Lee, S.H.; Goddard, M.E.; Visscher, P.M. GCTA: A tool for genome-wide complex trait analysis. Am. J. Hum. Genet. 2011, 88, 76–82. [Google Scholar] [CrossRef] [Green Version]
  27. Turner, S.D. qqman: An R Package for Visualizing GWAS Results Using QQ and Manhattan Plots. bioRxiv 2014. Available online: https://www.biorxiv.org/content/10.1101/005165v1 (accessed on 15 September 2022).
  28. Armstrong, R.A. When to use the Bonferroni correction. Ophthalmic Physiol. Opt. 2014, 34, 502–508. [Google Scholar] [CrossRef]
  29. Yates, A.D.; Achuthan, P.; Akanni, W.; Allen, J.; Allen, J.; Alvarez-Jarreta, J.; Amode, M.R.; Armean, I.M.; Azov, A.G.; Bennett, R.; et al. Ensembl 2020. Nucleic Acids Res. 2019, 48, D682–D688. [Google Scholar] [CrossRef] [PubMed]
  30. Rodriguez-Cutzal, L.X.; Burke, J.L.; Correa-Luna, M.; Lopez-Villalobos, N. A statistical evaluation of associations between reproductive performance and milk composition and animal factors on grazing dairy cows in two New Zealand dairy farms. N. Z. Vet. J. 2022, 70, 138–148. [Google Scholar] [CrossRef] [PubMed]
  31. Buitenhuis, B.; Janss, L.L.G.; Poulsen, N.A.; Larsen, L.B.; Larsen, M.K.; Sørensen, P. Genome-wide association and biological pathway analysis for milk-fat composition in Danish Holstein and Danish Jersey cattle. BMC Genom. 2014, 15, 1112. [Google Scholar] [CrossRef] [PubMed] [Green Version]
  32. Meredith, B.K.; Kearney, F.J.; Finlay, E.K.; Bradley, D.G.; Fahey, A.G.; Berry, D.P.; Lynn, D.J. Genome-wide associations for milk production and somatic cell score in Holstein-Friesian cattle in Ireland. BMC Genet. 2012, 13, 21. [Google Scholar] [CrossRef] [PubMed] [Green Version]
  33. Pryce, J.E.; Bolormaa, S.; Chamberlain, A.J.; Bowman, P.J.; Savin, K.; Goddard, M.E.; Hayes, B.J. A validated genome-wide association study in 2 dairy cattle breeds for milk production and fertility traits using variable length haplotypes. J. Dairy Sci. 2010, 93, 3331–3345. [Google Scholar] [CrossRef] [PubMed] [Green Version]
  34. Raven, L.-A.; Cocks, B.G.; Hayes, B.J. Multibreed genome wide association can improve precision of mapping causative variants underlying milk production in dairy cattle. BMC Genom. 2014, 15, 62. [Google Scholar] [CrossRef] [Green Version]
  35. Yen, C.L.; Stone, S.J.; Koliwad, S.; Harris, C.; Farese, R.V., Jr. Thematic review series: Glycerolipids. DGAT enzymes and triacylglycerol biosynthesis. J. Lipid Res. 2008, 49, 2283–2301. [Google Scholar] [CrossRef] [Green Version]
  36. Pacheco-Pappenheim, S.; Yener, S.; van Valenberg, H.J.F.; Tzompa-Sosa, D.A.; Bovenhuis, H. The DGAT1 K232A polymorphism and feeding modify milk fat triacylglycerol composition. J. Dairy Sci. 2019, 102, 6842–6852. [Google Scholar] [CrossRef] [PubMed]
  37. Wang, T.; Li, J.; Gao, X.; Song, W.; Chen, C.; Yao, D.; Ma, J.; Xu, L.; Ma, Y. Genome-wide association study of milk components in Chinese Holstein cows using single nucleotide polymorphism. Livest. Sci. 2020, 233, 103951. [Google Scholar] [CrossRef]
  38. Sanchez, M.-P.; Govignon-Gion, A.; Croiseau, P.; Fritz, S.; Hozé, C.; Miranda, G.; Martin, P.; Barbat-Leterrier, A.; Letaïef, R.; Rocha, D.; et al. Within-breed and multi-breed GWAS on imputed whole-genome sequence variants reveal candidate mutations affecting milk protein composition in dairy cattle. Genet. Sel. Evol. 2017, 49, 68. [Google Scholar] [CrossRef] [PubMed] [Green Version]
  39. Tiplady, K.M.; Lopdell, T.J.; Reynolds, E.; Sherlock, R.G.; Keehan, M.; Johnson, T.J.J.; Pryce, J.E.; Davis, S.R.; Spelman, R.J.; Harris, B.L.; et al. Sequence-based genome-wide association study of individual milk mid-infrared wavenumbers in mixed-breed dairy cattle. Genet. Sel. Evol. 2021, 53, 62. [Google Scholar] [CrossRef] [PubMed]
  40. Xiang, R.; Fang, L.; Liu, S.; Liu, G.E.; Tenesa, A.; Gao, Y.; Mason, B.A.; Chamberlain, A.J.; Goddard, M.E. Genetic score omics regression and multi-trait meta-analysis detect widespread cis-regulatory effects shaping bovine complex traits. bioRxiv 2022. [Google Scholar] [CrossRef]
  41. Oliveira, H.; Silva, F.; Brito, L.; Jamrozik, J.; Lourenco, D.; Schenkel, F. Genome-wide association study for milk, fat and protein yields in different lactation stages in Canadian Holstein and Jersey cattle. In Proceedings of the World Congress on Genetics Applied to Livestock Production, Auckland, New Zealand, 11–16 February 2018; pp. 11–16. [Google Scholar]
  42. Lembeye, F.; Lopez-Villalobos, N.; Burke, J.L.; Davis, S.R. Estimation of genetic parameters for milk traits in cows milked once- or twice-daily in New Zealand. Livest. Sci. 2016, 185, 142–147. [Google Scholar] [CrossRef]
  43. Sparks, J.D.; Dong, H.H. FoxO1 and hepatic lipid metabolism. Curr. Opin. Lipidol. 2009, 20, 217–226. [Google Scholar] [CrossRef] [Green Version]
  44. Atashi, H.; Salavati, M.; De Koster, J.; Ehrlich, J.; Crowe, M.; Opsomer, G.; Consortium, G.; Hostens, M. Genome-wide association for milk production and lactation curve parameters in Holstein dairy cows. J. Anim. Breed. Genet. 2020, 137, 292–304. [Google Scholar] [CrossRef]
  45. Cruz, V.A.R.; Oliveira, H.R.; Brito, L.F.; Fleming, A.; Larmer, S.; Miglior, F.; Schenkel, F.S. Genome-Wide Association Study for Milk Fatty Acids in Holstein Cattle Accounting for the DGAT1 Gene Effect. Animals 2019, 9, 997. [Google Scholar] [CrossRef] [Green Version]
  46. Bohlouli, M.; Halli, K.; Yin, T.; Gengler, N.; König, S. Genome-wide associations for heat stress response suggest potential candidate genes underlying milk fatty acid composition in dairy cattle. J. Dairy Sci. 2022, 105, 3323–3340. [Google Scholar] [CrossRef]
  47. Ibeagha-Awemu, E.M.; Peters, S.O.; Akwanji, K.A.; Imumorin, I.G.; Zhao, X. High density genome wide genotyping-by-sequencing and association identifies common and low frequency SNPs, and novel candidate genes influencing cow milk traits. Sci. Rep. 2016, 6, 31109. [Google Scholar] [CrossRef] [Green Version]
  48. Frąszczak, M.; Szyda, J. Comparison of significant single nucleotide polymorphisms selections in GWAS for complex traits. J. Appl. Genet. 2016, 57, 207–213. [Google Scholar] [CrossRef] [Green Version]
  49. Freitas, P.H.F.; Oliveira, H.R.; Silva, F.F.; Fleming, A.; Miglior, F.; Schenkel, F.S.; Brito, L.F. Genomic analyses for predicted milk fatty acid composition throughout lactation in North American Holstein cattle. J. Dairy Sci. 2020, 103, 6318–6331. [Google Scholar] [CrossRef]
  50. Lopdell, T.J.; Tiplady, K.; Struchalin, M.; Johnson, T.J.J.; Keehan, M.; Sherlock, R.; Couldrey, C.; Davis, S.R.; Snell, R.G.; Spelman, R.J.; et al. DNA and RNA-sequence based GWAS highlights membrane-transport genes as key modulators of milk lactose content. BMC Genom. 2017, 18, 968. [Google Scholar] [CrossRef] [PubMed] [Green Version]
  51. Sanchez, M.P.; Wolf, V.; El Jabri, M.; Beuvier, E.; Rolet-Répécaud, O.; Gaüzère, Y.; Minéry, S.; Brochard, M.; Michenet, A.; Taussat, S.; et al. Short communication: Confirmation of candidate causative variants on milk composition and cheesemaking properties in Montbéliarde cows. J. Dairy Sci. 2018, 101, 10076–10081. [Google Scholar] [CrossRef] [PubMed]
  52. Tribout, T.; Croiseau, P.; Lefebvre, R.; Barbat, A.; Boussaha, M.; Fritz, S.; Boichard, D.; Hoze, C.; Sanchez, M.-P. Confirmed effects of candidate variants for milk production, udder health, and udder morphology in dairy cattle. Genet. Sel. Evol. 2020, 52, 55. [Google Scholar] [CrossRef]
  53. NRC, I. Nutrient Requirements of Dairy Cattle; The National Academies Press: Washington, DC, USA, 2001; Volume 519. [Google Scholar]
  54. Kirn-Safran, C.B.; D’Souza, S.S.; Carson, D.D. Heparan sulfate proteoglycans and their binding proteins in embryo implantation and placentation. Semin. Cell Dev. Biol. 2008, 19, 187–193. [Google Scholar] [CrossRef] [Green Version]
  55. Ringvall, M.; Ledin, J.; Holmborn, K.; van Kuppevelt, T.; Ellin, F.; Eriksson, I.; Olofsson, A.-M.; Kjellén, L.; Forsberg, E. Defective Heparan Sulfate Biosynthesis and Neonatal Lethality in Mice LackingN-Deacetylase/N-Sulfotransferase-1. J. Biol. Chem. 2000, 275, 25926–25930. [Google Scholar] [CrossRef] [PubMed] [Green Version]
  56. Sarrazin, S.; Lamanna, W.C.; Esko, J.D. Heparan sulfate proteoglycans. Cold Spring Harb. Perspect. Biol. 2011, 3, a004952. [Google Scholar] [CrossRef] [Green Version]
  57. Itoh, K.; Sokol, S.Y. Heparan sulfate proteoglycans are required for mesoderm formation in Xenopus embryos. Development 1994, 120, 2703–2711. [Google Scholar] [CrossRef]
  58. Prinsen, R.T.M.M.; Rossoni, A.; Gredler, B.; Bieber, A.; Bagnato, A.; Strillacci, M.G. A genome wide association study between CNVs and quantitative traits in Brown Swiss cattle. Livest. Sci. 2017, 202, 7–12. [Google Scholar] [CrossRef]
  59. Ahmad, S.F.; Singh, A.; Panda, S.; Malla, W.A.; Kumar, A.; Dutt, T. Genome-wide elucidation of CNV regions and their association with production and reproduction traits in composite Vrindavani cattle. Gene 2022, 830, 146510. [Google Scholar] [CrossRef]
  60. Jiang, Z.; Michal, J.J.; Wu, X.L.; Pan, Z.; MacNeil, M.D. The heparan and heparin metabolism pathway is involved in regulation of fatty acid composition. Int. J. Biol. Sci. 2011, 7, 659–663. [Google Scholar] [CrossRef] [PubMed] [Green Version]
  61. Siebert, L.J. Identifying Genome Associations with Unique Mastitis Phenotypes in Response to Intramammary Streptococcus Uberis Challenge. Ph.D. Thesis, University of Tennessee, Knoxville, Tennessee, 2017. [Google Scholar]
  62. Watford, M. Glutamine and glutamate: Nonessential or essential amino acids? Anim. Nutr. 2015, 1, 119–122. [Google Scholar] [CrossRef]
  63. Meijer, G.A.L.; van der Meulen, J.; van Vuuren, A.M. Glutamine is a potentially limiting amino acid for milk production in dairy cows: A hypothesis. Metabolism 1993, 42, 358–364. [Google Scholar] [CrossRef]
  64. Caroprese, M.; Albenzio, M.; Marino, R.; Santillo, A.; Sevi, A. Immune response and milk production of dairy cows fed graded levels of rumen-protected glutamine. Res. Vet. Sci. 2012, 93, 202–209. [Google Scholar] [CrossRef] [PubMed]
  65. Kessel, S.; Stroehl, M.; Meyer, H.H.D.; Hiss, S.; Sauerwein, H.; Schwarz, F.J.; Bruckmaier, R.M. Individual variability in physiological adaptation to metabolic stress during early lactation in dairy cows kept under equal conditions. J. Anim. Sci. 2008, 86, 2903–2912. [Google Scholar] [CrossRef]
  66. Butler, W.R.; Smith, R.D. Interrelationships Between Energy Balance and Postpartum Reproductive Function in Dairy Cattle. J. Dairy Sci. 1989, 72, 767–783. [Google Scholar] [CrossRef] [PubMed]
  67. Li, C.; Buettger, C.; Kwagh, J.; Matter, A.; Daikhin, Y.; Nissim, I.B.; Collins, H.W.; Yudkoff, M.; Stanley, C.A.; Matschinsky, F.M. A Signaling Role of Glutamine in Insulin Secretion. J. Biol. Chem. 2004, 279, 13393–13401. [Google Scholar] [CrossRef] [Green Version]
  68. Newsholme, P.; Bender, K.; Kiely, A.; Brennan, L. Amino acid metabolism, insulin secretion and diabetes. Biochem. Soc. Trans. 2007, 35, 1180–1186. [Google Scholar] [CrossRef] [PubMed]
  69. Butler, S.T.; Marr, A.L.; Pelton, S.H.; Radcliff, R.P.; Lucy, M.C.; Butler, W.R. Insulin restores GH responsiveness during lactation-induced negative energy balance in dairy cattle: Effects on expression of IGF-I and GH receptor 1A. J. Endocrinol. 2003, 176, 205–217. [Google Scholar] [CrossRef] [Green Version]
  70. Khatib, H.; Huang, W.; Mikheil, D.; Schutzkus, V.; Monson, R.L. Effects of signal transducer and activator of transcription (STAT) genes STAT1 and STAT3 genotypic combinations on fertilization and embryonic survival rates in Holstein cattle. J. Dairy Sci. 2009, 92, 6186–6191. [Google Scholar] [CrossRef]
  71. Ratcliffe, L.; Mullen, M.; McClure, M.C.; McClure, J.; Kearney, F. 190 Single nucleotide polymorphisms in the signal transducer and regulator of transcription (STAT) genes are associated with milk production, milk composition, and fertility traits in Holstein Friesian cattle. J. Anim. Sci. 2017, 95, 94. [Google Scholar] [CrossRef] [Green Version]
  72. Walker, C.G.; Littlejohn, M.D.; Mitchell, M.D.; Roche, J.R.; Meier, S. Endometrial gene expression during early pregnancy differs between fertile and subfertile dairy cow strains. Physiol. Genom. 2012, 44, 47–58. [Google Scholar] [CrossRef] [PubMed]
  73. Levy, D.E.; Darnell, J.E. STATs: Transcriptional control and biological impact. Nat. Rev. Mol. Cell Biol. 2002, 3, 651–662. [Google Scholar] [CrossRef] [PubMed]
  74. Maj, T.; Chelmonska-Soyta, A. Pleiotropy and redundancy of STAT proteins in early pregnancy. Reprod. Domest. Anim. 2007, 42, 343–353. [Google Scholar] [CrossRef] [PubMed]
  75. Zhang, F.; Huang, J.; Li, Q.; Ju, Z.; Li, J.; Shi, F.; Zhong, J.; Wang, C. Novel single nucleotide polymorphisms (SNPs) of the bovine STAT4 gene and their associations with production traits in Chinese Holstein cattle. Afr. J. Biotechnol. 2010, 9, 4003–4008. [Google Scholar]
  76. Cobanoglu, O.; Zaitoun, I.; Chang, Y.M.; Shook, G.E.; Khatib, H. Effects of the Signal Transducer and Activator of Transcription 1 (STAT1) Gene on Milk Production Traits in Holstein Dairy Cattle. J. Dairy Sci. 2006, 89, 4433–4437. [Google Scholar] [CrossRef] [Green Version]
  77. Sadri, H.; Mielenz, M.; Morel, I.; Bruckmaier, R.M.; van Dorland, H.A. Plasma leptin and mRNA expression of lipogenesis and lipolysis-related factors in bovine adipose tissue around parturition. J. Anim. Physiol. Anim. Nutr. 2011, 95, 790–797. [Google Scholar] [CrossRef]
  78. Graber, M.; Kohler, S.; Kaufmann, T.; Doherr, M.G.; Bruckmaier, R.M.; van Dorland, H.A. A field study on characteristics and diversity of gene expression in the liver of dairy cows during the transition period. J. Dairy Sci. 2010, 93, 5200–5215. [Google Scholar] [CrossRef] [Green Version]
  79. Palombo, V.; Milanesi, M.; Sgorlon, S.; Capomaccio, S.; Mele, M.; Nicolazzi, E.; Ajmone-Marsan, P.; Pilla, F.; Stefanon, B.; D’Andrea, M. Genome-wide association study of milk fatty acid composition in Italian Simmental and Italian Holstein cows using single nucleotide polymorphism arrays. J. Dairy Sci. 2018, 101, 11004–11019. [Google Scholar] [CrossRef] [PubMed] [Green Version]
  80. Teasdale, R.D.; Jackson, M.R. Signal-mediated sorting of membrane proteins between the endoplasmic reticulum and the golgi apparatus. Annu. Rev. Cell Dev. Biol. 1996, 12, 27–54. [Google Scholar] [CrossRef] [PubMed]
  81. Tenghe, A.M.M.; Bouwman, A.C.; Berglund, B.; Strandberg, E.; de Koning, D.J.; Veerkamp, R.F. Genome-wide association study for endocrine fertility traits using single nucleotide polymorphism arrays and sequence variants in dairy cattle. J. Dairy Sci. 2016, 99, 5470–5485. [Google Scholar] [CrossRef] [PubMed] [Green Version]
  82. Höglund, J.K.; Buitenhuis, B.; Guldbrandtsen, B.; Lund, M.S.; Sahana, G. Genome-wide association study for female fertility in Nordic Red cattle. BMC Genet. 2015, 16, 110. [Google Scholar] [CrossRef] [Green Version]
  83. Schulman, N.F.; Sahana, G.; Iso-Touru, T.; McKay, S.D.; Schnabel, R.D.; Lund, M.S.; Taylor, J.F.; Virta, J.; Vilkki, J.H. Mapping of fertility traits in Finnish Ayrshire by genome-wide association analysis. Anim. Genet. 2011, 42, 263–269. [Google Scholar] [CrossRef] [PubMed]
  84. Minozzi, G.; Nicolazzi, E.L.; Stella, A.; Biffani, S.; Negrini, R.; Lazzari, B.; Ajmone-Marsan, P.; Williams, J.L. Genome Wide Analysis of Fertility and Production Traits in Italian Holstein Cattle. PLoS ONE 2013, 8, e80219. [Google Scholar] [CrossRef] [Green Version]
  85. Parker Gaddis, K.L.; Null, D.J.; Cole, J.B. Explorations in genome-wide association studies and network analyses with dairy cattle fertility traits. J. Dairy Sci. 2016, 99, 6420–6435. [Google Scholar] [CrossRef]
  86. Lander, E.; Kruglyak, L. Genetic dissection of complex traits: Guidelines for interpreting and reporting linkage results. Nat. Genet. 1995, 11, 241–247. [Google Scholar] [CrossRef]
Figure 1. Manhattan plots for −log10 p-values of marker effects for the milk composition traits of fat percentage (FP), protein percentage (PP), and lactose percentage (LP). The genome-wide significance threshold of Bonferroni correction is represented by the red line at −log10 p-value = 5.93, and the suggestive significance threshold is represented by the blue line at −log10 p-value = 4.63.
Genes 14 00860 g001aGenes 14 00860 g001b
Figure 2. Manhattan plots for −log10 p-values of marker effects for the interval from the start of mating to first service (SMFS), the interval from the start of mating to conception (SMCO), the interval from first service to conception (FSCO), the interval from calving to first service (CFS), consecutive calving intervals (CI), 3 weeks submission (SR21), 6 weeks submission (SR42), 3 weeks in-calf (PR21), 6 weeks in-calf (PR42), pregnant to first service in the first 3 weeks of the breeding season (PRFS), not in calf at end of the breeding season (NIC), 3 weeks calving (CR21), and 6 weeks calving rate (CR42). The genome-wide significance threshold of Bonferroni correction is represented by the red line at −log10 p-value = 5.93, and the suggestive significance threshold is represented by the blue line at −log10 p-value = 4.63.
Genes 14 00860 g002aGenes 14 00860 g002bGenes 14 00860 g002cGenes 14 00860 g002dGenes 14 00860 g002e
Table 1. Description of phenotypic (milk composition and fertility) traits used in this study.
TraitCriteria for Trait Calculation
Milk composition
FPFat percentage, kg fat per kg milk (%)
PPProtein percentage, kg protein per kg milk (%)
LPLactose percentage, kg lactose per kg milk (%)
Fertility
SMFS 1The interval from the start of mating to first service (d)
SMCO 2The interval from the start of mating to conception (d)
FSCO 2The interval from first service to conception (d)
CFS 1Interval from calving to first service (d)
CI 3Interval between two consecutive calvings (d)
SR21Cows with the first mating date in the first 21 d from the start of mating date were represented as 1, otherwise coded as 0 (binary)
SR42Cows with the first mating date in the first 42 d from the start of mating date were represented as 1, otherwise coded as 0 (binary)
PR21Cows conceived in the first 21 d from the start of mating date represented as 1, otherwise coded as 0 (binary)
PR42Cows conceived in the first 42 d from the start of mating date represented as 1, otherwise coded as 0 (binary)
PRFSCows conceived to the first AB insemination in the first 21 d from the start of mating date were represented as 1, otherwise coded as 0 (binary)
NICCows not in calf at the end of the mating period were represented as 1 and in-calf cows were coded as 0 (binary)
CR21 4Cows calved in the first 21 d from the planned start of calving date were represented as 1, otherwise coded as 0 (binary)
CR42 4Cows calved in the first 42 d from the planned start of calving date were represented as 1, otherwise coded as 0 (binary)
1 Intervals for cows with no recorded artificial breeding (AB) were ended at the end of the AB period of herd in each calving season (n = 29). 2 Intervals for cows that did not conceive were ended at the herd’s end of the mating date plus 21 days (n = 787). 3 Intervals for cows with positive pregnancy diagnosis results and without subsequent calving dates were calculated by estimating a calving date using the conception date plus 282 days (n = 1113). 4 Cows that did not calve in the subsequent season were treated as missing variables and both traits were not calculated for the 2021–2022 calving season.
Table 2. Descriptive statistics of milk composition and fertility traits of cows from Massey Dairy 1 and Dairy 4.
TraitNo. RecordsMeanSDCVMin.Max.
Yields
Milk63814969123724.93878861
Fat63812325121.922398
Protein63811884222.219311
Lactose63812516325.111449
Milk composition
FP%63814.750.6914.52.927.38
PP%63813.830.328.32.965.14
LP%63815.040.183.62.845.48
Fertility
SMFS622110.98.679.1171
SMCO622129.628.495.81110
FSCO619219.827.7139.71109
CFS622179.618.022.614.0201
CI5434368.721.95.9261435
SR21(%)622191.428.030.701
SR42(%)622199.28.88.801
PR21(%)622154.149.892.001
PR42(%)622175.942.856.401
PRFS(%)621947.849.9104.401
NIC(%)638112.232.7268.401
CR21(%)432168.046.668.601
CR42(%)432191.028.631.401
FP = fat percentage; PP = protein percentage; LP = lactose percentage; SMFS = start of mating to first service (d); SMCO = start of mating to conception (d); FSCO = first service to conception (d); CFS = calving to first service (d); CI = consecutive calving interval (d); SR21 = cow inseminated in the first 3 weeks from the start of mating; SR42 = cow inseminated in the first 6 weeks from the start of mating; PR21 = cow conceived in the first 3 weeks from the start of mating; PR42 = cow conceived in the first 6 weeks from the start of mating; PRFS = cow conceived to first service in the first 3 weeks of the breeding season; NIC = cow not in calf at the end of the breeding season; CR21 = cow calved in the first 3 weeks from the planned start of calving; CR42 = cow calved in the first 6 weeks from the planned start of calving.
Table 3. The genome-wide significant single nucleotide polymorphisms (SNPs) for the milk composition traits of fat percentage (FP), protein percentage (PP), and lactose percentage (LP).
TraitLocusChrPosition−log10 (p)Effect (SE)Ref./
MA
Ref. Freq.AnnotationGene Name
FPrs211210569593,945,7386.76C/T0.62IntronMGST1
rs210744919593,949,8106.43−0.11 (0.02)G/A0.41IntronMGST1
rs110984572141,653,6937.85−0.17 (0.03)C/T0.89upstreamFOXH1
rs134432442141,736,59974.54−0.33 (0.02)C/T0.52missenseCPSF1
rs211309638141,757,93510.01−0.20 (0.03)C/T0.89upstreamADCK5
rs137071126141,765,83584.41−0.36 (0.02)C/G0.48synonymousSLC52A2
rs109421300141,801,11689.79−0.38 (0.02)T/C0.46IntronDGAT1
rs137787931141,880,37867.950.32 (0.02)T/C0.55IntronMROH1
rs109742607142,217,16316.150.16 (0.02)A/G0.69IntronIQANK1
rs110323635142,239,08516.15−0.16 (0.02)A/G0.31missenseMAPK15
rs109617015142,386,68817.86−0.22 (0.03)A/G0.16IntronZC3H3
rs109529219142,468,02021.47−0.22 (0.02)G/A0.22IntronRHPN1
rs109958270142,605,4937.810.12 (0.02)C/T0.78intergenic-
rs110043428142,790,50112.490.14 (0.02)A/G0.53intergenic-
rs109476486142,826,63212.41−0.17 (0.02)T/G0.20upstreamLYPD2
rs110545978143,186,14115.280.18 (0.02)T/C0.83intergenic-
rs136880486144,078,92311.13−0.13 (0.02)T/C0.28upstreamAGO2
rs110755656145,274,6357.650.11 (0.02)G/T0.76intergenic-
rs110359329147,428,3156.09−0.09 (0.02)A/G0.58intergenic-
PPrs43703015687,390,5766.520.05 (0.01)T/C0.61missenseCSN3
rs4370301668,7390,6126.520.05 (0.01)C/A0.61missenseCSN3
rs110014544687,390,6736.520.05 (0.01)G/A0.61synonymousCSN3
rs109787476687,390,6816.430.05 (0.01)T/A0.613 prime UTRCSN3
rs134432442141,736,59928.13−0.09 (0.01)C/T0.52missenseCPSF1
rs137071126141,765,83530.83−0.10 (0.01)C/G0.48synonymousSLC52A2
rs109421300141,801,11630.96−0.10 (0.01)T/C0.46IntronDGAT1
rs137787931141,880,37823.910.09 (0.01)T/C0.55IntronMROH1
rs109742607142,217,1636.590.04 (0.01)A/G0.69IntronIQANK1
rs109617015142,386,6888.31−0.07 (0.01)A/G0.16IntronZC3H3
rs109529219142,468,0209.81−0.07 (0.01)G/A0.22IntronRHPN1
rs110545978143,186,1418.330.06 (0.01)T/C0.83intergenic-
rs110755656145,274,6355.940.05 (0.01)G/T0.76intergenic-
LPrs378183369299,563,3968.89−0.03 (0.004)A/G0.74IntronPICALM
Chr = chromosome; SE = standard error; Ref. = reference allele; MA = minor allele; Ref. freq. = reference allele frequency; FP = fat percentage; PP = protein percentage.
Table 4. The single nucleotide polymorphisms (SNPs) that were identified as significant at genome-wide and suggestive significance thresholds for the fertility traits.
TraitLocusChrPosition−log10 (p)SNP Effect
(SE)
Ref./
MA
Ref. Freq.AnnotationGene Name
SMFSrs1329760729101,238,3015.080.06 (0.01)A/G0.48Intergenic-
rs1101119591075,105,7745.020.07 (0.02)A/G0.75IntronKCNH5
SMCOrs416350041277,611,4524.711.52 × 10−7
(3.55 × 10⁻⁸)
A/G0.63IntronHS6ST3
FSCOrs132906739248,960,1694.81−0.05 (0.01)A/G0.57Intergenic-
rs109941542249,095,6614.81−0.05 (0.01)C/T0.57Intergenic-
rs416350041277,611,4524.850.04 (0.01)A/G0.63IntronHS6ST3
CFSrs1329760729101,238,3015.060.06 (0.01)A/G0.48Intergenic-
rs1101119591075,105,7745.020.07 (0.02)A/G0.75IntronKCNH5
SR42rs135632251279,410,6695.710.001 (0.0002)C/T0.94Intergenic-
rs134983646279,474,2175.95−0.0005
(9.82 × 10⁻⁵)
G/A0.19IntronGLS
ENSBTAG00000051479
rs109798660279,486,6726.47−0.001
(9.95 × 10⁻⁵)
T/C0.19IntronENSBTAG00000051479
rs134911740279,706,3855.99−0.0005
(9.81 × 10⁻⁵)
G/A0.19Intergenic-
rs135975975279,817,5886.52−0.001
(9.94 × 10⁻⁵)
G/A0.18IntronGLS
rs137812009279,908,3346.50−0.001
(9.90 × 10⁻⁵)
T/C0.18IntronSTAT1
rs41610299279,946,5956.57−0.001
(9.93 × 10⁻⁵)
T/C0.18IntronSTAT4
rs380321634279,975,1645.890.001 (0.0002)T/G0.94IntronSTAT4
PR42rs137030801239,681,1415.804.20 × 10−9
(8.72 × 10⁻¹⁰)
T/C0.46IntronGPD2
rs1096730372624,432,7584.740.002 (0.0004)C/T0.42UpstreamSH3PXD2A
PRFSrs13268508312,262,0974.930.004 (0.001)A/G0.45IntronEVA1C
NICrs132906739248,960,1694.86−3.06 × 10⁻⁸
(7.04 × 10⁻⁹)
A/G0.57Intergenic-
rs109941542249,095,6614.86−3.06 × 10⁻⁸
(7.04 × 10⁻⁹)
C/T0.57Intergenic-
CR42rs416060452622,526,3695.14−0.003
(7.32 × 10⁻⁶)
C/T0.85IntronARMH3
Chr = chromosome; SE = standard error; Ref. = reference allele; MA= minor allele; Ref. freq. = reference allele frequency. SMFS = start of mating to first service (d); SMCO = start of mating to conception (d); FSCO = first service to conception (d); CFS = calving to first service (d); SR42 = cow inseminated in the first 6 weeks from the start of mating; PR21 = cow conceived in the first 3 weeks from the start of mating; PR42 = cow conceived in the first 6 weeks from the start of mating; PRFS = cow conceived to first service in the first 3 weeks from start of mating; NIC = cow not in calf at end of the breeding season.
Disclaimer/Publisher’s Note: The statements, opinions and data contained in all publications are solely those of the individual author(s) and contributor(s) and not of MDPI and/or the editor(s). MDPI and/or the editor(s) disclaim responsibility for any injury to people or property resulting from any ideas, methods, instructions or products referred to in the content.

