Communication

WGCNA Analysis of Salt-Responsive Core Transcriptome Identifies Novel Hub Genes in Rice

1
Hunan Agricultural University, Changsha 410128, China
2
Hunan Rice Research Institute, Changsha 410125, China
3
China National Rice Research Institute, Hangzhou 311401, China
4
Wuhan Benagen Tech Solutions Company Limited, Wuhan 430070, China
5
Hunan Academy of Agricultural Sciences, Changsha 410125, China
*
Author to whom correspondence should be addressed.
Genes 2019, 10(9), 719; https://doi.org/10.3390/genes10090719
Submission received: 19 August 2019 / Revised: 7 September 2019 / Accepted: 11 September 2019 / Published: 17 September 2019
(This article belongs to the Special Issue Abiotic Stress in Plants: Current Challenges and Perspectives)

Abstract

:
Rice, being a major staple food crop and sensitive to salinity conditions, bears heavy yield losses due to saline soil. Although some salt responsive genes have been identified in rice, their applications in developing salt tolerant cultivars have resulted in limited achievements. Herein, we used bioinformatic approaches to perform a meta-analysis of three transcriptome datasets from salinity and control conditions in order to reveal novel genes and the molecular pathways underlying rice response to salt. From a total of 28,432 expressed genes, we identify 457 core differentially expressed genes (DEGs) constitutively responding to salt, regardless of the stress duration, genotype, or the tissue. Gene co-expression analysis divided the core DEGs into three different modules, each of them contributing to salt response in a unique metabolic pathway. Gene ontology and Kyoto Encyclopedia of Genes and Genomes (KEGG) analyses highlighted key biological processes and metabolic pathways involved in the salt response. We identified important novel hub genes encoding proteins of different families including CAM, DUF630/632, DUF581, CHL27, PP2-13, LEA4-5, and transcription factors, which could be functionally characterized using reverse genetic experiments. This novel repertoire of candidate genes related to salt response in rice will be useful for engineering salt tolerant varieties.

1. Introduction

Salinity stress is one of the leading abiotic stresses that challenge the sustainability of crop production [1]. A high level of salt in soil inhibits plant growth, induces wilting and the death of plants. Salt stress causes ion toxicity by Na+ and Cl- ions leakage, which leads to disruption of the cell membrane, inhibition of protein synthesis, and alteration of enzyme activity [2]. Importantly, salinity also causes a reduction in photosynthesis, resulting in chlorosis and programmed cell death [3]. Different classes of genes including phosphatases, kinases, hormones, and transcription factors play significant roles in salt stress responses [4]. In recent years, various genes conferring salt tolerance in plants have been identified and shown to be involved in transcription, signal transduction, ion transport, and metabolic pathways [5,6].
Rice is a staple food crop of half of the world population and a genomic model crop of the monocot family. Rice production is supposed to be increased by 0.6% to 0.9% every year until 2050 in order to feed a rapidly increasing population [7]. Rice, being sensitive to salinity conditions, bears heavy yield losses due to saline soil [8]. Extensive omics data have been generated and applied in various studies towards rice yield and quality improvement. In particular, transcriptome sequencing and computational approaches have greatly facilitated rice molecular research [9]. Some important salt responsive genes such as OsSOS1, OsNHX1, OsHKT2;1, OsCAX1, OsAKT1, OsKCO1, OsTPC1, OsCLC1, and OsNRT1;2 have been discovered in rice but so far, very limited achievements have been made to develop salt-tolerant cultivars [10]. In fact, plant response to stress is a coordinated action of multiple stress responsive genes, interacting with other components of stress signal transduction pathways [11]. Therefore, there are still large numbers of unidentified genes with high potential to improve salt tolerance in rice. In recent years with the development of new high-throughput technologies such as RNA sequencing (RNA-seq) and data analysis methods, the functional characteristics of thousands of genes can be investigated systematically [12]. In rice, various RNA-seq studies have been conducted to explore the differentially expressed genes under salinity stress [13,14,15,16,17]. These datasets represent valuable genomic resources to perform meta-analysis to identify the core-conserved genes modulating salt responses in rice, regardless of the stress intensity, genotype, environment, etc.
One important method to understand the gene function and gene association from genome-wide expression is the co-expression network analysis [18,19]. The co-expression network approach constructs the network of genes with co-activation across a group of samples. Nowadays, weighted gene co-expression network analysis (WGCNA) is the most commonly used system biology approach to identify the pattern of correlations among genes [20]. It is useful for the identification of the modules of co-expressed genes, their correlation with external traits, and the pinpointing of key hub genes. It has been widely applied to detect the co-expressed genes responsive to stress and cell wall organization in cotton [21], salt stress response in Arabidopsis and rice [22,23], and the biotic stress response in Arabidopsis [24].
In the present study, we re-analyzed three diverse salt-stress transcriptomic datasets in rice and identified the core salt-stress responsive genes. Further, by applying WGCNA, we identified three functional modules and several biological and metabolic pathways that are involved in rice response to salt. Finally, we proposed various putative novel salt stress-responsive uncharacterized genes that can be harnessed to improve salt tolerance in rice.

2. Materials and Methods

2.1. Plant Material and Growth Conditions

The seeds of japonica rice cultivar “Hunan” were collected from Hunan Rice Research Institute, Changsha, China. The experiment was conducted in controlled environment of a greenhouse. The seeds were surface sterilized with 1% NaOCl solution to remove the contaminants. Sterilized seeds were immersed in water at 37 °C for two days followed by germination at 30 °C with a photoperiod of 16 h (light)/8 h (dark) and a relative humidity set at 70%. Seedlings were grown for a week in 2000 ml boxes containing a ½ strength Hoagland nutrient solution. Then, the salt stress condition was applied by adding to the nutrient solution 200 mM NaCl solution in one step and then the whole plant (shoot + root) was harvested after 0, 3, 6, and 12 h time period later. The control seedlings were maintained in a nutrient solution without salt treatment and samples were collected in parallel. Three biological replicates were maintained for control and salt treatment for each time point.

2.2. RNA Isolation and qRT-PCR Gene Expression Analysis

Plant total RNA from control and salt-treated samples was isolated using an RNA extraction kit (Tiangen, Beijing, China), and the first-strand cDNA was synthesized from 2 µg of RNA by reverse transcriptase (Invitrogen, Carlsbad, CA, USA), and then diluted (1:4) for use in qRT-PCR with SYBR Premix ExTaq Mix (Takara, Dalian, Liaoning, China) in a total volume of 20 µL. Reactions were performed in a LightCycler 480 thermal cycler (Roche, Basel, Switzerland), following the manufacturer’s instructions. Three biological replicates were analyzed for each sample, and the expression level was normalized to that of the rice Actin-1 gene (LOC4333919), which is stably and constitutively expressed in rice tissues and under various stress conditions [25]. The primer sequences used in this study are given in Table S1.

2.3. Data Acquisition and RNA-Seq Analysis

RNA sequence data for control and salt-treated japonica rice cultivars were downloaded from the National Center for Biotechnology Information (NCBI) Sequence Read Archive (SRA) (https://www.ncbi.nlm.nih.gov/sra). After quality control, only datasets with high quality (clean data with at least 90% of bases scoring Q30 and above) were kept and their SRA accessions and information are listed in Table 1. The rice reference genome and gene model annotation files (MSU7.0) were downloaded from the JGI database directly. We mapped the reads to the Oryza sativa L. japonica. cv. Nipponbare genome using STAR (2.5.1b) [26] and then “Trimmed Mean of M-values” (TMM) normalized fragments per kilobase of transcript per million fragments mapped (FPKM) values were used to estimate the gene expression level [27]. A stringent criterion (fold-change ≥ 2 and q_value ≤ 0.05, with a significant false discovery rate-adjusted p value (FDR) < 0.05) was used to screen out the differentially expressed genes (DEGs) between each set of compared samples by the edgeR software [28]. Significance of the overlap between DEGs in the three datasets was estimated using the hypergeometric test computed with the “phyper” function in the R software (http://www.r-project.org) with a Bonferroni correction of the p values.

2.4. Gene Ontology and KEGG Analysis of the Core DEGs

Salt responsive core DEGs were identified by comparing all DEGs among different datasets using Venn diagram analysis. These genes were then subjected to Gene Ontology (GO) and Kyoto Encyclopedia of Genes and Genomes (KEGG) significant enrichment analysis to identify the enriched biological processes and metabolic pathways involved in salt tolerance. GO and KEGG enrichment was analyzed using clusterProfiler. The heatmap was exhibited using “heat map” R-package. The information of transcription factor families was downloaded from Plant TFDB (planttfdb.cbi.pku.edu.cn/).

2.5. Weighted Gene Co-Expression Network Analysis (WGCNA)

Gene co-expression networks were constructed using the WGCNA package in the R software. The core DEGs were further divided into three modules using WGCNA and correlation of each module with salt stress was calculated. Module-trait associations were estimated using the correlation between the module eigengene and salt/control treatments. Network visualization for each module was performed using the Cytoscape software version 3.6.1 with a cut-off of the weight parameter obtained from the WGCNA set at 0.3. [29]. The gene co-expression network is a scale-free weighted gene network with multiple nodes connected to different nodes via edges. Each node represents a gene, which is connected to a different number of genes. The gene which is connected to a greater number of genes is denoted with a bigger size and is more important for its interaction with a large number of genes.

3. Results

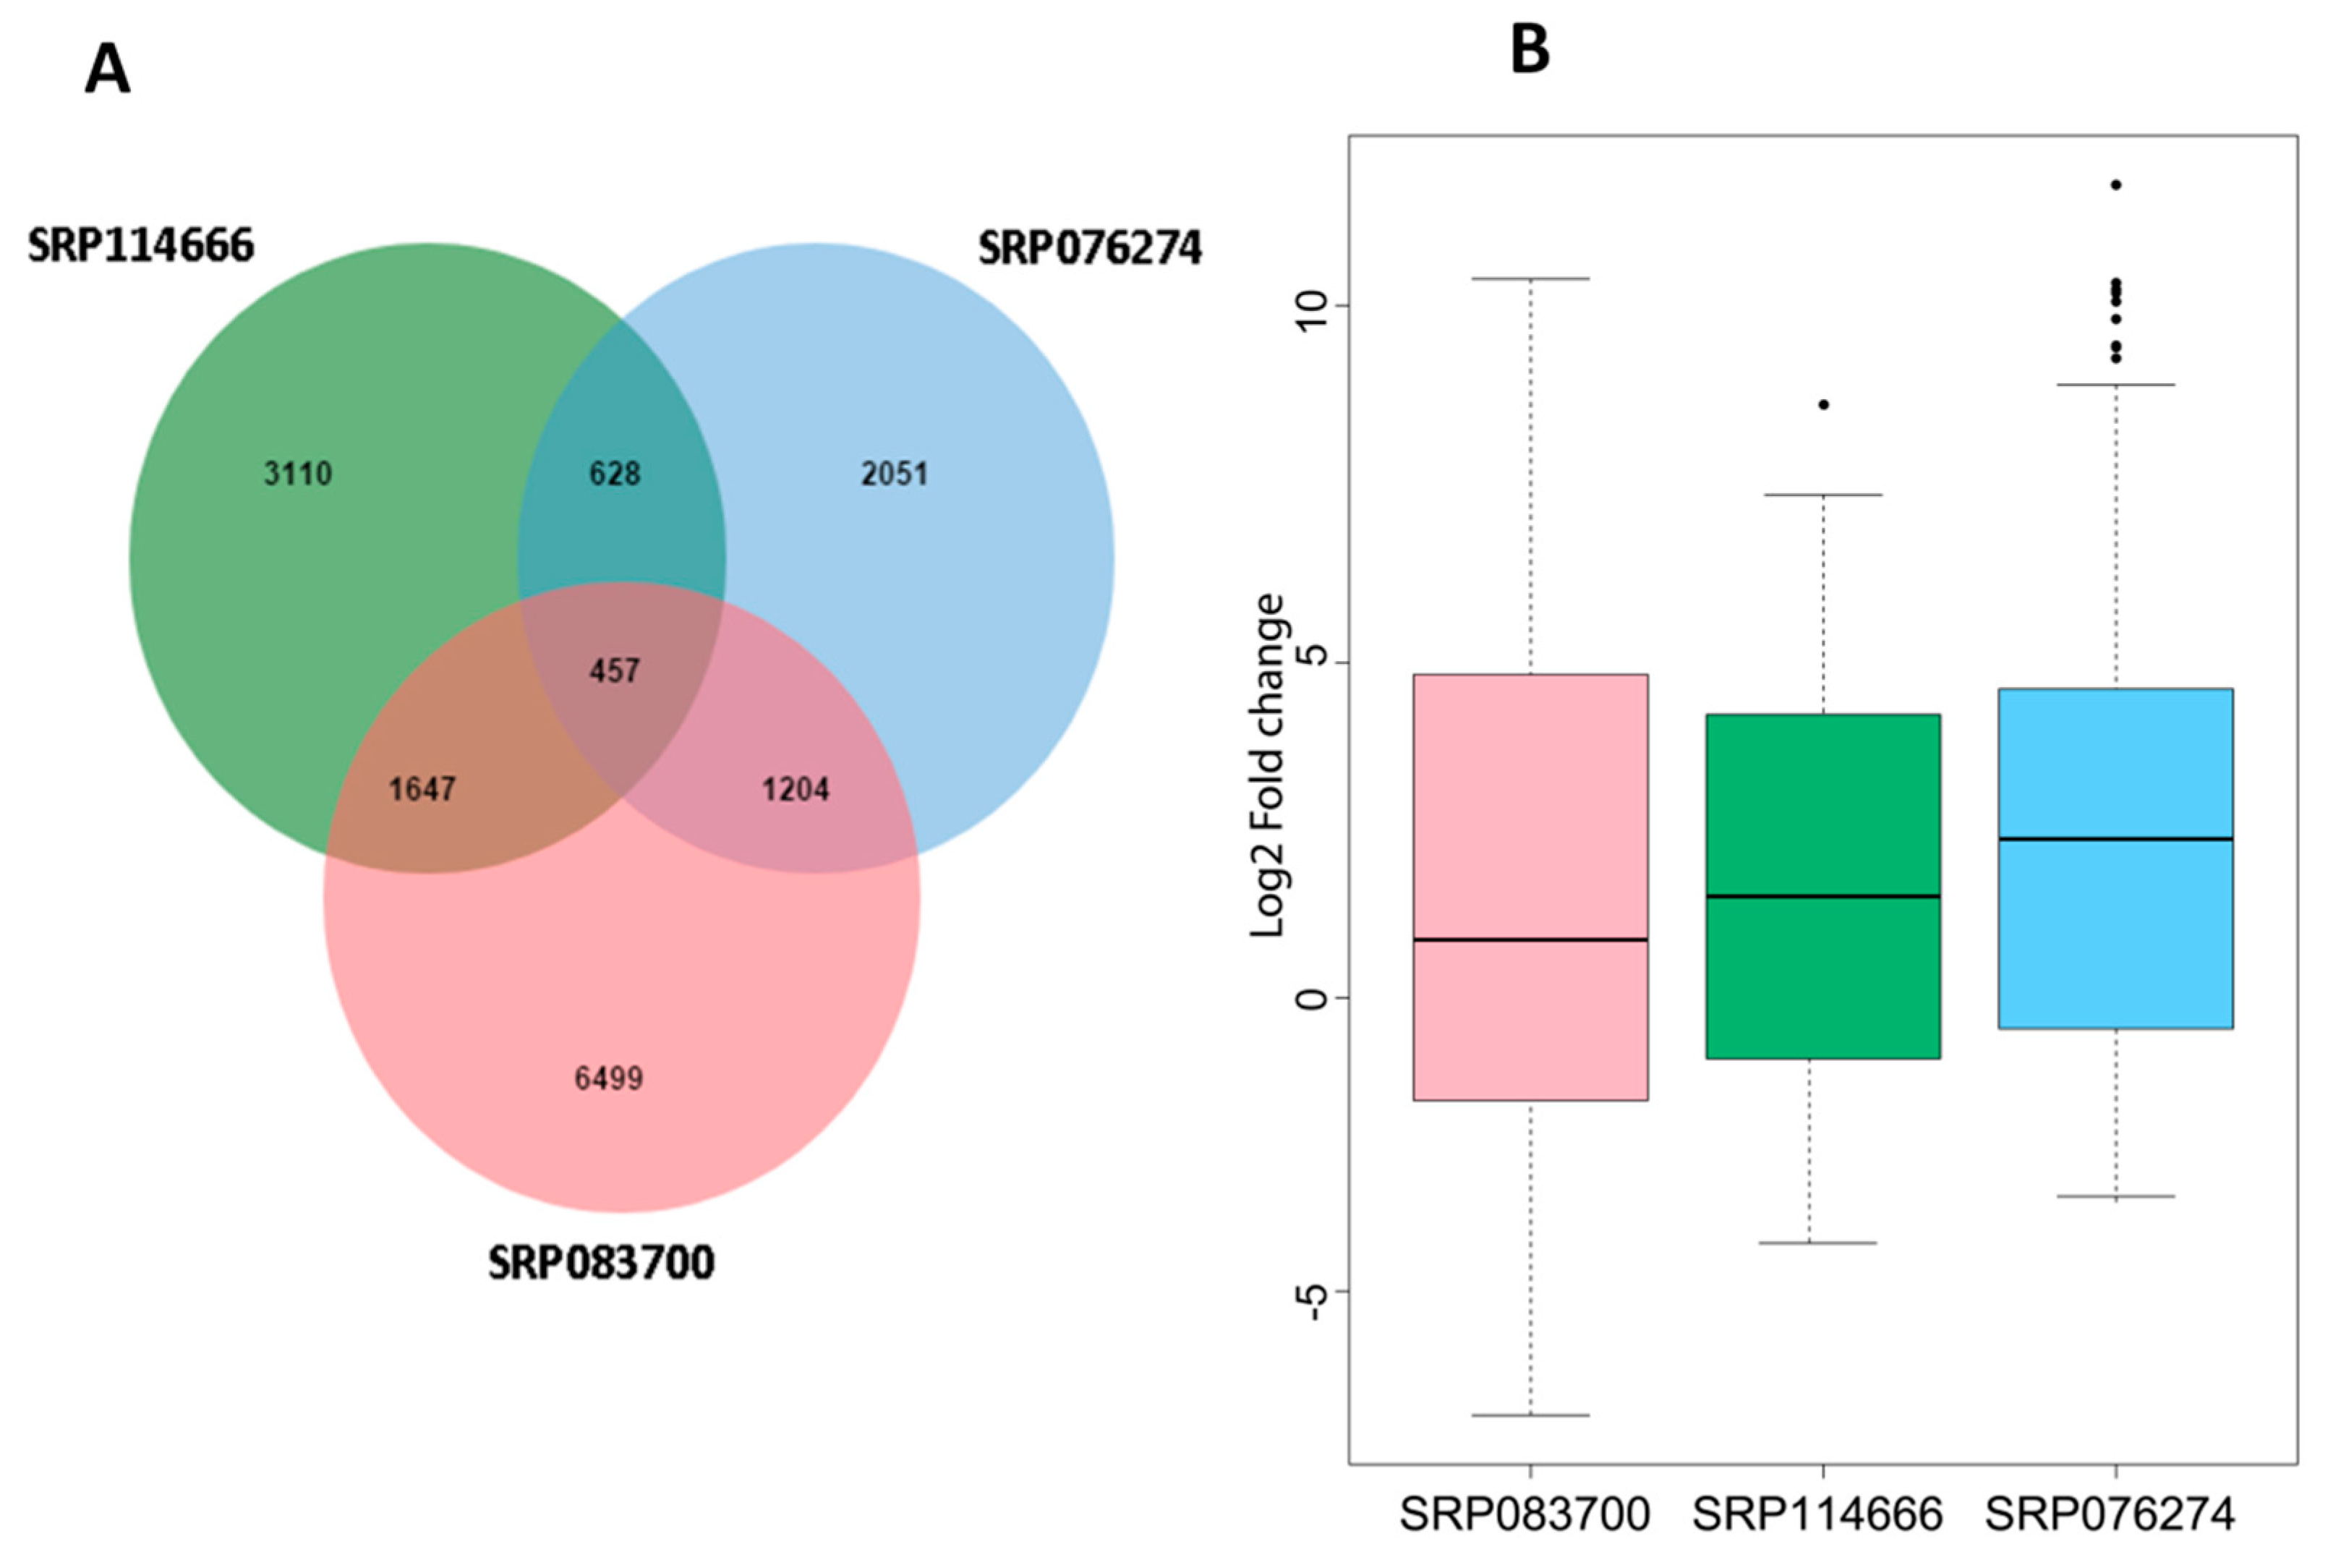
3.1. Identification of the Salt-Responsive Core DEGs in Rice

In this study, we analyzed the global gene expression profiles of japonica rice cultivars for salt stress response using different datasets, namely, SRP114666, SRP076274, and SRP083700. The details of these datasets including treatment, tissue, and accession numbers are given in Table 1. From a total of 28,432 expressed genes among the different datasets, 15,596 unique differentially expressed genes (DEGs) were identified between control and stressed samples in the different datasets (Table S2).
In order to identify the salt responsive core DEGs, we cross-compared the DEGs among the three different datasets, which resulted in 457 core DEGs that are common in rice, independently of the tissue type, genotype, and the salt stress duration/intensity. These core DEGs were statistically significant based on the hypergrometric test (p < 0.001) There were 628 common DEGs among SRP114666 and SRP076274; 1204 common DEGs among SRP076274 and SRP083700; 1,647 common DEGs among SRP114666 and SRP083700 (Figure 1A). The expression fold changes between control and stress treatments of these 457 core DEGs greatly varied among datasets but were mainly up-regulated under stress, confirming that these core DEGs are responsive to salt (Figure 1B). The thousands of genes specific to each dataset may be caused by differences in salt tolerance levels of the genotypes, their genetic make-up, the sampled tissues, salt stress treatments, and growth conditions.
We then characterized these 457 core DEGs to get insight into their contributing molecular pathways. To achieve this, we first performed gene ontology (GO) to identify the significantly enriched biological processes contributed by these DEGs. GO analysis unveiled that “peroxidase activity” was the most enriched biological process followed by “response to stress” with the q-value lower than 0.1, suggesting that peroxidase genes are involved in salt response by regulating the antioxidant activity (Figure 2A). Next, we performed Kyoto Encyclopedia of genes and genomes (KEGG) analysis to identify enriched pathways contributed by the 457 core salt responsive DEGs. Phenylpropanoid biosynthesis was the most significantly enriched KEGG pathway followed by glutathione metabolism, indicating that phenylpropanoid and glutathione play key roles in salt response in rice (Figure 2B).

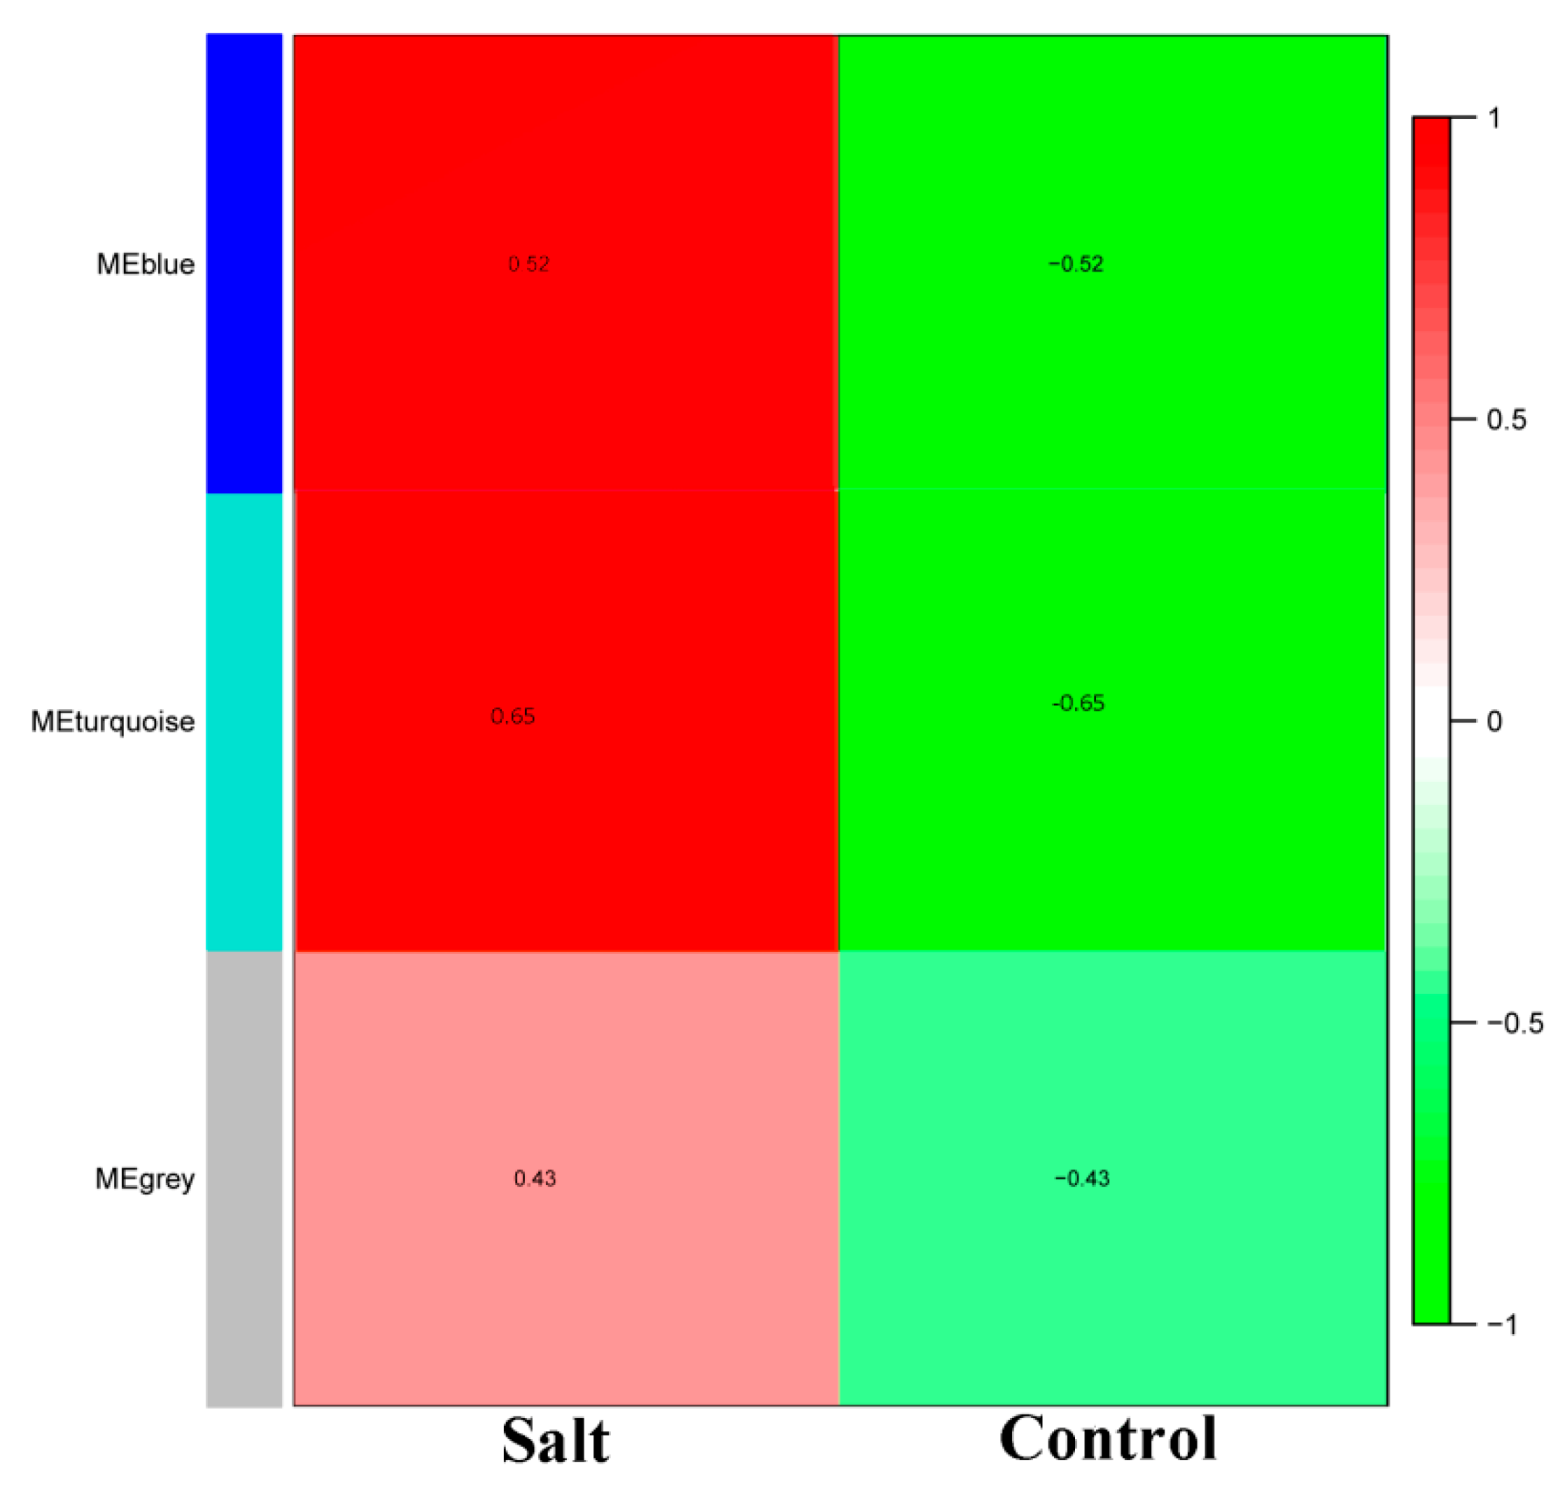
3.2. WGCNA of the Salt-Responsive Core Genome

In order to identify the different co-expressed modules under salinity stress in rice, we conducted a WGCNA on the 457 core DEGs. We successfully obtained three modules: Blue, grey and turquoise (Figure 3). The blue module contained 196 DEGs, the grey module contained 32 DEGs and turquoise module contained 229 DEGs (Table S3). All the modules had a positive correlation (r = 0.52, r = 0.43 and r = 0.65 for blue, grey, and turquoise, respectively) with salt stress, suggesting that genes in these modules positively regulate salt tolerance in rice. Thus, these genes should be up-regulated under salt stress to achieve salt tolerance. To further understand the particularity of each co-expressed module with respect to their expression patterns in the different datasets, we plotted the log10 FPKM values of the genes belonging to each module along with the eigengene expression values (Figure 4). We observed that in all the detected modules, the gene expression levels were higher under salt stress than in control condition, confirming the positive correlations observed earlier. The blue module genes appeared to be more responsive to sea water treatment than 200–300 mM NaCl treatments. Since seawater contains approximately 600 mM NaCl, we deduce that blue module genes are more responsive to high salt concentration. The turquoise module genes displayed the opposite trend with more induction under 200–300 mM NaCl treatments than under seawater treatment. Finally, we found that the grey module genes were particularly highly expressed in the control condition and the magnitude of induction under salt stress was weak as compared to the blue and turquoise genes.

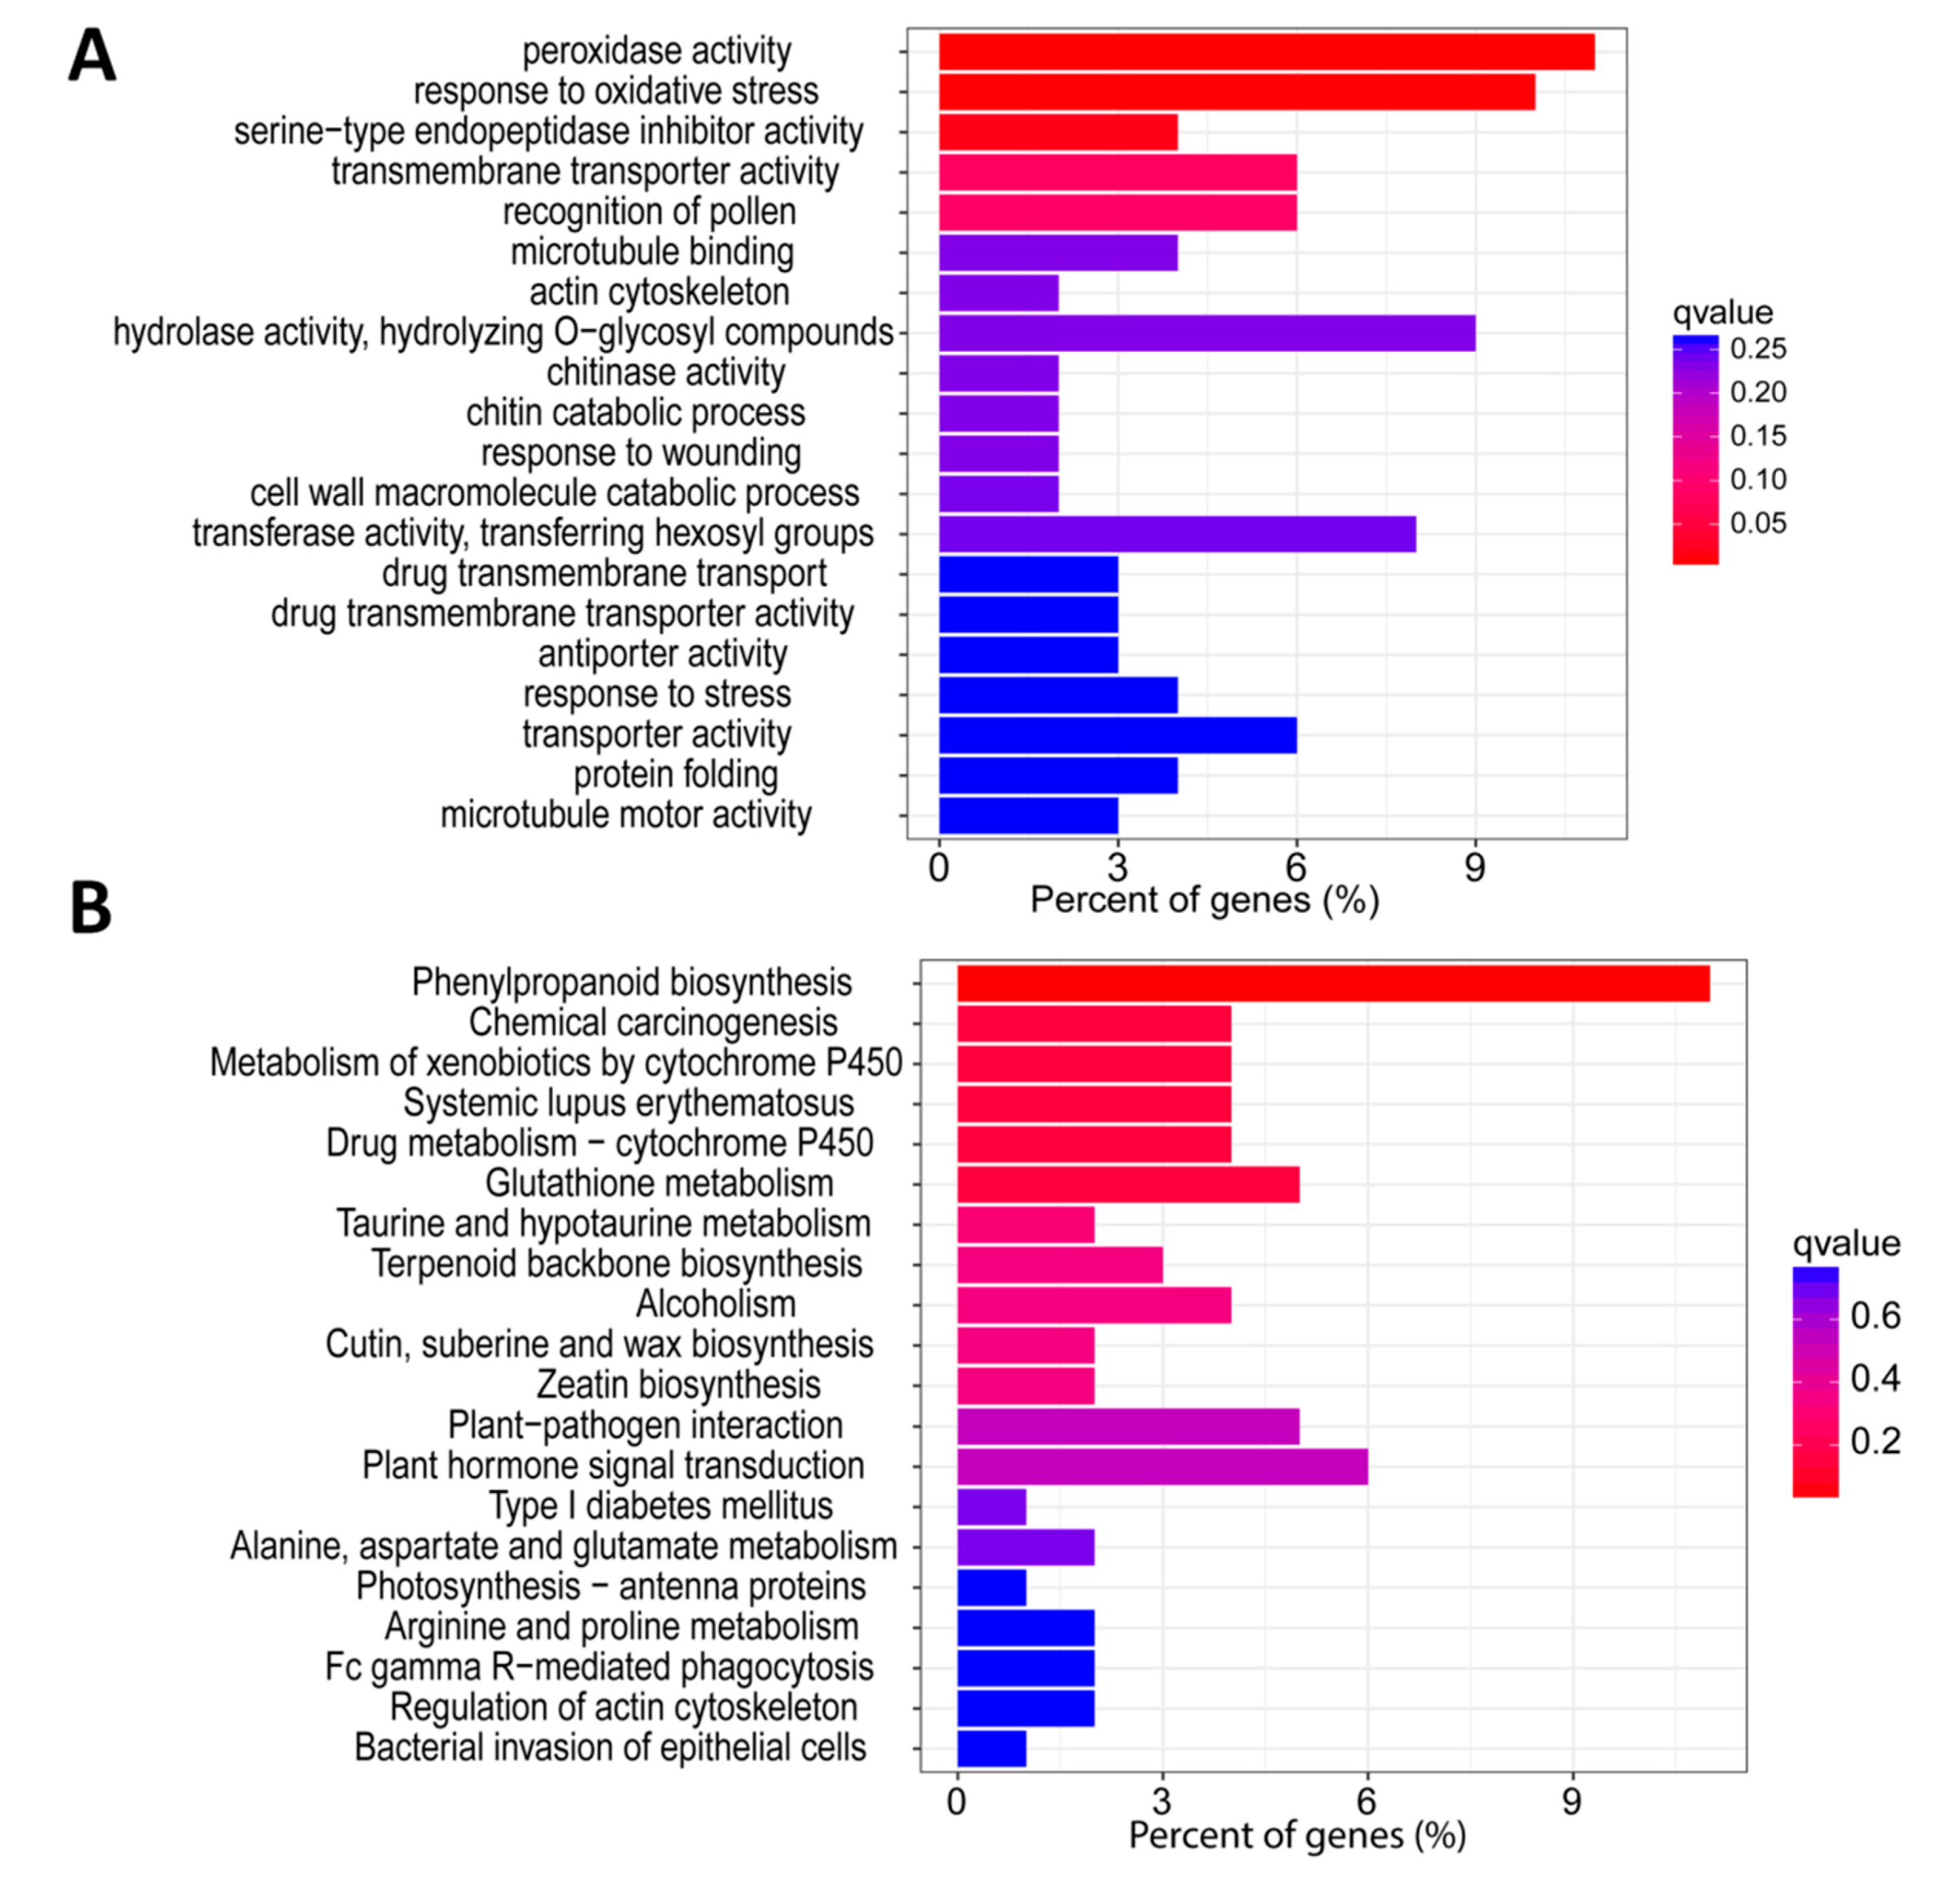
3.3. GO and KEGG Enrichment Analysis of the Detected Co-Expressed Modules

To reveal the specific functions played by each co-expressed module, we performed GO and KEGG analysis of DEGs from each module separately. GO analysis indicated that “response to oxidative stress” and “peroxidase activity” were the most significantly enriched biological processes in the blue module (Figure S1A). This suggests that genes in the blue module are involved in tolerance to oxidative stress perhaps via scavenging of reactive oxygen species (ROS) such as hydrogen peroxide, superoxide radicals, etc. KEGG analysis indicated “phenylpropanoid biosynthesis” and “plant hormone signal transduction” as the most significantly enriched metabolic pathway, suggesting that genes in blue module contribute to salt tolerance via regulating phenylpropanoid related metabolites and plant hormones (Figure S1B). Regarding grey module, GO analysis identified “iron ion binding” as the most significantly enriched biological process which means that most of the genes in this module contribute to salt tolerance by regulating iron ion binding (Figure S2A). Curiously, KEGG analysis of grey module DEGs displayed various metabolic pathways that were equally enriched, suggesting that they are engaged in diverse molecular pathways (Figure S2B). Concerning the turquoise module, GO analysis displayed “ADP binding” as the most significantly enriched biological process, denoting that regulation of energy metabolism is essential for salinity tolerance (Figure S3A). Notably, KEGG analysis of turquoise module genes identified “phenylpropanoid biosynthesis” and “gluthatione metabolism” as the most significantly enriched metabolic pathway showing that genes in this module regulate phenylpropanoid related metabolites but also the antioxidant gluthatione in response to salt stress (Figure S3B).

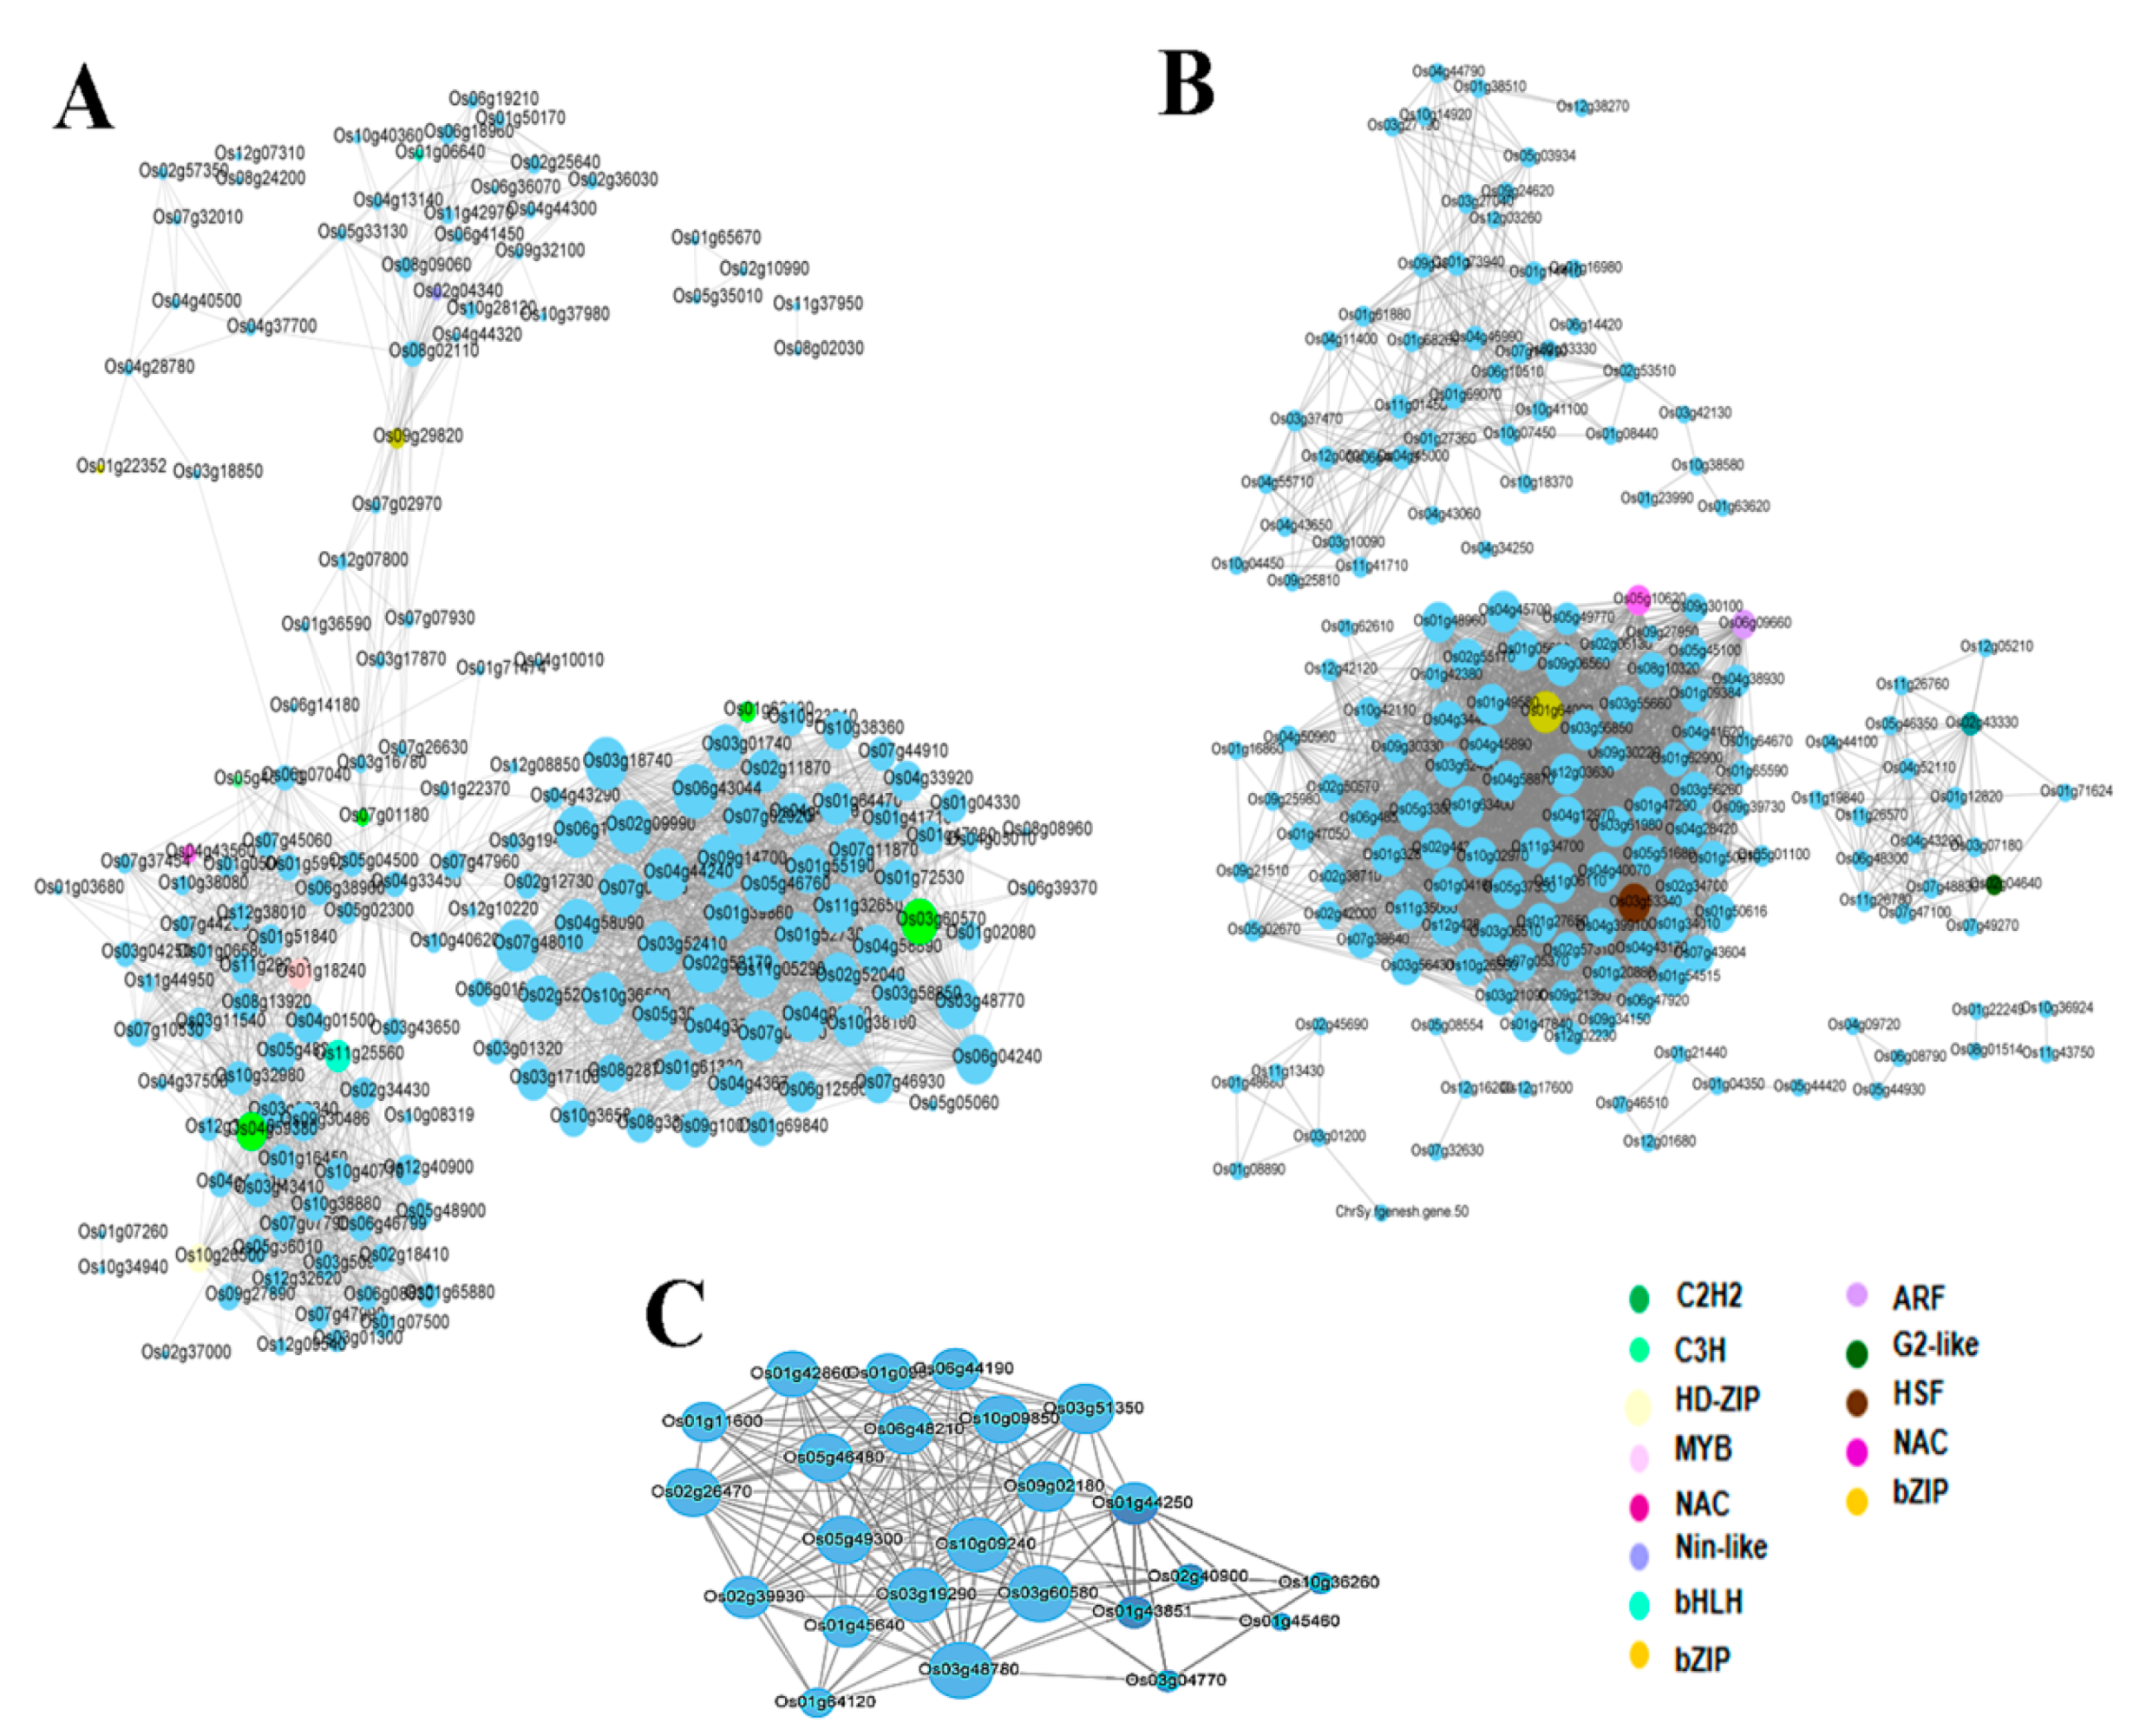
3.4. Networks Displaying Relationships among Genes within Co-Expressed Modules

We constructed the network of the detected co-expressed modules with the aim to identify key hub genes. Genes encoding transcription factors (TFs) are represented with different node colors except sky blue. The size of the node circle is positively correlated with the number of genes that it partners in interaction. Genes in the blue module were divided into three clusters, each having a network of a different number of genes (Figure 5). In gene networks, a smaller subset of genes (hub genes) interacts with many other genes and it is suggested that they are three times more likely to be essential than genes with fewer interaction partners [30]. In the present study, we identified 15 hub genes from the three modules encoding different proteins including carboxyesterase, calmodulin binding protein, DNA binding protein, LEA4-5, low temperature and salt responsive proteins (Table 2). Among the 15 hub genes, we report two unknown genes (LOC_Os05g27340, LOC_Os01g72009) and two proteins of unknown domains DUF630/632 (LOC_Os02g43770) and DUF581 (LOC_Os09g20240). Transcription factors (TF) are well known to play a crucial role in abiotic stress tolerance in plants by regulating the expression of stress-responsive genes [31,32]. Therefore, we searched for the TFs within each module detected by WGCNA in this study. TFs in the blue module include C2H2-type zinc finger (LOC_Os03g60570, LOC_Os01g62190, LOC_Os04g59380, and LOC_Os07g01180), basic helix–loop–helix, bHLH (LOC_Os11g25560), myeloblastosis, MYB (LOC_Os01g18240), basic leucine-zipper, bZIP (LOC_Os09g29820), NAC (LOC_Os04g43560) and plant regulator RWP-RK family protein (LOC_Os02g04340). Each of these TFs interacts with several target genes and may regulate their expression (Figure 5A). TF genes detected in the turquoise module are bZIP (LOC_Os01g64000), HSF (LOC_Os03g53340), NAC (LOC_Os05g10620), ARF (LOC_Os06g09660), homeobox (LOC_Os02g43330), and MYB (LOC_Os02g04640) (Figure 5B). Notably, the grey module does not have any gene encoding TF (Figure 5C).

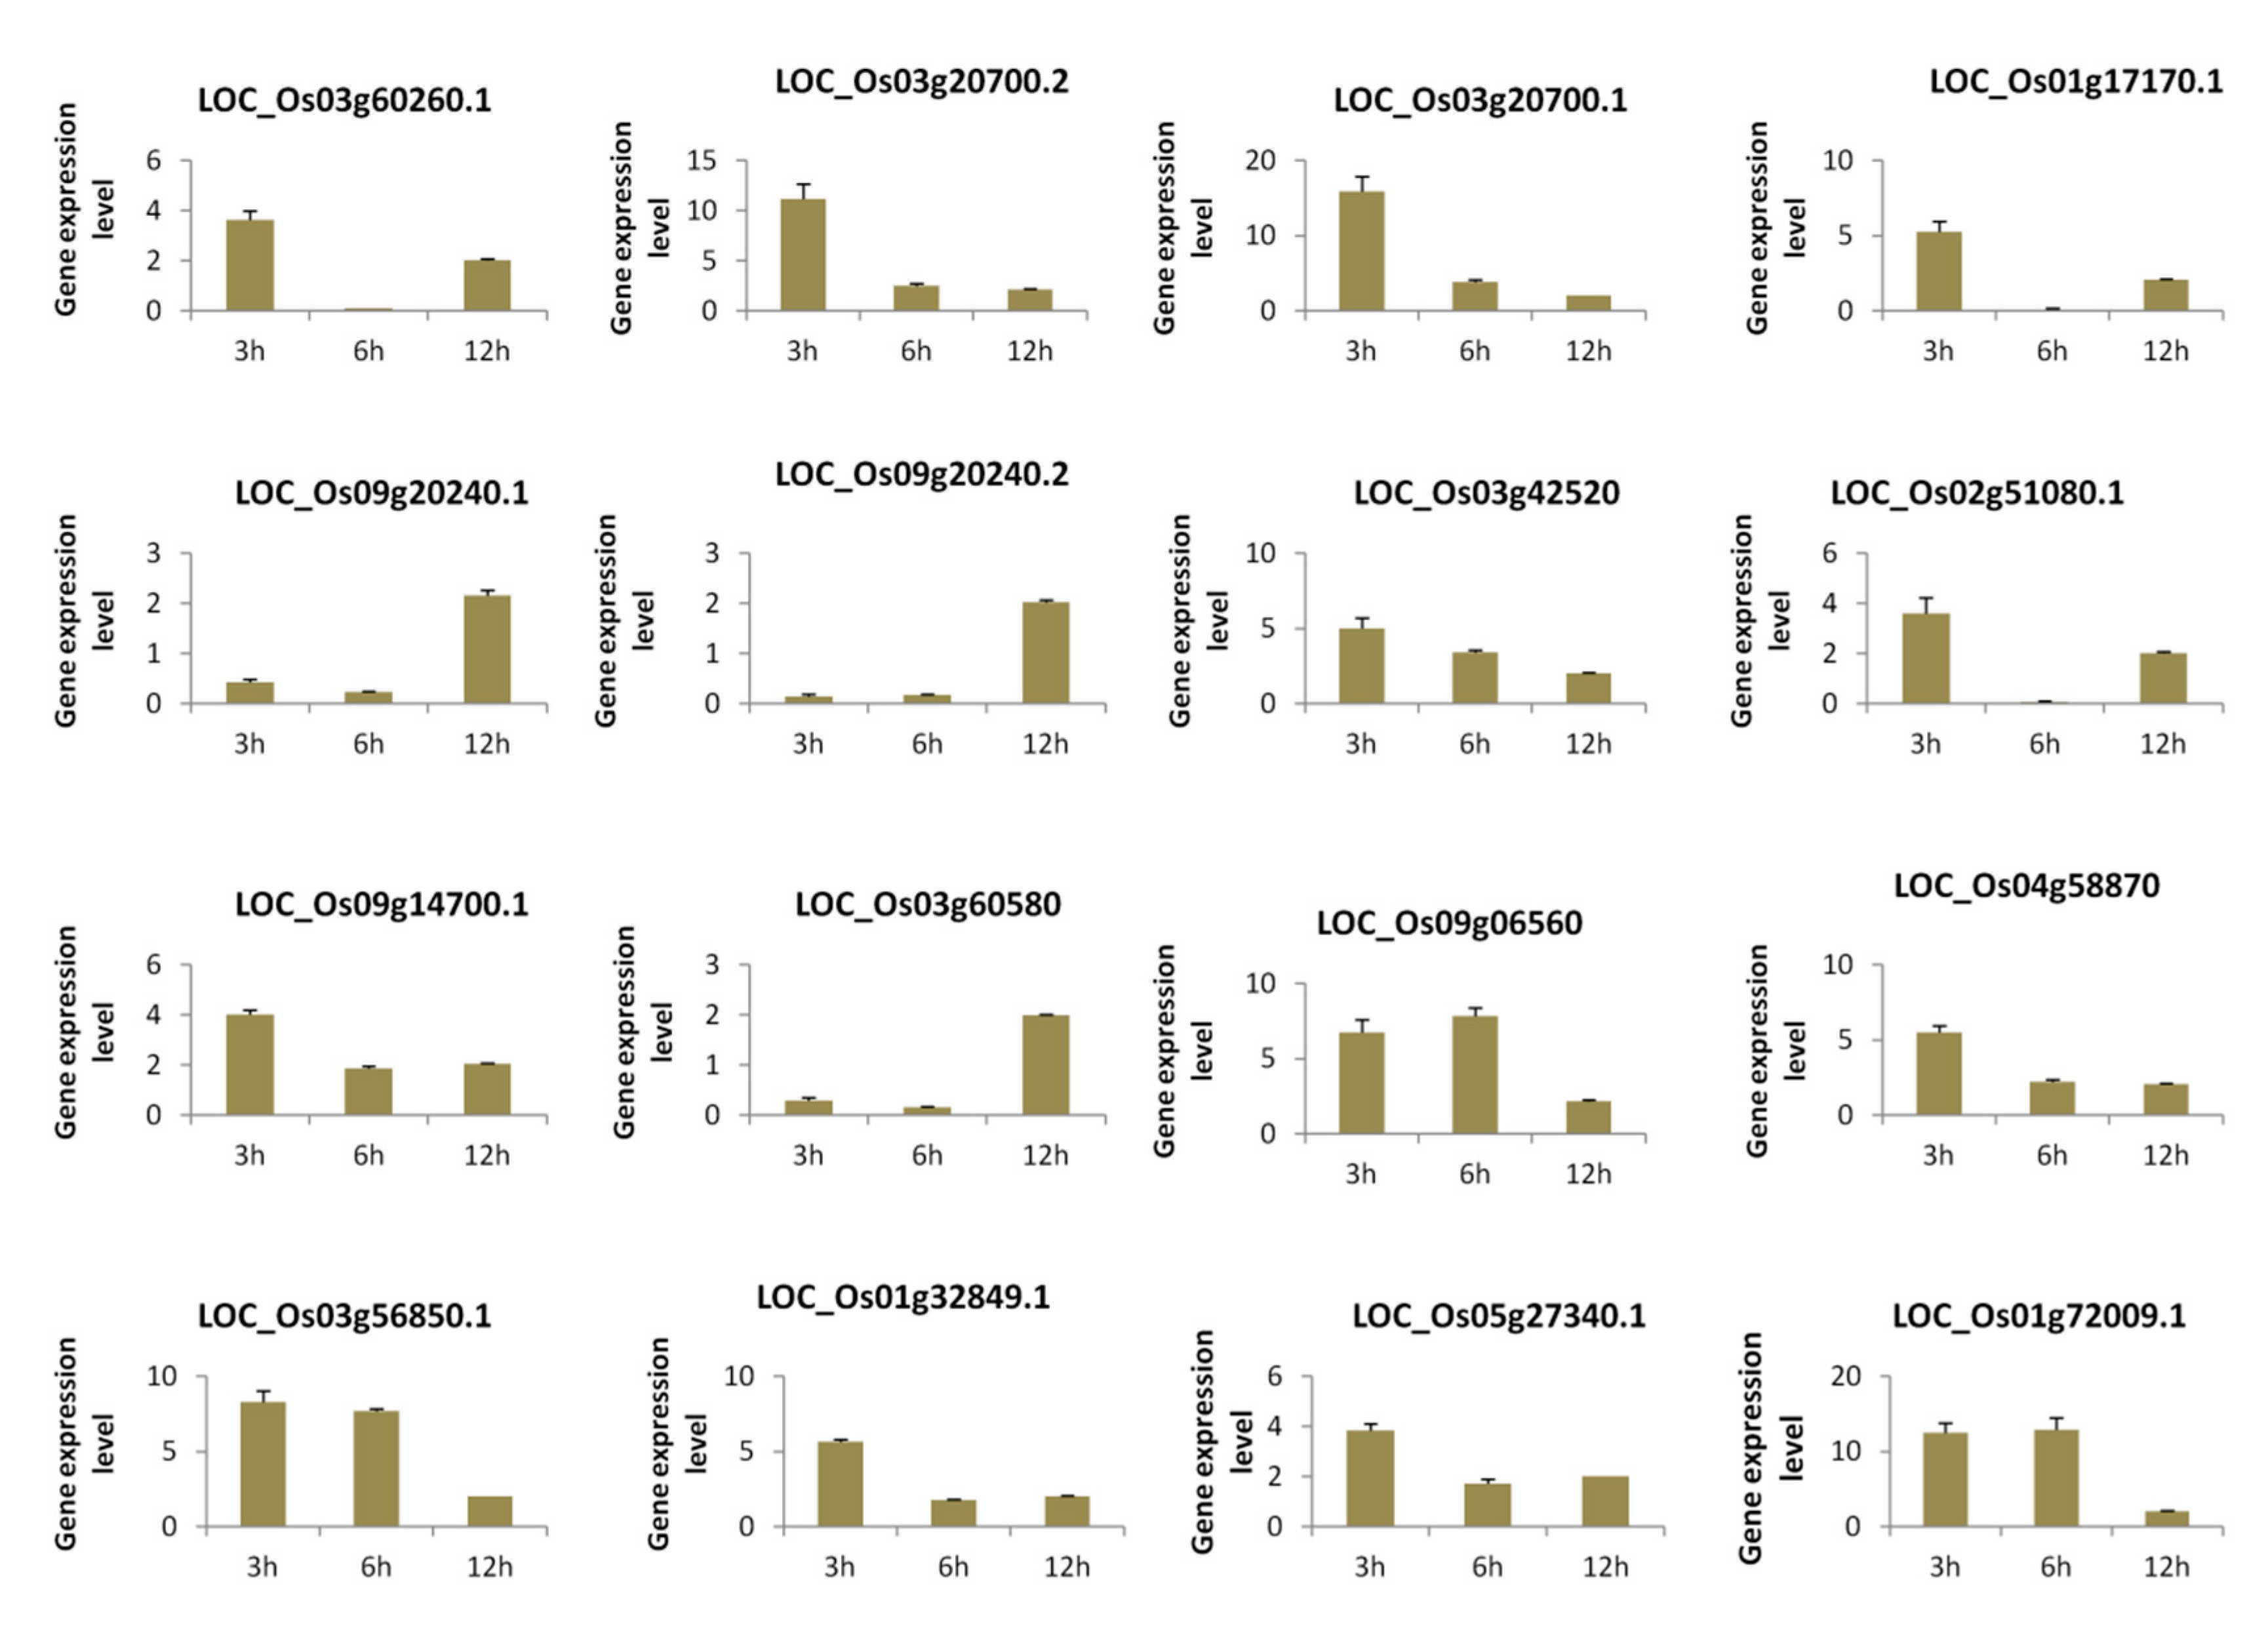
3.5. qRT-PCR Validation of Selected Genes from Each Module under Temporal Salt Stress

In order to experimentally confirm the results of our computational analysis, we selected 16 genes mainly the hub genes from the three modules and performed a quantitative reverse-transcription PCR (qRT-PCR) analysis of their expression levels after 3 h, 6 h, and 12 h salt stress treatments in an independent rice cultivar “Hunan”. The results showed that the expression levels of all the selected genes were significantly changed at each time point under salt stress as compared to control, demonstrating that the genes were all responsive to salt (Figure 6).

4. Discussion

Salt stress is major abiotic stress reducing production in major cereal crops including maize [33], barley [34], wheat [35], and rice [36]. Rice is a very sensitive crop to salinity stress and its yield and productivity are critically impaired due to highly increasing salinity levels in agricultural soil. Thus, it is important to understand the molecular mechanisms underlying salt response in rice. In recent years, transcriptomic data has opened up the doors to analyze and unravel the molecular mechanism and biological processes involved in abiotic and biotic stress response in plants. RNA sequencing (RNA-seq) analysis is a critical, easy, rapid, and economical approach of transcriptome studies [37]. Different stress responsive genes have been identified by RNA-seq analysis and their expression under salinity stress already been clarified in various plants including Glycine max [38], rice [39], sweet potato [40], and wild barley [41]. RNA-seq generates a bundle of information for a target phenotype or stress; however, resourceful utilization of this data has been a bottleneck. Recently, availability of several bioinformatics and statistical tools have helped plant scientists to pinpoint key biological processes and metabolic pathways involved in biotic or abiotic stress tolerance, through meta-analysis of large RNA-seq datasets [42].
The present study was aimed at understanding the central players of salt response in rice through an analysis of three RNA-seq datasets. We unraveled 457 genes constantly altered under salt stress in all datasets which may be essential for rice salt responses since they were not specific to a tissue type, genotype, or stress intensity. Moreover, a subset of these genes was validated through qRT-PCR in an independent rice cultivar, proving that the salt responsive core DEGs detected in the present study is common in rice. GO and KEGG enrichment analyses of the core DEGs unveiled various biological pathways contributed by these genes under salt stress. “Peroxidase activity” was the most enriched biological process under salt response in rice (Figure 2A). During various environmental stimuli, plants generate and accumulate significant level of reactive oxygen species (ROS) such as superoxide anions (O-2O2-), hydrogen peroxide (H2O2), hydroxyl radicals (OH), and singlet oxygen (1O2) [43]. High accumulation of ROS leads to oxidative damage to cellular membranes (lipid peroxidation), proteins, RNA, and DNA, resulting in irreversible cellular damage and even cell death [44]. Plants have strong ROS scavenging enzymes and antioxidants to neutralize ROS. Peroxidase is one of the scavenging enzymes and is reported to have important role in enhancing tolerance against various stresses including salinity [45]. Earlier studies have reported hydrogen peroxide (H2O2) accumulation during salt stress treatment in rice [46]. Thus, based on the result of our study, an increase activity of peroxidase genes may lead to salt tolerance in rice. Many genes also contributed to “phenylpropanoid pathway”, suggesting that during salt stress, regulation of phenylpropanoid metabolites helps rice to combat salt damage. Various enzymes involved in phenylpropanoid pathway such as Phenyl ammonium Lyase (PAL) serve as biochemical markers for stress conditions [47]. Earlier reports suggested that higher PAL levels are directly related to increased tolerance to environmental stress [48]. Ref. [49] found that increased NaCl concentrations enhance PAL enzyme activity in Jatropha curcas seedlings. PAL and flavonoid pathways related structural genes are considered as two critical defense signaling cascades during environmental stress in plants [50]. Ref. [51] reported that activation of PAL as a key component of the antioxidant system in salt-challenged maize is a promising target for maize salt resistance engineering. We also found “iron ion binding” as a significantly enriched biological process. Iron (Fe) is one of the crucial micronutrients for plant growth and development. During the whole life cycle of a plant, iron performs most of the major functions from chlorophyll biosynthesis to energy transfer [52]. It has been reported that salinity inhibits the deposition and distribution of nutrients in the plants [53,54]. The most frequent feature during salinity is chlorosis due to a limited supply of Fe to plants. Ref. [55] showed the inhibitory effect of salinity on the accumulation of Fe content in the shoots of peas. We speculate that manipulation of target core DEGs will favor optimum Fe supply to rice plants under salinity stress. Another important enriched metabolic pathway was “starch and sugar metabolism”. Starch is an important molecule that mediates plant responses to abiotic stresses, including drought, salinity and extreme temperatures [56,57]. When the photosynthesis is potentially limited, plants remobilize starch to provide energy and carbon. Sugar metabolites are considered as osmoprotectants and compatible solutes to alleviate the negative effects of stress [58]. Sugar is another important carbohydrate and signaling molecule that also cross-talks with the ABA-dependent signaling mechanism to mitigate the stress damage [59]. Thus, we infer that the genes involved in starch and sugar metabolism regulate salt response in rice by inducing the carbohydrate metabolism.
WGCNA divided the core DEGs into three modules, each of them contributing to salt tolerance in a unique metabolic pathway (Figure 3). Importantly, we found that increasing the expression level of the core DEGs is beneficial for salt tolerance in rice. Network construction highlighted several hub genes predicted to play central roles in salt response in rice. Interestingly, most of these genes were unreported with regard to their involvement in salt response in rice. Several genes from the families of the hub genes (CAM, HSF, and DUF630/632) identified in blue module have been reported to regulate the abiotic stress response. For example, transgenic rice over-expressing the calmodulin gene OsCam1–1 (LOC_Os03g20370) is more tolerant to salt stress than wild type [60]. Ref. [61] reported the role of DUF630/632 in controlling leaf rolling in rice, while its role under salinity tolerance is not yet confirmed. We also reported the hub TF Heat Shock Factor c1 (HSFc1). Earlier reports showed that HSF (OsHsfc1b) regulates salt tolerance and development in rice [62]. The hub genes in grey module are pyridine nucleotide-disulphide oxidoreductase family proteins (LOC_Os02g51080, LOC_Os03g20700), dicarboxylate diiron protein, ACSF, CHL27 (LOC_Os01g17170) and Domain of unknown function DUF581 (LOC_Os09g20240). The DUF581 encoding gene was differentially expressed by hormones and environmental cues in Arabidopsis [63]. Pyridine nucleotide-disulphide oxidoreductases active site I is evolutionarily conserved in Glutathione Reductase (GR) in rice and Arabidopsis [64]. GR plays an important role in defending the plant from oxidative damage induced by various biotic and abiotic stressors [65]. In the turquoise module, we identified low temperature and salt responsive protein (LOC_Os03g17790), phloem protein 2-A13, (LOC_Os04g48270), and Late Embryogenesis Abundant 4-5 (LOC_Os08g23870). These genes might play preponderant functions for salt stress response in rice. OsLEA3 gene overexpression in rice showed enhanced tolerance against drought and salinity [66]. AtLEA4-5 is a member of the group 4 late embryogenesis abundant (LEA) proteins, which are involved in the tolerance of water deficits in Arabidopsis [67]. Dossa et al. [68] recently demonstrated that overexpression of a hub gene from the sesame core-abiotic stress responsive genes confer tolerance to multiple stresses in Arabidopsis. In this study, qRT-PCR analysis of the detected hub genes in an independent rice cultivar revealed that they were mostly up-regulated at different time points under salt stress, showing that increasing their expression levels would enhance salt tolerance in rice. Overall, the hub genes identified in the present study provide novel tools to be harnessed for engineering highly salt tolerant rice cultivars.
Transcription factors have been well documented to play key roles in stress tolerance by regulating the stress-responsive gene expression [69]. We have identified C2H2 type zinc finger, MYB, bZIP, and NAC transcription factor family proteins as major regulators of the core salt responsive genes in rice. Several members of these TF families have been reported to regulate plant response to environmental stress including salinity [70,71]. MYB TFs are involved in plant development, secondary metabolism, signal transduction, and biotic and abiotic stress tolerance [72]. OsMYB6 gene overexpression increased drought and salinity tolerance in rice [73]. bZIP TFs have been identified in different plants including Arabidopsis and rice [74,75]. They regulate the responses to biotic and abiotic stresses, including pathogen defense, hormone and sugar signaling, light response, and salt and drought tolerance [76]. OsbZIP71 conferred salinity and drought tolerance in rice [77]. Stress-responsive NAC proteins have been reported as positive regulators of abiotic stress tolerance [78]. Hong et al. [78] identified a novel stress-responsive rice NAC gene, ONAC022 and reported that its overexpression improves drought and salinity tolerance. Furthermore, rice plants overexpressing STRESS-RESPONSIVE NAC1 (SNAC1) showed significantly improved drought and salt tolerance [79]. Altogether, we propose that these novel transcription factors could be functionally characterized using reverse genetic experiments.

5. Conclusions

In short, this study identified the core salt responsive genes and modules from diverse transcriptome datasets in rice. GO and KEGG analyses highlighted “peroxidase activity”, “phenylpropanoid pathways” and “plant hormone signal transduction”, as key biological processes and metabolic pathways involved in salt response in rice. Network analysis pinpointed several putative TFs from C2H2, Zinc-finger domain, homeobox domain, bZIP, and MYB families that could be important regulators of salt response in rice. Furthermore, hub genes identified in this study may be potential targets to engineer rice plants with improved salt tolerance. Additionally, this work lays a strong foundation for further investigation of the unknown proteins such as CHL27, PP2-13, DUF630/632, and DUF581 in rice and in other plants with reference to salt and other abiotic factors.

Supplementary Materials

The following are available online at https://www.mdpi.com/2073-4425/10/9/719/s1, Table S1. List of the primers used for the qRT-PCR experiment, Table S2. List of the differentially expressed genes identified in the three datasets, Table S3. Core salt responsive genes in rice classified into three co-expressed modules, Figure S1. Gene ontology (A) and KEGG analysis (B) of DEGs belonging to blue module under salt stress in rice, Figure S2. Gene ontology (A) and KEGG enrichment analysis (B) of DEGs belonging to grey module under salt stress in rice, Figure S3. Gene ontology (A) and KEGG enrichment analyses (B) of DEGs belonging to turquoise module under salt stress in rice.

Author Contributions

Y.Y., P.H., J.W. conceived, designed and supervised the experiment; M.Z., H.X., X.W., K.D., Y.Y., S.H., G.T., X.Z. performed the experiments and conducted data analyses. M.Z., K.D. wrote the manuscript. All authors read and approved the final version of the manuscript.

Funding

This work was financially supported by the National Key Research and Development Program of China (2017YFD0100300) and the Major Science and Technology Projects in Hunan Province (2018NK1020).

Acknowledgments

We would like to thank Tianyuan Zhang from Wuhan Benagen Tech Solutions Company Limited for his assistance in data analysis.

Conflicts of Interest

The authors declare no conflict of interest and the funders had no role in the design of the study; in the collection, analyses, or interpretation of data; in the writing of the manuscript, or in the decision to publish the results.

References

  1. Majeed, A.; Muhammad, Z. Salinity: A Major Agricultural Problem—Causes, Impacts on Crop Productivity and Management Strategies. In Plant Abiotic Stress Tolerance; Hasanuzzaman, M., Hakeem, K., Nahar, K., Alharby, H., Eds.; Springer: Berlin, Germany, 2019; pp. 83–99. ISBN 978-3-030-06117-3. [Google Scholar]
  2. Munns, R.; Tester, M. Mechanisms of Salinity Tolerance. Annu. Rev. Plant Biol. 2008, 59, 651–681. [Google Scholar] [CrossRef] [PubMed] [Green Version]
  3. Ma, C.; Wang, Y.; Gu, D.; Nan, J.; Chen, S.; Li, H. Overexpression of S-adenosyl-L-methionine synthetase 2 from sugar beet M14 increased Arabidopsis tolerance to salt and oxidative stress. Int. J. Mol. Sci. 2017, 20, 847. [Google Scholar] [CrossRef] [PubMed]
  4. Lata, C.; Prasad, M. Role of DREBs in regulation of abiotic stress responses in plants. J. Exp. Bot. 2011, 62, 4731–4748. [Google Scholar] [CrossRef] [PubMed] [Green Version]
  5. Khan, M.S.; Pandey, M.K.; Hemalatha, S. Comparative Studies on the Role of Organic Biostimulant in Resistant and Susceptible Cultivars of Rice Grown under Saline Stress—Organic Biostimulant Alleviate Saline Stress in Tolerant and Susceptible cultivars of Rice. J. Crop Sci. Biotechnol. 2018, 21, 459–467. [Google Scholar] [CrossRef]
  6. Kumari, S.; Panjabinee Sabharwal, V.; Kushwaha, H.R.; Sopory, S.K.; Singla-Pareek, S.L.; Pareek, A. Transcriptome map for seedling stage specific salinity stress response indicates a specific set of genes as candidate for saline tolerance in Oryza sativa L. Funct. Integr. Genomics 2009, 9. [Google Scholar] [CrossRef] [PubMed]
  7. Carriger, S.; Vallee, D. More crop per drop. Rice Today 2007, 6, 10–13. [Google Scholar]
  8. Khan, M.S.; Akther, T.; MubarakAli, D.; Hemalatha, S. An investigation on the role of salicylic acid alleviates the saline stress in rice crop (Oryza sativa (L)). Biocatal. Agric. Biotechnol. 2019, 18, 101027. [Google Scholar] [CrossRef]
  9. Kawahara, Y.; de la Bastide, M.; Hamilton, J.P.; Kanamori, H.; Mccombie, W.R.; Ouyang, S.; Schwartz, D.C.; Tanaka, T.; Wu, J.; Zhou, S.; et al. Improvement of the Oryza sativa nipponbare reference genome using next generation sequence and optical map data. Rice 2013, 6, 4. [Google Scholar] [CrossRef]
  10. Reddy, I.N.B.L.; Kim, B.-K.; Yoon, I.-S.; Kim, K.-H.; Kwon, T.-R. Salt Tolerance in Rice: Focus on Mechanisms and Approaches. Rice 2017, 24, 123–144. [Google Scholar] [CrossRef]
  11. Tuteja, N. Abscisic Acid and Abiotic Stress Signaling. Plant Signal. Behav. 2007, 2, 135–138. [Google Scholar] [CrossRef] [Green Version]
  12. van Dam, S.; Craig, T.; de Magalhães, J.P. GeneFriends: A human RNA-seq-based gene and transcript co-expression database. Nucleic Acids Res. 2015, 43, D1124–D1132. [Google Scholar] [CrossRef] [PubMed]
  13. Shankar, R.; Bhattacharjee, A.; Jain, M. Transcriptome analysis in different rice cultivars provides novel insights into desiccation and salinity stress responses. Sci. Rep. 2016, 6, 23719. [Google Scholar] [CrossRef] [PubMed] [Green Version]
  14. Wang, J.; Zhu, J.; Zhang, Y.; Fan, F.; Li, W.; Wang, F.; Zhong, W.; Wang, C.; Yang, J. Comparative transcriptome analysis reveals molecular response to salinity stress of salt-tolerant and sensitive genotypes of indica rice at seedling stage. Sci. Rep. 2018, 8, 2085. [Google Scholar] [CrossRef]
  15. Chandran, A.K.N.; Kim, J.-W.; Yoo, Y.-H.; Park, H.L.; Kim, Y.-J.; Cho, M.-H.; Jung, K.-H. Transcriptome analysis of rice-seedling roots under soil–salt stress using RNA-Seq method. Plant Biotechnol. Rep. 2019, 1–12. [Google Scholar] [CrossRef]
  16. Yuan, J.; Li, J.; Yang, Y.; Tan, C.; Zhu, Y.; Hu, L.; Qi, Y.; Lu, Z.J. Stress-responsive regulation of long non-coding RNA polyadenylation in Oryza sativa. Plant J. 2018, 93, 814–827. [Google Scholar] [CrossRef] [PubMed]
  17. Chen, R.; Cheng, Y.; Han, S.; Van Handel, B.; Dong, L.; Li, X.; Xie, X. Whole genome sequencing and comparative transcriptome analysis of a novel seawater adapted, salt-resistant rice cultivar-sea rice 86. BMC Genomics 2017, 18, 655. [Google Scholar] [CrossRef]
  18. Childs, K.L.; Davidson, R.M.; Buell, C.R. Gene coexpression network analysis as a source of functional annotation for rice genes. PLoS ONE 2011, 6, e22196. [Google Scholar] [CrossRef]
  19. Liang, Y.H.; Cai, B.; Chen, F.; Wang, G.; Wang, M.; Zhong, Y.; Cheng, Z.M.M. Construction and validation of a gene co-expression network in grapevine (Vitis vinifera. L.). Hortic. Res. 2014, 1, 14040. [Google Scholar] [CrossRef] [Green Version]
  20. Tahmasebi, A.; Ashrafi-Dehkordi, E.; Shahriari, A.G.; Mazloomi, S.M.; Ebrahimie, E. Integrative meta-analysis of transcriptomic responses to abiotic stress in cotton. Prog. Biophys. Mol. Biol. 2019, 146, 112–122. [Google Scholar] [CrossRef]
  21. Kobayashi, Y.; Sadhukhan, A.; Tazib, T.; Nakano, Y.; Kusunoki, K.; Kamara, M.; Chaffai, R.; Iuchi, S.; Sahoo, L.; Kobayashi, M.; et al. Joint genetic and network analyses identify loci associated with root growth under NaCl stress in Arabidopsis thaliana. Plant Cell Environ. 2016, 39, 918–934. [Google Scholar] [CrossRef]
  22. Lou, Q.; Chen, L.; Mei, H.; Xu, K.; Wei, H.; Feng, F.; Li, T.; Pang, X.; Shi, C.; Luo, L.; et al. Root Transcriptomic Analysis Revealing the Importance of Energy Metabolism to the Development of Deep Roots in Rice (Oryza sativa L.). Front. Plant Sci. 2017, 8, 1314. [Google Scholar] [CrossRef]
  23. Amrine, K.C.H.; Blanco-Ulate, B.; Cantu, D. Discovery of Core Biotic Stress Responsive Genes in Arabidopsis by Weighted Gene Co-Expression Network Analysis. PLoS ONE 2015, 10, e0118731. [Google Scholar] [CrossRef]
  24. Dobin, A.; Davis, C.A.; Schlesinger, F.; Drenkow, J.; Zaleski, C.; Jha, S.; Batut, P.; Chaisson, M.; Gingeras, T.R. TAR: Ultrafast universal RNA-seq aligner. Bioinformatics 2013, 29, 15–21. [Google Scholar] [CrossRef]
  25. Caldana, C.; Scheible, W.R.; Mueller-Roeber, B.; Ruzicic, S. A quantitative RT-PCR platform for high-throughput expression profiling of 2500 rice transcription factors. Plant Methods 2007, 7. [Google Scholar] [CrossRef]
  26. Anders, S.; McCarthy, D.J.; Chen, Y.; Okoniewski, M.; Smyth, G.K.; Huber, W.; Robinson, M.D. Count-based differential expression analysis of RNA sequencing data using R and Bioconductor. Nat. Protoc. 2013, 8, 1765. [Google Scholar] [CrossRef]
  27. Robinson, M.D.; McCarthy, D.J.; Smyth, G.K. edgeR: A Bioconductor package for differential expression analysis of digital gene expression data. Bioinformatics 2009, 26, 139–140. [Google Scholar] [CrossRef]
  28. Smoot, M.; Ono, K.; Ideker, T.; Maere, S. PiNGO: A cytoscape plugin to find candidate genes in biological networks. Bioinformatics 2011, 27, 1030–1031. [Google Scholar] [CrossRef]
  29. Jeong, H.; Mason, S.P.; Barabasi, A.L.; Oltvai, Z.N. Lethality and centrality in protein networks. Nature 2001, 411, 41–42. [Google Scholar] [CrossRef] [Green Version]
  30. Yokotani, N.; Ichikawa, T.; Kondou, Y.; Matsui, M.; Hirochika, H.; Iwabuchi, M.; Oda, K. Expression of rice heat stress transcription factor OsHsfA2e enhances tolerance to environmental stresses in transgenic Arabidopsis. Planta 2008, 227, 957–967. [Google Scholar] [CrossRef]
  31. Dossa, K.; Diouf, D.; Cissé, N. Genome-Wide Investigation of Hsf Genes in Sesame Reveals Their Segmental Duplication Expansion and Their Active Role in Drought Stress Response. Front. Plant Sci. 2016, 7, 1522. [Google Scholar] [CrossRef] [Green Version]
  32. AbdElgawad, H.; Zinta, G.; Hegab, M.M.; Pandey, R.; Asard, H.; Abuelsoud, W. High Salinity Induces Different Oxidative Stress and Antioxidant Responses in Maize Seedlings Organs. Front. Plant Sci. 2016, 7, 276. [Google Scholar] [CrossRef] [Green Version]
  33. Walia, H.; Wilson, C.; Wahid, A.; Condamine, P.; Cui, X.; Close, T.J. Expression analysis of barley (Hordeum vulgare L.) during salinity stress. Funct. Integr. Genomics 2006, 6, 143–156. [Google Scholar] [CrossRef]
  34. Darko, E.; Gierczik, K.; Hudák, O.; Forgó, P.; Pál, M.; Türkösi, E.; Kovács, V.; Dulai, S.; Majláth, I.; Molnár, I.; et al. Differing metabolic responses to salt stress in wheat-barley addition lines containing different 7H chromosomal fragments. PLoS ONE 2017, 12, e0174170. [Google Scholar] [CrossRef]
  35. Khan, M.S.; Akther, T.; Hemalatha, S. Impact of Panchagavya on Oryza sativa L. Grown Under Saline Stress. J. Plant Growth Regul. 2017, 36, 702–713. [Google Scholar] [CrossRef]
  36. Wang, Z.; Gerstein, M.; Snyder, M. RNA-Seq: A revolutionary tool for transcriptomics. Nat. Rev. Genet. 2009, 10, 57–63. [Google Scholar] [CrossRef]
  37. Zeng, A.; Chen, P.; Korth, K.L.; Ping, J.; Thomas, J.; Wu, C.; Srivastava, S.; Pereira, A.; Hancock, F.; Brye, K.; et al. RNA sequencing analysis of salt tolerance in soybean (Glycine max). Genomics 2018, 111, 629–635. [Google Scholar] [CrossRef]
  38. Zhou, Y.; Yang, P.; Cui, F.; Zhang, F.; Luo, X.; Xie, J. Transcriptome Analysis of Salt Stress Responsiveness in the Seedlings of Dongxiang Wild Rice (Oryza rufipogon Griff.). PLoS ONE 2016, 11, e0146242. [Google Scholar] [CrossRef]
  39. Luo, Y.; Reid, R.; Freese, D.; Li, C.; Watkins, J.; Shi, H.; Zhang, H.; Loraine, A.; Song, B.-H. Salt tolerance response revealed by RNA-Seq in a diploid halophytic wild relative of sweet potato. Sci. Rep. 2017, 7, 9624. [Google Scholar] [CrossRef]
  40. Bahieldin, A.; Atef, A.; Sabir, J.S.M.; Gadalla, N.O.; Edris, S.; Alzohairy, A.M.; Radhwan, N.A.; Baeshen, M.N.; Ramadan, A.M.; Eissa, H.F.; et al. RNA-Seq analysis of the wild barley (H. spontaneum) leaf transcriptome under salt stress. C. R. Biol. 2015, 338, 285–297. [Google Scholar] [CrossRef]
  41. Zhang, J.; Zhao, W.; Fu, R.; Fu, C.; Wang, L.; Liu, H.; Li, S.; Deng, Q.; Wang, S.; Zhu, J.; et al. Comparison of gene co-networks reveals the molecular mechanisms of the rice (Oryza sativa L.) response to Rhizoctonia solani AG1 IA infection. Funct. Integr. Genomics 2018, 8, 545–557. [Google Scholar] [CrossRef]
  42. Choudhury, F.K.; Rivero, R.M.; Blumwald, E.; Mittler, R. Reactive oxygen species, abiotic stress and stress combination. Plant J. 2017, 90, 856–867. [Google Scholar] [CrossRef] [PubMed]
  43. Sewelam, N.; Kazan, K.; Schenk, P.M. Global Plant Stress Signaling: Reactive Oxygen Species at the Cross-Road. Front. Plant Sci. 2016, 7, 187. [Google Scholar] [CrossRef] [PubMed] [Green Version]
  44. Kibria, M.G.; Hossain, M.; Murata, Y.; Hoque, M.A. Antioxidant Defense Mechanisms of Salinity Tolerance in Rice Genotypes. Rice Sci. 2017, 24, 155–162. [Google Scholar] [CrossRef]
  45. Hazman, M.; Hause, B.; Eiche, E.; Nick, P.; Riemann, M. Increased tolerance to salt stress in OPDA-deficient rice ALLENE OXIDE CYCLASE mutants is linked to an increased ROS-scavenging activity. J. Exp. Bot. 2015, 66, 3339–3352. [Google Scholar] [CrossRef] [PubMed]
  46. Moazzzam Jazi, M.; Seyedi, S.M.; Ebrahimie, E.; Ebrahimi, M.; De Moro, G.; Botanga, C. A genome-wide transcriptome map of pistachio (Pistacia vera L.) provides novel insights into salinity-related genes and marker discovery. BMC Genomics 2017, 18, 627. [Google Scholar] [CrossRef]
  47. Nadernejad, N.; Ahmadimoghadam, A.; Hosseinifard, J.; Pourseyedi, S. Phenylalanin Ammonia-Lyase Activity, Total Phenolic and Flavonoid Content in Flowers, Leaves, Hulls and Kernels of Three Pistachio (Pistacia vera L.) Cultivars. Environ. Sci. 2012, 12, 807–814. [Google Scholar]
  48. Gao, S.; Ouyang, C.; Wang, S.; Xu, Y.; Tang, L.; Chen, F. Effects of salt stress on growth, antioxidant enzyme and phenylalanine ammonia-lyase activities in Jatropha curcas L. seedlings. Plant Soil Environ. 2008, 54, 374–381. [Google Scholar] [CrossRef] [Green Version]
  49. Dehghan, S.; Sadeghi, M.; Pöppel, A.; Fischer, R.; Lakes-Harlan, R.; Kavousi, H.R.; Vilcinskas, A.; Rahnamaeian, M. Differential inductions of phenylalanine ammonia-lyase and chalcone synthase during wounding, salicylic acid treatment, and salinity stress in safflower, Carthamus tinctorius. Biosci. Rep. 2014, 34, e00114. [Google Scholar] [CrossRef]
  50. Gholizadeh, A.; Kohnehrouz, B.B. Activation of phenylalanine ammonia lyase as a key component of the antioxidative system of salt-challenged maize leaves. Braz. J. Plant Physiol. 2010, 22, 217–223. [Google Scholar] [CrossRef] [Green Version]
  51. Gill, S.S.; Tuteja, N. Cadmium stress tolerance in crop plants: Probing the role of sulfur. Plant Signal. Behav. 2011, 6, 215–222. [Google Scholar] [CrossRef]
  52. Rabhi, M.; Barhoumi, Z.; Ksouri, R.; Abdelly, C.; Gharsalli, M. Interactive effects of salinity and iron deficiency in Medicago ciliaris. C. R. Biol. 2007, 6, 215–222. [Google Scholar]
  53. Mostafa, H.; Mohammad, G.; Maryam, H. Effect of sulfur and iron fertilizers on yield, yield components and nutrient uptake in sesame (Sesamum indicum L.) under water stress. Afr. J. Biotechnol. 2016, 10, 8816–8822. [Google Scholar] [CrossRef]
  54. Okçu, G.; Kaya, M.D.; Atak, M. Effects of salt and drought stresses on germination and seedling growth of pea (Pisum sativum L.). Turk. J. Agric. For. 2005, 29, 237–242. [Google Scholar]
  55. Thalmann, M.; Santelia, D. Starch as a determinant of plant fitness under abiotic stress. New Phytol. 2017, 214, 943–951. [Google Scholar] [CrossRef] [PubMed] [Green Version]
  56. Onaga, G.; Wydra, K. Advances in Plant Tolerance to Abiotic Stresses. In Plant Genomics; Abdurakhmonov, I.Y., Ed.; IntechOpen: London, UK, 2016; pp. 1–13. [Google Scholar] [CrossRef]
  57. Krasensky, J.; Jonak, C. Drought, salt, and temperature stress-induced metabolic rearrangements and regulatory networks. J. Exp. Bot. 2012, 63, 1593–1608. [Google Scholar] [CrossRef] [PubMed] [Green Version]
  58. Rooks, D.S.; Huang, J.; Bierbaum, B.E.; Bolus, S.A.; Rubano, J.; Connolly, C.E.; Alpert, S.; Iversen, M.D.; Katz, J.N. Effect of preoperative exercise on measures of functional status in men and women undergoing total hip and knee arthroplasty. Arthritis Rheum. 2006, 55, 700–708. [Google Scholar] [CrossRef] [PubMed]
  59. Yuenyong, W.; Chinpongpanich, A.; Comai, L.; Chadchawan, S.; Buaboocha, T. Downstream components of the calmodulin signaling pathway in the rice salt stress response revealed by transcriptome profiling and target identification. BMC Plant Biol. 2018, 18, 335. [Google Scholar] [CrossRef]
  60. Yang, S.-Q.; Li, W.-Q.; Miao, H.; Gan, P.-F.; Qiao, L.; Chang, Y.-L.; Shi, C.-H.; Chen, K.-M. REL2, A Gene Encoding An Unknown Function Protein which Contains DUF630 and DUF632 Domains Controls Leaf Rolling in Rice. Rice 2016, 9, 37. [Google Scholar] [CrossRef]
  61. Schmidt, R.; Schippers, J.H.M.; Welker, A.; Mieulet, D.; Guiderdoni, E.; Mueller-Roeber, B. Transcription factor OsHsfC1b regulates salt tolerance and development in Oryza sativa ssp. japonica. AoB Plants 2012, 2012, pls011. [Google Scholar] [CrossRef]
  62. Nietzsche, M.; Schießl, I.; Börnke, F. The complex becomes more complex: Protein-protein interactions of SnRK1 with DUF581 family proteins provide a framework for cell- and stimulus type-specific SnRK1 signaling in plants. Front. Plant Sci. 2014, 5, 54. [Google Scholar] [CrossRef]
  63. Trivedi, D.K.; Gill, S.S.; Yadav, S.; Tuteja, N. Genome-wide analysis of glutathione reductase (GR) genes from rice and Arabidopsis. Plant Signal. Behav. 2013, 8, e23021. [Google Scholar] [CrossRef] [PubMed] [Green Version]
  64. Bhattacharjee, A.; Khurana, J.P.; Jain, M. Characterization of Rice Homeobox Genes, OsHOX22 and OsHOX24, and Over-expression of OsHOX24 in Transgenic Arabidopsis Suggest Their Role in Abiotic Stress Response. Front. Plant Sci. 2016, 7, 627. [Google Scholar] [CrossRef] [PubMed]
  65. Hu, T.Z. OsLEA3, a late embryogenesis abundant protein gene from rice, confers tolerance to water deficit and salt stress to transgenic rice. Russ. J. Plant Physiol. 2008, 55, 530–537. [Google Scholar] [CrossRef]
  66. Nguyen, N.H.; Nguyen, C.T.T.; Jung, C.; Cheong, J.-J. AtMYB44 suppresses transcription of the late embryogenesis abundant protein gene AtLEA4-5. Biochem. Biophys. Res. Commun. 2019, 511, 931–934. [Google Scholar] [CrossRef] [PubMed]
  67. Zafar, S.A.; Hussain, M.; Raza, M.; Muhu-Din Ahmed, H.G.; Rana, I.A.; Sadia, B.; Atif, R.M. Genome wide analysis of heat shock transcription factor (HSF) family in chickpea and its comparison with Arabidopsis. Plant Omics 2016, 9, 136–141. [Google Scholar] [CrossRef]
  68. Dossa, K.; Mmadi, M.A.; Zhou, R.; Zhang, T.; Su, R.; Zhang, Y.; Wang, L.; You, J.; Zhang, X. Depicting the Core Transcriptome Modulating Multiple Abiotic Stresses Responses in Sesame (Sesamum indicum L.). Int. J. Mol. Sci. 2019, 20, 3930. [Google Scholar] [CrossRef] [PubMed]
  69. Sakamoto, H.; Araki, T.; Meshi, T.; Iwabuchi, M. Expression of a subset of the Arabidopsis Cys(2)/His(2)-type zinc-finger protein gene family under water stress. Gene 2000, 248, 23–32. [Google Scholar] [CrossRef]
  70. Kim, J.C.; Lee, S.H.; Cheong, Y.H.; Yoo, C.M.; Lee, S.I.; Chun, H.J.; Yun, D.J.; Hong, J.C.; Lee, S.Y.; Lim, C.O.; et al. A novel cold-inducible zinc finger protein from soybean, SCOF-1, enhances cold tolerance in transgenic plants. Plant J. 2001, 25, 247–259. [Google Scholar] [CrossRef]
  71. Katiyar, A.; Smita, S.; Lenka, S.K.; Rajwanshi, R.; Chinnusamy, V.; Bansal, K.C. Genome-wide classification and expression analysis of MYB transcription factor families in rice and Arabidopsis. BMC Genomics 2012, 13, 544. [Google Scholar] [CrossRef]
  72. Jakoby, M.; Weisshaar, B.; Dröge-Laser, W.; Vicente-Carbajosa, J.; Tiedemann, J.; Kroj, T.; Parcy, F. bZIP transcription factors in Arabidopsis. Opin. TRENDS Plant Sci. 2002, 7, 106–111. [Google Scholar] [CrossRef]
  73. Zou, M.; Guan, Y.; Ren, H.; Zhang, F.; Chen, F. A bZIP transcription factor, OsABI5, is involved in rice fertility and stress tolerance. Plant Mol. Biol. 2008, 66, 675–683. [Google Scholar] [CrossRef] [PubMed]
  74. Ying, S.; Zhang, D.F.; Fu, J.; Shi, Y.S.; Song, Y.C.; Wang, T.Y.; Li, Y. Cloning and characterization of a maize bZIP transcription factor, ZmbZIP72, confers drought and salt tolerance in transgenic Arabidopsis. Planta 2012, 235, 253–266. [Google Scholar] [CrossRef] [PubMed]
  75. Liu, C.; Mao, B.; Ou, S.; Wang, W.; Liu, L.; Wu, Y.; Chu, C.; Wang, X. OsbZIP71, a bZIP transcription factor, confers salinity and drought tolerance in rice. Plant Mol. Biol. 2014, 84, 19–36. [Google Scholar] [CrossRef] [PubMed]
  76. Tang, Y.; Bao, X.; Zhi, Y.; Wu, Q.; Guo, Y.; Yin, X.; Zeng, L.; Li, J.; Zhang, J.; He, W.; et al. Overexpression of a MYB Family Gene, OsMYB6, Increases Drought and Salinity Stress Tolerance in Transgenic Rice. Front. Plant Sci. 2019, 10, 168. [Google Scholar] [CrossRef] [PubMed] [Green Version]
  77. Nuruzzaman, M.; Sharoni, A.M.; Kikuchi, S. Roles of NAC transcription factors in the regulation of biotic and abiotic stress responses in plants. Front. Microbiol. 2013, 4, 248. [Google Scholar] [CrossRef] [PubMed] [Green Version]
  78. Hong, Y.; Zhang, H.; Huang, L.; Li, D.; Song, F. Overexpression of a Stress-Responsive NAC Transcription Factor Gene ONAC022 Improves Drought and Salt Tolerance in Rice. Front. Plant Sci. 2016, 7, 4. [Google Scholar] [CrossRef] [PubMed]
  79. Hu, H.; Dai, M.; Yao, J.; Xiao, B.; Li, X.; Zhang, Q.; Xiong, L. Overexpressing a NAM, ATAF, and CUC (NAC) transcription factor enhances drought resistance and salt tolerance in rice. Proc. Natl. Acad. Sci. USA 2006, 103, 12987–12992. [Google Scholar] [CrossRef] [PubMed] [Green Version]
Figure 1. Identification of salt responsive core differentially expressed genes (DEGs) in rice. (A) Venn diagram showing specific and common salt responsive DEGs among the RNA-seq datasets used in this study; (B) Expression profiles of the core salt responsive DEGs based on fragments per kilobase of transcript per million fragments mapped (FPKM) values.
Genes 10 00719 g001
Figure 2. (A) Gene ontology and (B) Kyoto Encyclopedia of Genes and Genomes (KEGG) enrichment analyses of core salt responsive DEGs.
Genes 10 00719 g002
Figure 3. Matrix showing Module-Trait Relationships (MTRs) of different modules under control and salt stress. The numbers represent the Pearson correlation coefficients. Positive correlation is colored in red while negative correlation is colored in green.
Genes 10 00719 g003
Figure 4. Expression pattern of the genes and eigengenes of each module. The heatmap was plotted using the log10 FPKM values.
Genes 10 00719 g004
Figure 5. Co-expression network analysis of blue (A), turquoise (B) and grey (C) modules. The size of node circle is positively correlated with the number of the interacting genes.
Genes 10 00719 g005
Figure 6. qRT-PCR analysis of selected genes from the rice core salt stress responsive genes under temporal salt stress compared to the control condition. Data are from three biological replicates and three technical replicates. The differential expression analysis was conducted based on the 2−ΔΔct method.
Genes 10 00719 g006
Table 1. Overview of the RNA-seq datasets used in this study.
SRA StudySRA AccessionTissueTreatmentSequencing PlatformCultivarReferences
SRP076274 SRR3647326LeafUnstressed-110d old seedlingIllumina HiSeq 2500 Nipponbare -
SRP076274 SRR3647327LeafSalt (200 mM)-110d old seedlingIllumina HiSeq 2500 Nipponbare -
SRP076274 SRR3647328LeafUnstressed-110d old seedlingIllumina HiSeq 2500 Nipponbare -
SRP076274 SRR3647329LeafSalt (200 mM)-110d old seedlingIllumina HiSeq 2500 Nipponbare -
SRP076274 SRR3647330LeafUnstressed-110d old seedlingIllumina HiSeq 2500 Nipponbare -
SRP076274 SRR3647331LeafSalt (200 mM)-110d old seedlingIllumina HiSeq 2500 Nipponbare -
SRP076274 SRR3647334LeafUnstressed-110d old seedlingIllumina HiSeq 2500 Nipponbare -
SRP076274 SRR3647335LeafSalt (200 mM)-110d old seedlingIllumina HiSeq 2500 Nipponbare -
SRP083700SRR4098173RootUnstressed-2 weeks old seedlingIllumina HiSeq 2000 japonica rice Yuan et al. [16]
SRP083700SRR4098191RootSalt (300 mM NaCl for 12 h)-2 weeks old seedlingIllumina HiSeq 2000 japonica rice Yuan et al. [16]
SRP114666SRR5889379RootUnstressed-seedlingIllumina HiSeq 2500Sea Rice 86Chen et al. [17]
SRP114666SRR5889380RootUnstressed-seedlingIllumina HiSeq 2500Sea Rice 86Chen et al. [17]
SRP114666SRR5889381RootUnstressed-seedlingIllumina HiSeq 2500Sea Rice 86Chen et al. [17]
SRP114666SRR5889382RootSalt (sea water for 30 d)-seedlingIllumina HiSeq 2500Sea Rice 86Chen et al. [17]
SRP114666SRR5889383RootSalt (sea water for 30 d)-seedlingIllumina HiSeq 2500Sea Rice 86Chen et al. [17]
SRP114666SRR5889384RootSalt (sea water for 30 d)-seedlingIllumina HiSeq 2500Sea Rice 86Chen et al. [17]
Table 2. The hub genes detected in the three WGCNA modules.
ModulesGene_idArabidopsis OrthologsPredicted Functions
BlueLOC_Os03g15270AT5G16080Carboxyesterase 17
LOC_Os05g27340AT5G01750Unknown
LOC_Os01g72009AT5G04080Unknown
LOC_Os07g48710AT2G41010Calmodulin (CAM)-binding protein of 25 kDa
LOC_Os02g13800AT3G24520Heat shock transcription factor C1
LOC_Os02g43770AT3G60320Protein of unknown function (DUF630 and DUF632)
GreyLOC_Os02g51080AT1G74470Pyridine nucleotide-disulphide oxidoreductase family protein
LOC_Os03g20700AT5G13630Magnesium-chelatase subunit chlH, chloroplast, putative/Mg-protoporphyrin IX chelatase,
LOC_Os01g17170AT3G56940Dicarboxylate diiron protein CRD1
LOC_Os09g20240AT1G78020Unknown DUF581
TurquoiseLOC_Os03g42520AT1G07985.1Expressed protein
LOC_Os03g60260AT1G07985.1Aromatic and neutral transporter 1
LOC_Os03g17790AT2G38905.1Low temperature and salt responsive protein family
LOC_Os04g48270AT3G61060.1Phloem protein PP2-A13
LOC_Os08g23870AT5G06760.1Late Embryogenesis Abundant 4-5, LEA4-5

