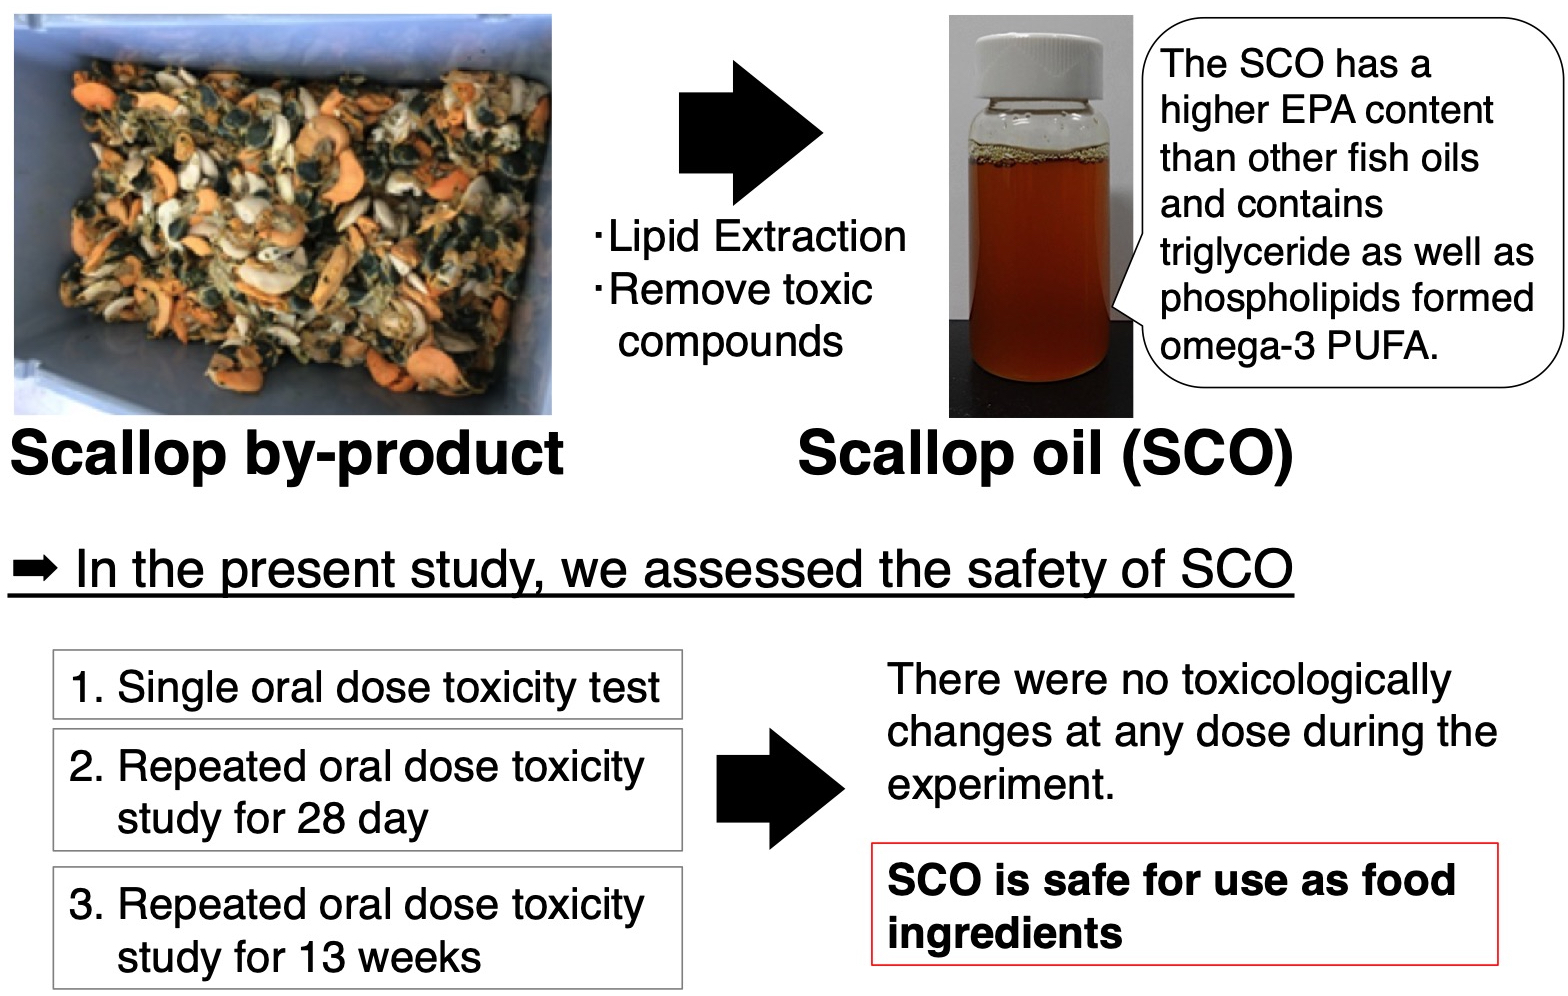
Single and Repeated Dose 28-Day and 13-Week Toxicity Studies of Oil Prepared from the Internal Organs of the Japanese Giant Scallop (Patinopecten yessoensis) in Mice

 ,
,
Abstract
: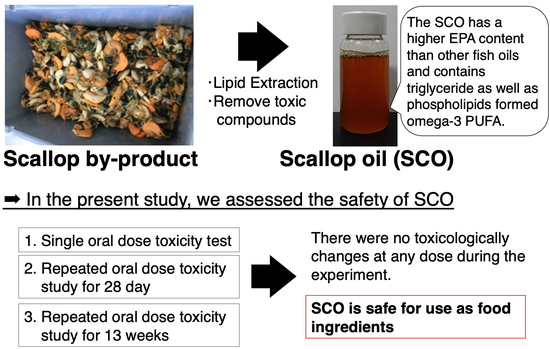
1. Introduction
2. Materials and Methods
2.1. Materials
2.2. Lipid Composition of the Experimental Oils
2.3. Ethics and Animals
2.4. Single Oral Dose Toxicity Study
2.5. Repeated Oral Dose Toxicity Study for 28 Days
2.6. Repeated Oral Dose Toxicity Study for 13 Weeks
2.7. Analysis of Serum Biochemical and Hematological Parameters
2.8. Analysis of Thiobarbituric Acid Reactive Substances and α-Tocopherol
2.9. Statistical Analyses
3. Results and Discussion
3.1. Lipid Composition of the Experimental Oils
3.2. Single Oral Dose Toxicity Study
3.3. Repeated Oral Dose Toxicity Study for 28 Days
3.4. Repeated Oral Dose Toxicity Study for 13 Weeks
4. Conclusions
Supplementary Materials
Author Contributions
Funding
Acknowledgments
Conflicts of Interest
References
- Gabbs, M.; Leng, S.; Devassy, J.G.; Monirujjaman, M.; Aukema, H.M. Advances in Our Understanding of Oxylipins Derived from Dietary PUFAs. Adv. Nutr. 2015, 6, 513–540. [Google Scholar] [CrossRef] [PubMed] [Green Version]
- Simopoulos, A.P. The importance of the omega-6/omega-3 fatty acid ratio in cardiovascular disease and other chronic diseases. Exp. Biol. Med. (Maywood) 2008, 233, 674–688. [Google Scholar] [CrossRef] [PubMed]
- James, M.; Proudman, S.; Cleland, L. Fish oil and rheumatoid arthritis: past, present and future. Proc. Nutr. Soc. 2010, 69, 316–323. [Google Scholar] [CrossRef] [PubMed] [Green Version]
- Burr, M.L.; Fehily, A.M.; Gilbert, J.F.; Rogers, S.; Holliday, R.M.; Sweetnam, P.M.; Elwood, P.C.; Deadman, N.M. Effects of changes in fat, fish, and fibre intakes on death and myocardial reinfarction: diet and reinfarction trial (DART). Lancet 1989, 2, 757–761. [Google Scholar] [CrossRef]
- Kim, K.B.; Nam, Y.A.; Kim, H.S.; Hayes, A.W.; Lee, B.M. Alpha-Linolenic acid: nutraceutical, pharmacological and toxicological evaluation. Food Chem. Toxicol. 2014, 70, 163–178. [Google Scholar] [CrossRef]
- Maki, K.C.; Palacios, O.M.; Bell, M.; Toth, P.P. Use of supplemental long-chain omega-3 fatty acids and risk for cardiac death: An updated meta-analysis and review of research gaps. J. Clin. Lipidol. 2017, 11, 1152–1160.e1152. [Google Scholar] [CrossRef] [PubMed] [Green Version]
- Goyal, A.; Sharma, V.; Upadhyay, N.; Gill, S.; Sihag, M. Flax and flaxseed oil: an ancient medicine & modern functional food. J. Food Sci. Technol. 2014, 51, 1633–1653. [Google Scholar] [CrossRef] [Green Version]
- Carnielli, V.P.; Simonato, M.; Verlato, G.; Luijendijk, I.; De Curtis, M.; Sauer, P.J.; Cogo, P.E. Synthesis of long-chain polyunsaturated fatty acids in preterm newborns fed formula with long-chain polyunsaturated fatty acids. Am. J. Clin. Nutr. 2007, 86, 1323–1330. [Google Scholar] [CrossRef] [Green Version]
- Williams, C.M.; Burdge, G. Long-chain n-3 PUFA: plant v. marine sources. Proc. Nutr. Soc. 2006, 65, 42–50. [Google Scholar] [CrossRef] [Green Version]
- Emken, E.A.; Adlof, R.O.; Duval, S.M.; Nelson, G.J. Effect of dietary docosahexaenoic acid on desaturation and uptake in vivo of isotope-labeled oleic, linoleic, and linolenic acids by male subjects. Lipids 1999, 34, 785–791. [Google Scholar] [CrossRef]
- Kris-Etherton, P.M.; Harris, W.S.; Appel, L.J. Fish consumption, fish oil, omega-3 fatty acids, and cardiovascular disease. Circulation 2002, 106, 2747–2757. [Google Scholar] [CrossRef] [PubMed]
- Summary of Qualified Health Claims Subject to Enforcement Discretion. Available online: https://www.fda.gov/food/consumers/advice-about-eating-fish (accessed on 6 April 2020).
- Dietary Supplement Label Database. Available online: https://www.dsld.nlm.nih.gov/dsld/index.jsp (accessed on 6 April 2020).
- Species Fact Sheets-Euphausia superba. Available online: http://www.fao.org/fishery/species/3393/en (accessed on 6 April 2020).
- Cunningham, E. Are krill oil supplements a better source of n-3 fatty acids than fish oil supplements? J. Acad. Nutr. Diet. 2012, 112, 344. [Google Scholar] [CrossRef] [PubMed]
- Spolaore, P.; Joannis-Cassan, C.; Duran, E.; Isambert, A. Commercial applications of microalgae. J. Biosci. Bioeng. 2006, 101, 87–96. [Google Scholar] [CrossRef] [PubMed] [Green Version]
- Hayashi, K. Seasonal Changes in Eicosapentaenoic Acid Content of Hepatopancreas of Scallop Patinopecten yessoensis. Nippon Suisan Gakk. 1986, 52, 1559–1563. [Google Scholar] [CrossRef]
- Hayashi, K. Eicosapentaenoic Acid-Rich Triglycerides of Scallop Hepatopancreas. Nippon Suisan Gakk. 1988, 54, 1449. [Google Scholar] [CrossRef] [Green Version]
- Cultured Aquatic Species Information Programme-Patinopecten yessoensis. Available online: http://www.fao.org/fishery/culturedspecies/Patinopecten_yessoensis/en (accessed on 6 April 2020).
- Kruzynski, G.M. Cadmium in oysters and scallops: the BC experience. Toxicol. Lett. 2004, 148, 159–169. [Google Scholar] [CrossRef]
- Matsushima, R.; Uchida, H.; Watanabe, R.; Oikawa, H.; Kosaka, Y.; Tanabe, T.; Suzuki, T. Distribution of Diarrhetic Shellfish Toxins in Mussels, Scallops, and Ascidian. Food Saf. 2018. advpub. [Google Scholar] [CrossRef] [Green Version]
- Sugimoto, K.; Hosomi, R.; Fukunaga, K.; Shimono, T.; Kanda, S.; Nishiyama, T.; Yoshida, M.; Yoshioka, T.; Takahashi, K. Genotoxicity evaluation of oil prepared from the internal organs of the Japanese giant scallop (Patinopecten yessoensis). Fundam. Toxicol. Sci. 2019, 6, 137–143. [Google Scholar] [CrossRef]
- Fukunaga, K.; Hosomi, R.; Fukao, M.; Miyauchi, K.; Kanda, S.; Nishiyama, T.; Yoshida, M. Hypolipidemic Effects of Phospholipids (PL) Containing n-3 Polyunsaturated Fatty Acids (PUFA) Are Not Dependent on Esterification of n-3 PUFA to PL. Lipids 2016, 51, 279–289. [Google Scholar] [CrossRef]
- Rouser, G.; Fkeischer, S.; Yamamoto, A. Two dimensional then layer chromatographic separation of polar lipids and determination of phospholipids by phosphorus analysis of spots. Lipids 1970, 5, 494–496. [Google Scholar] [CrossRef]
- Kaneda, T.; Nakajima, A.; Fujimoto, K.; Kobayashi, T.; Kiriyama, S.; Ebihara, K.; Innami, T.; Tsuji, K.; Tsuji, E.; Kinumaki, T.; et al. Quantitative analysis of cholesterol in foods by gas-liquid chromatography. J. Nutr. Sci. Vitaminol. 1980, 26, 497–505. [Google Scholar] [CrossRef] [PubMed] [Green Version]
- Ueda, T.; Ichikawa, H.; Igarashi, O. Determination of α-Tocopherol Stereoisomers in Biological Specimens Using Chiral Phase High-Performance Liquid Chromatography. J. Nutr. Sci. Vitaminol. 1993, 39, 207–219. [Google Scholar] [CrossRef]
- Japan Oil Chemists’ Society. The JOCS Standard Methods for the Analysis of Fats, Oils and Related Materials, 2013 ed.; JOCS: Tokyo, Japan, 2013; pp. 139–141, 170–173. [Google Scholar]
- Reeves, P.G.; Nielsen, F.H.; Fahey, G.C., Jr. AIN-93 purified diets for laboratory rodents: final report of the American Institute of Nutrition ad hoc writing committee on the reformulation of the AIN-76A rodent diet. J. Nutr. 1993, 123, 1939–1951. [Google Scholar] [CrossRef] [PubMed]
- Test No. 423: Acute Oral Toxicity-Acute Toxic Class Method. Available online: https://www.oecd-ilibrary.org/docserver/9789264071001-en.pdf?expires=1586149382&id=id&accname=ocid194292&checksum=7FC6493A344998EFF2125908FA5781B1.
- Test No. 474: Mammalian Erythrocyte Micronucleus Test. Available online: https://read.oecd-ilibrary.org/environment/test-no-474-mammalian-erythrocyte-micronucleus-test_9789264264762-en#page1 (accessed on 6 April 2020).
- Ohkawa, H.; Ohishi, N.; Yagi, K. Assay for lipid peroxides in animal tissues by thiobarbituric acid reaction. Anal. Biochem. 1979, 95, 351–358. [Google Scholar] [CrossRef]
- Guo, X.F.; Sinclair, A.J.; Kaur, G.; Li, D. Differential effects of EPA, DPA and DHA on cardio-metabolic risk factors in high-fat diet fed mice. Prostaglandins Leukot. Essent. Fatty Acids 2018, 136, 47–55. [Google Scholar] [CrossRef] [PubMed]
- Nestel, P.J. Effects of N-3 fatty acids on lipid metabolism. Annu. Rev. Nutr. 1990, 10, 149–167. [Google Scholar] [CrossRef] [PubMed]
- Miyashita, K. Prevention of Fish Oil Oxidation. Journal of oleo science 2019, 68, 1–11. [Google Scholar] [CrossRef] [Green Version]
- Brigelius-Flohe, R.; Traber, M.G. Vitamin E: function and metabolism. FASEB J. 1999, 13, 1145–1155. [Google Scholar] [CrossRef] [PubMed]
- Farwer, S.R.; der Boer, B.C.; Haddeman, E.; Kivits, G.A.; Wiersma, A.; Danse, B.H. The vitamin E nutritional status of rats fed on diets high in fish oil, linseed oil or sunflower seed oil. Br. J. Nutr. 1994, 72, 127–145. [Google Scholar] [CrossRef] [PubMed] [Green Version]
- Blum, R.; Kiy, T.; Tanaka, S.; Wong, A.W.; Roberts, A. Genotoxicity and subchronic toxicity studies of DHA-rich oil in rats. Regul. Toxicol. Pharmacol. 2007, 49, 271–284. [Google Scholar] [CrossRef] [PubMed]
- Robertson, B.; Burri, L.; Berge, K. Genotoxicity test and subchronic toxicity study with Superba krill oil in rats. Toxicol. Rep. 2014, 1, 764–776. [Google Scholar] [CrossRef] [PubMed] [Green Version]
- Schmitt, D.; Tran, N.; Peach, J.; Bauter, M.; Marone, P. Toxicologic evaluation of DHA-rich algal oil: Genotoxicity, acute and subchronic toxicity in rats. Food Chem. Toxicol. 2012, 50, 3567–3576. [Google Scholar] [CrossRef] [PubMed]

| Soybean Oil | SCO | Tuna Oil | |||
|---|---|---|---|---|---|
| SCO-M 1 | SCO-U 2 | ||||
| Fatty acid composition (wt%) | |||||
| C14:0 | 0.1 | 5.1 | 4.5 | 2.7 | |
| C16:0 | 11.6 | 16.3 | 16.6 | 19.2 | |
| C16:1n-7 | 0.1 | 11.5 | 9.8 | 5.8 | |
| C18:0 | 1.6 | 2.6 | 3.8 | 1.2 | |
| C18:1n-9 | 23.2 | 2.8 | 2.9 | 24.3 | |
| C18:1n-7 | 1.8 | 5.9 | 5.4 | 2.2 | |
| C18:2n-6 | 49.2 | 1.8 | 1.2 | 1.3 | |
| C18:3n-3 | 5.5 | 0.8 | 0.9 | 0.4 | |
| C20:4n-6 (ARA) | - | 3.6 | 1.5 | 2.2 | |
| C20:5n-3 (EPA) | - | 29.4 | 29.6 | 5.7 | |
| C22:6n-3 (DHA) | - | 10.5 | 10.8 | 23.9 | |
| Others | 7.0 | 9.7 | 13 | 11.4 | |
| Phospholipid (mg/g) | N.D. | 99 | 175 | 1 | |
| Cholesterol (mg/g) | 0.1 | 5.6 | 7.6 | 1.5 | |
| α-Toc (µg/g) | - | 1.28 | 6.87 | 0.46 | |
| PV (meq/kg) | 6.7 | 6.4 | 3.5 | 2.9 | |
| AV (mg/g) | 0.1 | 6.7 | 21.6 | 1.5 | |
| Control | SCO-M | SCO-U | TO | |||||||||||||||||||
|---|---|---|---|---|---|---|---|---|---|---|---|---|---|---|---|---|---|---|---|---|---|---|
| 1% | 5% | 1% | 5% | 1% | 5% | |||||||||||||||||
| Male | ||||||||||||||||||||||
| Total protein (g/dL) | 5.13 | ± | 0.06 | 5.15 | ± | 0.06 | 5.13 | ± | 0.06 | 5.00 | ± | 0.07 | 5.03 | ± | 0.08 | 4.90 | ± | 0.05 | 5.15 | ± | 0.09 | |
| Albumin (g/dL) | 2.98 | ± | 0.03 a | 2.90 | ± | 0.06 ab | 2.86 | ± | 0.03 ab | 2.81 | ± | 0.05 ab | 2.86 | ± | 0.04 ab | 2.74 | ± | 0.03 b | 2.94 | ± | 0.07 ab | |
| A/G | 1.38 | ± | 0.02 | 1.29 | ± | 0.05 | 1.27 | ± | 0.02 | 1.29 | ± | 0.03 | 1.32 | ± | 0.02 | 1.27 | ± | 0.03 | 1.33 | ± | 0.03 | |
| AST (IU/L) | 51.6 | ± | 5.1 | 77.9 | ± | 14.0 | 47.0 | ± | 2.5 | 68.1 | ± | 11.6 | 65.6 | ± | 10.1 | 50.0 | ± | 4.9 | 53.4 | ± | 4.6 | |
| ALT (IU/L) | 40.6 | ± | 7.4 | 66.1 | ± | 18.5 | 44.0 | ± | 5.6 | 69.8 | ± | 19.1 | 89.0 | ± | 21.7 | 35.5 | ± | 5.3 | 61.1 | ± | 15.4 | |
| SUN (mg/dL) | 22.9 | ± | 1.0 | 20.3 | ± | 1.4 | 23.0 | ± | 0.9 | 23.1 | ± | 1.9 | 22.9 | ± | 1.8 | 23.0 | ± | 1.8 | 21.0 | ± | 0.4 | |
| Total lipid (mg/dL) | 500 | ± | 26 a | 437 | ± | 43 ab | 322 | ± | 13 b | 472 | ± | 44 a | 320 | ± | 36 b | 459 | ± | 21 ab | 349 | ± | 28 b | |
| PL (mg/dL) | 251 | ± | 8 a | 227 | ± | 19 a | 159 | ± | 4 b | 204 | ± | 13 a | 155 | ± | 11 b | 219 | ± | 11 a | 154 | ± | 7 b | |
| TG (mg/dL) | 129 | ± | 15 | 103 | ± | 15 | 78 | ± | 8 | 149 | ± | 26 | 80 | ± | 17 | 124 | ± | 12 | 101 | ± | 18 | |
| Total cholesterol (mg/dL) | 135 | ± | 5 a | 123 | ± | 10 ab | 90 | ± | 3 b | 111 | ± | 11 ab | 88 | ± | 8 b | 120 | ± | 8 ab | 88 | ± | 5 b | |
| HDL-C (mg/dL) | 106 | ± | 3 a | 98 | ± | 8 a | 75 | ± | 2 b | 87 | ± | 7 ab | 74 | ± | 6 b | 95 | ± | 6 ab | 70 | ± | 4 b | |
| Non-HDL-C (mg/dL) | 28.8 | ± | 2.6 a | 24.9 | ± | 2.8 ab | 14.3 | ± | 1.0 b | 23.5 | ± | 3.6 ab | 13.6 | ± | 2.1 b | 25.6 | ± | 2.5 a | 17.4 | ± | 1.7 b | |
| Female | ||||||||||||||||||||||
| Total protein (g/dL) | 4.96 | ± | 0.05 | 4.85 | ± | 0.08 | 4.91 | ± | 0.07 | 4.98 | ± | 0.08 | 4.79 | ± | 0.04 | 4.84 | ± | 0.06 | 5.03 | ± | 0.05 | |
| Albumin (g/dL) | 3.11 | ± | 0.04 | 3.06 | ± | 0.05 | 3.04 | ± | 0.05 | 3.10 | ± | 0.05 | 3.00 | ± | 0.02 | 3.04 | ± | 0.05 | 3.16 | ± | 0.05 | |
| A/G | 1.68 | ± | 0.03 | 1.71 | ± | 0.03 | 1.62 | ± | 0.03 | 1.65 | ± | 0.02 | 1.68 | ± | 0.02 | 1.69 | ± | 0.03 | 1.70 | ± | 0.04 | |
| AST (IU/L) | 45.7 | ± | 2.0 | 48.8 | ± | 4.8 | 48.9 | ± | 3.1 | 50.9 | ± | 3.6 | 49.1 | ± | 3.7 | 50.0 | ± | 4.7 | 51.3 | ± | 3.5 | |
| ALT (IU/L) | 29.9 | ± | 10.6 | 19.5 | ± | 3.0 | 27.0 | ± | 3.0 | 24.6 | ± | 4.2 | 22.3 | ± | 3.1 | 18.7 | ± | 1.2 | 26.3 | ± | 4.3 | |
| SUN (mg/dL) | 20.4 | ± | 1.0 | 22.3 | ± | 1.1 | 21.5 | ± | 1.1 | 20.9 | ± | 0.5 | 22.0 | ± | 1.4 | 19.3 | ± | 1.1 | 21.0 | ± | 1.0 | |
| Total lipid (mg/dL) | 392 | ± | 33 a | 348 | ± | 16 ab | 258 | ± | 7 b | 378 | ± | 26 a | 246 | ± | 17 b | 331 | ± | 19 ab | 271 | ± | 20 b | |
| PL (mg/dL) | 183 | ± | 8 a | 170 | ± | 7 a | 122 | ± | 3 b | 175 | ± | 7 a | 119 | ± | 6 b | 168 | ± | 7 ab | 129 | ± | 8 b | |
| TG (mg/dL) | 121 | ± | 16 a | 102 | ± | 9 ab | 70 | ± | 4 b | 118 | ± | 15 a | 68 | ± | 6 b | 85 | ± | 10 ab | 73 | ± | 6 b | |
| Total cholesterol (mg/dL) | 94 | ± | 6 a | 87 | ± | 7 ab | 68 | ± | 3 b | 90 | ± | 4 ab | 63 | ± | 5 b | 89 | ± | 4 ab | 71 | ± | 6 ab | |
| HDL-C (mg/dL) | 69 | ± | 4 a | 65 | ± | 4 ab | 53 | ± | 2 b | 68 | ± | 2 a | 52 | ± | 3 b | 69 | ± | 3 a | 54 | ± | 4 b | |
| Non-HDL-C (mg/dL) | 25.1 | ± | 2.2 a | 21.6 | ± | 2.4 ab | 14.6 | ± | 0.9 bc | 21.5 | ± | 1.5 ab | 11.7 | ± | 1.7 c | 20.0 | ± | 1.3 ab | 17.0 | ± | 2.1 bc | |
| Control | SCO-M 5% | SCO-U 5% | TO 5% | ||||||||||
| g/100 g BW | |||||||||||||
| Male | |||||||||||||
| Liver | 3.82 | ± | 0.15 | 4.43 | ± | 0.09 | 4.27 | ± | 0.24 | 4.17 | ± | 0.15 | |
| Kidney | 1.20 | ± | 0.05 | 1.11 | ± | 0.07 | 1.11 | ± | 0.04 | 1.19 | ± | 0.04 | |
| Heart | 0.55 | ± | 0.03 | 0.49 | ± | 0.03 | 0.47 | ± | 0.02 | 0.51 | ± | 0.03 | |
| Spleen | 0.41 | ± | 0.02 | 0.42 | ± | 0.03 | 0.46 | ± | 0.04 | 0.47 | ± | 0.03 | |
| Lung | 0.49 | ± | 0.03 | 0.51 | ± | 0.04 | 0.50 | ± | 0.02 | 0.55 | ± | 0.04 | |
| Testis | 0.57 | ± | 0.03 | 0.43 | ± | 0.03 | 0.54 | ± | 0.04 | 0.59 | ± | 0.03 | |
| Brain | 0.99 | ± | 0.05 | 0.89 | ± | 0.03 | 0.91 | ± | 0.03 | 1.01 | ± | 0.05 | |
| Stomach | 1.40 | ± | 0.19 | 1.23 | ± | 0.21 | 1.42 | ± | 0.16 | 1.72 | ± | 0.26 | |
| Small intestine | 3.15 | ± | 0.15 | 3.08 | ± | 0.14 | 3.26 | ± | 0.12 | 3.14 | ± | 0.12 | |
| Large intestine | 0.49 | ± | 0.04 | 0.52 | ± | 0.04 | 0.63 | ± | 0.10 | 0.46 | ± | 0.21 | |
| Mesentery WAT | 4.14 | ± | 0.48 | 4.00 | ± | 0.30 | 3.91 | ± | 0.20 | 3.01 | ± | 0.33 | |
| Perirenal WAT | 1.24 | ± | 0.16 | 1.48 | ± | 0.17 | 1.34 | ± | 0.10 | 1.03 | ± | 0.20 | |
| Epididymal WAT | 1.92 | ± | 0.16 | 2.41 | ± | 0.15 | 2.23 | ± | 0.19 | 1.89 | ± | 0.15 | |
| Female | |||||||||||||
| Liver | 4.03 | ± | 0.12 | 4.05 | ± | 0.18 | 3.69 | ± | 0.21 | 4.16 | ± | 0.16 | |
| Kidney | 1.24 | ± | 0.07 | 0.97 | ± | 0.09 | 1.05 | ± | 0.06 | 1.18 | ± | 0.05 | |
| Heart | 0.60 | ± | 0.04 | 0.51 | ± | 0.03 | 0.54 | ± | 0.04 | 0.55 | ± | 0.03 | |
| Spleen | 0.58 | ± | 0.03 | 0.60 | ± | 0.05 | 0.54 | ± | 0.05 | 0.64 | ± | 0.06 | |
| Lung | 0.81 | ± | 0.04 | 0.78 | ± | 0.07 | 0.69 | ± | 0.06 | 0.75 | ± | 0.04 | |
| Ovary | 0.27 | ± | 0.01 | 0.22 | ± | 0.02 | 0.25 | ± | 0.02 | 0.25 | ± | 0.02 | |
| Uterus | 0.43 | ± | 0.04 | 0.36 | ± | 0.07 | 0.31 | ± | 0.04 | 0.39 | ± | 0.05 | |
| Brain | 1.59 | ± | 0.06 | 1.28 | ± | 0.07 | 1.26 | ± | 0.11 | 1.39 | ± | 0.06 | |
| Stomach | 2.00 | ± | 0.11 | 1.82 | ± | 0.16 | 2.13 | ± | 0.35 | 2.17 | ± | 0.27 | |
| Small intestine | 4.41 | ± | 0.22 | 3.56 | ± | 0.23 | 3.70 | ± | 0.28 | 4.01 | ± | 0.20 | |
| Large intestine | 0.91 | ± | 0.09 | 0.87 | ± | 0.05 | 0.75 | ± | 0.06 | 0.81 | ± | 0.03 | |
| Mesentery WAT | 0.68 | ± | 0.08 b | 1.35 | ± | 0.22 ab | 1.69 | ± | 0.39 a | 1.03 | ± | 0.18 ab | |
| Perirenal WAT | 1.62 | ± | 0.07 | 2.58 | ± | 0.33 | 2.78 | ± | 0.49 | 2.29 | ± | 0.24 | |
| Control | SCO-M 5% | SCO-U 5% | TO 5% | ||||||||||
|---|---|---|---|---|---|---|---|---|---|---|---|---|---|
| Male | |||||||||||||
| Total protein (g/dL) | 2.7 | ± | 0.0 | 2.6 | ± | 0.1 | 2.6 | ± | 0.1 | 2.6 | ± | 0.0 | |
| Albumin (g/dL) | 1.4 | ± | 0.0 | 1.3 | ± | 0.0 | 1.3 | ± | 0.1 | 1.3 | ± | 0.0 | |
| A/G | 1.0 | ± | 0.0 | 1.0 | ± | 0.0 | 1.0 | ± | 0.1 | 1.0 | ± | 0.0 | |
| AST (IU/L) | 11.9 | ± | 0.7 | 12.3 | ± | 1.1 | 11.6 | ± | 0.9 | 10.1 | ± | 0.5 | |
| ALT (IU/L) | 51.4 | ± | 12.5 | 35.1 | ± | 2.6 | 28.8 | ± | 2.1 | 87.9 | ± | 35.8 | |
| SUN (mg/dL) | 26.3 | ± | 4.9 | 30.7 | ± | 4.7 | 22.0 | ± | 3.5 | 50.4 | ± | 25.0 | |
| Total lipid (mg/dL) | 176 | ± | 18 a | 106 | ± | 6 b | 110 | ± | 14 b | 118 | ± | 14 b | |
| PL (mg/dL) | 109 | ± | 9 a | 61 | ± | 3 b | 65 | ± | 8 b | 68 | ± | 7 b | |
| TG (mg/dL) | 26 | ± | 5 | 19 | ± | 1 | 17 | ± | 3 | 21 | ± | 4 | |
| Total cholesterol (mg/dL) | 59 | ± | 6 a | 34 | ± | 2 b | 36 | ± | 5 b | 38 | ± | 5 b | |
| HDL-C (mg/dL) | 50 | ± | 5 a | 31 | ± | 2 b | 33 | ± | 4 b | 33 | ± | 4 b | |
| Non-HDL-C (mg/dL) | 9 | ± | 2 a | 3 | ± | 0 b | 4 | ± | 1 b | 5 | ± | 1 b | |
| RBC (104 cell/µL) | 817 | ± | 7 | 836 | ± | 15 | 822 | ± | 16 | 751 | ± | 32 | |
| WBC (cell/µL) | 3157 | ± | 868 | 4120 | ± | 421 | 3133 | ± | 414 | 3267 | ± | 230 | |
| PLT (104 cell/µL) | 13.7 | ± | 3.0 | 20.3 | ± | 3.7 | 19.5 | ± | 0.7 | 19.4 | ± | 3.2 | |
| Hb (g/dL) | 13.5 | ± | 0.1 ab | 14.3 | ± | 0.4 ab | 14.2 | ± | 0.1 a | 12.6 | ± | 0.4 b | |
| Ht (%) | 42.6 | ± | 0.5 | 45.0 | ± | 1.0 | 44.0 | ± | 1.1 | 41.4 | ± | 0.9 | |
| MCV (fL) | 52.1 | ± | 0.3 | 53.8 | ± | 0.8 | 53.7 | ± | 1.0 | 55.7 | ± | 1.3 | |
| MCH (pg) | 16.5 | ± | 0.2 | 17.0 | ± | 0.2 | 17.2 | ± | 0.3 | 16.8 | ± | 0.2 | |
| MCHC (g/dL) | 31.7 | ± | 0.2 | 31.7 | ± | 0.4 | 32.3 | ± | 0.7 | 30.3 | ± | 0.3 | |
| Female | |||||||||||||
| Total protein (g/dL) | 2.5 | ± | 0.0 | 2.5 | ± | 0.0 | 2.6 | ± | 0.0 | 2.5 | ± | 0.0 | |
| Albumin (g/dL) | 1.4 | ± | 0.0 | 1.4 | ± | 0.0 | 1.4 | ± | 0.0 | 1.4 | ± | 0.0 | |
| A/G | 1.3 | ± | 0.0 | 1.2 | ± | 0.0 | 1.2 | ± | 0.0 | 1.2 | ± | 0.0 | |
| AST (IU/L) | 11.6 | ± | 0.8 | 13.5 | ± | 0.5 | 11.9 | ± | 0.7 | 11.4 | ± | 0.7 | |
| ALT (IU/L) | 31.3 | ± | 2.6 | 30.4 | ± | 3.6 | 32.6 | ± | 3.5 | 34.8 | ± | 3.8 | |
| SUN (mg/dL) | 10.5 | ± | 1.4 | 13.5 | ± | 2.1 | 17.8 | ± | 5.9 | 14.4 | ± | 2.0 | |
| Total lipid (mg/dL) | 128 | ± | 9 a | 89 | ± | 7 b | 101 | ± | 13 ab | 93 | ± | 9 ab | |
| PL (mg/dL) | 76 | ± | 4 a | 53 | ± | 3 b | 57 | ± | 6 b | 52 | ± | 4 b | |
| TG (mg/dL) | 30 | ± | 3 | 20 | ± | 3 | 22 | ± | 3 | 23 | ± | 3 | |
| Total cholesterol (mg/dL) | 37 | ± | 2 | 26 | ± | 2 | 30 | ± | 4 | 26 | ± | 3 | |
| HDL-C (mg/dL) | 28 | ± | 2 | 23 | ± | 2 | 24 | ± | 3 | 21 | ± | 2 | |
| Non-HDL-C (mg/dL) | 8 | ± | 1 a | 3 | ± | 0 b | 5 | ± | 1 b | 4 | ± | 1 b | |
| RBC (104 cell/µL) | 878 | ± | 16 | 847 | ± | 13 | 847 | ± | 18 | 871 | ± | 25 | |
| WBC (cell/µL) | 3125 | ± | 373 | 4138 | ± | 650 | 3850 | ± | 320 | 3586 | ± | 744 | |
| PLT (104 cell/µL) | 18.8 | ± | 5.2 | 22.3 | ± | 6.8 | 17.7 | ± | 3.4 | 19.7 | ± | 5.0 | |
| Hb (g/dL) | 14.3 | ± | 0.1 | 14.0 | ± | 0.2 | 14.1 | ± | 0.2 | 14.2 | ± | 0.3 | |
| Ht (%) | 44.4 | ± | 0.3 | 43.7 | ± | 0.5 | 44.8 | ± | 0.7 | 44.2 | ± | 1.0 | |
| MCV (fL) | 50.8 | ± | 0.7 | 51.8 | ± | 0.5 | 53.1 | ± | 0.7 | 50.9 | ± | 0.5 | |
| MCH (pg) | 16.3 | ± | 0.2 | 16.5 | ± | 0.2 | 16.7 | ± | 0.2 | 16.4 | ± | 0.2 | |
| MCHC (g/dL) | 32.1 | ± | 0.1 | 32.0 | ± | 0.4 | 31.5 | ± | 0.2 | 32.2 | ± | 0.2 | |
| Control | SCO-M 5% | SCO-U 5% | TO 5% | ||||||||||
|---|---|---|---|---|---|---|---|---|---|---|---|---|---|
| Male | |||||||||||||
| TBARS (μmol/g) | 98 | ± | 5 | 115 | ± | 18 | 111 | ± | 7 | 119 | ± | 6 | |
| α-Toc (μg/g) | 104.6 | ± | 17.0 | 53.9 | ± | 6.2 | 79.9 | ± | 23.0 | 57.6 | ± | 10.2 | |
| Female | |||||||||||||
| TBARS (μmol/g) | 88 | ± | 8 | 87 | ± | 13 | 94 | ± | 6 | 95 | ± | 8 | |
| α-Toc (μg/g) | 63.5 | ± | 7.7 a | 37.1 | ± | 2.9 b | 37.0 | ± | 3.0 b | 37.1 | ± | 7.7 b | |
© 2020 by the authors. Licensee MDPI, Basel, Switzerland. This article is an open access article distributed under the terms and conditions of the Creative Commons Attribution (CC BY) license (http://creativecommons.org/licenses/by/4.0/).
Share and Cite
Sugimoto, K.; Tanizaki, T.; Shimizu, E.; Hosomi, R.; Fukunaga, K.; Yoshida, M.; Yoshioka, T.; Takahashi, K. Single and Repeated Dose 28-Day and 13-Week Toxicity Studies of Oil Prepared from the Internal Organs of the Japanese Giant Scallop (Patinopecten yessoensis) in Mice. Foods 2020, 9, 691. https://doi.org/10.3390/foods9060691
Sugimoto K, Tanizaki T, Shimizu E, Hosomi R, Fukunaga K, Yoshida M, Yoshioka T, Takahashi K. Single and Repeated Dose 28-Day and 13-Week Toxicity Studies of Oil Prepared from the Internal Organs of the Japanese Giant Scallop (Patinopecten yessoensis) in Mice. Foods. 2020; 9(6):691. https://doi.org/10.3390/foods9060691
Chicago/Turabian StyleSugimoto, Koki, Toshifumi Tanizaki, Eito Shimizu, Ryota Hosomi, Kenji Fukunaga, Munehiro Yoshida, Takeya Yoshioka, and Koretaro Takahashi. 2020. "Single and Repeated Dose 28-Day and 13-Week Toxicity Studies of Oil Prepared from the Internal Organs of the Japanese Giant Scallop (Patinopecten yessoensis) in Mice" Foods 9, no. 6: 691. https://doi.org/10.3390/foods9060691