Nondestructive Classification Analysis of Green Coffee Beans by Using Near-Infrared Spectroscopy


1
Graduate School of Bioresource Sciences, Nihon University, 1866 Kameino, Fujisawa, Kanagawa 252-0880, Japan
2
College of Bioresource Sciences, Nihon University, 1866 Kameino, Fujisawa, Kanagawa 252-0880, Japan
*
Author to whom correspondence should be addressed.
Foods 2019, 8(2), 82; https://doi.org/10.3390/foods8020082
Submission received: 11 January 2019
/
Revised: 12 February 2019
/
Accepted: 18 February 2019
/
Published: 22 February 2019
(This article belongs to the Special Issue Foods Quality Assessed by Chemometrics)
Abstract
:Near-infrared spectroscopy (NIRS) is a powerful tool for the nondestructive evaluation of organic materials, and it has found widespread use in a variety of industries. In the food industry, it is important to know the district in which a particular food was produced. Therefore, in this study, we focused on determining the production area (five areas and three districts) of green coffee beans using classification analysis and NIRS. Soft independent modeling of class analogy (SIMCA) was applied as the classification method. Samples of green coffee beans produced in seven locations—Cuba, Ethiopia, Indonesia (Bari, Java, and Sumatra), Tanzania, and Yemen—were analyzed. These regions were selected since green coffee beans from these locations are commonly sold in Japan supermarkets. A good classification result was obtained with SIMCA for the seven green bean samples, although some samples were partly classified into several categories. Then, the model distance values of SIMCA were calculated and compared. A few model distance values were ~10; such small values may be the reason for misclassification. However, over a 73% correct classification rate could be achieved for the different kinds of green coffee beans using NIRS.
1. Introduction
Near-infrared spectroscopy (NIRS) is an increasingly popular technique used for nondestructive evaluation. NIRS has found widespread use in a variety of industries, including the food, agricultural, pharmaceutical, and wood industries [1,2,3]. As a measurement technique, the advantages of NIRS include the rapid, easy, and nondestructive measurement process without the need for multiple chemical reagents. For recent NIRS research, the measurement methods and ways were developed like online measurement [4], portable measurement [5], and imaging analysis [6]. Its application range in food analysis continues to expand at an increasing rate. It probably becomes important as a process of quality control for food.
Coffee is one of the most popular beverages and an important farm product. Techniques to qualify and grade coffee beans have been developed and implemented. In particular, NIRS has been applied to assess several characteristics of coffee. Barbin et al. [7] extensively reviewed NIRS and its application to the evaluation of coffee bean properties. The discussion included the assignment of the near-infrared (NIR) spectra of coffee compositions, the assessment of coffee bean conditions, and NIR application techniques and analysis methods, such as multivariable analysis.
In this report, we focus on coffee conditions such as the coffee bean roast. Downey and Boussion [8] researched the authentication of the dried extract and lyophilized variety of roasted coffee beans using NIRS; beverages produced from pure arabica, pure robusta, and arabica robusta blends were discriminated with a high degree of success. Esteban-Díez et al. [9] measured the sensory properties of espresso from roasted coffee samples by NIRS. However, many of these studies examined roasted coffee, and few have evaluated green bean coffee samples.
Santos et al. [10] evaluated the quality of green coffee beans using NIRS by measuring the mass fractions of defective and nondefective beans. We also focused on green coffee beans, but we classified them according to their production areas by using NIRS. The ability to ascertain the production area prevents food fraud or contamination by coffee produced elsewhere. In particular, it is important in the Japanese food industry to know the production district of a particular food.
In this report, coffee beans from five areas and three districts were classified using NIRS. The NIR measurement mode was reflectance, and the wavelength range was 1200 to 2500 nm. Soft independent modeling of class analogy (SIMCA) was used for the classification analysis.
2. Material and Methods
2.1. NIR Measurement and Coffee Sample Preparation
The measurement device was NIR spectrometer S-7100 (Soma Optics Ltd., Tokyo, Japan). Reflectance mode was used for the light detection measurements. The NIR spectra were obtained at 1 nm resolutions over a wavelength range of 1200 to 2500 nm. To ensure signal stability, five scan data were averaged for each sample, using the same position for each measurement. NIR spectra were obtained from the center cutting face of the flat part of the green coffee bean, i.e., not the curved part.
Commercial green coffee beans were prepared from five areas and three districts that sell coffee to Japan: Cuba, Ethiopia, Indonesia (Bari, Java, and Sumatra), Tanzania, and Yemen. The samples were bought in supermarkets at Kanagawa prefecture in Japan. Faulty beans were considered to be contaminants, including beans damaged by insects or fungus and those with irregular shapes (e.g., peaberry), and were eliminated from the green coffee bean samples. Basic information on the samples used for the coffee analysis is summarized in Table 1. Although the samples originated from seven production areas, the breed variety was the Arabica species for all but one of the samples.
2.2. Data Analysis
The theory underlying SIMCA was discussed in a previous paper [11]. SIMCA is a classification analysis method that is often used with NIR spectroscopy [12,13,14,15]. SIMCA is a classification method based on principal component analysis (PCA). Spectra (in this research, test set data) of new samples to be classified are projected into the space of each model made by the training set. The distance to each individual model, expressed as the residual spectra variance, and the leverage of the new sample’s spectrum, compared to the mean leverage of each class, are used as the criteria to determine whether the new sample belongs to one class, to several classes, or to no class [16]. PCA involved several calculations utilizing orthogonalization procedures, such as singular-value decomposition, eigenvector calculation with the use of a covariant matrix, nonlinear iterative partial least squares, and successive average orthogonalization [17]. PCA models have a certain number of significant principal components (PCs). In this analysis, PCA was performed using a full cross-validation, and the outliers were eliminated. Outliers had lower absorbance than other samples because of less reflected light. The coffee bean shape of the center cutting face might be affected. The size of the training sets and the number of PCs for PCA of the measurements are summarized in Table 2. The final number of PCs was recommended by the Unscrambler software (Version 9.6; CAMO, Oslo, Norway).
Pretreatment NIR spectra data for the whole spectral range were used in PCA and SIMCA. The pretreatment were moving average, multiplicative scatter correction (MSC), and the second derivative. Moving average eliminates the random noise of NIR spectra. The MSC was used to compensate for both multiplicative and additive effects in the spectra. The second derivative also reduced the multiplicative and additive effects in the spectral data and increased peak amplification in the spectra. Pretreated NIR spectra (moving average smoothing with segment size 13, MSC, and the second derivative with the Norris Gap Derivative algorithm using a gap size of 13) were used for this analysis. Unscrambler software was used for spectral pretreatment and quantitative analysis with PCA and SIMCA. The classification results of SIMCA are shown at a significance level of 0.05 (α = 0.05).
3. Results and Discussion
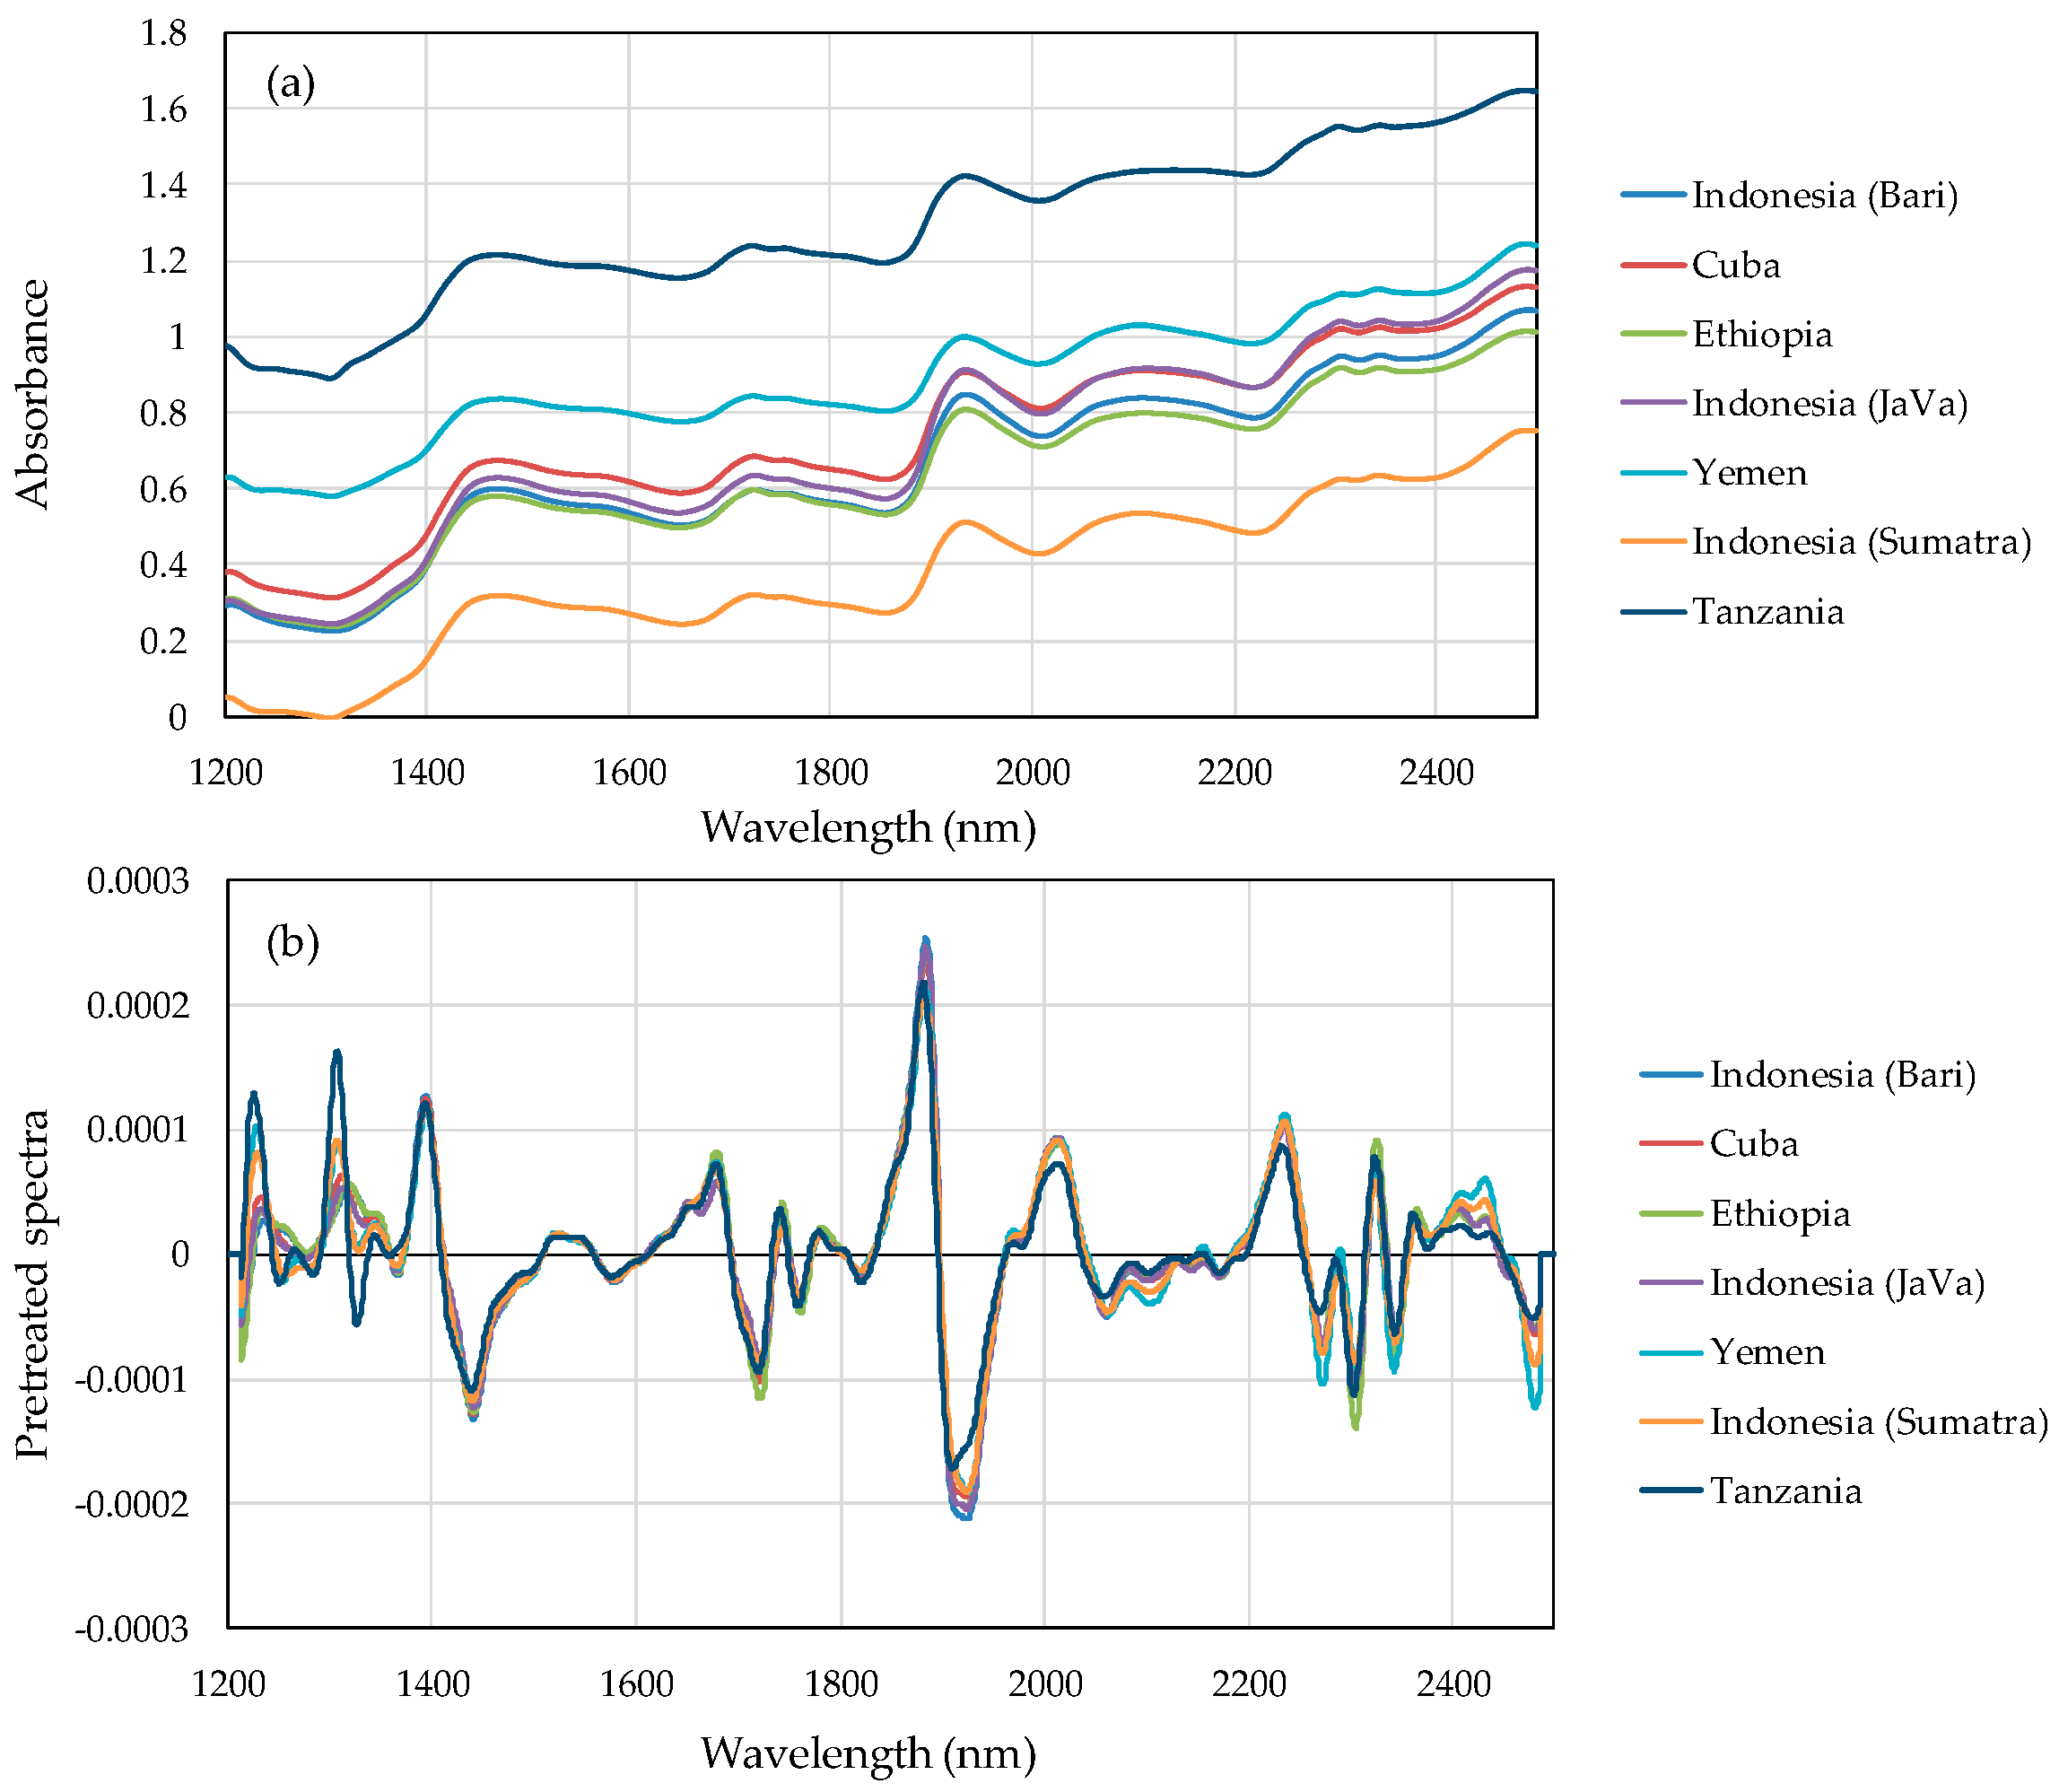
Figure 1a plots NIR absorbance spectra and Figure 1b plots pretreatment spectra by calculating the averaged value per each wavelength in training set sample. The absorption was varied for the difference of each sample. In Figure 1b, the variation of several peaks are observed in the pretreated spectra in the 1200–1350 nm, 1850–1950 nm, and 2300–2500 nm regions.
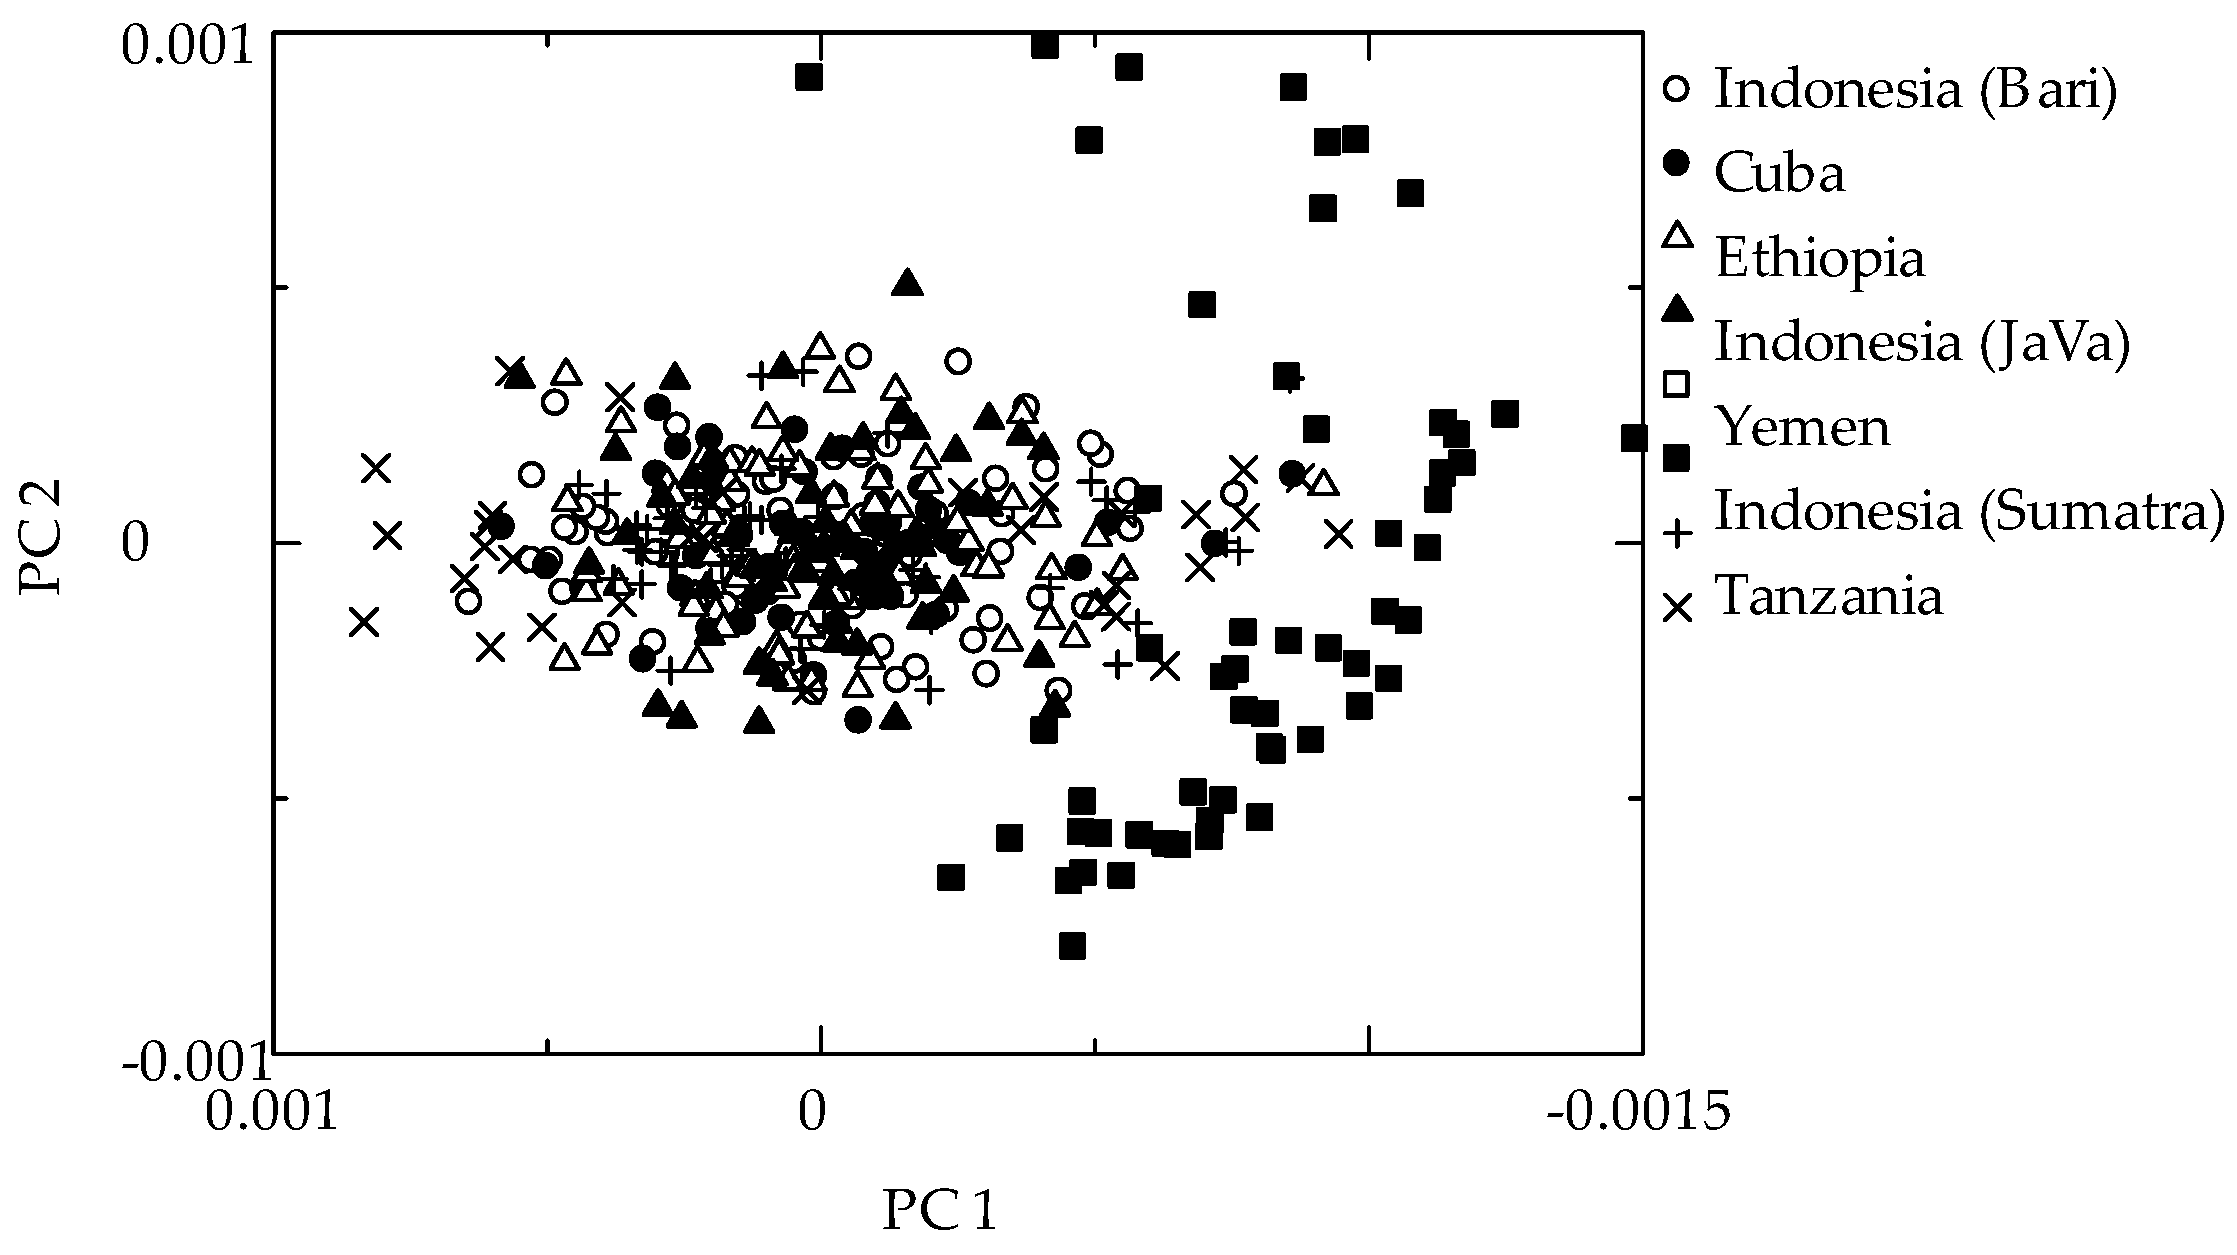
Figure 2 shows the PC1 vs. PC2 score plot of the pretreated NIR spectra. Yemen samples had the different clustering, and clearly separated from the others.
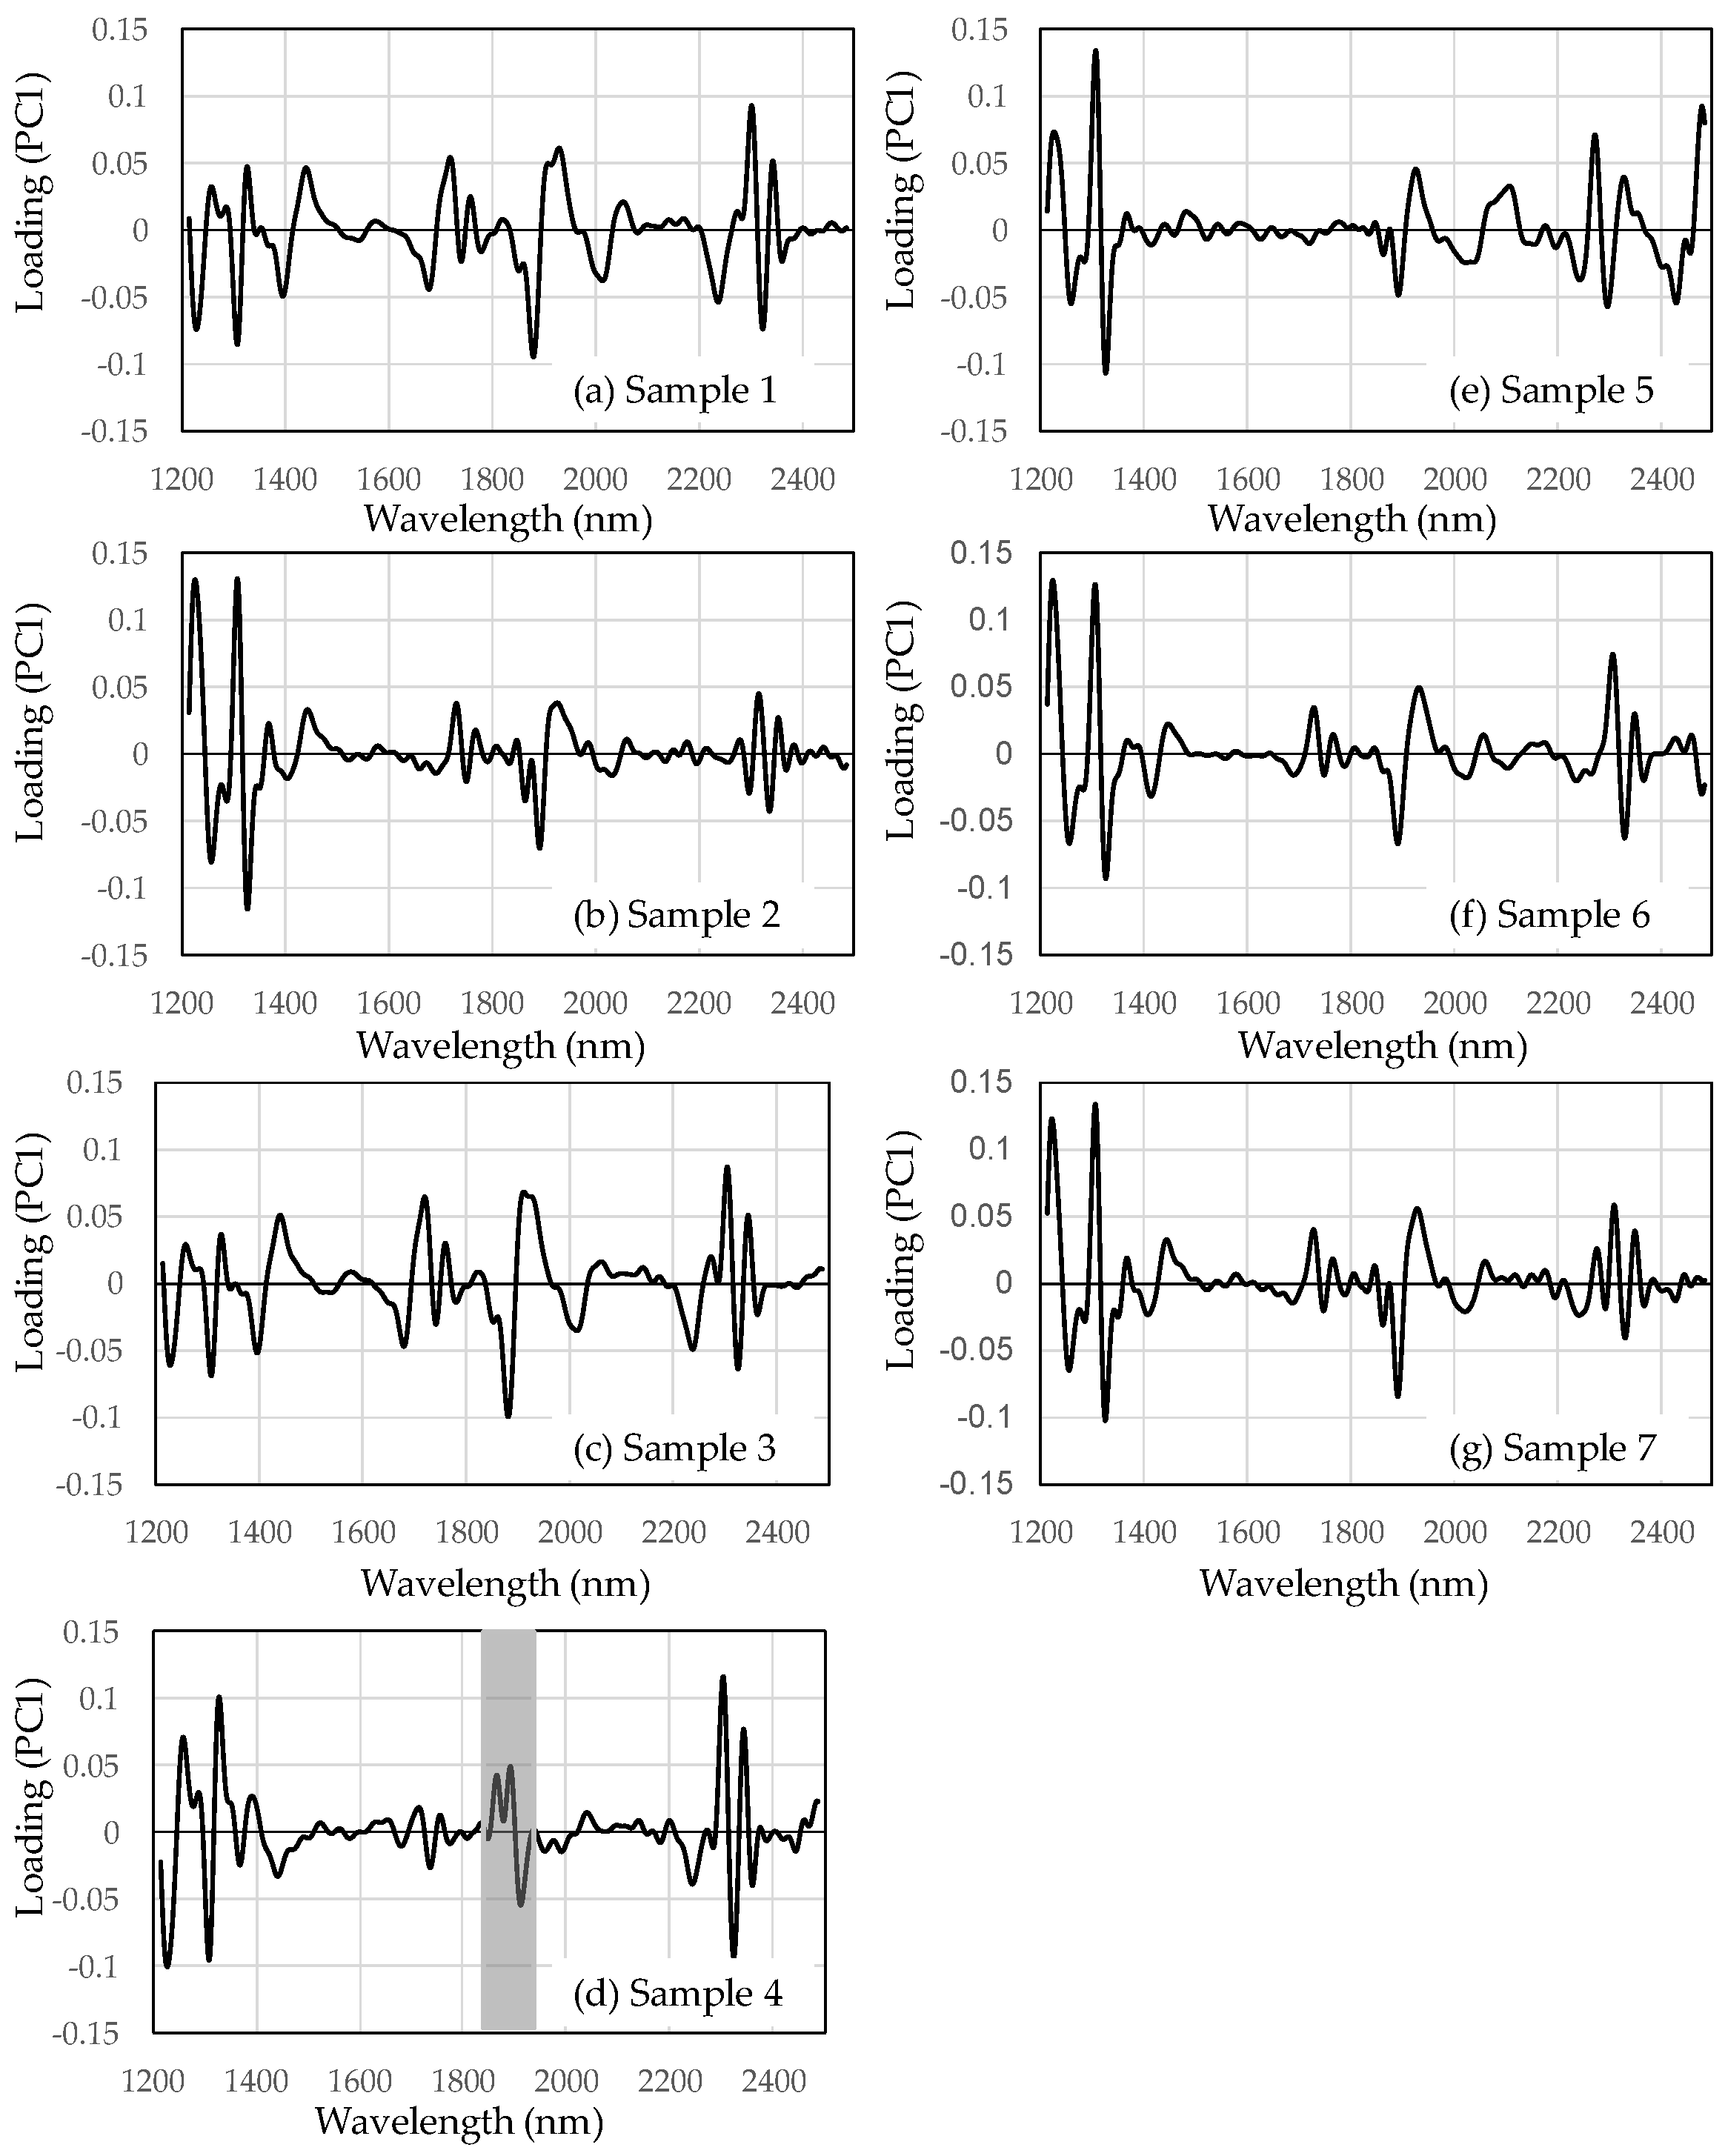
Figure 3 shows the loading plots of PC1 from seven different production areas. The loading plots of PC1 mainly indicate the absorption information of the green beans. For PC1 of sample 4, the trend at ~1850–1950 nm (Figure 3d, gray area) differs from the other samples for PC1. The NIR spectral region around 1850–1950 nm could be assigned to C=O, H2O, caffeine, chlorogenic acid, protein, lipids, and carbohydrates of the first overtone [7]. Many chemical compositions of coffee beans had absorption between 1850 and 1950 nm.
Table 3 shows the classification results of SIMCA for the green coffee beans at a significance level of 0.05 (α = 0.05). The best classification was obtained with sample 5 (Yemen), and the worst classification was found with sample 2. Sample 2 was classified into several categories with high percentages. There are a few misclassifications, i.e., assigning the wrong category, as well as instances with no category assigned. There was no difference detected among the coffee species in this sample combination. As 73% correct classification rate (sample 2) was not high classification result, the difference of production area with green coffee beans might be less. The chemical composition with production area might be changed by roasted procedure because of good results obtained roasted coffee beans [7,9].
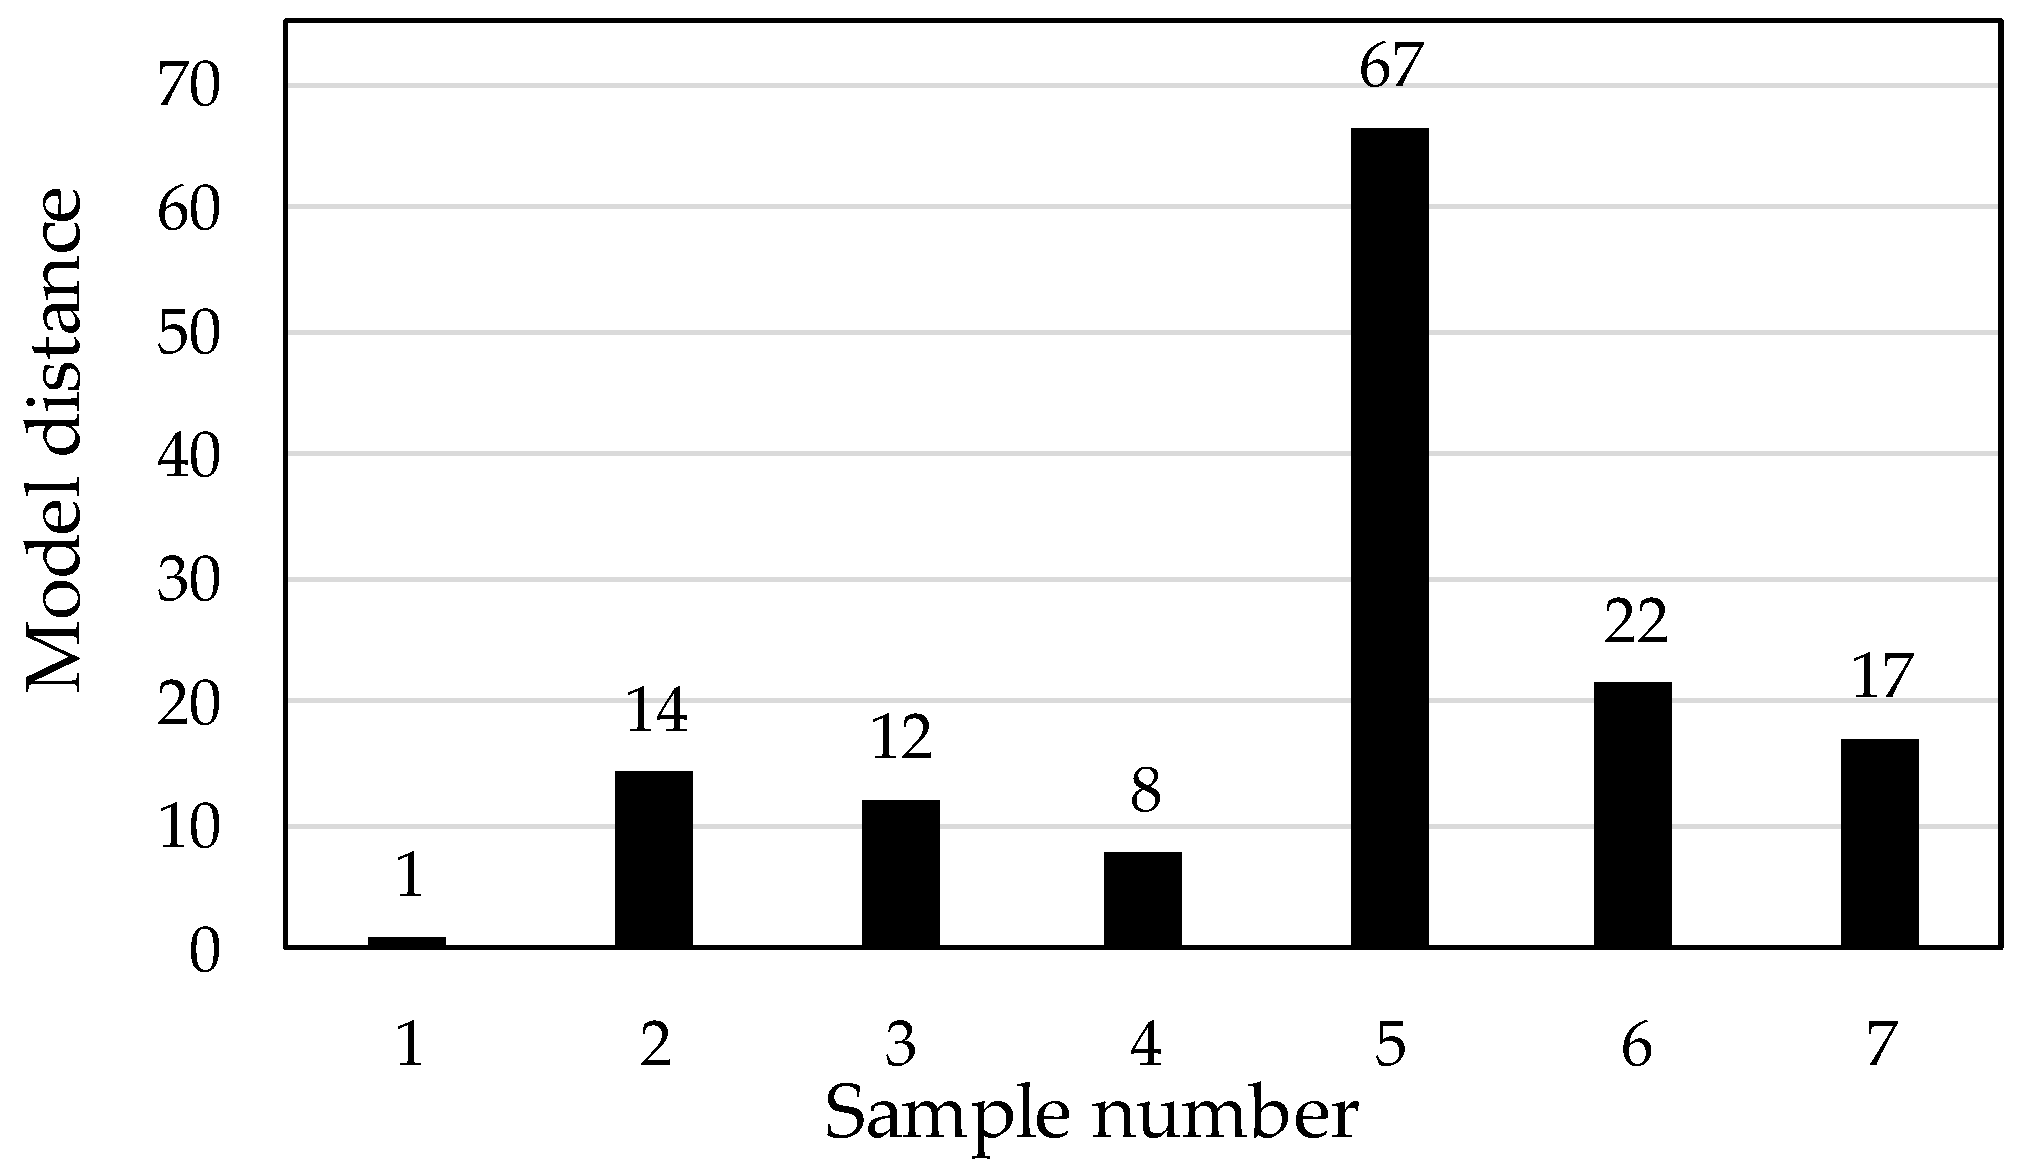
Additionally, we focused on the model distance from SIMCA for further discussion. This parameter indicates whether the models are really different. A value greater than 3 indicates that the models are significantly different [12]. Figure 4 shows the model distances from SIMCA for each green bean sample. The distance of the sample 1 model was assumed to have a value of 1. The model distance, excluding sample 5, is low, with a value of approximately 10–20. In particular, as sample 4 has a distance of 8, the different species—arabica and robusta—are similar in model distance. Such a low model distance value may be the reason for misclassifications. Sample 5 had the clearly separated from the others. Sample 5 might be different from other sample from PC1 vs. PC2 score plot, but to elucidate the difference was necessary to analyze the chemical compositions of the samples. Santos et al. [10] elucidated C–H and C–C combination bands absorption region (~2000–2500 nm) had the most information regarding the chemical composition of the defective and nondefective coffee beans. It might be compared directly because of the difference of measurement target. The chemical composition difference of coffee beans assigned NIR absorption between 1850 and 1950 and 2000 and 2500 were the presence of C=O and H2O absorption [7]. In this study, the presence of C=O and H2O absorption was useful to classify the production area for green coffee beans.
4. Conclusions
A nondestructive classification analysis for assessing the area of green coffee bean production was carried out by SIMCA. In this case, the NIR spectra were obtained from the flat surface of the seven different green beans. The classification analysis results of SIMCA are good; however, the model distance values from SIMCA are similar. For instance, as in samples 1 and 4, the different species—arabica and robusta—are similar in model distance (distance of 8). In results, the difference of production area or districts was more than that of coffee beans species. In this study, we did not perform chemical component analysis of the green beans. As the green coffee bean compositions might be similar, chemical compositions must be determined for further, deeper analysis and discussion. In this classification analysis, C=O and H2O absorption obtained from 1850 nm to 1950 nm might be important.
NIR spectra were measured from the center cutting face of the flat part of the green coffee bean. As the variance of absorbance was detected because of the different cutting face, such differed absorbance data were removed as outliers in this research. In practical use, as this measurement was highly time-consuming, the NIR image of the wavelength was limited in a way that was good for the measurements. However, NIRS represents a powerful nondestructive technique for the identification of green coffee beans.
Author Contributions
Conceptualization, Y.K.; methodology, Y.K.; software, N.O. and Y.K.; validation, Y.K.; formal analysis, Y.K.; investigation, N.O. and Y.K.; resources, N.O.; data curation, N.O. and Y.K.; writing—Review & Editing. Y.K.; visualization, N.O. and Y.K.; supervision, Y.K.; project administration, Y.K.; funding acquisition, Y.K.
Funding
This research was funded by Nihon University individual research funding.
Conflicts of Interest
The authors declare no conflicts of interest.
References
- Andres, S.; Murray, I.; Navajas, E.A.; Fisher, A.V.; Lambe, N.R.; Bunger, L. Prediction of sensory characteristics of lamb meat samples by near infrared reflectance spectroscopy. Meat. Sci. 2007, 76, 509–516. [Google Scholar] [CrossRef] [PubMed]
- Cozzolino, D.; Murray, I.; Chree, A.; Scife, J.R. Multivariate determination of free fatty acids and moisture in fish oils by partial least-squares regression and near-infrared spectroscopy. LWT Food Sci. Technol. 2005, 38, 821–828. [Google Scholar] [CrossRef]
- Woodcock, T.; Fagan, C.C.; O’Donnell, C.P.; Downey, G. Application of near and mid-infrared spectroscopy to determine cheese quality and authenticity. Food Bioprocess Technol. 2008, 1, 117–129. [Google Scholar] [CrossRef]
- Dixit, Y.; Casado-Gavalda, M.P.; Cama-Moncunill, R.; Cama-Moncunill, X.; Markiewicz-Keszycka, M.; Cullen, P.J.; Sullivan, C. Developments and Challenges in Online NIR Spectroscopy for Meat Processing. Compr. Rev. Food Sci. Food Saf. 2017, 16, 1172–1187. [Google Scholar] [CrossRef] [Green Version]
- Basri, K.N.; Hussain, M.N.; Bakar, J.; Sharif, Z.; Khir, M.F.A.; Zoolfakar, A.S. Classification and quantification of palm oil adulteration via portable NIR spectroscopy. Spectrochim. Acta A Mol. Biomol. Spectrosc. 2017, 173, 335–342. [Google Scholar] [CrossRef] [PubMed]
- Mahesh, S.; Jayas, D.S.; Paliwal, J.; White, N.D.G. Comparison of Partial Least Squares Regression (PLSR) and Principal Components Regression (PCR) Methods for Protein and Hardness Predictions using the Near-Infrared (NIR) Hyperspectral Images of Bulk Samples of Canadian Wheat. Food Bioprocess Technol. 2014, 8, 31–40. [Google Scholar] [CrossRef]
- Barbin, D.F.; de Souza Madureira Felicio, A.L.; Sun, D.-W.; Nixdorf, S.L.; Hirooka, E.Y. Application of infrared spectral techniques on quality and compositional attributes of coffee: An overview. Food Res. Int. 2014, 61, 23–32. [Google Scholar] [CrossRef] [Green Version]
- Downey, G.; Boussion, J. Authentication of Coffee Bean Variety by Near-infrared Reflectance Spectroscopy of Dried Extract. J. Sci. Food Agric. 1996, 71, 41–49. [Google Scholar] [CrossRef]
- Esteban-Díez, I.; González-Sáiz, J.M.; Pizarro, C. Prediction of sensory properties of espresso from roasted coffee samples by near-infrared spectroscopy. Anal. Chim. Acta 2004, 525, 171–182. [Google Scholar] [CrossRef]
- Santos, J.R.; Sarraguca, M.C.; Rangel, A.O.; Lopes, J.A. Evaluation of green coffee beans quality using near infrared spectroscopy: A quantitative approach. Food Chem. 2012, 135, 1828–1835. [Google Scholar] [CrossRef] [PubMed]
- Kurata, Y. Nondestructive Classification Analysis of Wood Soaked in Seawater by Using Near-Infrared Spectroscopy. For. Prod. J. 2017, 67, 63–68. [Google Scholar] [CrossRef]
- Esbensen, K.H. Multivariate Data Analysis—In Practice, 5th ed.; Camo Software: Oslo, Norway, 2010; ISBN-10 8299333032. [Google Scholar]
- Dunn, W.J., III; Wold, S. Relationships between chemical structure and biological activity modeled by SIMCA pattern recognition. Bioorg. Chem. 1980, 9, 505–523. [Google Scholar] [CrossRef]
- Meza-Marquez, O.G.; Gallardo-Velazquez, T.; Osorio-Revilla, G. Application of mid-infrared spectroscopy with multivariate analysis and soft independent modeling of class analogies (SIMCA) for the detection of adulterants in minced beef. Meat. Sci. 2010, 86, 511–519. [Google Scholar] [CrossRef] [PubMed]
- Tominaga, Y. Comparative study of class data analysis with PCA-LDA, SIMCA, PLS, ANNs, and k-NN. Chemom. Intel. Lab. Syst. 1999, 49, 105–115. [Google Scholar] [CrossRef]
- Siesler, H.W.; Ozaki, Y.; Heise, H.M. Near-Infrared Spectroscopy: Principles, Instruments, Applications; Wiley-VCH: Weinheim, Germany, 2002; ISBN-10 3527301496. [Google Scholar]
- Hasegawa, T. Detection of Minute Chemical Species by Principal-Component Analysis. Anal. Chem. 1999, 71, 3085–3091. [Google Scholar] [CrossRef] [PubMed]
Figure 1.
NIR spectra of each green coffee bean from the center cutting face: (a) raw spectra and (b) pretreated spectra by calculating averaged value per each wavelength.
Figure 1.
NIR spectra of each green coffee bean from the center cutting face: (a) raw spectra and (b) pretreated spectra by calculating averaged value per each wavelength.

Figure 2.
Score plot of PC1 versus PC2 for using pretreated NIR spectra.

Figure 3.
Loading plots of PC1 from seven different production areas: (a) Sample 1, (b) Sample 2, (c) Sample 3, (d) Sample 4, gray area indicates the characteristic peaks around 1850∓1950 nm,(e) Sample 5, (f) Sample 6, (g) Sample 7.
Figure 3.
Loading plots of PC1 from seven different production areas: (a) Sample 1, (b) Sample 2, (c) Sample 3, (d) Sample 4, gray area indicates the characteristic peaks around 1850∓1950 nm,(e) Sample 5, (f) Sample 6, (g) Sample 7.

Figure 4.
Model distance results of SIMCA for each sample (α = 0.05).


Table 1.
Coffee sample information for analysis.
| Sample Number | Country of Production (District) | Commodity Name | Breed Variety |
|---|---|---|---|
| 1 | Indonesia (Bari) | Bari | Arabica |
| 2 | Cuba | Crystal Mountain | Arabica |
| 3 | Ethiopia | Ethiopia | Arabica |
| 4 | Indonesia (JaVa) | Java | Robusta |
| 5 | Yemen | Mokha Mattari | Arabica |
| 6 | Indonesia (Sumatra) | Linton Mandheling | Arabica |
| 7 | Tanzania | Tanzania | Arabica |
Table 2.
Number or training set and principal components (PCs) for each measurement sample.
| Sample Number | Country of Production (District) | No. in Training Set | No. of PCs |
|---|---|---|---|
| 1 | Indonesia (Bari) | 73 | 6 |
| 2 | Cuba | 70 | 6 |
| 3 | Ethiopia | 76 | 6 |
| 4 | Indonesia (JaVa) | 57 | 7 |
| 5 | Yemen | 70 | 3 |
| 6 | Indonesia (Sumatra) | 48 | 6 |
| 7 | Tanzania | 51 | 4 |
Table 3.
Soft independent modeling of class analogy (SIMCA) classification results (α = 0.05).
| Sample | No. in Test Set | Correct Classification (%) | Classified Several Category (%) | Classified Wrong Category (%) | Classified No Category (%) |
|---|---|---|---|---|---|
| 1 | 15 | 86 | 13 | 0 | 0 |
| 2 | 15 | 73 | 26 | 0 | 0 |
| 3 | 15 | 93 | 7 | 0 | 0 |
| 4 | 15 | 80 | 13 | 0 | 7 |
| 5 | 15 | 100 | 0 | 0 | 0 |
| 6 | 15 | 80 | 13 | 7 | 0 |
| 7 | 15 | 80 | 20 | 0 | 0 |
© 2019 by the authors. Licensee MDPI, Basel, Switzerland. This article is an open access article distributed under the terms and conditions of the Creative Commons Attribution (CC BY) license (http://creativecommons.org/licenses/by/4.0/).
Share and Cite
MDPI and ACS Style
Okubo, N.; Kurata, Y. Nondestructive Classification Analysis of Green Coffee Beans by Using Near-Infrared Spectroscopy. Foods 2019, 8, 82. https://doi.org/10.3390/foods8020082
AMA Style
Okubo N, Kurata Y. Nondestructive Classification Analysis of Green Coffee Beans by Using Near-Infrared Spectroscopy. Foods. 2019; 8(2):82. https://doi.org/10.3390/foods8020082
Chicago/Turabian StyleOkubo, Naoya, and Yohei Kurata. 2019. "Nondestructive Classification Analysis of Green Coffee Beans by Using Near-Infrared Spectroscopy" Foods 8, no. 2: 82. https://doi.org/10.3390/foods8020082
Note that from the first issue of 2016, this journal uses article numbers instead of page numbers. See further details here.