
Development of Functional Gluten-Free Sourdough Bread with Pseudocereals and Enriched with Moringa oleifera


Department of Food Technology, Food Science and Nutrition, Faculty of Veterinary Sciences, Regional Campus of International Excellence “Campus Mare Nostrum”, University of Murcia, Espinardo, 30071 Murcia, Spain
*
Author to whom correspondence should be addressed.
Foods 2023, 12(21), 3920; https://doi.org/10.3390/foods12213920
Submission received: 15 September 2023
/
Revised: 18 October 2023
/
Accepted: 23 October 2023
/
Published: 26 October 2023
(This article belongs to the Section Grain)
Abstract
:Celiac patients tend to have an unbalanced diet, because gluten-free products typically contain a high amount of fats and carbohydrates and a low amount of proteins, minerals, and dietary fiber. This research focused on the development of gluten-free functional breads using pseudocereals, psyllium, and gluten-free sourdough to replace commercial yeast, fortifying them with Moringa oleifera. Six different gluten-free breads were made with sourdough: three control breads differentiated by sourdough (quinoa, amaranth, and brown rice) and three breads enriched with moringa leaf differentiated by sourdough. The antioxidant capacity, phenolic compounds, nutritional composition, physicochemical parameters (color, pH, and acidity), folate content, amino acid profile, reducing sugars, mineral composition, mineral bioaccessibility, fatty acid profile, and sensory acceptability were evaluated. A commercial gluten-free (COM) bread was included in these analyses. Compared with COM bread, the reformulated breads were found to have better nutritional properties. Moringa leaf increased the nutritional properties of bread, and highlighted the QM (quinoa/moringa) bread as having increased protein, fiber, sucrose, glucose, maltose, phenylalanine, and cysteine. The AM (amaranth/moringa) bread was also shown to have a higher total folate content, antioxidant capacity, phenolic compounds, 9t,11t-C18:2 (CLA), and 9t-C18:1. Reformulated breads enriched with moringa could meet nutritional requirements and provide health benefits to people with celiac disease.
1. Introduction
Celiac disease is a chronic autoimmune enteropathy whose symptoms appear after the ingestion of gluten by genetically predisposed individuals, and is one of the most common lifelong disorders; the most effective treatment has proven to be strict adherence to a lifelong gluten-free diet. This diet, according to Vici et al. [1], is typically low in fiber, vitamin D, vitamin B12, folic acid, iron, zinc, and magnesium, with an unbalanced carbohydrate, fat, and protein intake [2]. People with celiac disease, as well as people with non-celiac gluten sensitivity and an increasing number of consumers who avoid gluten for lifestyle reasons, follow a gluten-free diet [3,4]. For this reason, the gluten-free food market has seen an increase in the development of gluten-free products in recent years [5].
Among gluten-free foods, bread is the most consumed; globally, it represents an important staple food product. Generally, gluten-free bread is a product with unsatisfactory sensory properties and a poor nutritional quality [6,7], as it is mainly based on starch and refined flours, resulting in products that are high in available starch and low in protein, dietary fiber, micronutrients, and bioactive compounds [8,9].
The pseudocereals buckwheat, quinoa, and amaranth have received much attention in recent years due to their nutritional profile and health benefits [10,11]. Pseudocereals contain a high protein content with a balanced amino acid composition and are also an important source of phytochemicals, dietary fiber, vitamins, and minerals [12]. In addition, buckwheat, quinoa, and amaranth are naturally gluten-free and are considered healthy ingredients for fortifying gluten-free foods [11,13].
Grain legume meals are a good source of phenolic compounds, as well as protein, carbohydrates, dietary fiber, minerals, and vitamins [14,15]. In a study conducted by Santos et al. [16], in which 75% of rice flour was replaced with chickpea flour, an improvement in bread quality and an increase in protein content, dietary fiber, resistant starch, reduced glycemic index, and satiety were reported.
Moringa oleifera is known as a miracle plant because of its high nutritional properties [17]. Moringa oleifera leaf has been used as an alternative food source to combat malnutrition [18], as it contains significant amounts of total phenols, calcium, iron, potassium, magnesium, manganese, functional peptides, folic acid, and copper [19]. In addition, incorporating Moringa oleifera leaf powder into bread is an effective strategy to enhance the daily intake of protein and fiber, all while utilizing a robust crop. Amidst the shifting dynamics of our global climate, the hardy Moringa oleifera tree demonstrates remarkable adaptability to emerging regions impacted by rising temperatures, such as the Mediterranean basin. These characteristics show promise for expanding the cultivation of this crop. Furthermore, previous research by Hussin et al. [20] recommended the use of Moringa oleifera leaf powder to augment the nutritional profile of food items, particularly with regards to minerals and amino acids.
One way to nourish the population would be through fortified foods. Thus, the addition of moringa to staple foods, such as bread, could be a safe way for both the healthy and celiac population to consume it [21]. Celiac patients have deficiencies in many micronutrients, including iron; folic acid; vitamins A, B6, B12, D, E, and K; calcium; and zinc, due to malabsorption [22,23]; in addition, gluten-free products contain lower levels of vitamins D, E, and B12; iron; folate; magnesium; potassium; and sodium than gluten-containing foods [1]. This lack of fortification could facilitate an increased risk of micronutrient deficiency in subjects with celiac disease on an adequate gluten-free diet [1]. According to Vici et al. [1], only 5% of gluten-free breads contain the four mandatory fortification micronutrients (calcium, iron, niacin, and thiamine), while 28% are fortified only with calcium and iron. However, it should be noted that not all countries require food fortification. In fact, some countries only require the fortification of wheat-based products, and these rules are not imposed on “dietetic or special foods”, such as gluten-free products. There have been some studies on the use of moringa leaf powder as a nutritional supplement to wheat bread, but there are no studies on gluten-free bread with added moringa leaf [17,24,25].
Gluten-free bread lacks the above-mentioned nutrients found in pseudocereals, pulses, and Moringa oleifera [26], which could thus be used to make and enrich gluten-free bread.
In addition, the nutritional enhancement resulting from sourdough fermentation has a significant influence on the availability of micronutrients, protein digestibility, phenolic compound concentration, antioxidant capacity, and functional characteristics (such as a low glycemic index) [27,28]. This has increased the interest of consumers who are focused on their well-being and health, thereby creating fresh market prospects for the bakery industry. Sourdough is a natural improvement that can be used in the production of gluten and gluten-free bread [29].
As mentioned above, within the food product ranges, gluten-free formulations have been reported to have a lower nutritional value compared with gluten-containing products [30]. Many resources have been invested into the development of gluten-free bread in an attempt to make gluten-free bread comparable to gluten-containing bread in terms of nutritional and sensory characteristics [3,31]. In addition to the challenge of the technicality of production, mainly due to the absence of viscoelastic gluten, which makes the entire baking process problematic [32,33]. To address the lack of gluten and simulate its viscoelastic behavior, the addition of hydrocolloids such as psyllium plays a strategic role in making gluten-free dough workable [34].
The gluten-free diet can be significantly improved using alternative cereals such as quinoa, amaranth, and buckwheat; substituting commercial yeast for sourdough; adding psylium to create the gluten-like structure; and fortifying the bread with Moringa oleifera.
The aim of this research is to develop and manufacture a novel gluten-free functional bread that promotes the health of celiac patients. This bread is created by incorporating Moringa oleifera into amaranth, buckwheat, and chickpea flour, with the addition of three different sourdoughs: amaranth, buckwheat, and rice. The formulation of this bread is designed to meet the criteria needed for labeling it as both “a source of protein” and “high in fiber”. The study involves evaluating the nutritional composition, bioavailability, and sensory appeal of the enriched bread, as well as calculating the bioavailability of minerals.
2. Materials and Methods
2.1. Materials
Sugar, olive oil, and salt were purchased at local markets in Murcia, Spain. Amaranth flour was obtained from EcoAndesImportExport, Madrid, Spain. Psyllium, chickpea flour, and maize starch were procured from Planeta Huerto, Alicante, Spain. Buckwheat flour and brown rice flour were supplied from Biovitagral, Italy. Quinoa flour was obtained from Legumbres Pedro, Cádiz, Spain. Water was taken from the tap. Moringa powder obtained from 100% dried moringa leaves was supplied by KeyPharm Laboratories (Oostkamp, Belgium). Moringa oleifera contains significant amounts of total phenols (32.90 mg GAE/g), calcium (1.48 g/100 g), iron (25.14 mg/100 g) DW, potassium (1.75 g/100 g DW), magnesium (301.11 mg/100 g DW), manganese (7.21 mg/100 g DW), folic acid (16.57 g/100 g DW), copper (0.45 mg/100 g DW), protein (25.30 g/100 g DW), and fiber (24.97 g/100 g DW) [35]. Commercial gluten-free bread was purchased at the local supermarket (Hipercor, S.A., El corte ingles, Murcia, Spain) for comparison with the developed breads. Commercial bread is composed of the following ingredients: corn starch, water, sourdough (rice flour, water) 16%, rice starch, vegetable fiber (psyllium), rice syrup, sunflower oil, soy protein, thickener of hydroxypropyl methylcellulose, 1.9% millet flour, 1.3% quinoa flour, yeast, honey, and iodized salt (salt and potassium iodide).
2.2. Methods
2.2.1. Sourdough Preparation
Three types of sourdoughs were prepared, differing in the type of flour: quinoa flour, amaranth flour, and brown rice flour. A spontaneous ferment was performed, which consisted of adding a 50:50 ratio of water and flour using a backsloping procedure every 24 h for 5 days at room temperature (25–26 °C), according to the method followed by Tomić et al. [36].
2.2.2. Gluten-Free Bread Preparation
Gluten-free bread formulations are given in Table 1. Six different breads were prepared, three control breads differing in the sourdough—each bread created with quinoa sourdough, amaranth, or brown rice. The other three breads were prepared in the same way, but moringa was added at a concentration of 6% in relation to the flour. Bread ingredients were mixed to a homogeneous and fluid dough consistency in a mixer (Taurus, Giro, Oliana, Spain) for 5 min, followed by dough fermentation at 26 °C with 85% relative humidity for 5 h. The fermented dough was baked at 175 °C for 25 min (Fagor innovation 6H-757CX, Murcia, Spain). After baking, the loaves were allowed to cool for 1 h and were then vacuum packed in polyethylene bags.
2.2.3. Chemical Composition
The proximate composition of the breads was determined using the standard methods of Association of Official Analytical Chemists (AOAC): moisture (964.22:1995), protein (955.04:1995), total fat (920.390:1995), ash (923.03:1995), total dietary fiber, soluble fiber, and insoluble fiber (985.29:1985). Carbohydrates were calculated by difference according to the following formula:
Carbohydrates = 100 − (total fat + ash + protein + moisture + total dietary fiber).
2.2.4. pH, Total Titratable Acidity (TTA), and Acid Content
pH was measured in triplicate and was determined with the help of a pH meter (Crison GLP21) after mixing 10 g of fresh bread sample with 90 mL of distilled water at room temperature. The total titratable acidity (TTA) was then measured by titration with 0.01 NaOH and was expressed as ml NaOH/10g.
Concentrations of L-lactic and acetic acid were analyzed using a specific kit Acetic Acid Assay Kit (Acetate Kinase) and L-Lactic Acid Assay Kit (L-Lactate dehydrogenase) (Byosistems S.A, Barcelona, Spain), respectively, according to manufacturer’s instructions. The results were expressed as g of L-lactic or acetic acid per kilogram of bread. Three replicates were averaged for each sample.
2.2.5. Color
Color was measured using a Konica Minolta CR-410 chromameter (Minolta Camera Co., Osaka, Japan) and the DP-400 data processor of “AQ instruments” was used to measure crust color (CIE Lab* values). CIE L* values (lightness), CIE C* values (saturation), a* values (red-green), b* values (yellow-blue), and h* (nuance) were measured. Three replicates were averaged for each sample.
2.2.6. Antioxidant Capacity
The bioactive compounds of the breads were extracted in 80% aqueous methanol, as reported by Repo-Carrasco and Encina-Zelada [37], with some modifications. The bread (2 g) was first homogenized in 8 mL of 80% methanol and then left under refrigeration 4 °C for 24 h in the dark. After 24 h, they were centrifuged at 4500 rpm, 4 °C for 25 min. Finally, they were filtered with 0.45 mm nylon filters and stored at −20 °C until analysis. The extraction of bioactive compounds from the breads was performed in triplicate.
Four assays were used to determine the antioxidant activity of the breads based on antiradical activities: (1) radical scavenging activity capacity (DPPH), (2) cation radical scavenging activity (ABTS), (3) reducing ferric antioxidant power (FRAP), and (4) oxygen radical scavenging capacity (ORAC).
Antioxidant activity related to the chelating capacity was measured using the 2,2-diphenyl-1-picrylhydrazyl (DPPH) free-radical scavenging method described by Brand-Williams et al. [38] and Sánchez-Moreno et al. [39]. The extract (100 µL) was mixed with 3.9 mL of DPPH reagent and allowed to stand for 30 min before reading at 515 nm absorbance.
The radical cation scavenging activity (ABTS) was determined by mixing 100 µL of extract with 1 mL of 7 mM 2,2-azinobis(3-ethylbenzothiazolin)-6-sulfonic acid (ABTS) reagent with an absorbance of 0.70, prepared according to Re et al. [40]. The absorbance of the mixture was measured at 734 nm after reacting for 2 min at room temperature.
The ferric reducing antioxidant power (FRAP) assay was performed by mixing 100 uL of extract with 1 mL of FRAP reagent for 4 min at 37 °C under dark conditions, as reported by Benzie and Strain [41]. The FRAP reagent was performed daily with a solution of 800 mM acetate buffer, pH = 3.6, 20 mM FeCl3–6 H2O, 10 mM TPTZ (2,4,6-tripyridyl-s-triazine) in 40 mM (10:1:1, v/v/v). The absorbance of the mixture was measured at 593 nm against a blank.
The oxygen radical absorbance capacity (ORAC) method [42] was followed to measure the hydrophilic antioxidant capacity. The reaction was performed in a phosphate buffer (0.075 M, pH 7.0). For this purpose, 20 μL of the extract, at different concentrations, and 20 μL Trolox standards, were pipetted into a black 96-well plate. After plate preparation, 200 μL of fluorescein was dispensed into each well. After 15 min at 37 °C in dark incubation, the reaction was initiated by adding 20 μL of 40 mM AAPH (2,2′-azobis(2-amidinopropane) dihydrochloride) to each well using the Synergy HT plate reader after a purge with water and the corresponding reagents. Fluorescence decay was measured using the Biotek Synergy HT plate reader at 485 nm excitation and 528 nm emission every minute for one and a half hours at 37 °C. The antioxidant activity of the sample was expressed as µM of Trolox equivalents (TEs) per g of extract.
2.2.7. Total Phenolic Content (TPC)
The determination of the total phenolic compounds was carried out using the Folin−Ciocalteu method described by Singleton and Rossi [43] using Folin−Ciocalteu reagent and gallic acid as the standard (20, 40, 60, 80, and 100 mg/L). The absorbance of the extracts was measured at 750 nm. The analysis was performed in triplicate and the TPC were expressed as mg gallic acid equivalents (GAEs) per g of sample.
2.2.8. Determination of Disaccharides and Monosaccharides
The sucrose, maltose, D-glucose, and D-fructose concentrations were analyzed using three specific kits: maltose/sucrose/D-glucose/D-fructose, sucrose/D-glucose/D-fructose and D-glucose/D-fructose (Byosistems S.A, Barcelona, Spain), respectively, according to manufacturer’s instructions. The analysis was carried out on the Biosystems Y15/c (Byosistems S.A, Barcelona, Spain) multiparameter automatic analyzer. The results were expressed as g of maltose, sucrose, D-glucose, or D-fructose per 100 g of bread. Three replicates were averaged for each sample.
2.2.9. Bioaccessibility and Determination of Minerals
For the evaluation of the mineral bioaccessibility, simulated gastrointestinal digestion of the samples was performed using the method proposed by Minekus et al. [44]. For this purpose, three simulated digestion fluids were performed: salivary (SSF), gastric (SGF), and intestinal fluid, for the three phases of digestion (oral, gastric, and intestinal). Starting with the oral phase, the bread was mixed with SSF electrolyte stock solution (50:50; w/v) and the pH was adjusted to 7. Human salivary amylase (75 U/mL) and 0.75 mM CaCl2 were added. Once ready, it was incubated at 37° for 2 min. For the gastric phase, the above mixture was mixed with SGF to obtain a final ratio of 50:50 (v/v) and the pH was modified to 3.0 using 6 M HCl. Porcine pepsin (2000 U/mL) and 0.075 mM CaCl2 were added, after which the samples were incubated at 37 °C for 2 h. Finally, for the intestinal phase, SIF was added to the obtained mixture (50:50) and 0.3 mM CaCl2. The pH was neutralized with 1 M NaOH and porcine pancreatin and bile salts were added at 100 U/mL and 10 U/mL, respectively. The aliquot was divided into two: one was called the soluble phase and the other the dialysate phase, which was introduced through a dialysis membrane. Both phases were incubated at 37 °C for 2 h. The supernatant obtained was filtered through 0.2 m and the mineral content was measured by inductively coupled plasma mass spectrometry (ICP-MS) (Thermo electron X7 inductively coupled plasma mass spectrometry, model X series, Agilent, Santa Clara, United States). The standards were diluted and used to calibrate the ICP-MS for mineral analysis in the samples studied [45].
2.2.10. Amino Acid Content
Amino acids were extracted following the method proposed by Shahidi and Synowiecki [46]. Amino acids were derivatized using 6-aminoquinolyl-N-hydroxysuccinimidyl carbamate (Waters AccQ-Fluor reagent kit) and determined using HPLC (Waters 2695 Separations Module + Waters 2475 Multi Fluorescence Detector + Waters AccQ-Tag amino acids analysis column). Tryptophan was destroyed during amino acid analysis and was thus not quantified. The amino acid content was expressed as mg/100 g dry matter.
2.2.11. Fatty Acid Profile
The lipids extracted (50 mg) were used to determine the fatty acid profile. The total fatty acids were transesterified using the method previously described by Domínguez et al. [47]. A GC equipment (GC-Agilent 6890 N; Agilent Technologies Spain, S.L., Madrid, Spain) with a flame ionization detector was used for the separation and quantification of the fatty acid methyl esters (FAMEs) using the chromatographic conditions proposed by Domínguez et al. [47]. Individual FAMEs were identified by comparing their retention times with those of authentic standards (Supelco 37 component FAME Mix, Sigma-Aldrich, Barcelona, Spain). C18:1n-7 cis (Supelco cis-11-Vaccenic methyl ester), C18:1n-11 trans (trans-11-vaccenic methyl ester), and C18:2n-7 (CLA) (Matreya LLC Methyl 9(z),11 (E)-octadecadienoate) were not included in the commercial mix. In addition, nonadecanoic acid (C19:0) was used as the internal standard, which was added to the samples prior to methylation. Data were expressed in g/100 g of FAME.
2.2.12. Determination of Folates
Folates were extracted from the sample following the procedure described by Konings and Pfeiffer et al. [48,49]. For that, 1 g of sample was mixed with 25 mL of extraction buffer (50 mmol/L CHES, 50 mmol/L HEPES, containing 2 g sodium ascorbate/100 mL and 10 mmol/L 2-mercaptoethanol, pH 7.85) under a nitrogen atmosphere. The extraction mixtures, in screw-capped tubes, were placed in a boiling water bath for 10 min, cooled on ice, and homogenized. Then, the pH was adjusted to 4.9 with 60 mmol/L HCl. Enzymatic des conjugation and purification of samples were carried out following the methodology described by Vahteristo et al. [50]. An aliquot of 5 mL was incubated for 3 h at 37 °C under a nitrogen atmosphere with 1 mL of α-amylase preparation (20 mg/mL in 1 g sodium ascorbate/100 mL) and 1 mL of hog kidney conjugase prepared from fresh pig kidneys, as described by Gregory, Sartain, and Day [51]. To inactivate the enzymes, the samples were boiled at 100 °C for 5 min. The samples were centrifuged at 2000 rpm for 10 min and filtered on 0.45 μm pore size filters and passed through purified, strong anion exchange (SAX) cartridges connected to a Supelco 12-port vacuum manifold.
The separation and analysis of samples were performed with an HPLC/MS system consisting of an Agilent 1290 Infinity II Series HPLC, as described by López-Nicolás et al. [52]. The folate standards used were trihydrochloride tetrahydrofolic acid (H4), 5-Methyltetrahydrofolic acid, 5-formyltetrahydrofolic acid, and folic acid supplied by Dr. Schirck’s Laboratory (Jona, Switzerland).
2.2.13. Sensory Analysis
The sensory analysis was carried out by means of hedonistic tasting involving 35 untrained panelists aged 19–59 years. The analysis comprised the evaluation of the seven different types of breads, which were coded with three random digits. It was conducted in isolated booths according to ISO-8586 [53]. The booths were separated from each other in order to isolate the study participants, thus avoiding the possible influence of the perception of the other panelists. The parameters of appearance, color, aroma, texture, juiciness, taste, purchase intention, and general acceptance were evaluated on a scale of 1 to 5, with 1 being the worst (‘I don’t like it at all’) and 5 being the best (‘I like it very much’).
2.2.14. Statistical Analysis
All statistical analyses were performed using IBM SPSS Statistics® 28 software (IBM Corporation, Armonk, NY, USA). The proximate composition, amino acids, fatty acids, mineral bioaccessibility, folates, antioxidant capacity, and phenolic compounds among the breads studied were examined using two-way ANOVA tests for the difference between the type of sourdoughs and for the difference between the addition of moringa. Least squares means were compared using the post hoc HSD Tukey test (significance level p < 0.05). Values were given in terms of mean values ± standard deviations. Person’s correlation coefficients was used to evaluate the relationship between physicochemical parameters (pH and acidity) and acid contents (lactic and acetic) of bread.
3. Results and Discussion
3.1. Chemical Composition
The chemical compositions of the gluten-free breads samples are presented in Table 2. As for moisture, COM bread (42 g/100 g) was found to have the highest moisture content and Q bread (32.34 g/100 g) the lowest.
It was observed that with the inclusion of moringa leaf, the ash content increased significantly compared with the control breads, especially in the QM bread (2.33 g/100 g). The COM bread (0.01 g/100 g) obtained the lower ash content compared to formulated breads. Aly et al. [54] also found that the inclusion of moringa leaf in bread increased the ash content. This finding also coincides with that obtained by Sardabi et al. [55], where they added moringa seed to wheat bread. Regarding the control breads, a higher ash content was observed than the in the commercial bread; this is mainly because buckwheat, amaranth, and quinoa are pseudocereal that stand out for their mineral content, and it is already known that the ash content is related to the level of minerals [56].
Regarding total fat, the COM bread (3.25 g/100 g) was found to have the highest content compared with the formulated breads. The inclusion of the moringa leaf showed a significant increase in fat content compared with the control breads. Aly et al. [54] also found that adding moringa to bread increased the fat level of the bread; this is because moringa leaf contains 5–6 g/100 g Dw of total fat [35]. A previous study indicated that moringa leaf contains a high proportion of polyunsaturated fatty acids [57]; therefore, moringa leaf is recommended for human consumption as the polyunsaturated fatty acids contents include omega-3 and -6, which are fatty acids that have been shown to help prevent and treat cardiovascular and neural diseases [58,59,60]. In the formulated breads, breads with quinoa sourdough stood out in both the control and enriched breads; this is because the fat content of quinoa (6.07 g/100 g) is higher than that of brown rice and amaranth [28].
Regarding protein, in the control breads no significant differences were found between the different sourdoughs, highlighting the highest level in the quinoa sourdough and the lowest level in the brown rice sourdough. However, the enriched breads did show significant differences between the different sourdoughs, with the bread with quinoa sourdough (QM) standing out with the highest protein content (6.76 g/100 g) as in the control breads. Therefore, the quinoa sourdough contributed protein to the bread, due to the high protein content of quinoa [61].In addition, the sourdough increased protein digestibility due to proteolysis produced during the fermentation period [62]. In the enriched bread, the protein level was much higher, as Moringa oleifera is high in protein (25.30 g/100 g Dw) [35]. The gluten-free bread with the lowest protein content significantly was COM bread (2.96 g/100 g), due to the high proportion of refined flours with a low level of protein [63].
The highest content of total, insoluble, and soluble dietary fiber was obtained in the QM bread and the lowest was in the COM bread. In both the control and enriched breads, a higher content of total, soluble and insoluble dietary fiber was observed in the breads with quinoa sourdough, because quinoa is the pseudocereal with a highest content of total, insoluble, and insoluble fiber compared with the other pseudocereals and cereals present in this study. This is mainly caused by lactic acid bacteria, which contain proteinases that result in the progressive hydrolysis of the cereal or pseudocereal [64]. Both the control and enriched bread with brown rice sourdough showed the lowest total and soluble fiber content. According to Yan et al. [65], brown rice contains 1.27–1.69 g/100 g of soluble fiber and 4–5 g/100 g of total fiber, which is much lower compared with the soluble (1.8–3.7 g/100 g) and total (7.3–11.4 g/100 g) fiber in amaranth and the soluble (2.1–3.9 g/100 g) and total (7–9.5 g/100 g) fiber in quinoa [64]; however, concerning insoluble fiber, the lowest content was found in bread with amaranth sourdough (A) (6.80 g/100 g), slightly lower than that found in bread with brown rice sourdough (BR). A significant increase in total, insoluble, and soluble fiber was observed in the breads enriched with moringa, mainly due to the high fiber content of the moringa leaf powder (24.97 g/100 g) [35]. This finding was also observed by Nudel et al. [66] when adding moringa leaf in different concentrations to wheat bread. The bread with the lowest fiber content was the COM bread, mainly due to the high proportion of refined flours—flours that are characterized as starchy foods that are low in dietary fiber [6].
Carbohydrates depend on the amount of moisture, ash, fat, fiber, and protein. The highest carbohydrate content was obtained in the A bread (48.98 g/100 g), and the bread with the lowest level was the AM bread (36.27 g/100 g). Breads enriched with moringa had a higher content of lipids, ash, fiber, and protein, which resulted in a decrease in carbohydrates in these breads. This was also observed by Sardabi et al. [55], who found that the addition of moringa seed to wheat bread reduced its carbohydrate content. Ajibola et al. [67] also agreed with the finding, where they prepared different cookies with moringa leaf in percentages of 0–10% and obtained a reduction in carbohydrates with an increase of 3–5% moringa to the cookie. But, in addition to the incorporation of moringa leaf, this decrease in carbohydrates may also be due to the sourdough, as several studies have observed a decrease of at least 30% fermentable polyols in sourdough breads, which will result in a lower amount of fermentable carbohydrates and free glucose [68,69].
3.2. pH, Total Titratable Acidity (TTA), and Acid Content
The pH, acidity, L-lactic acid, and acetic acid contents are shown in Table 3. Regarding pH, it was observed that the COM bread obtained the lowest pH and the highest pH was obtained by the BR bread; however, it was found that the breads enriched with moringa leaf had significantly lower pH values (p < 0.05) than the control breads. Among the different types of sourdough used, a slight variation could be observed, with the lowest pH levels found in the Q and A breads and the highest in the BR bread. This is mainly as a result of the pH levels of amaranth and quinoa, which are approximately 5, while the pH of brown rice is close to 3 [70]. The total titratable acidity values were affected by the presence of moringa leaf, causing an increase in the ml of NaOH spent, therefore increasing the acidity of the gluten-free bread. These results are in agreement with the pH presented by each sample. This data coincide with the study of Faten Dhawi on buffalo yogurt, where a slight increase in yogurt TTA was observed when Moringa oleifera was added to its composition [71].
According to the legislation on bread, RD 308/2019 [72] states that a bread with sourdough must have a pH value of less than 4.83. Therefore, the newly formulated breads would not be within the legislation. However, it is perhaps not possible to use this as a comparison as we used gluten-free sourdough bread, and there is currently no specific legislation for gluten-free bread.
The addition of moringa leaf significantly affected (p < 0.05) the lactic and acetic acid contents in the breads. This effect may be due to the high mineral content of Moringa oleifera [73], as it has been observed that a high mineral content increases the buffering capacity of the sourdough system, which increases lactic acid generation [74]. The breads containing sourdough showed higher lactic and acetic acid than the commercial bread. Lactic and acetic acids are the main metabolites of sourdough processes; lactic acid bacteria are part of the stable microbiota of mature sourdoughs [75].
Strong correlations for the following were found between the variables of total titratable acidity (TTA), acetic acid and lactic acid. A positive correlation was observed between lactic acid content and TTA (r = 0.552, p = 0.010) and between acetic acid content and TTA (r = 0.793, p < 0.001), indicating that an increase in the content of lactic acid and acetic acid increases the acidity of the bread.
3.3. Color
The colorimetric parameters (lightness coordinate (L*), redness coordinate (a*), yellowness coordinate (b*), saturation (C*), and tone (h*)) measured in the breads are reported in Table 4. The highest brightness value was observed in the COM bread (84.39 ± 1.49), due to its high starch and rice flour content [76]. A significantly lower value was observed for parameter a* in the COM bread.
The addition of moringa leaf affected the color parameters of the bread samples (Figure 1). With the inclusion of moringa leaf in the bread, a significant decrease (p < 0.05) was observed in the L* and h parameters; however, on the contrary, a significant increase was observed in the a* value of the breads enriched with moringa. In the C and b* values, no significant differences were found between samples, but it was observed that a slight decrease was obtained with the addition of moringa leaf. Similar results were obtained by Sardabi et al. [55], where the addition of moringa seed observed modifications in the L*, b*, and a* parameters of the bread compared with the controls. These results were also consistent with a study by Govender and Siwela [77], who found that as the amount of moringa leaf increased, the brightness decreased and the value of a* increased.
Generally, color changes in the bread formulated with moringa leaf depend on the presence of pigments in Moringa oleifera, particularly because of the high chlorophyll content (1.46 mg/g) [78]. In fact, the darkening observed when adding moringa leaf and using pseudocereals can be considered a positive point, as gluten-free breads are usually characterized by a poor color compared with breads that have gluten.
3.4. Antioxidant Activity
The total phenolic content (TPC) and antioxidant activity of the seven breads is summarized in Table 5. The TPC and antioxidant activity of the breads were significantly increased with the addition of moringa leaf. In fact, regarding TPCs, with the inclusion of moringa leaf, an increase of 64.54% was observed in the quinoa sourdough bread, an increase of 96.37% was observed in the amaranth sourdough bread, and an increase of 71.15% was observed in the brown rice sourdough bread. This same finding also coincides with Páramo-Calderón et al. [79], who observed that the inclusion of 1–3% moringa flour increased the amount of phenolic compounds in dry tortillas.
All six of the formulated gluten-free breads showed significantly (p < 0.05) higher TPC compared with the other commercially available bread. The control breads with sourdough were found to have a higher content of phenolic compounds than the commercial bread, mainly because the commercial bread was fermented with 16% sourdough and commercial yeast. According to Garzon et al. [80], sourdough improves the extraction of free phenols. In addition, because of the high content of phenolic compounds in pseudocereals, such as buckwheat, quinoa, and amaranth [80], the control breads and those with amaranth and quinoa sourdough moringa obtained higher levels of phenolic compounds. The moringa-enriched breads were much higher in TPC content, due to the high TPC content in the dried moringa leaf and the wide range of phenolic compounds it contains [35,81].
The antioxidant activity of the moringa-leaf-enriched, control, and commercial gluten-free bread was determined using ORAC, DPPH, ABTS, and FRAP methods. For all of the methods, in general it was observed that the antioxidant capacity was significantly low in commercial bread (1.34–436.25 µmol TE g-1) compared to formulated breads. With respect to the formulated bread, in all methods, a significant increase was observed with the inclusion of moringa leaves, standing out with greater antioxidant capacity in the AM bread (9.37–1235.52 µmol TE g-1). This high antioxidant capacity was due to the high antioxidant capacity of amaranth; in fact, it is one of the five pseudocereals with the greatest antioxidant potential [82,83]. This excellent antioxidant capacity of amaranth is due to the presence of phenolic acids, flavonoids, phytosterols, and squalene [84]. In the enriched breads, the antioxidant capacity increased by 27.56–53.6% in the quinoa sourdough bread, the amaranth sourdough bread showed an increase of 24.18–61.15% and the brown rice sourdough bread showed an increase of 7.13–64.97%. These increases in antioxidant activity were related to the increase in TPC. Moringa oleifera is a plant that, in addition to containing polyphenols such as phenolic compounds, β-carotene, ascorbic acid, chlorogenic acid, gallic acid, kaempferol, and quercetin glycosides [85,86,87], contains other compounds with antioxidant activities, such as carotenoids, vitamins C and E, and several micronutrients such as selenium and zinc [79].
From these data, it can be determined that the breads enriched with moringa, especially the AM bread, had the highest TPC content and antioxidant capacity, probably due to the high content of total moringa compounds, 32.90 mg GAE/g DW [35], and the variety of bioactive compounds contained in amaranth, such as p-hydroxybenzoic acid, rutin, vanillic, and gallic acids [61].
3.5. Sugars
Table 6 shows the amount of reducing sugars (fructose, glucose, and maltose) and sucrose in the breads. For glucose (0.78 g/100 g) and maltose (2.74 g/100 g), the highest content was observed in commercial bread (p < 0.05). However, for fructose, the highest content was found QM bread (0.15 g/100 g) and AM bread (0.15 g/100 g), and in sucrose it was found in the QM bread (2.56 g/100 g).
Among the breads with sourdough, higher contents of sucrose and fructose were found in the breads made with quinoa sourdough, followed by amaranth sourdough. This was mainly due to the high content of these sugars in the quinoa and amaranth pseudocereals [81,88]. In contrast, more glucose was observed in the breads with less sourdough compared with the COM bread, as a preliminary study showed that bread with sourdough reduced glucose as a result of natural fermentation and baking [89]; so, it could be used to prevent the onset of type 1 diabetes [90].
3.6. Minerals Content and Bioaccessabilty
The results of the minerals are shown in Table 7. No As, Be, Cd, Co, La, Li, Mo, Se, Tl, V, and Ti were found in the samples and no differences were seen between the samples regarding the amount of Al, Bi, and Cr.
In general, an increase in all minerals was observed with the addition of moringa leaves. This increase in minerals through the inclusion of moringa was also found by Govender and Siwela [77], where moringa was added to white and brown bread. In fact, this increase was even observed with the addition of moringa leaves in commercial baby foods [94].
High boron, calcium, and manganese contents were observed in the AM bread, with the lowest found in the Q bread (p < 0.05). This was mainly due to the high content of these minerals in moringa leaves and amaranth [95,96]. Boron was not detected in the COM bread. The highest content of these zinc and lead was found in the QM bread (7.24 mg/Kg; 0.11 mg/Kg) and the lowest content was found in the COM bread (0.01 mg/Kg; 3.70 mg/Kg; 0.05 mg/Kg). A higher amount of zinc was found in the formulated breads than in the commercial bread (COM); this may be due to the fact that moringa leaves and pseudocereals containing a significant high amount of zinc [28,91,97]. The QM bread had the highest content of the minerals potassium, sulfur, and sodium, because quinoa is a pseudocereal rich in potassium and moringa is rich in sodium [28,97,98]. However, the lowest iron and sulfur contents were observed in the BR bread, where, in addition to the low content in the BR bread, the same lower content was found in the A and Q breads. The lowest potassium content was found in the COM bread (0.31 g/100 g) and the lowest sodium content was found in the Q bread (0.27 g/100 g), compared with AM bread, which had the highest iron (7.54 mg/Kg) and magnesium content (0.04 g/100 g). This may be because is pseudocereal rich in iron and magnesium (6.36 mg/100 g; 237.39 mg/100 g) [28], and also because moringa leaves are also rich in iron and magnesium [91].
The minerals of greater interest in celiac patients are calcium and iron, as these are common deficiencies in this population [99]. In calcium, an increase of 26.67–41.38% was observed in the breads enriched with moringa leaves compared with the control breads, because moringa leaves contain a high calcium content (1.48 g/100 g) [35]. In iron, an increase of 3.83–96.87% was observed in moringa-enriched breads compared with the COM bread; and of 20.89–54.91% compared with the control breads compared to COM bread. This is mainly because iron is naturally found in moringa leaves (25.14 mg/100 g) [35], quinoa (3.28 mg/100 g), brown rice (0.46 mg/100 g), amaranth (6.36 mg/100 g), and buckwheat (2.26 mg/100 g) [28]. This finding was also found by Govender and Siwela [77], where they observed an increase in calcium and iron when moringa leaves were added to white bread, but the increase observed was much higher, with calcium increasing by 150–275% and iron by 16.92–154.62%.
The World Health Organization (WHO) recommends consuming 250 g of bread per person per day [100]. According to the AESAN, the nutritional intakes of calcium in adults in women and men range between 1000–1300 mg/day [101], taking into account that 250 g of bread should be consumed daily, with breads enriched with moringa leaf, 950–1150 mg/day would be obtained, which would provide a large part of the daily nutritional intake. Regarding iron, the daily nutritional intake in adults ranges between 9.1–18 mg/day [101], and as 250g/day of bread with bread enriched with moringa leaves would provide between 1.17–1.89 mg, it would not provide a significant amount of iron, but it would help with the daily nutritional intake of iron.
Based on these data and the data obtained, the bioaccessible fraction (in percentage) of each mineral was calculated and the results are shown in Figure 2. As can be seen, the most bioaccessible mineral was Ni, followed by K, Si, S, Mg, Ca, Pb, Sr, Na, Mn, Fe, Cu, B, and Zn. Significant differences were observed in the enriched breads and control breads compared with the COM bread for most minerals, except for Cu and Ni. In fact, the COM bread presented ~100% higher bioaccessibility for K and Si, ~90% for Mg, and ~70% in Pb compared with the rest of the reformulated breads. On the contrary, the enriched samples presented higher bioaccessibility (~100%) for Ni. This is due to the fact that moringa leaf contains high levels of phytic acid (0.00182 mg/100 g) and tannin (0.22 mg/100 g); both compounds have a strong chelating capacity, and are generally combined with calcium, zinc, magnesium, potassium, and other minerals to give rise to insoluble salts associated with protein molecules and leading to their precipitation [91], producing a reduction in mineral bioavailability. On the one hand, it was observed that the control breads with sourdough were more bioaccessible in minerals Ca, Fe, B, Na, Mn, S, Sr, and Zn, compared with the enriched and commercial breads; this is due to the fact that besides influencing the absorption of minerals, phytates and tannins also limit the absorption of minerals and dietary fiber [102], so it is consistent that the enriched with moringa leaf were less bioaccessible, as more dietary fiber was obtained in the enriched breads. In addition, higher bioavailability was also obtained mainly because sourdough decreases the level of phytate in the bread, due to the low pH level during fermentation, which stimulates the phytase of the pseudocereal grain and the phytase activity of lactic acid bacteria [103,104].
But, on the other hand, it was observed that among the control breads with sourdough, the bread with the least bioaccessibility was quinoa sourdough, followed by amaranth and, finally, brown rice; this is mainly due to the amount of phytates present in quinoa [97].
From these data, it can be determined that the control breads with sourdough, especially BR bread, obtained higher bioaccessibility of Fe and Ca minerals, which are important minerals in celiac patients due to their malabsorption [105]. The BR bread obtained greater bioaccessibility of these minerals mainly due to the low content of phytic acid, and it is also corroborated in Pedro’s study that brown rice has a bioavailability of 35.31–61.68% for iron [106].
3.7. Amino Acid Profile
Table 8 shows the amino acid (AA) composition of gluten-free breads. The most abundant amino acid in gluten-free breads was Glu, followed by Asp, Arg, Pro, Phe, Leu, Lys, Gly, Ser, Val, Thr, Ala, Hys, Ile, Tyr, Cys, Met, and Hyp. The control breads showed higher total, total essential, and non-essential amino acid contents (all amino acids are represented in Table 8), except for methionine, phenylalanine, cysteine, and hydroxyproline, which were found to have a higher content in the breads enriched with moringa leaf. The highest phenylalanine and hydroxyproline content was found in QM bread (543.54; 5.08 mg/100 g). This is mainly due to the fact that quinoa has a high phenylalanine content and moringa leaves also have a high phenylalanine content [107,108,109]. However, higher levels of methionine were found in the AM bread, due to the high methionine content in amaranth [110]. Regarding cysteine, a higher content was observed in BRM bread, which may be due to the fact that rice contains a significant amount of cysteine (1.43–7.43 mg/g) [111].
Commercial bread had lower values for all amino acids compared with the control breads, except for methionine (66.79 mg/100 g), phenylalanine (213.73 mg/100 g), cysteine (69.04 mg/100 g), and hydroxyproline (0.26 mg/100 g). These high values in the formulated breads were mainly due to the high content of amino acids in quinoa, buckwheat, and amaranth [112].
In general, it was observed that enriched breads decreased in their amino acid content with the addition of moringa leaf. In this sense, Hussin et al. [20] also found the same coincidence, where, when moringa was added to noodles, the content of most amino acids decreased. Moringa leaf is an important source of phenolic compounds [90] that, according to previous findings, could form clusters (crosslinks) with these amino acids to protect them against thiol loss and thus protein oxidation, which has already been demonstrated with tea catechins [113] and phenols from rosemary and oregano [114,115]. This theory could justify the reduction in amino acid content in breads enriched with moringa leaf. Even so, the enriched breads and control breads are a good alternative to include in the gluten-free diet for the intake of essential amino acids, as these must be incorporated into the body through dietary proteins as they are not synthesized by mammals [116].
3.8. Fatty Acids Profile
The fatty acid profiles are shown in Table 9. Overall, monounsaturated fatty acids accounted for 50% of the total fat content, while polyunsaturated fatty acids accounted for 30% and saturated fatty acids for 20%. Of the monounsaturated fatty acids in the samples, the most abundant were as follow: palmitoleic acid was found in the range of 3.57–30.49 mg/100 g (COM and BR), elaidic acid in the range of 0–1.68 mg/100 g (A, BR, Q, and AM), oleic acid (C18:1n-9) in the range of 909.10–2045.27mg/100 g (COM and BR), cis-11-eicosenoic acid in a range of 6.18–18.10 mg/100 g (COM and Q) and erucic acid in a range of 1.55–6.90 mg/100 g (BR and QM).
Regarding polyunsaturated fatty acids (PUFAS) linoleic acid was the greatest at 94%, followed by α-linolenic acid at 4.5%, cis-9, trans-11-linoleic acid at 0.4%, and cis-11,14-eicosadienoic acid at 0.16%.
In this regard, in Table 9, the main fatty acids found in the gluten-free breads were linoleic (C18:2n-6), palmitic (C16:0), stearic (C18:0), oleic (C18:1n-9), and α-linolenic (C18:3n-3). Oleic acid was the highest, representing 48% of the total fatty acids. As previously mentioned, other minority compounds were identified and quantified, and the values obtained are shown in Table 9. In this regard, after the majority compounds, the reformulated gluten-free breads were also sources of cis-11-vaccenic acid (C18:1n-7), palmitoleic acid (C16:1n-7), cis-11-eicosenoic acid (C20:1n-9), behenic acid (C22:0), erucic acid (C22:1n-9), lignoceric acid (C24:0), and arachidic acid (C20:0). The remaining compounds were found in lower amounts (<10 mg per 100 g of gluten-free bread).
In the breads enriched with moringa leaf, a decrease in the following fatty acids was observed: myristic acid, palmitic acid, palmitoleic acid, stearic acid, trans-11-vaccenic acid, oleic acid, cis-11-vaccenic acid, linoleic acid, α-linolenic acid, arachidic acid, cis-11-eicosenoic acid, cis-11,14-eicosadienoic acid, heneicosanoic acid, behenic acid, tricosanoic acid, and lignoceric acid. This can be justified by the action of moringa and its components to metabolize fat. However, butyric acid, caproic acid, caprylic acid, capric acid, capric acid, lauric acid, pentadecanoic acid, heptadecanoic acid, elaidic acid, rumenic acid, cis-9, trans-11-linoleic acid, cis-11,14,17-eicosatrienoic acid, Erucic acid, cis-13,16-docosadienoic acid, and cis-4,7,10,13,16,19-docosahexaenoic acid showed an increase when moringa leaf was added. This was due to the high content of these fatty acids in moringa leaf [91,117].
Although the literature on this subject is scarce, similar bakery products have obtained comparable results. For example, α-linolenic, oleic, myristic, and palmitic were also the main fatty acids found in muffins enriched with moringa leaf flour in different concentrations [118]. This finding was also verified by Paramo- Calderón et al. [79], where they made tortillas enriched with moringa and found that their samples contained mostly oleic, palmitic and linoleic fatty acids authors using moringa-enriched tortillas showed similar findings with the main fatty acids being oleic, palmitic, and linoleic.
Regarding the differences found between the samples, it should be noted that with the inclusion of the moringa leaf, fatty acids decreased, but in some monounsaturated and polyunsaturated fatty acids, such as elaidic acid (9t-C18: 1), cis-9, trans-11-linoleic acid (9c,11t-C18:2 (CLA)), Cis-11,14,17-eicosatrienoic acid (C20: 3n-3), Erucic acid (C22: 1n-9), Cis-13,16-docosadienoic acid (C22:2n-6), and Cis-4,7,10,13,16,19-docosahexaenoic acid (C22:6n-3), an increase was observed with the addition of moringa leaf to gluten-free bread, highlighting AM and QM bread.
Taking into account the results obtained, the formulated bread compared could be a good source of fatty acids to commercial bread, especially the monounsaturated fatty acids and n-3 acids highlighting in the BR bread. There are other benefits, as monounsaturated and n-3 fatty acids are involved in the prevention of cardiovascular disease because they reduce blood cholesterol levels [119].
3.9. Folate Content
Table 10 shows the concentration of each of the four folate monoglutamates, as well as the total folate content and the content of 5-formyl-5,6,7,7,8-tetrahydrofolic acid (5FTHF), 5,6,7,8-tetrahydrofolic acid (THF), 5-methyl-5,6,7,8-tetrahydrofolic acid (5MTHF), and folic acid (FA) in the six gluten-free breads developed and one commercial gluten-free bread. In general, an increase in all folate monoglutamates was observed with moringa leaf fortification. This finding coincides with the confirmation of M. yang et al. [90], who reported that moringa leaf in bakery products increased the concentration of folic acid in cookies and bread. The total folate concentration was the highest in the AM bread (4443.58 µg folic acid equivalents/100 g FW), followed by the BRM (3804.42 µg folic acid equivalents/100 g FW), A (2952.50 µg folic acid equivalents/100 g FW), BR (2144. 76 µg folic acid equivalents/100 g FW), QM (1395.86 µg folic acid equivalents/100 g FW), and COM breads (639.96 µg folic acid equivalents/100 g FW), with significant differences of p < 0.01. Regarding the 5M-THF (5-methyltetrahydrofolate) content, significant differences of p < 0.01 were observed between the different breads, except for the QM bread compared to the Q bread. Regarding the tetrahydrofolate (THF) content, significant differences (p < 0.01) were also found among the different breads, except for the QM bread with BRM and A. Regarding the folic acid (FA) compound, significant differences of p < 0.01 were observed, except in the Q bread compared to the BR and COM bread. For the 5F-THF (5-formyltetrahydrofolate) content, significant differences were observed among all the samples; in fact, the BRM bread was found to have the highest content and the COM bread the lowest.
The main form of natural folate found to be most abundant in all of our formulated samples was 5M-THF. The main form of natural folate found to be most abundant in all of our formulated samples was 5M-THF, which is in agreement with the results of studies that recognize 5M-THF as the predominant form of folate in pseudocereals (quinoa, amaranth, and buckwheat) [120] and legumes (chickpea) [121]. According to the study by Peñalver et al. [35], the most predominant natural form of Moringa oleifera is THF, which may be why an increase in enriched breads was observed, as this natural form of folate does not stand out in food products [122].
According to the market consulting firm Mintel, Spain ranks third as the country in the world that sells the most gluten-free products to the market [123]. In addition, the food consumption report reported that Spain increased its consumption of gluten-free products by 3.08% in 2020, and reported that the Spanish population consumed 8.5g per day of gluten-free bread [124]. Considering these data, the consumption of the study bread could achieve 30–80% (QM bread; AM bread) RDI of folate (400 µg). Brevik et al. [125] reported that bread is one of the foods that contributes most to total folate intake, even more than other folate-containing foods such as vegetables and fruits.
The levels of the four folate monoglutamates were affected by the inclusion of moringa leaf to the bread, as a significant increase of these was observed, highlighting BRM bread by the amount of FA and 5F-THF and AM bread by the value of THF and 5M-TFH. From a nutritional point of view, BRM bread would be a great contribution to the celiac patient diet, as this diet is poor in folic acid [1].
3.10. Sensory Analysis
In the sensory analysis, different parameters for the organoleptic quality of each gluten-free bread were evaluated and tasters were asked to rank the samples from highest to lowest according to their taste preference. A total of 35 people participated in the analysis; 61% were women and 39% were men. The age of the participants ranged from 18–59. Furthermore, 90.3% of participants indicated that they liked the bread in the sensory analysis, with 60.9% preferring the “village bread” variety as opposed to the industrial variety frequently sold in supermarkets. In addition, 78.3% reported eating bread every day, while 13.0% reported eating bread 4–5 times a week and 8.7% 1–2 times a week. Regarding the habitual consumption of gluten-free products, 56.5% of volunteers reported having tried a gluten-free product even though they did not usually consume them, while the rest of the tasters had never tried a gluten-free product.
The samples obtained the following order of preference from the participants: COM < A < BR < AM < QM < BRM < Q as can be seen in Figure 3A, which shows higher significant preference by participants for the Q bread obtained and the COM bread shows lower significant preference by participants. In terms of purchase intention, bread A scored significantly higher in purchase intention and BRM bread scored the lowest. Therefore, if introduced in the market, it is possible that the formulated breads would not be rejected, even though the color would be much darker than the current common gluten-free breads on the market.
In the sensory evaluation, the A bread stood out, which obtained the best qualification in appearance, flavor, color, and acceptability. However, for the attributes of aroma and texture, the QM bread obtained the highest score, as can be seen in the Figure 3B. The BRM bread stood out for its low scores in aroma (2.61), taste (2.52), and overall acceptability (2.48). These values may be due to the attributes of moringa, as brown rice is a milder cereal than the pseudocereals amaranth and quinoa, which camouflage the strong attributes of moringa, because reformulation of foods could be responsible of changes in sensory attributes [126,127,128,129].
In general, the breads enriched with moringa leaf were not accepted by the panelists, except for the aroma, appearance and texture of the QM bread. The color, taste and acceptance, higher values were found in the control breads, particularly the A bread.
4. Conclusions
Gluten-free bread is one of the basic products for celiac patients or people who follow a gluten-free diet. A functional and attractive bread can be obtained through the use of pseudocereal (amaranth, quinoa, and buckwheat), chickpea flour, and psyllium, with the addition of moringa leaf. Bread fortified with moringa leaf obtained the highest protein content (source of protein according to Regulation (EC) No. 1924/2006), total dietary fiber (high in fiber according to Regulation (EC) No. 1924/2006), insoluble fiber, soluble fiber, minerals, antioxidant capacity, phenolic compounds, folate content, sugar, amino acids (methionine, phenylalanine, hydroxyproline, and cysteine), and fatty acids (docosahexaenoic acid). However, considering the bioavailability of minerals (Fe, Ca, Mn, Zn, Sr, S, and B), the control breads with sourdough stood out for higher bioaccessibility of minerals. The redder and darker shades of the moringa leaf reveal encouraging results regarding the aroma and texture, but not for the acceptability of the consumers, who preferred the sensory attributes that the pseudocereal contributed to the bread without moringa.
In conclusion, our study demonstrates the significant potential for utilizing bread, a fundamental dietary staple, as a means to contribute to the reduction in some nutrient deficiencies specific to gluten-free bread. In pursuit of these objectives, our research successfully integrates moringa into gluten-free bread, resulting in a noteworthy increase in its nutritional richness, particularly regarding protein, amino acids, and essential minerals. Moreover, the incorporation of moringa heightens its capacity to contribute to improved health by augmenting the levels of soluble dietary fiber. Our findings are the first to document Moringa oleifera’s incorporation of this health-beneficial soluble fiber into gluten-free bread.
To the best of our knowledge, this is the first report of a gluten-free sourdough bread with a pseudocereal formulation containing moringa, a formulation that a tasters’ panel found to be acceptable; that meets the requirements to be labelled as a functional food (source of protein and high fiber) product; and that incorporates an unconventional crop that promotes health benefits, is resistant to drought and highly productive.
Author Contributions
Conceptualization, writing—original draft preparation, review and editing, G.N. and R.P.; writing—original draft preparation, G.N., R.P., and G.R.; supervision, G.N. All authors have read and agreed to the published version of the manuscript.
Funding
This research received no external funding.
Data Availability Statement
The datasets generated for this study are available on request to the corresponding author.
Conflicts of Interest
The authors declare no conflict of interest.
References
- Vici, G.; Belli, L.; Biondi, M.; Polzonetti, V. Gluten free diet and nutrient deficiencies: A review. Clin. Nutr. 2016, 35, 1236–1241. [Google Scholar] [CrossRef]
- Alvarez-Jubete, L.; Arendt, E.K.; Gallagher, E. Nutritive value of pseudocereals and their increasing use as functional gluten-free ingredients. Trends Food Sci. Technol. 2010, 21, 106–113. [Google Scholar] [CrossRef]
- Masure, H.G.; Fierens, E.; Delcour, J.A. Current and forward looking experimental approaches in gluten-free bread making research. J. Cereal Sci. 2016, 67, 92–111. [Google Scholar] [CrossRef]
- Lebwohl, B.; Sanders, D.S.; Green, P.H.R. Coeliac disease. Lancet 2018, 391, 70–81. [Google Scholar] [CrossRef]
- Kale, R.; Deshmukh, R. Gluten-free Products Market Size & Growth by 2027. Available online: https://www.alliedmarketresearch.com/gluten-free-products-market (accessed on 19 August 2023).
- Santos, F.G.; Aguiar, E.V.; Capriles, V.D. Analysis of ingredient and nutritional labeling of commercially available gluten-free bread in Brazil. Int. J. Food Sci. Nutr. 2019, 70, 562–569. [Google Scholar] [CrossRef]
- Alencar, N.M.M.; de Araújo, V.A.; Faggian, L.; da Silveira Araújo, M.B.; Capriles, V.D. What about gluten-free products? An insight on celiac consumers’ opinions and expectations. J. Sens. Stud. 2021, 36, e12664. [Google Scholar] [CrossRef]
- Gallagher, E.; Gormley, T.R.; Arendt, E.K. Recent advances in the formulation of gluten-free cereal-based products. Trends Food Sci. Technol. 2004, 15, 143–152. [Google Scholar] [CrossRef]
- Aguiar, E.V.; Santos, F.G.; Krupa-Kozak, U.; Capriles, V.D. Nutritional facts regarding commercially available gluten-free bread worldwide: Recent advances and future challenges. Crit. Rev. Food Sci. Nutr. 2021, 63, 693–705. [Google Scholar] [CrossRef]
- Drub, T.F.; Garcia dos Santos, F.; Ladeia Solera Centeno, A.C.; Capriles, V.D. Sorghum, millet and pseudocereals as ingredients for gluten-free whole-grain yeast rolls. Int. J. Gastron. Food Sci. 2021, 23, 100293. [Google Scholar] [CrossRef]
- Alvarez-Jubete, L.; Wijngaard, H.; Arendt, E.K.; Gallagher, E. Polyphenol composition and in vitro antioxidant activity of amaranth, quinoa buckwheat and wheat as affected by sprouting and baking. Food Chem. 2010, 119, 770–778. [Google Scholar] [CrossRef]
- Yaver, E.; Bilgiçli, N. Pseudocereals: Composition, effect on nutrition-health and usage in cereal products. Food Health 2020, 6, 41–56. [Google Scholar] [CrossRef]
- Kupper, C. Dietary guidelines and implementation for celiac disease. Gastroenterology 2005, 128, S121–S127. [Google Scholar] [CrossRef] [PubMed]
- Rosell, C.M.; Bajerska, J.; El Sheikha, A.F. Bread and Its Fortifiication: Nutrition and Health Benefiits; CRC Press: Boca Raton, FL, USA, 2015; ISBN 9781498701570. [Google Scholar]
- Singh, B.; Singh, J.P.; Kaur, A.; Singh, N. Phenolic composition and antioxidant potential of grain legume seeds: A review. Food Res. Int. 2017, 101, 1–16. [Google Scholar] [CrossRef]
- Santos, F.G.; Aguiar, E.V.; Rosell, C.M.; Capriles, V.D. Potential of chickpea and psyllium in gluten-free breadmaking: Assessing bread’s quality, sensory acceptability, and glycemic and satiety indexes. Food Hydrocoll. 2021, 113, 106487. [Google Scholar] [CrossRef]
- Oyeyinka, A.T.; Oyeyinka, S.A. Moringa oleifera as a food fortificant: Recent trends and prospects. J. Saudi Soc. Agric. Sci. 2018, 17, 127–136. [Google Scholar] [CrossRef]
- Anwar, F.; Latif, S.; Ashraf, M.; Gilani, A.H. Moringa oleifera: A food plant with multiple medicinal uses. Phytother. Res. 2007, 21, 17–25. [Google Scholar] [CrossRef]
- Hekmat, S.; Morgan, K.; Soltani, M.; Gough, R. Sensory evaluation of locally-grown fruit purees and inulin fibre on probiotic yogurt in Mwanza, Tanzania and the microbial analysis of probiotic yogurt fortified with Moringa oleifera. J. Health Popul. Nutr. 2015, 33, 60–67. [Google Scholar]
- Hussin, H.; Gregory, P.J.; Julkifle, A.L.; Sethuraman, G.; Tan, X.L.; Razi, F.; Azam-Ali, S.N. Enhancing the Nutritional Profile of Noodles With Bambara Groundnut (Vigna subterranea) and Moringa (Moringa oleifera): A Food System Approach. Front. Sustain. Food Syst. 2020, 4, 59. [Google Scholar] [CrossRef]
- Hernandez-Aguilar, C.; Dominguez-Pacheco, A.; Valderrama-Bravo, C.; Cruz-Orea, A.; Martínez Ortiz, E.; Ivanov, R.; Ordonez-Miranda, J. Photoacoustic characterization of wheat bread mixed with Moringa oleifera. Curr. Res. Food Sci. 2021, 4, 521–531. [Google Scholar] [CrossRef]
- Di Nardo, G.; Villa, M.P.; Conti, L.; Ranucci, G.; Pacchiarotti, C.; Principessa, L.; Raucci, U.; Parisi, P. Nutritional deficiencies in children with celiac disease resulting from a gluten-free diet: A systematic review. Nutrients 2019, 11, 1588. [Google Scholar] [CrossRef] [PubMed]
- Jivraj, A.; Hutchinson, J.M.; Ching, E.; Marwaha, A.; Verdu, E.F.; Armstrong, D.; Pinto-Sanchez, M.I. Micronutrient deficiencies are frequent in adult patients with and without celiac disease on a gluten-free diet, regardless of duration and adherence to the diet. Nutrition 2022, 103–104, 111809. [Google Scholar] [CrossRef] [PubMed]
- Sengev, A.I.; Abu, J.O.; Gernah, D.I. Effect of Moringa oleifera Leaf Powder Supplementation on Some Quality Characteristics of Wheat Bread. Food Nutr. Sci. 2013, 4, 270–275. [Google Scholar] [CrossRef]
- Bourekoua, H.; Różyło, R.; Gawlik-Dziki, U.; Benatallah, L.; Zidoune, M.N.; Dziki, D. Evaluation of physical, sensorial, and antioxidant properties of gluten-free bread enriched with Moringa oleifera leaf powder. Eur. Food Res. Technol. 2018, 244, 189–195. [Google Scholar] [CrossRef]
- FAO (Food and Agriculture Organization of the United Nations); Organisation des Nations Unies pour l’alimentation et l’Agriculture (FAO); International Network of Food Data Systems (INFOODS); (INFOODS), R. International de systèmes de données sur les aliments. In WAFCT 2019: FAO/INFOODS Food Composition Table for Western Africa (2019)—Table de Composition des Aliments FAO/INFOODS Pour l’Afrique de l’Ouest (2019); FAO: Rome, Italy, 2020; ISBN 9789251322239. [Google Scholar]
- Novotni, D.; Gänzle, M.; Rocha, J.M. Composition and activity of microbiota in sourdough and their effect on bread quality and safety. In Trends in Wheat and Bread Making; Academic Press: Cambridge, MA, USA, 2020; pp. 129–172. ISBN 9780128210482. [Google Scholar]
- Yeşil, S.; Levent, H. The influence of fermented buckwheat, quinoa and amaranth flour on gluten-free bread quality. LWT 2022, 160, 113301. [Google Scholar] [CrossRef]
- Nionelli, L.; Rizzello, C.G. Sourdough-based biotechnologies for the production of gluten-free foods. Foods 2016, 5, 65. [Google Scholar] [CrossRef]
- Taetzsch, A.; Das, S.K.; Brown, C.; Krauss, A.; Silver, R.E.; Roberts, S.B. Are gluten-free diets more nutritious? An evaluation of self-selected and recommended gluten-free and gluten-containing dietary patterns. Nutrients 2018, 10, 1881. [Google Scholar] [CrossRef]
- Melini, F.; Melini, V.; Luziatelli, F.; Ruzzi, M. Current and Forward-Looking Approaches to Technological and Nutritional Improvements of Gluten-Free Bread with Legume Flours: A Critical Review. Compr. Rev. Food Sci. Food Saf. 2017, 16, 1101–1122. [Google Scholar] [CrossRef]
- Pandey, S. Nutritional Aspects and Health Implications of Gluten-Free Products. In Challenges and Potential Solutions in Gluten Free Product Development; Food Engineering Series; Springer: Cham, Switzerland, 2022; pp. 17–34. [Google Scholar]
- Cappa, C.; Lucisano, M.; Mariotti, M. Influence of Psyllium, sugar beet fibre and water on gluten-free dough properties and bread quality. Carbohydr. Polym. 2013, 98, 1657–1666. [Google Scholar] [CrossRef]
- Mariotti, M.; Lucisano, M.; Ambrogina Pagani, M.; Ng, P.K.W. The role of corn starch, amaranth flour, pea isolate, and Psyllium flour on the rheological properties and the ultrastructure of gluten-free doughs. Food Res. Int. 2009, 42, 963–975. [Google Scholar] [CrossRef]
- Peñalver, R.; Martínez-Zamora, L.; Lorenzo, J.M.; Ros, G.; Nieto, G. Nutritional and Antioxidant Properties of Moringa oleifera Leaves in Functional Foods. Foods 2022, 11, 1107. [Google Scholar] [CrossRef] [PubMed]
- Tomić, J.; Dapčević-Hadnađev, T.; Škrobot, D.; Maravić, N.; Popović, N.; Stevanović, D.; Hadnađev, M. Spontaneously fermented ancient wheat sourdoughs in breadmaking: Impact of flour quality on sourdough and bread physico-chemical properties. LWT 2023, 175, 114482. [Google Scholar] [CrossRef]
- De Carrasco, R.R.; Zelada, C.R.E. Determinación de la capacidad antioxidante y compuestos fenólicos de cereales andinos: Quinua (Chenopodium quinoa), KAÑIWA (Chenopodium pallidicaule) y KIWICHA (Amaranthus caudatus). Rev. Soc. Química Perú 2008, 74, 85–99. [Google Scholar]
- Brand-Williams, W.; Cuvelier, M.E.; Berset, C. Use of a free radical method to evaluate antioxidant activity. LWT—Food Sci. Technol. 1995, 28, 25–30. [Google Scholar] [CrossRef]
- Sánchez-Moreno, C.; Larrauri, J.A.; Saura-Calixto, F. A procedure to measure the antiradical efficiency of polyphenols. J. Sci. Food Agric. 1998, 76, 270–276. [Google Scholar] [CrossRef]
- Re, R.; Pellegrini, N.; Proteggente, A.; Pannala, A.; Yang, M.; Rice-Evans, C. Antioxidant activity applying an improved ABTS radical cation decolorization assay. Free Radic. Biol. Med. 1999, 26, 1231–1237. [Google Scholar] [CrossRef]
- Benzie, I.F.F.; Strain, J.J. Ferric reducing/antioxidant power assay: Direct measure of total antioxidant activity of biological fluids and modified version for simultaneous measurement of total antioxidant power and ascorbic acid concentration. Methods Enzymol. 1999, 299, 15–27. [Google Scholar] [CrossRef]
- Prior, R.L.; Hoang, H.; Gu, L.; Wu, X.; Bacchiocca, M.; Howard, L.; Hampsch-Woodill, M.; Huang, D.; Ou, B.; Jacob, R. Assays for hydrophilic and lipophilic antioxidant capacity (oxygen radical absorbance capacity (ORACFL)) of plasma and other biological and food samples. J. Agric. Food Chem. 2003, 51, 3273–3279. [Google Scholar] [CrossRef]
- Singleton, V.L.; Rossi, J.A.J. Colorimetry to total phenolics with phosphomolybdic acid reagents. Am. J. Enol. Vinic. 1965, 16, 144–158. [Google Scholar] [CrossRef]
- Minekus, M.; Alminger, M.; Alvito, P.; Ballance, S.; Bohn, T.; Bourlieu, C.; Carrière, F.; Boutrou, R.; Corredig, M.; Dupont, D.; et al. A standardised static in vitro digestion method suitable for food-an international consensus. Food Funct. 2014, 5, 1113–1124. [Google Scholar] [CrossRef]
- EPA, U.S. Method 3051A (SW-846): Microwave Assisted Acid Digestion of Sediments, Sludges, and Oils, Revision 1; EPA: Washington, DC, USA, 2007. [Google Scholar]
- Shahidi, F.; Synowiecki, J. Nutrient composition of mechanically separated and surimi-like seal meat. Food Chem. 1993, 47, 41–46. [Google Scholar] [CrossRef]
- Domínguez, R.; Borrajo, P.; Lorenzo, J.M. The effect of cooking methods on nutritional value of foal meat. J. Food Compos. Anal. 2015, 43, 61–67. [Google Scholar] [CrossRef]
- Konings, E.J.M. A validated liquid chromatographic method for determining folates in vegetables, milk powder, liver, and flour. J. AOAC Int. 1999, 82, 119–127. [Google Scholar] [CrossRef]
- Pfeiffer, C.M.; Rogers, L.M.; Gregory, J.F. Determination of Folate in Cereal-Grain Food Products Using Trienzyme Extraction and Combined Affinity and Reversed-Phase Liquid Chromatography. J. Agric. Food Chem. 1997, 45, 407–413. [Google Scholar] [CrossRef]
- Vahteristo, L.T.; Ollilainen, V.; Koivistoinen, P.E.; Varo, P. Improvements in the analysis of reduced folate monoglutamates and folic acid in food by high-performance liquid chromatography. J. Agric. Food Chem. 1996, 44, 477–482. [Google Scholar] [CrossRef]
- Gregory, J.F.; Sartain, D.B.; Day, B.P.F. Fluorometric determination of folacin in biological materials using high performance liquid chromatography. J. Nutr. 1984, 114, 341–353. [Google Scholar] [CrossRef]
- López-Nicolás, R.; Frontela-Saseta, C.; González-Abellán, R.; Barado-Piqueras, A.; Perez-Conesa, D.; Ros-Berruezo, G. Folate fortification of white and whole-grain bread by adding Swiss chard and spinach. Acceptability by consumers. LWT—Food Sci. Technol. 2014, 59, 263–269. [Google Scholar] [CrossRef]
- ISO-8586 BSI; Standards Publication Sensory Analysis—General Guidelines for the Selection, Training and Monitoring of Selected Assessors and Expert Sensory Assessors. ISO: Geneva, Switzerland, 2014.
- Aly, A.A.; Zaky, E.A.; Khatab, N.R.; Hameed, A.M.; Kadasah, S. The Biological and Chemical Ameliorative Effects of Bread Substituted with Dried Moringa Leaves. Arab. J. Chem. 2022, 15, 103875. [Google Scholar] [CrossRef]
- Sardabi, F.; Azizi, M.H.; Gavlighi, H.A.; Rashidinejad, A. The effect of Moringa peregrina seed husk on the in vitro starch digestibility, microstructure, and quality of white wheat bread. LWT 2021, 136, 110332. [Google Scholar] [CrossRef]
- Thakur, P.; Kumar, K.; Dhaliwal, H.S. Nutritional facts, bio-active components and processing aspects of pseudocereals: A comprehensive review. Food Biosci. 2021, 42, 101170. [Google Scholar] [CrossRef]
- Isitua, C.C.; Jose, M.; Lozano, S.-M.; Jaramillo, C.J.; Dutan, F. Phytochemical and nutritional properties of dried leaf powder of Moringa oleifera Lam. from machala el oro province of ecuador. Pelagia Res. Libr. Asian J. Plant Sci. Res. 2015, 5, 8–16. [Google Scholar]
- Simopoulos, A.P. An increase in the Omega-6/Omega-3 fatty acid ratio increases the risk for obesity. Nutrients 2016, 8, 128. [Google Scholar] [CrossRef] [PubMed]
- Oluduro, A.O. Evaluation of antimicrobial properties and nutritional potentials of Moringa oleifera Lam. leaf in South-Western Nigeria. Malays. J. Microbiol. 2012, 8, 59–67. [Google Scholar]
- Mutayoba, S.K.; Dierenfeld, E.; Mercedes, V.A.; Frances, Y.; Knight, C.D. Determination of chemical composition and ant-nutritive components for tanzanian locally available poultry feed ingredients. Int. J. Poult. Sci. 2011, 10, 350–357. [Google Scholar] [CrossRef]
- Jan, N.; Hussain, S.Z.; Naseer, B.; Bhat, T.A. Amaranth and quinoa as potential nutraceuticals: A review of anti-nutritional factors, health benefits and their applications in food, medicinal and cosmetic sectors. Food Chem. X 2023, 18, 100687. [Google Scholar] [CrossRef]
- Kulathunga, J.; Whitney, K.; Simsek, S. Impact of starter culture on biochemical properties of sourdough bread related to composition and macronutrient digestibility. Food Biosci. 2023, 53, 102640. [Google Scholar] [CrossRef]
- Roman, L.; Belorio, M.; Gomez, M. Gluten-Free Breads: The Gap Between Research and Commercial Reality. Compr. Rev. Food Sci. Food Saf. 2019, 18, 690–702. [Google Scholar] [CrossRef]
- Srichuwong, S.; Curti, D.; Austin, S.; King, R.; Lamothe, L.; Gloria-Hernandez, H. Physicochemical properties and starch digestibility of whole grain sorghums, millet, quinoa and amaranth flours, as affected by starch and non-starch constituents. Food Chem. 2017, 233, 1–10. [Google Scholar] [CrossRef]
- Yan, X.; Liu, C.; Huang, A.; Chen, R.; Chen, J.; Luo, S. The nutritional components and physicochemical properties of brown rice flour ground by a novel low temperature impact mill. J. Cereal Sci. 2020, 92, 102927. [Google Scholar] [CrossRef]
- Nudel, A.; Cohen, R.; Abbo, S.; Kerem, Z. Developing a nutrient-rich and functional wheat bread by incorporating Moringa oleifera leaf powder and gluten. LWT 2023, 187, 115343. [Google Scholar] [CrossRef]
- Ajibola, C.; Oyerinde, V.; Adeniyan, O. Physicochemical and Antioxidant Properties of Whole-Wheat Biscuits Incorporated with Moringa oleifera Leaves and Cocoa Powder. J. Sci. Res. Reports 2015, 7, 195–206. [Google Scholar] [CrossRef] [PubMed]
- Acín Albiac, M.; Di Cagno, R.; Filannino, P.; Cantatore, V.; Gobbetti, M. How fructophilic lactic acid bacteria may reduce the FODMAPs content in wheat-derived baked goods: A proof of concept. Microb. Cell Fact. 2020, 19, 182. [Google Scholar] [CrossRef] [PubMed]
- Nyyssölä, A.; Ellilä, S.; Nordlund, E.; Poutanen, K. Reduction of FODMAP content by bioprocessing. Trends Food Sci. Technol. 2020, 99, 257–272. [Google Scholar] [CrossRef]
- Gaviña, G.; Sanar y Adelgazar con la Dieta Alcalina. Tabla ph de Alimentos. 2013. Available online: https://es.scribd.com/document/469694870/Dieta-Alcalina-Tabla-del-pH-de-los-Alimentos-Gabriel-Gavina-1 (accessed on 19 August 2023).
- Dhawi, F.; El-Beltagi, H.S.; Aly, E.; Hamed, A.M. Antioxidant, antibacterial activities and mineral content of buffalo yoghurt fortified with fenugreek and Moringa oleifera seed flours. Foods 2020, 9, 1157. [Google Scholar] [CrossRef]
- Ministerio de la Presidencia, R. con las C. e I. Real Decreto 308/2019, de 26 de Abril, por el que se Aprueba la Norma de Calidad Para el Pan; Boletín Oficial del Estado: Madrid, Spain, 2019; Volume 113. [Google Scholar]
- Milla, P.G.; Peñalver, R.; Nieto, G. Health Benefits of Uses and Applications of Moringa Oleifera in Bakery Products. Plants 2021, 10, 318. [Google Scholar] [CrossRef]
- Gänzle, M.G.; Ehmann, M.; Hammes, W.P. Modeling of growth of Lactobacillus sanfranciscensis and Candida milleri in response to process parameters of sourdough fermentation. Appl. Environ. Microbiol. 1998, 64, 2616–2623. [Google Scholar] [CrossRef]
- Gobbetti, M.; Rizzello, C.G.; Di Cagno, R.; De Angelis, M. How the sourdough may affect the functional features of leavened baked goods. Food Microbiol. 2014, 37, 30–40. [Google Scholar] [CrossRef]
- Wronkowska, M.; Haros, M.; Soral-Śmietana, M. Effect of Starch Substitution by Buckwheat Flour on Gluten-Free Bread Quality. Food Bioprocess Technol. 2013, 6, 1820–1827. [Google Scholar] [CrossRef]
- Govender, L.; Siwela, M. The effect of Moringa oleifera leaf powder on the physical quality, nutritional composition and consumer acceptability of white and brown breads. Foods 2020, 9, 1910. [Google Scholar] [CrossRef]
- Gharsallah, K.; Rezig, L.; Rajoka, M.S.R.; Mehwish, H.M.; Ali, M.A.; Chew, S.C. Moringa oleifera: Processing, phytochemical composition, and industrial application. S. African J. Bot. 2023, 160, 180–193. [Google Scholar] [CrossRef]
- Páramo-Calderón, D.E.; Aparicio-Saguilán, A.; Aguirre-Cruz, A.; Carrillo-Ahumada, J.; Hernández-Uribe, J.P.; Acevedo-Tello, S.; Torruco-Uco, J.G. Tortilla added with Moringa oleífera flour: Physicochemical, texture properties and antioxidant capacity. LWT 2019, 100, 409–415. [Google Scholar] [CrossRef]
- Garzon, R.; Skendi, A.; Antonio Lazo-Velez, M.; Papageorgiou, M.; Rosell, C.M. Interaction of dough acidity and microalga level on bread quality and antioxidant properties. Food Chem. 2021, 344, 128710. [Google Scholar] [CrossRef] [PubMed]
- Nouman, W.; Anwar, F.; Gull, T.; Newton, A.; Rosa, E.; Domínguez-Perles, R. Profiling of polyphenolics, nutrients and antioxidant potential of germplasm’s leaves from seven cultivars of Moringa oleifera Lam. Ind. Crops Prod. 2016, 83, 166–176. [Google Scholar] [CrossRef]
- Estivi, L.; Pellegrino, L.; Hogenboom, J.A.; Brandolini, A.; Hidalgo, A. Antioxidants of Amaranth, Quinoa and Buckwheat Wholemeals and Heat-Damage Development in Pseudocereal-Enriched Einkorn Water Biscuits. Molecules 2022, 27, 7541. [Google Scholar] [CrossRef]
- Martinez-Lopez, A.; Millan-Linares, M.C.; Rodriguez-Martin, N.M.; Millan, F.; Montserrat-de la Paz, S. Nutraceutical value of kiwicha (Amaranthus caudatus L.). J. Funct. Foods 2020, 65, 103735. [Google Scholar] [CrossRef]
- Park, S.J.; Sharma, A.; Lee, H.J. A review of recent studies on the antioxidant activities of a third-millennium food: Amaranthus spp. Antioxidants 2020, 9, 1236. [Google Scholar] [CrossRef]
- Rodríguez-Pérez, C.; Quirantes-Piné, R.; Fernández-Gutiérrez, A.; Segura-Carretero, A. Optimization of extraction method to obtain a phenolic compounds-rich extract from Moringa oleifera Lam leaves. Ind. Crop. Prod. 2015, 66, 246–254. [Google Scholar] [CrossRef]
- Vázquez-León, L.A.; Páramo-Calderón, D.E.; Robles-Olvera, V.J.; Valdés-Rodríguez, O.A.; Pérez-Vázquez, A.; García-Alvarado, M.A.; Rodríguez-Jimenes, G.C. Variation in bioactive compounds and antiradical activity of Moringa oleifera leaves: Influence of climatic factors, tree age, and soil parameters. Eur. Food Res. Technol. 2017, 243, 1593–1608. [Google Scholar] [CrossRef]
- Verma, A.R.; Vijayakumar, M.; Mathela, C.S.; Rao, C.V. In vitro and in vivo antioxidant properties of different fractions of Moringa oleifera leaves. Food Chem. Toxicol. 2009, 47, 2196–2201. [Google Scholar] [CrossRef]
- Guardianelli, L.M.; Salinas, M.V.; Puppo, M.C. Chemical and thermal properties of flours from germinated amaranth seeds. J. Food Meas. Charact. 2019, 13, 1078–1088. [Google Scholar] [CrossRef]
- Menezes, L.A.A.; Molognoni, L.; de Sá Ploêncio, L.A.; Costa, F.B.M.; Daguer, H.; Dea Lindner, J. De Use of sourdough fermentation to reducing FODMAPs in breads. Eur. Food Res. Technol. 2019, 245, 1183–1195. [Google Scholar] [CrossRef]
- Lima, T.T.M.; de Hosken, B.O.; De Dea Lindner, J.; Menezes, L.A.A.; Pirozi, M.R.; Martin, J.G.P. How to deliver sourdough with appropriate characteristics for the bakery industry? The answer may be provided by microbiota. Food Biosci. 2023, 56, 103072. [Google Scholar] [CrossRef]
- Yang, M.; Tao, L.; Kang, X.-R.; Wang, Z.-L.; Su, L.-Y.; Li, L.-F.; Gu, F.; Zhao, C.-C.; Sheng, J.; Tian, Y. Moringa oleifera Lam. leaves as new raw food material: A review of its nutritional composition, functional properties, and comprehensive application. Trends Food Sci. Technol. 2023, 138, 399–416. [Google Scholar] [CrossRef]
- Fernandes, Â.; Bancessi, A.; Pinela, J.; Dias, M.I.; Liberal, Â.; Calhelha, R.C.; Ćirić, A.; Soković, M.; Catarino, L.; Ferreira, I.C.F.R.; et al. Nutritional and phytochemical profiles and biological activities of Moringa oleifera Lam. edible parts from Guinea-Bissau (West Africa). Food Chem. 2021, 341, 128229. [Google Scholar] [CrossRef]
- Ziani, B.E.C.; Rached, W.; Bachari, K.; Alves, M.J.; Calhelha, R.C.; Barros, L.; Ferreira, I.C.F.R. Detailed chemical composition and functional properties of Ammodaucus leucotrichus Cross. & Dur. and Moringa oleifera Lamarck. J. Funct. Foods 2019, 53, 237–247. [Google Scholar] [CrossRef]
- Katmawanti, S.; Supriyadi; Mariroh, F. Is instant porridge with a high calcium content based on Moringa oleifera as an alternative baby food to prevent stunting in Indonesia? J. Public Health Res. 2021, 10, jphr-2021. [Google Scholar] [CrossRef]
- Coelho, L.M.; Silva, P.M.; Martins, J.T.; Pinheiro, A.C.; Vicente, A.A. Emerging opportunities in exploring the nutritional/functional value of amaranth. Food Funct. 2018, 9, 5499–5512. [Google Scholar] [CrossRef]
- Monteiro, J.; Scotti-Campos, P.; Pais, I.; Figueiredo, A.C.; Viegas, D.; Reboredo, F. Elemental composition, total fatty acids, soluble sugar content and essential oils of flowers and leaves of Moringa oleifera cultivated in Southern Portugal. Heliyon 2022, 8, E12647. [Google Scholar] [CrossRef]
- Kiewlicz, J.; Rybicka, I. Minerals and their bioavailability in relation to dietary fiber, phytates and tannins from gluten and gluten-free flakes. Food Chem. 2020, 305, 125452. [Google Scholar] [CrossRef]
- Abd El-Hack, M.E.; Alqhtani, A.H.; Swelum, A.A.; El-Saadony, M.T.; Salem, H.M.; Babalghith, A.O.; Taha, A.E.; Ahmed, O.; Abdo, M.; El-Tarabily, K.A. Pharmacological, nutritional and antimicrobial uses of Moringa oleifera Lam. leaves in poultry nutrition: An updated knowledge. Poult. Sci. 2022, 101, 102031. [Google Scholar] [CrossRef]
- Jnawali, P.; Kumar, V.; Tanwar, B. Celiac disease: Overview and considerations for development of gluten-free foods. Food Sci. Hum. Wellness 2016, 5, 169–176. [Google Scholar] [CrossRef]
- WHO (World Health Organization). School Policy Framework: Implementation of the WHO Global Strategy on Diet, Physical Activity and Health; WHO: Rome, Italy, 2008; p. 53. [Google Scholar]
- AESAN Informe del Comité Científico de la Agencia Española de Seguridad Alimentaria y Nutrición (AESAN) sobre Ingestas Nutricionales de Referencia para la población española. Rev. Com. Científico AESAN 2019, 29, 4–68.
- De la Guardia, M.; Garrigues, S. Handbook of Mineral Elements in Food; John Wiley & Sons: Hoboken, NJ, USA, 2015. [Google Scholar]
- Fekri, A.; Torbati, M.; Yari Khosrowshahi, A.; Bagherpour Shamloo, H.; Azadmard-Damirchi, S. Functional effects of phytate-degrading, probiotic lactic acid bacteria and yeast strains isolated from Iranian traditional sourdough on the technological and nutritional properties of whole wheat bread. Food Chem. 2020, 306, 125620. [Google Scholar] [CrossRef] [PubMed]
- Poutanen, K.; Flander, L.; Katina, K. Sourdough and cereal fermentation in a nutritional perspective. Food Microbiol. 2009, 26, 693–699. [Google Scholar] [CrossRef]
- van Megen, F.; Fossli, M.; Skodje, G.I.; Carlsen, M.H.; Andersen, L.F.; Veierød, M.B.; Lundin, K.E.A.; Henriksen, C. Nutritional assessment of women with celiac disease compared to the general population. Clin. Nutr. ESPEN 2023, 54, 251–257. [Google Scholar] [CrossRef] [PubMed]
- Kumar, A.; Lal, M.K.; Sahoo, U.; Sahoo, S.K.; Sah, R.P.; Tiwari, R.K.; Kumar, R.; Sharma, S. Combinatorial effect of heat processing and phytic acid on mineral bioavailability in rice grain. Food Chem. Adv. 2023, 2, 100232. [Google Scholar] [CrossRef]
- Craine, E.B.; Murphy, K.M. Seed Composition and Amino Acid Profiles for Quinoa Grown in Washington State. Front. Nutr. 2020, 7, 126. [Google Scholar] [CrossRef] [PubMed]
- Yang, C.; Zhu, X.; Zhang, Z.; Yang, F.; Wei, Y.; Zhang, Z.; Yang, F. Heat treatment of quinoa (Chenopodium quinoa Willd.) albumin: Effect on structural, functional, and in vitro digestion properties. Front. Nutr. 2022, 9, 1010617. [Google Scholar] [CrossRef] [PubMed]
- Giuberti, G.; Rocchetti, G.; Montesano, D.; Lucini, L. The potential of Moringa oleifera in food formulation: A promising source of functional compounds with health-promoting properties. Curr. Opin. Food Sci. 2021, 42, 257–269. [Google Scholar] [CrossRef]
- Balakrishnan, G.; Schneider, R.G. The Role of Amaranth, Quinoa, and Millets for the Development of Healthy, Sustainable Food Products—A Concise Review. Foods 2022, 11, 2442. [Google Scholar] [CrossRef]
- Farooq, M.; Jang, Y.H.; Kim, E.G.; Park, J.R.; Eom, G.H.; Zhao, D.D.; Kim, K.M. Evaluation of Amino Acid Profiles of Rice Genotypes under Different Salt Stress Conditions. Plants 2023, 12, 1315. [Google Scholar] [CrossRef] [PubMed]
- Malik, A.M.; Singh, A. Pseudocereals proteins—A comprehensive review on its isolation, composition and quality evaluation techniques. Food Chem. Adv. 2022, 1, 100001. [Google Scholar] [CrossRef]
- Jongberg, S.; de Terkelsen, L.S.; Miklos, R.; Lund, M.N. Green tea extract impairs meat emulsion properties by disturbing protein disulfide cross-linking. Meat Sci. 2014, 100, 2–9. [Google Scholar] [CrossRef]
- Martínez, L.; Jongberg, S.; Ros, G.; Skibsted, L.H.; Nieto, G. Plant derived ingredients rich in nitrates or phenolics for protection of pork against protein oxidation. Food Res. Int. 2020, 129, 108789. [Google Scholar] [CrossRef] [PubMed]
- Martínez, L.; Bastida, P.; Castillo, J.; Ros, G.; Nieto, G. Green Alternatives to Synthetic Antioxidants, Antimicrobials, Nitrates, and Nitrites in Clean Label Spanish Chorizo. Antioxidants 2019, 8, 184. [Google Scholar] [CrossRef] [PubMed]
- Gwin, J.A.; Church, D.D.; Wolfe, R.R.; Ferrando, A.A.; Pasiakos, S.M. Muscle protein synthesis and whole-body protein turnover responses to ingesting essential amino acids, intact protein, and protein-containing mixed meals with considerations for energy deficit. Nutrients 2020, 12, 2457. [Google Scholar] [CrossRef]
- Estay Moyano, C.A.; Mazón Suástegui, J.M.; Zapata Vivenes, E.; Simal Ganadara, J.; Lodeiros Seijo, C. Análisis del perfil lipídico y aminoacídico de hojas deshidratadas de Moringa oleifera (L.) y su potencial como suplemento dietético en acuicultura de moluscos. Técnica Rev. Agrocienc. 2021, 25, 1–20. [Google Scholar] [CrossRef]
- Muñoz Araya, M. Análisis del Perfil Nutricional de Magdalenas con Polvo de Hojas Deshidratadas de Moringa (Moringa oleífera); Universitat Politécnica de Valencia: Valencia, Spain, 2020. [Google Scholar]
- Yang, Z.; Yang, K.; Zhang, X.; Yang, Q.; Zhang, Y.; Gao, J.; Qu, H.; Shi, J. Dietary Saturated, Monounsaturated, or Polyunsaturated Fatty Acids and Estimated 10-Year Risk of a First Hard Cardiovascular Event. Am. J. Med. 2023, 136, 796–803.e2. [Google Scholar] [CrossRef]
- Motta, C.; Delgado, I.; Matos, A.S.; Gonzales, G.B.; Torres, D.; Santos, M.; Chandra-Hioe, M.V.; Arcot, J.; Castanheira, I. Folates in quinoa (Chenopodium quinoa), amaranth (Amaranthus sp.) and buckwheat (Fagopyrum esculentum): Influence of cooking and malting. J. Food Compos. Anal. 2017, 64, 181–187. [Google Scholar] [CrossRef]
- Jha, A.B.; Ashokkumar, K.; Diapari, M.; Ambrose, S.J.; Zhang, H.; Tar’an, B.; Bett, K.E.; Vandenberg, A.; Warkentin, T.D.; Purves, R.W. Genetic diversity of folate profiles in seeds of common bean, lentil, chickpea and pea. J. Food Compos. Anal. 2015, 42, 134–140. [Google Scholar] [CrossRef]
- Olivares Martínez, A.B.; Berruezo, G.R.; Cava, M.J.B.; Graciá, C.M.; Castón, M.J.P. Estimación de la ingesta y necesidades de enriquecimiento de folatos y ácido fólico en alimentos. Arch. Latinoam. Nutr. 2005, 55, 5–14. [Google Scholar] [PubMed]
- Peñalver, R.; Ros, G.; Nieto, G. Development of Gluten-Free Functional Bread Adapted to the Nutritional Requirements of Celiac Patients. Fermentation 2023, 9, 631. [Google Scholar] [CrossRef]
- MAGRAMA Informe del consumo alimentario en España 2020, Ministerio de Agricultura, Pesca y Alimentación. Minist. Agric. Pesca y Aliment. Secr. Gen. Técnica. Cent. Publicaciones. 2021. Available online: https://www.mapa.gob.es/es/alimentacion/temas/consumo-tendencias/informe-anual-consumo-2020-v2-nov2021-baja-res_tcm30-562704.pdf (accessed on 19 August 2023).
- Brevik, A.; Vollset, S.E.; Tell, G.S.; Refsum, H.; Ueland, P.M.; Loeken, E.B.; Drevon, C.A.; Andersen, L.F. Plasma concentration of folate as a biomarker for the intake of fruit and vegetables: The Hordaland Homocysteine Study. Am. J. Clin. Nutr. 2005, 81, 434–439. [Google Scholar] [CrossRef] [PubMed]
- Method, A.; Tulchinsky, T.H. Commentary: Food Fortification: African Countries Can Make More Progress. Adv. Food Technol. Nutr. Sci. Open J. 2015, 1, S22–S28. [Google Scholar] [CrossRef]
- Nieto, G. Incorporation of by-products of rosemary and thyme in the diet of ewes: Effect on the fatty acid profile of lamb. Eur. Food Res. Technol. 2013, 236, 379–389. [Google Scholar] [CrossRef]
- Nieto, G.; Bañón, S.; Garrido, M.D. Incorporation of thyme leaves in the diet of pregnant and lactating ewes: Effect on the fatty acid profile of lamb. Small Rumin. Res. 2012, 105, 140–147. [Google Scholar] [CrossRef]
- Carrillo, C.; Nieto, G.; Martínez-Zamora, L.; Ros, G.; Kamiloglu, S.; Munekata, P.E.S.; Pateiro, M.; Lorenzo, J.M.; Fernández-López, J.; Viuda-Martos, M.; et al. Novel Approaches for the Recovery of Natural Pigments with Potential Health Effects. J. Agric. Food Chem. 2022, 70, 6864–6883. [Google Scholar] [CrossRef]
Figure 1.
Photograph of the enriched gluten-free, control, and commercial breads. Q: sourdough quinoa; A: sourdough amaranth; BR: sourdough brown rice; QM: sourdough quinoa and Moringa oleifera; AM: sourdough amaranth and Moringa oleifera; BRM: sourdough amaranth and Moringa oleifera; COM: commercial.

Figure 2.
Percentage of bioaccessible minerals in the studied formulas of the gluten-free breads. Different letters denote significant differences among gluten-free breads (p < 0.05). Q: sourdough quinoa; A: sourdough amaranth; BR: sourdough brown rice; QM: sourdough quinoa and Moringa oleifera; AM: sourdough amaranth and Moringa oleifera; BRM: sourdough amaranth and Moringa oleifera; COM: commercial. Different subscript letters indicate significant differences (p < 0.005) between samples a–f. Different subscripts indicate differences between samples depending on the sourdough 1–3.

Figure 3.
Purchase intent and preference order (A) and sensory analysis (B) of reformulated gluten-free breads. Different letters in A and * in B denote significant differences among reformulated brownies (p < 0.05). Q: sourdough quinoa; A: sourdough amaranth; BR: sourdough brown rice; QM: sourdough quinoa and Moringa oleifera; AM: sourdough amaranth and Moringa oleifera; BRM: sourdough amaranth and Moringa oleifera; COM: commercial.


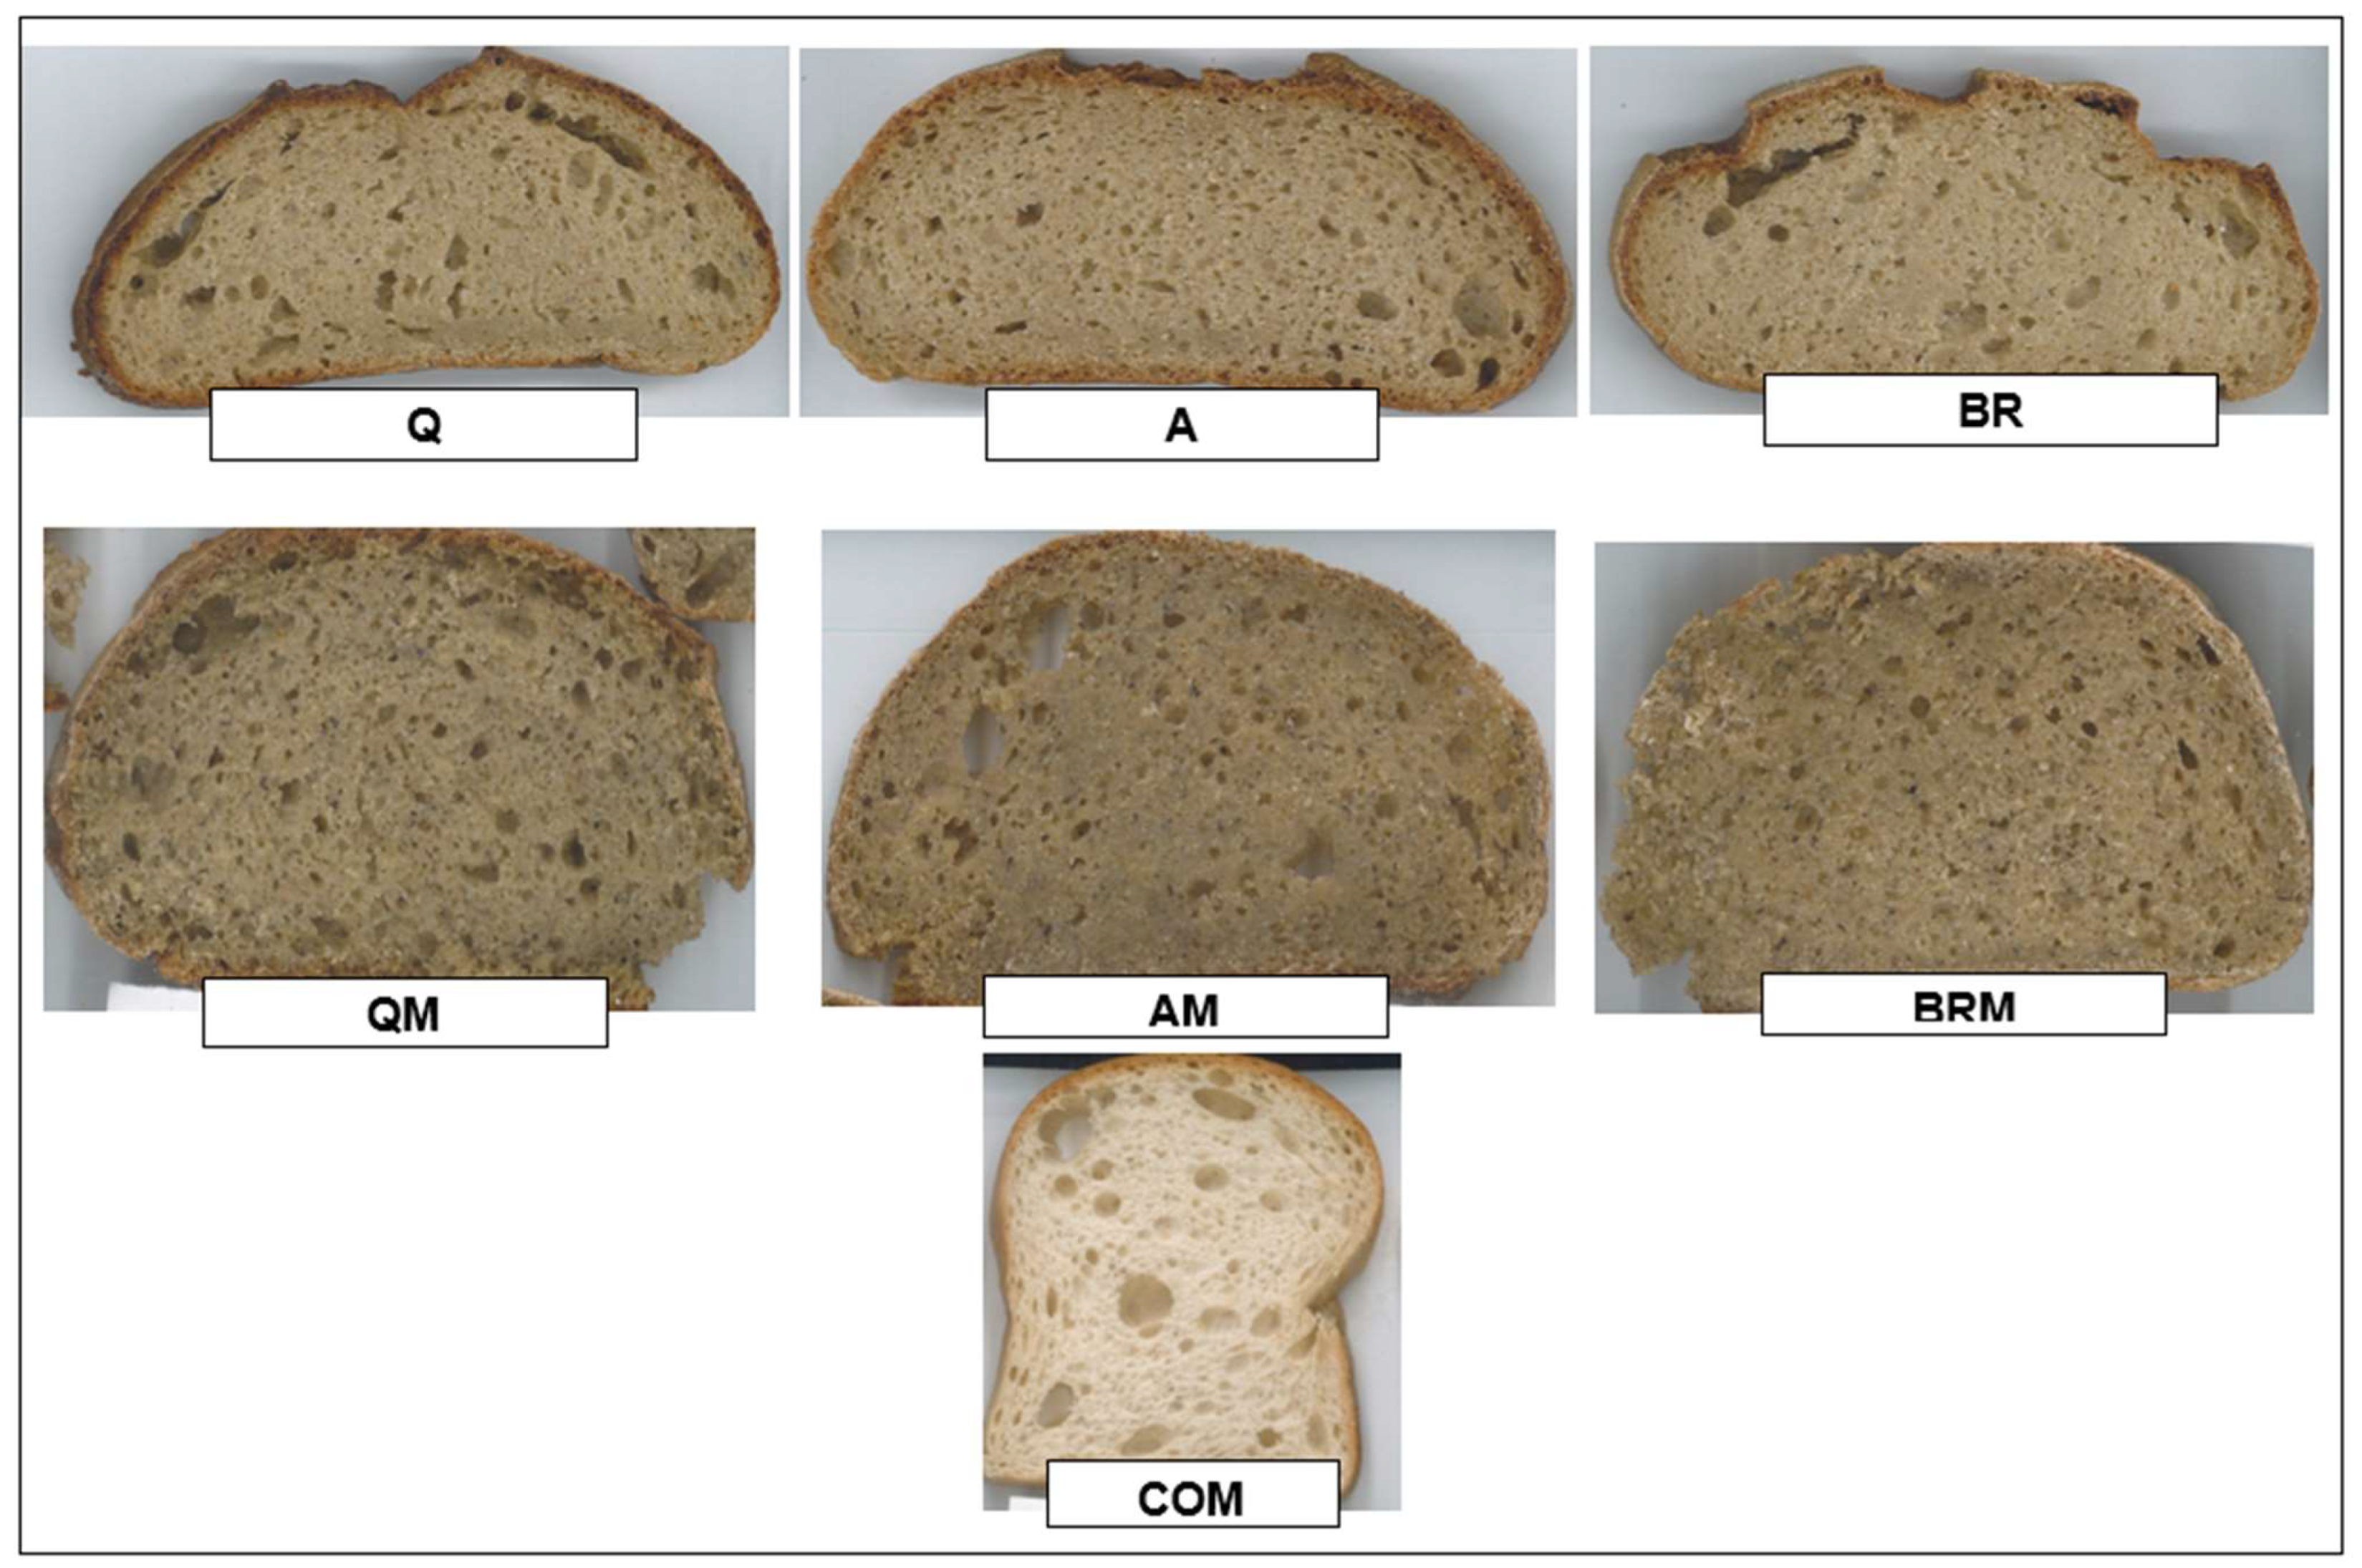
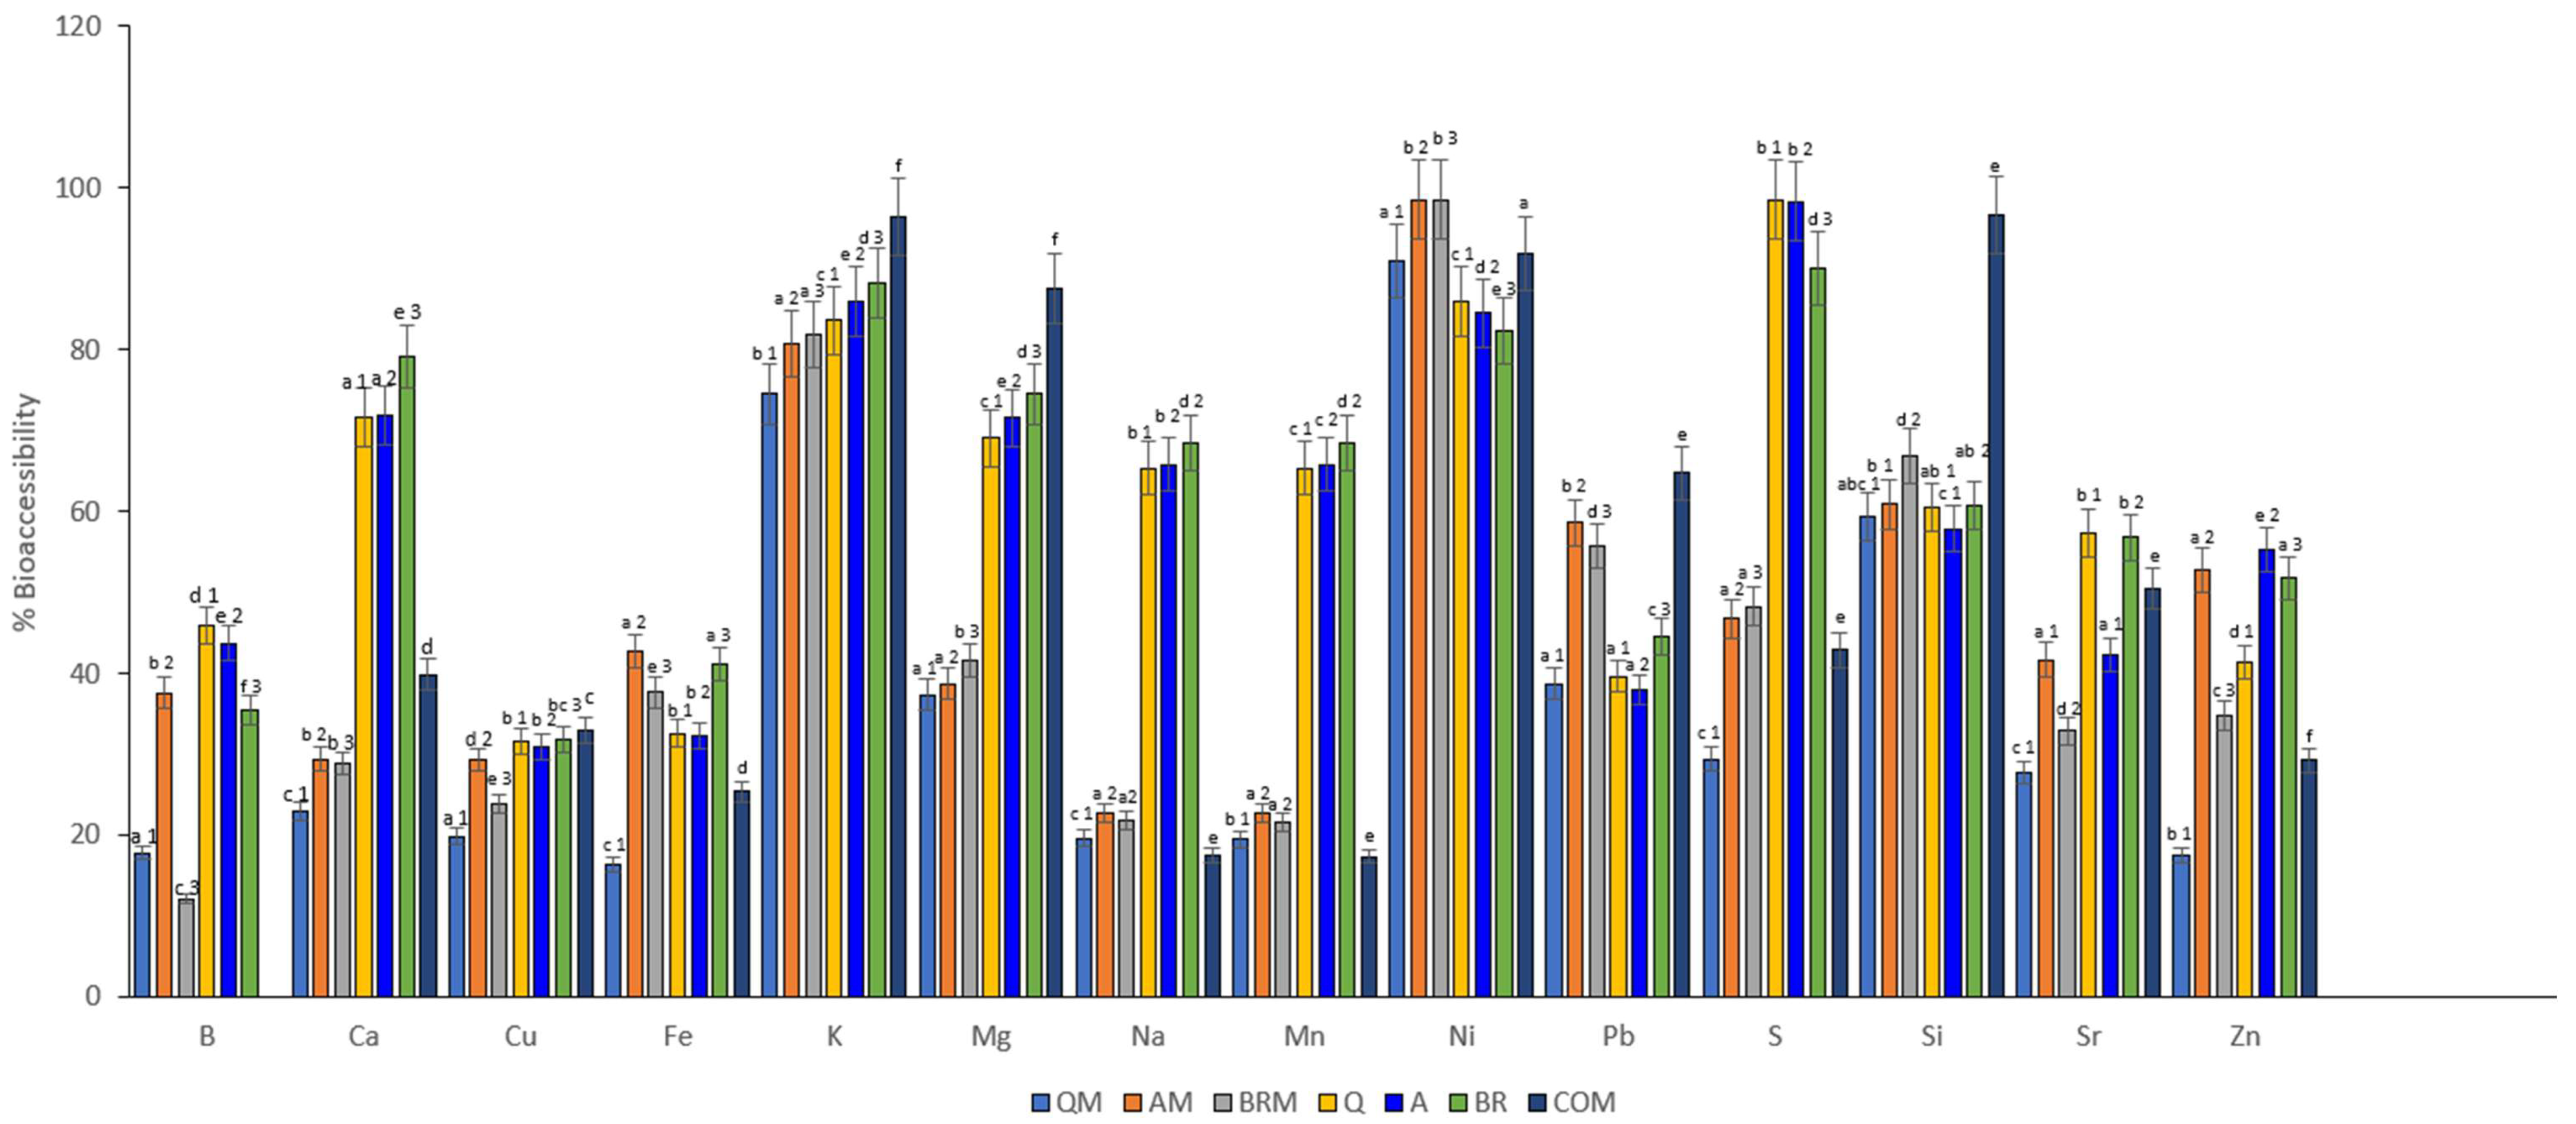
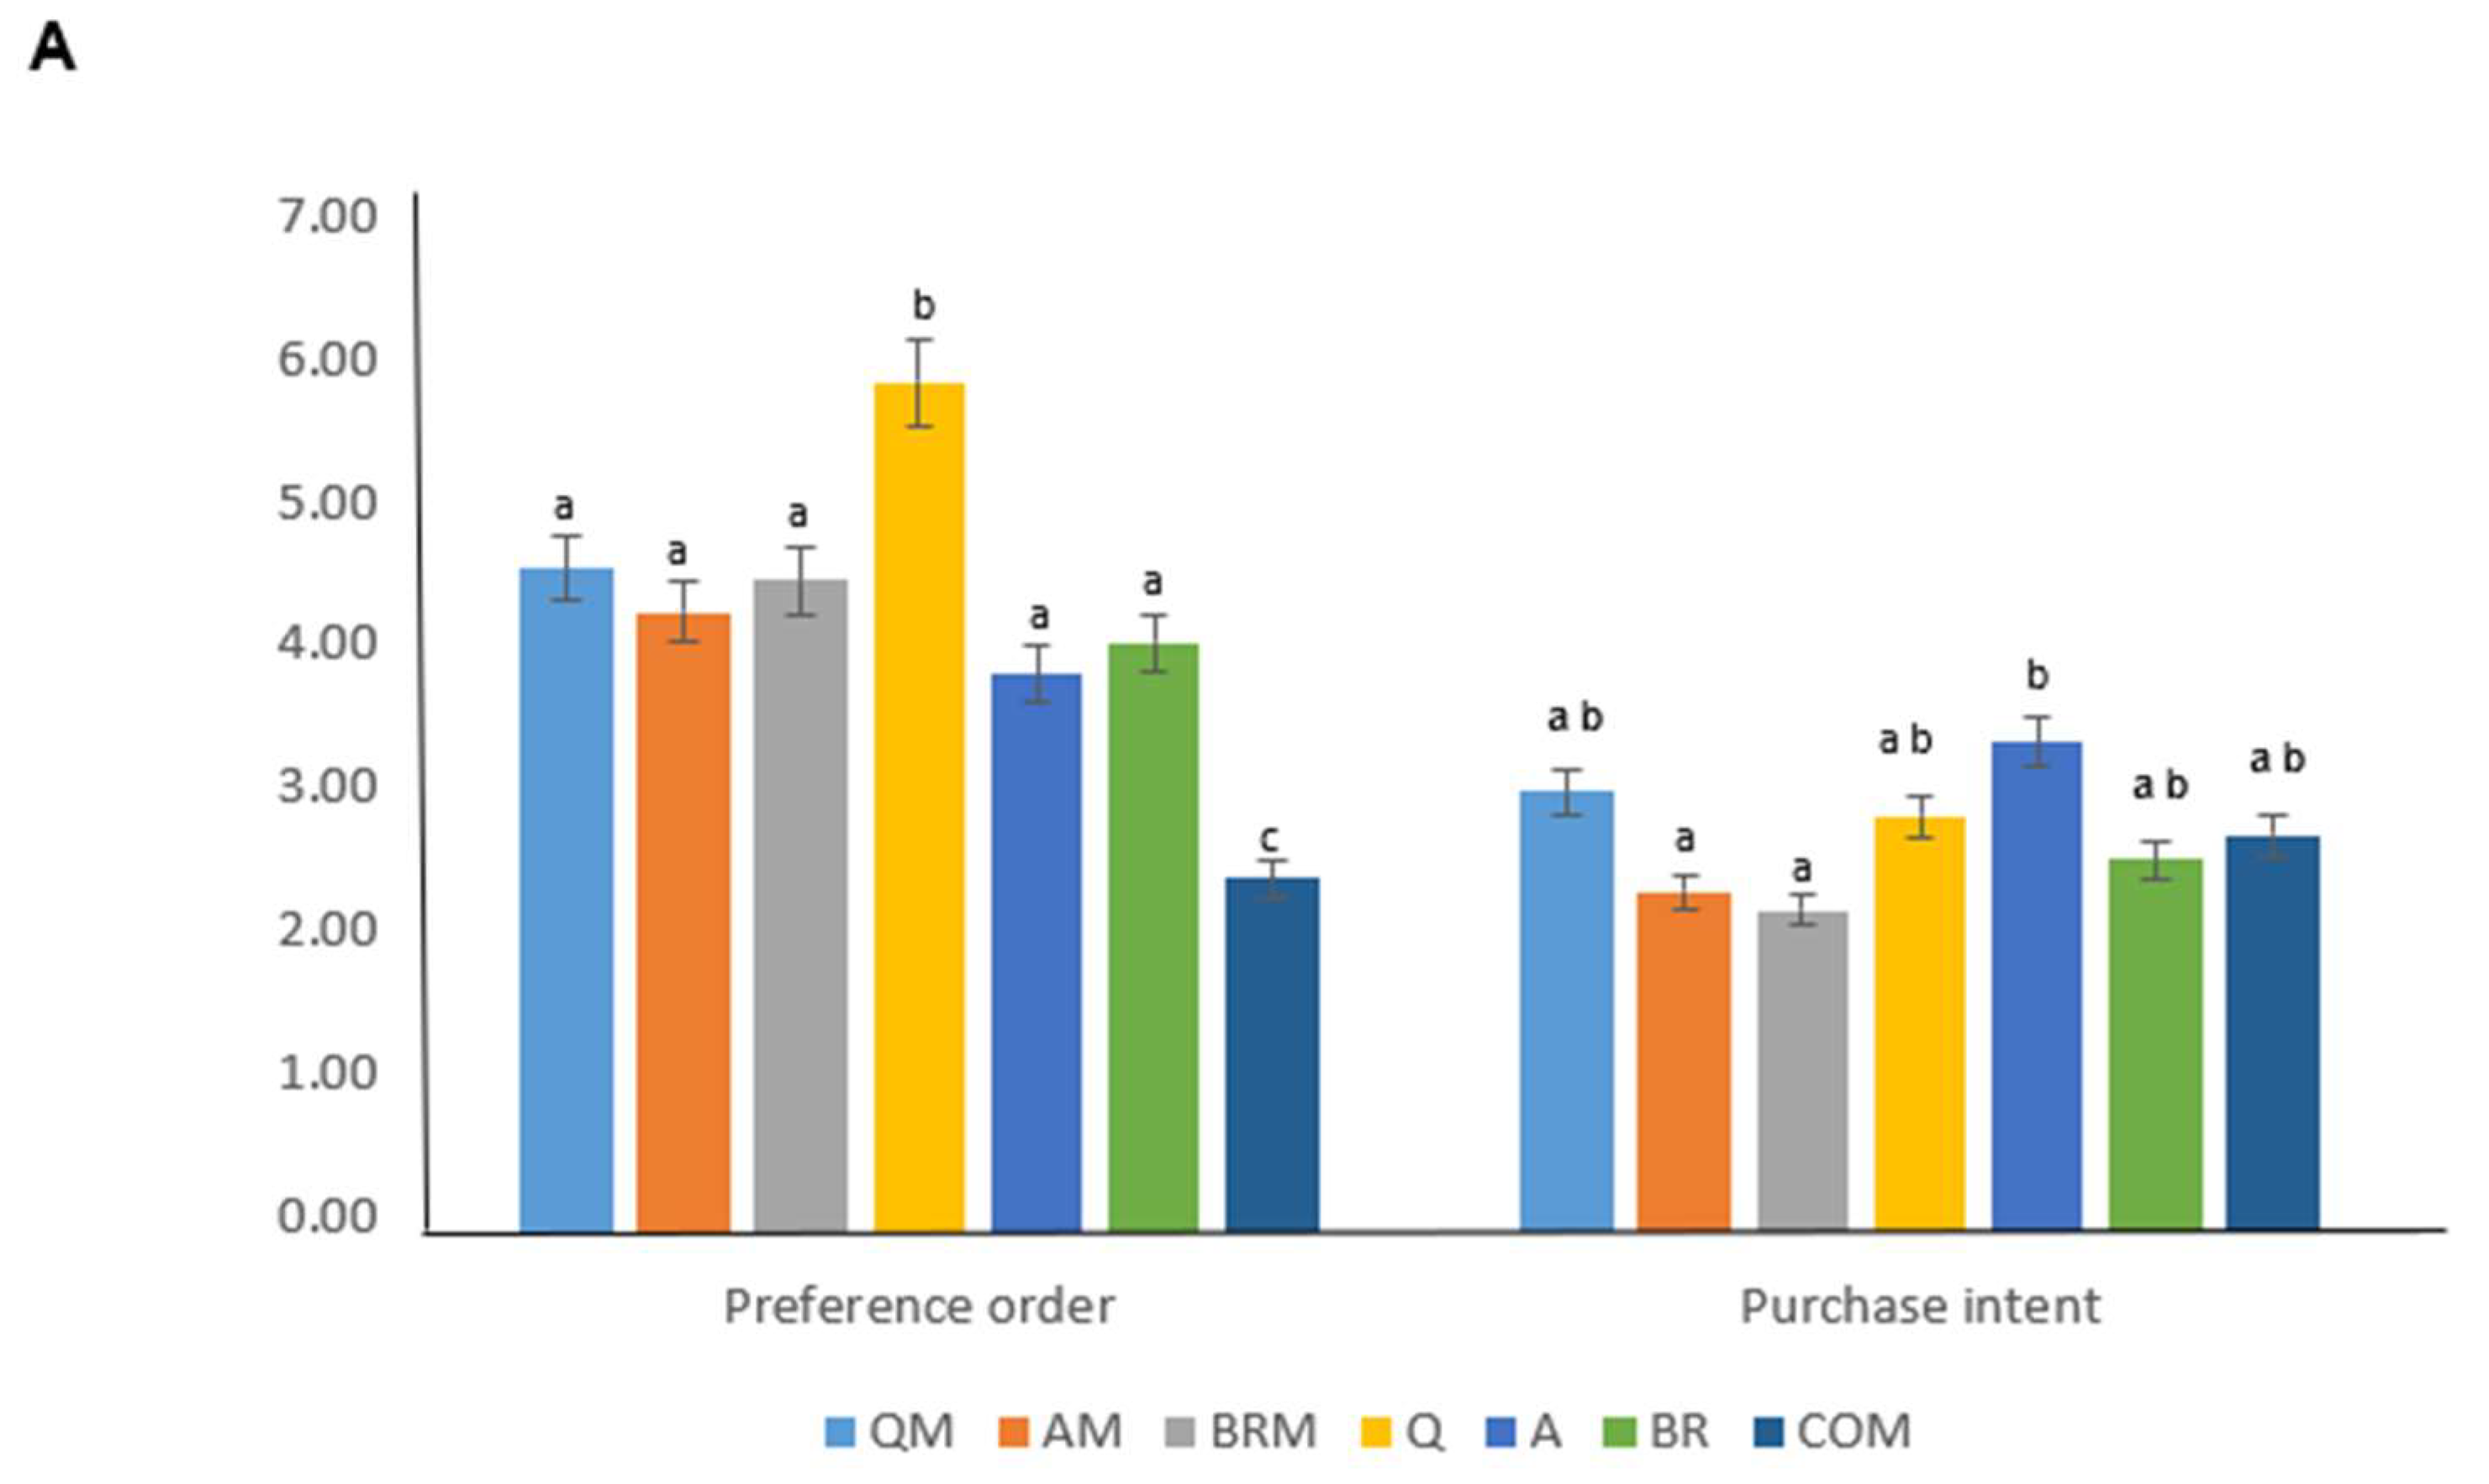
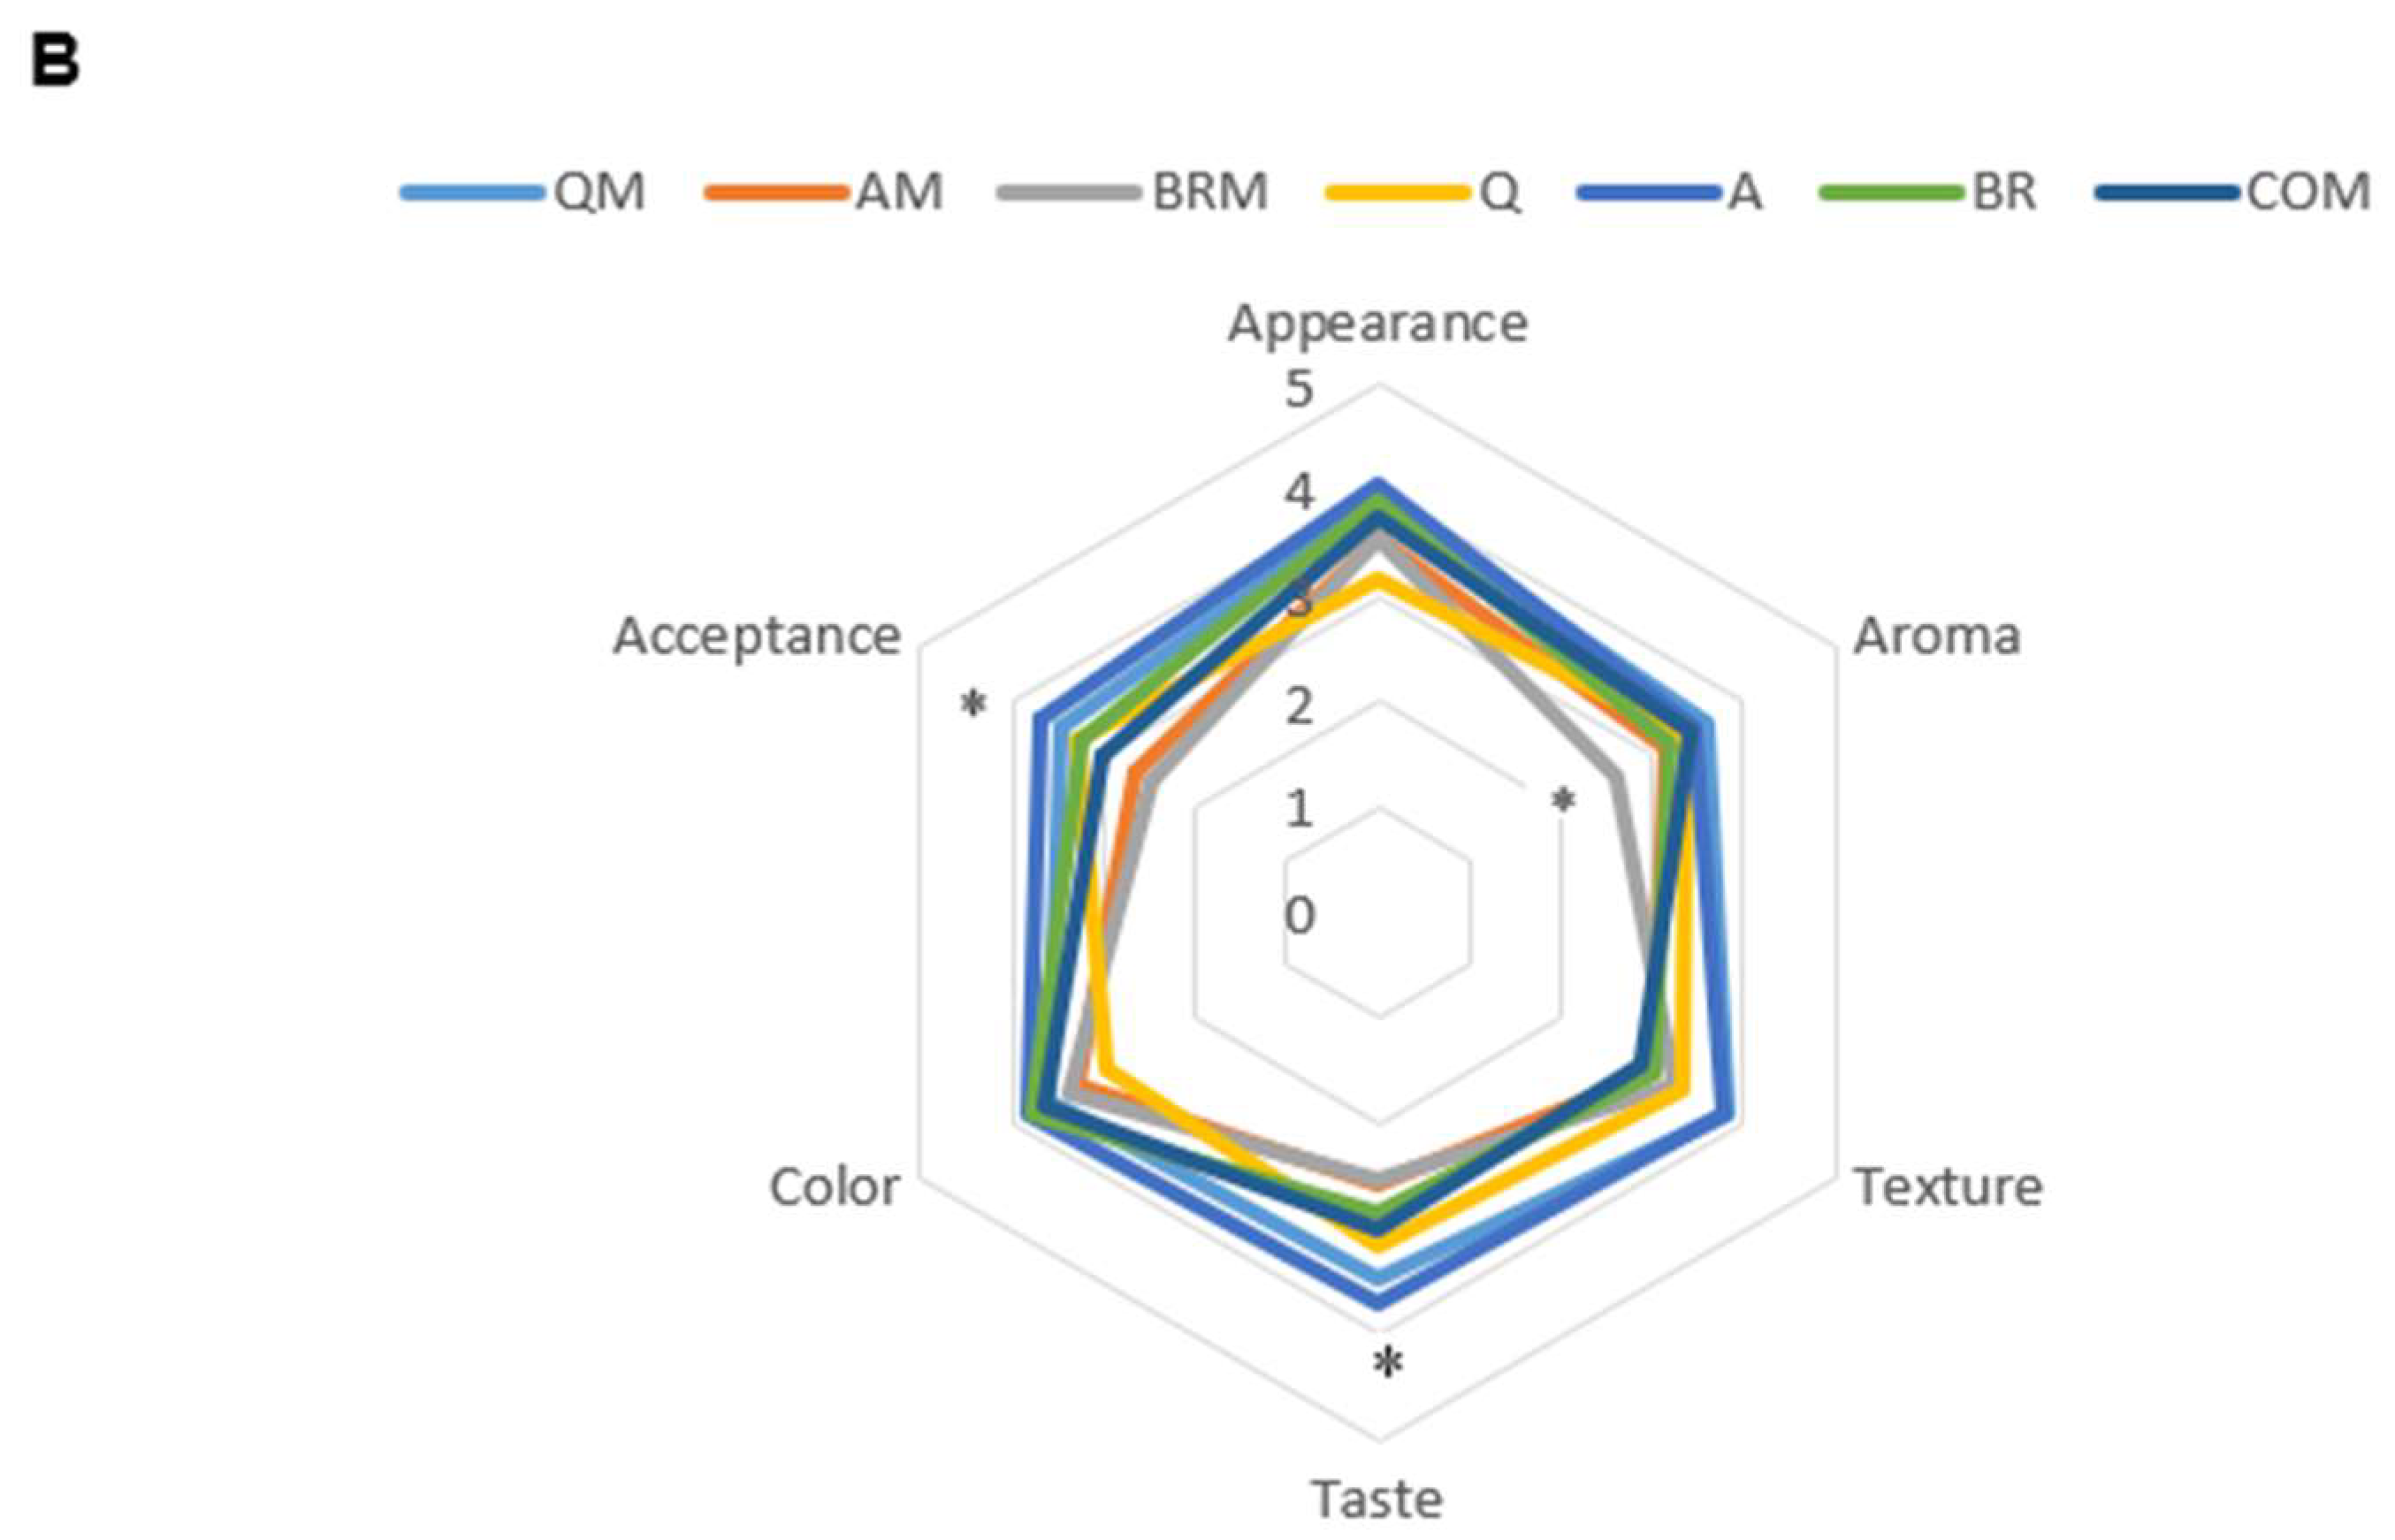
Table 1.
Gluten-free bread ingredients.
| Ingredients | Control | Enriched Breads | ||||
|---|---|---|---|---|---|---|
| Q | A | BR | QM | AM | BRM | |
| Corn starch (g) | 100 | 100 | 100 | 100 | 100 | 100 |
| Salt (g) | 5 | 5 | 5 | 5 | 5 | 5 |
| Psyllium (g) | 5 | 5 | 5 | 5 | 5 | 5 |
| Sourdough (g) | 50 | 50 | 50 | 50 | 50 | 50 |
| Olive oil (mL) | 10 | 10 | 10 | 10 | 10 | 10 |
| Amaranth flour (g) | 22 | 22 | 22 | 22 | 22 | 22 |
| Buckwheat flour (g) | 62 | 62 | 62 | 62 | 62 | 62 |
| Chickpea flour (g) | 42 | 42 | 42 | 42 | 42 | 42 |
| Water (ml) | 225 | 225 | 225 | 225 | 225 | 225 |
| Sugar (g) | 4 | 4 | 4 | 4 | 4 | 4 |
| Moringa oleifera (g) | - | - | - | 13.66 | 13.66 | 13.66 |
Q: sourdough quinoa; A: sourdough amaranth; BR: sourdough brown rice; QM: sourdough quinoa and Moringa oleifera; AM: sourdough amaranth and Moringa oleifera; BRM: sourdough amaranth and Moringa oleifera; COM: commercial.
Table 2.
Chemical analyses of gluten-free breads (g/100 g).
| Parameters | Sample | ||||||
|---|---|---|---|---|---|---|---|
| Q | A | BR | QM | AM | BRM | COM | |
| Moisture | 32.34 ± 0.07 b; 1 | 33.46 ± 0.25 c; 2 | 36.76 ± 0.25 d; 2 | 40.31 ± 0.10 a; 1 | 41.54 ± 0.12 a; 2 | 40.20 ± 0.21 a; 2 | 42.00 ± 0.18 a |
| Ash | 2.01 ± 0.02 a; 1 | 1.99 ± 0.02 a; 1 | 2.03 ± 0.05 a; 1 | 2.33 ± 0.01 c; 1 | 2.29 ± 0.17 c; 1 | 2.29 ± 0.05 c; 1 | 0.01 ± 0.01 b |
| Total fat | 1.63 ± 0.02 a; 1 | 1.25 ± 0.08 b; 2 | 1.16 ± 0.11 b; 3 | 1.72 ± 0.01 a; 1 | 1.71 ± 0.01 a; 2 | 1.32 ± 0.03 b; 3 | 3.25 ± 0.11 c |
| Proteins | 5.43 ± 0.02 a; 1 | 5.40 ± 0.01 a; 2 | 5.25 ± 0.03 a; 3 | 6.76 ± 0.10 b; 1 | 6.48 ± 0.03 c; 2 | 5.77 ± 0.11 d; 3 | 2.96 ± 0.10 e |
| Total fiber | 10.77 ± 0.04 b; 1 | 8.98 ± 0.57 c; 2 | 8.41 ± 0.23 c; 3 | 11.83 ± 0.31 a; 1 | 11.70 ± 0.23 a; 2 | 11.33 ± 0.12 a, b; 3 | 3.09 ± 0.03 d |
| Soluble fiber | 2.58 ± 0.32 a, b; 1 | 2.19 ± 0.46 b; 1 | 1.40 ± 0.21 c; 2 | 3.16 ± 0.02 a; 1 | 3.12 ± 0.06 a; 1 | 2.99 ± 0.03 a; 2 | 1.06 ± 0.08 c |
| Insoluble fiber | 8.19 ± 0.36 a; 2 | 6.80 ± 0.10 b; 1 | 7.01 ± 0.02 b; 1 | 8.67 ± 0.29 a; 2 | 8.58 ± 0.28 a; 1 | 8.34 ± 0.15 a; 1 | 3.09 ± 0.03 c |
| Carbohydrates | 47.82 ± 0.06 c; 1 | 48.92 ± 1.33 d; 1 | 46.38 ± 0.20 c; 1 | 37.06 ± 0.15 a, b; 1 | 36.27 ± 0.09 b; 1 | 39.09 ± 0.17 a; 1 | 45.24 ± 0.29 c |
Q: sourdough quinoa; A: sourdough amaranth; BR: sourdough brown rice; QM: sourdough quinoa and Moringa oleifera; AM: sourdough amaranth and Moringa oleifera; BRM: sourdough amaranth and Moringa oleifera; COM: commercial. Different subscript letters indicate significant differences (p < 0.005) between columns a–e. Different subscripts indicate differences between samples depending on the sourdough 1–3.
Table 3.
pH, TTA, and acid contents in the gluten-free breads.
| Sample | pH | TTA (ml NaOH/10 g) | L-Lactic Acid (g/kg) | Acetic Acid (g/kg) |
|---|---|---|---|---|
| Q | 6.14 ± 0.07 d; 1 | 6.20 ± 0.10 b, c; 1 | 0.19 ± 0.06 a, e; 1 | 1.30 ± 0.01 c; 1 |
| A | 5.75 ± 0.08 c; 2 | 6.40 ± 0.30 c; 1 | 0.47 ± 0.05 c; 2 | 1.11 ± 0.02 b; 2 |
| BR | 6.16 ± 0.08 d; 3 | 5.60 ± 0.40 b; 2 | 0.23 ± 0.03 e; 3 | 1.18 ± 0.01 a; 3 |
| QM | 5.45 ± 0.04 a; 1 | 7.42 ± 0.10 a; 1 | 0.23 ± 0.06 a, e; 1 | 1.34 ± 0.01 d; 1 |
| AM | 5.25 ± 0.04 b; 2 | 7.55 ± 0.13 a; 1 | 0.63 ± 0.04 b; 2 | 1.18 ± 0.02 a; 2 |
| BRM | 5.65 ± 0.05 c; 3 | 7.20 ± 0.10 a; 2 | 0.37 ± 0.06 c, a, e; 3 | 1.26 ± 0.01 e; 3 |
| COM | 4.89 ± 0.08 e | 4.37 ± 0.30 d | 0.17 ± 0.02 d, a, e | 0.35 ± 0.01 f |
TTA: total titratable acidity; Q: sourdough quinoa; A: sourdough amaranth; BR: sourdough brown rice; QM: sourdough quinoa and Moringa oleifera; AM: sourdough amaranth and Moringa oleifera; BRM: sourdough amaranth and Moringa oleifera; COM: commercial. Different subscript letters indicate significant differences (p < 0.005) between rows a–f. Different subscripts indicate differences between samples depending on the sourdough 1–3.
Table 4.
Colorimetric parameters for the different bread samples. Results are expressed as mean ± SD.
Table 4.
Colorimetric parameters for the different bread samples. Results are expressed as mean ± SD.
| Sample | L* | C* | h* | a* | b* |
|---|---|---|---|---|---|
| Q | 67.61 ± 4.26 b * | 19.26 ± 2.67 a | 86.35 ± 1.60 b | 1.17 ± 0.35 b * | 19.22 ± 2.71 a |
| A | 67.87 ± 0.76 b | 19.63 ± 1.67 a | 87.59 ± 1.58 b | 0.80 ± 0.44 b | 19.61 ± 1.70 a |
| BR | 71.86 ± 1.54 b * | 20.23 ± 3.73 a | 88.66 ± 1.82 b | 0.40 ± 0.51 b * | 20.22 ± 3.75 a |
| QM | 50.91 ± 0.16 a * | 19.76 ± 0.27 a | 80.92 ± 0.09 a | 3.12 ± 0.03 a * | 19.42 ± 0.03 a |
| AM | 53.68 ± 0.07 a | 17.83 ± 0.19 a | 81.17 ± 0.07 a | 2.77 ± 0.03 a | 17.53 ± 0.02 a |
| BRM | 53.35 ± 0.04 a * | 15.97 ± 0.06 a | 80.65 ± 0.07 a | 2.63 ± 0.02 a * | 15.79 ± 0.03 a |
| COM | 84.39 ± 1.49 c | 18.71 ± 0.59 a | 91.29 ± 0.91 c | 0.22 ± 0.10 c | 18.59 ± 0.61 a |
Q: sourdough quinoa; A: sourdough amaranth; BR: sourdough brown rice; QM: sourdough quinoa and Moringa oleifera; AM: sourdough amaranth and Moringa oleifera; BRM: sourdough amaranth and Moringa oleifera; COM: commercial. Different subscript letters indicate significant differences (p < 0.005) between rows a–c. *: Indicates the differences between samples depending on the sourdough.
Table 5.
Total phenolic content (TPC) (mg GAE g-1) and antioxidant activity (µmol TE g-1) of the gluten-free breads.
Table 5.
Total phenolic content (TPC) (mg GAE g-1) and antioxidant activity (µmol TE g-1) of the gluten-free breads.
| Sample | TPC | Antioxidant Activity | |||
|---|---|---|---|---|---|
| ABTS | DPPH | FRAP | ORAC | ||
| Q | 7.22 ± 1.82 b; 1 | 39.81 ± 0.10 d; 1 | 16.81 ± 0.84 b; 1 | 4.52 ± 0.14 c; 1 | 880.93 ± 32.47 c; 1 |
| A | 6.44 ± 0.83 b; 2 | 41.03 ± 0.30 c; 2 | 16.73 ± 0.33 b; 1 | 6.87 ± 0.09 a; 2 | 959.95 ± 40.02 d; 2 |
| BR | 5.65 ± 0.86 b d; 3 | 47.39 ± 0.05 b; 3 | 15.36 ± 0.10 c; 2 | 5.19 ± 0.23 b; 3 | 735.82 ± 4.67 e; 3 |
| QM | 11.88 ± 0.11 a; 1 | 50.78 ± 0.26 a; 1 | 25.82 ± 0.21 a; 1 | 6.33 ± 0.19 a; 1 | 1192.82 ± 0.74 a b; 1 |
| AM | 15.61 ± 0.60 c; 2 | 50.95 ± 0.24 a; 2 | 26.96 ± 0.11 d; 1 | 9.37 ± 0.40 d; 2 | 1235.52 ± 0.44 b; 2 |
| BRM | 9.67 ± 0.10 a; 3 | 50.77 ± 0.19 a; 3 | 25.34 ± 0.10 a; 2 | 6.93 ± 0.05 a; 3 | 1170.65 ± 0.52 a; 3 |
| COM | 3.72 ± 0.03 d | 28.19 ± 0.22 e | 6.39 ± 0.16 e | 1.34 ± 0.11 e | 463.25 ± 0.91 f |
Q: sourdough quinoa; A: sourdough amaranth; BR: sourdough brown rice; QM: sourdough quinoa and Moringa oleifera; AM: sourdough amaranth and Moringa oleifera; BRM: sourdough amaranth and Moringa oleifera; COM: commercial. Different subscript letters indicate significant differences (p < 0.005) between rows a–f. Different subscripts indicate differences between samples depending on the sourdough 1–3.
Table 6.
Fructose, glucose, maltose, and sucrose content (g/100 g) of gluten-free breads.
| Sample | Sucrose | Fructose | Glucose | Maltose |
|---|---|---|---|---|
| Q | 2.10 ± 0.03 a; 1 | 0.06 ± 0.01 a; 1 | 0.13 ± 0.01 a; 1 | 1.05 ± 0.01 a; 1 |
| A | 1.16 ± 0.01 b; 2 | 0.06 ± 0.01 a; 1 | 0.06 ± 0.01 b; 2 | 0.15 ± 0.02 e; 2 |
| BR | 1.11 ± 0.01 b; 3 | 0.02 ± 0.01 b; 2 | 0.02 ± 0.01 c; 3 | 0.06 ± 0.01 d; 3 |
| QM | 2.56 ± 0.02 d; 1 | 0.15 ± 0.00 c; 1 | 0.24 ± 0.02 d; 1 | 1.01 ± 0.02 b; 1 |
| AM | 1.48 ± 0.01 e; 2 | 0.15 ± 0.01 c; 1 | 0.18 ± 0.01 e; 2 | 0.15 ± 0.01 e; 2 |
| BRM | 1.29 ± 0.01 f; 3 | 0.11 ± 0.02 c; 2 | 0.12 ± 0.01 c; 3 | 0.05 ± 0.02 d; 3 |
| COM | 0.11 ± 0.01 c | 0.03 ± 0.01 b | 0.78 ± 0.02 f | 2.74 ± 0.08 c |
Q: sourdough quinoa; A: sourdough amaranth; BR: sourdough brown rice; QM: sourdough quinoa and Moringa oleifera; AM: sourdough amaranth and Moringa oleifera; BRM sourdough amaranth and Moringa oleifera; COM: commercial. Different subscript letters indicate significant differences (p < 0.005) between rows a−f. Different subscripts indicate differences between samples depending on the sourdough 1−3.
Table 7.
Mineral contents of gluten-free breads.
| Mineral | Sample | ||||||
|---|---|---|---|---|---|---|---|
| QM | AM | BRM | Q | A | BR | COM | |
| B (mg/Kg) | 1.37 ± 0.12 a; 1 | 2.28 ± 0.34 c; 2 | 0.99 ± 0.34 a; 3 | 0.10 ± 0.02 b; 1 | 0.16 ± 0.03 b; 2 | 0.12 ± 0.03 b; 3 | nd |
| Ca (g/100 g) | 0.41 ± 0.01 a b; 1 | 0.46 ± 0.05 b; 2 | 0.38 ± 0.01 a c; 3 | 0.29 ± 0.02 d; 1 | 0.33 ± 0.01 c d; 2 | 0.30 ± 0.02 d; 3 | 0.11 ± 0.01 e |
| Cu (mg/Kg) | 1.08 ± 0.05 d; 1 | 0.34 ± 0.01 a c; 2 | 0.32 ± 0.01 a c; 3 | 0.93 ± 0.07 d; 1 | 0.16 ± 0.01 a b; 2 | 0.16 ± 0.01 b; 3 | 0.31 ± 0.06 c |
| Fe (mg/Kg) | 5.44 ± 0.19 a c; 1 | 7.54 ± 0.42 d; 2 | 4.66 ± 0.04 b c; 3 | 4.63 ± 0.35 c; 1 | 5.91 ± 0.29 a; 2 | 4.22 ± 0.62 b c; 3 | 3.83 ± 0.62 b c |
| K (g/100 g) | 0.64 ± 0.02 a; 1 | 0.54 ± 0.01 a b; 2 | 0.46 ± 0.02 b; 3 | 0.49 ± 0.08 a b; 1 | 0.40 ± 0.06 b; 2 | 0.49 ± 0.05 a b; 3 | 0.31 ± 0.08 c |
| Mg (g/100 g) | 0.03 ± 0.01 a; 1 | 0.04 ± 0.01 a; 1 | 0.03 ± 0.01 a; 1 | 0.03 ± 0.01 a; 1 | 0.03 ± 0.01 a; 1 | 0.03 ± 0.01 a; 1 | 0.01 ± 0.01 b |
| Mn (mg/Kg) | 5.11 ± 0.32 a c; 1 | 5.53 ± 0.29 a; 1 | 4.37 ± 1.18 a c; 1 | 3.98 ± 0.35 c; 1 | 4.59 ± 0.26 a c; 1 | 4.33 ± 0.12 a c; 1 | 1.81 ± 0.25 b |
| Pb (mg/Kg) | 0.11 ± 0.04 a; 1 | 0.08 ± 0.02 a b; 2 | 0.07 ± 0.02 a b; 3 | 0.10 ± 0.02 a b; 1 | 0.06 ± 0.01 a b; 2 | 0.06 ± 0.01 a b; 3 | 0.05 ± 0.01 b |
| Si (mg/kg) | 20.39 ± 3.69 a; 1 | 43.95 ± 2.14 b; 1 | 16.50 ± 0.56 a; 1 | 16.37 ± 2.29 a; 1 | 26.09 ± 11.64 a; 1 | 11.77 ± 0.66 a; 1 | 95.91 ± 6.13 c |
| Sr (mg/Kg) | 1.35 ± 0.04 b; 1 | 1.89 ± 0.03 c; 1 | 1.13 ± 0.03 a; 1 | 1.13 ± 0.06 a; 1 | 1.64 ± 0.01 d; 1 | 1.03 ± 0.03 e; 1 | 0.27 ± 0.03 f |
| S (g/100 g) | 0.06 ± 0.01 a; 1 | 0.05 ± 0.01 a b; 1 | 0.04 ± 0.01 b; 1 | 0.01 ± 0.01 c; 1 | 0.01 ± 0.02 c; 1 | 0.01 ± 0.01 c; 1 | 0.05 ± 0.01 a b |
| Na (g/100 g) | 0.48 ± 0.02 a; 1 | 0.46 ± 0.02 a; 1 | 0.45 ± 0.01 a b; 1 | 0.27 ± 0.03 c; 1 | 0.31 ± 0.05 c; 1 | 0.36 ± 0.01 b c; 1 | 0.35 ± 0.03 c |
| Ni (mg/kg) | 0.21 ± 0.02 a c; 1 | 0.24 ± 0.01 a; 1 | 0.25 ± 0.01 a; 1 | 0.21 ± 0.01 a c; 1 | 0.16 ± 0.01 c; 1 | 0.21 ± 0.03 a c; 1 | 0.11 ± 0.01 b |
| Zn (mg/Kg) | 7.24 ± 0.11 a; 1 | 6.77 ± 0.21 b; 2 | 6.35 ± 0.30 b; 3 | 6.66 ± 0.10 a b; 1 | 5.70 ± 0.08 c; 2 | 5.19 ± 0.05 d; 3 | 3.70 ± 0.05 e |
Q: gluten-free bread with sourdough quinoa; A: gluten-free bread with sourdough amaranth; BR: gluten-free bread with sourdough brown rice; QM: gluten-free bread with sourdough quinoa and Moringa oleifera; AM: gluten-free bread with sourdough amaranth and Moringa oleifera; BRM: Gluten-free bread with sourdough amaranth and Moringa oleifera; COM: commercial gluten-free bread. Nd: not identified. Different subscript letters indicate significant differences (p < 0.005) between columns a−f. Different subscripts indicate differences between samples depending on the sourdough 1−3.
Table 8.
Amino acid profiles of the gluten-free bread (mean ± standard deviation values).
| Amino Acids (mg/100 g) | Samples | ||||||
|---|---|---|---|---|---|---|---|
| QM | AM | BRM | Q | A | BR | COM | |
| Essential amino acids | |||||||
| Histidine | 131.26 ± 9.02 a; 1 | 108.80 ± 14.02 a; 1 | 104.14 ± 17.34 a; 1 | 239.64 ± 32.91 b; 1 | 233.36 ± 45.10 b; 1 | 239.79 ± 6.36 b; 1 | 121.06 ± 7.24 a |
| Arginine | 455.19 ± 39.56 a b; 1 | 366.18 ± 56.67 a; 1 | 398.37 ± 59.32 a; 2 | 557.89 ± 22.24 b; 1 | 633.71 ± 29.70 b; 1 | 758.92 ± 44.01 c; 2 | 412.19 ± 22.19 a |
| Threonine | 197.03 ± 16.58 a; 1 | 159.64 ± 21.04 a; 1 | 155.09 ± 21.55 a; 1 | 330.23 ± 32.65 b; 1 | 317.05 ± 69.02 b; 1 | 347.75 ± 13.06 b | 173.89 ± 11.43 a |
| Valine | 198.76 ± 16.70 a; 1 | 142.75 ± 25.41 a; 2 | 149.60 ± 19.00 a; 1 | 423.28 ± 12.04 b; 1 | 357.38 ± 35.37 c; 2 | 432.27 ± 9.97 b; 1 | 168.37 ± 16.83 a |
| Methionine | 72.42 ± 2.30 a; 1 | 77.68 ± 5.00 a; 1 | 55.85 ± 38.85 a; 1 | 58.19 ± 19.48 a; 1 | 56.90 ± 10.70 a; 1 | 54.24 ± 2.11 a; 1 | 66.79 ± 4.40 a |
| Lysine | 267.46 ± 29.00 a; 1 | 215.39 ± 21.84 a; 2 | 223.56 ± 8.08 a; 1 | 414.43 ± 6.76 b; 1 | 346.05 ± 17.67 c; 2 | 440.70 ± 38.32 b; 1 | 252.63 ± 31.58 a |
| Isoleucine | 184.09 ± 36.70 a; 1 | 113.57 ± 24.81 b; 2 | 127.05 ± 24.92 b; 1 2 | 365.94 ± 11.47 c; 1 | 301.75 ± 12.12 c; 1 2 | 354.96 ± 27.05 c; 2 | 144.79 ± 27.26 a b |
| Leucine | 322.62 ± 31.53 a b c; 1 | 247.41 ± 58.11 b; 2 | 245.13 ± 22.35 a b; 1 2 | 415.92 ± 10.81 c; 1 | 360.54 ± 6.28 a c; 2 | 439.29 ± 56.49 c; 1 2 | 270.64 ± 26.52 a b |
| Phenylalanine | 553.40 ± 46.84 a; 1 | 442.41 ± 20.07 c; 2 | 543.54 ± 14.46 a; 1 2 | 249.32 ± 20.33 b; 1 | 203.27 ± 32.62 b; 2 | 197.06 ± 26.26 b; 1 2 | 213.73 ± 6.76 b |
| Total EAA | 2372.37 ± 178.66 a c; 1 | 1873.83 ± 211.66 b c; 2 | 1994.18 ± 204.14 c; 1 | 3055.07 ± 109.31 d; 1 | 2810.00 ± 205.23 d; 2 | 3264.99 ± 146.97 d; 1 | 1824.08 ± 150.28 b c |
| Non-essential amino acids | |||||||
| Serine | 262.76 ± 25.86 a; 1 | 232.54 ± 16.18 a; 1 | 217.63 ± 31.07 a; 1 | 383.80 ± 10.85 b; 1 | 348.77 ± 38.72 b; 1 | 393.80 ± 39.38 b; 1 | 230.83 ± 24.41 a |
| Asparagine | 516.11 ± 52.79 a b; 1 | 397.68 ± 53.98 b; 2 | 414.13 ± 41.09 b; 2 | 757.94 ± 35.79 c; 1 | 638.76 ± 46.39 a c; 2 | 658.72 ± 14.69 c; 2 | 446.27 ± 59.08 b |
| Glutamic acid | 824.61 ± 72.28 a b; 1 | 651.26 ± 97.66 a; 1 | 688.90 ± 68.48 a; 1 | 1012.19 ± 26.53 b; 1 | 984.45 ± 67.31 b; 1 | 1207.97 ± 136.12 c b; 1 | 709.62 ± 115.04 a |
| Glycine | 280.00 ± 25.10 a b; 1 | 241.38 ± 30.31 b; 1 | 224.60 ± 32.35 b; 1 | 361.85 ± 25.88 a; 1 | 356.23 ± 48.72 a; 1 | 361.20 ± 16.73 a; 1 | 254.60 ± 23.82 b |
| Alanine | 111.00 ± 10.98 a d; 1 | 50.02 ± 30.43 d; 2 | 99.16 ± 33.59 a d; 3 | 449.83 ± 19.59 b; 1 | 323.24 ± 9.49 c; 2 | 354.37 ± 26.57 c; 3 | 122.35 ± 20.83 a |
| Proline | 278.46 ± 35.13 a; 1 | 192.14 ± 14.01 a; 2 | 171.99 ± 24.69 a; 2 | 555.71 ± 63.13 b; 1 | 491.28 ± 65.74 b; 2 | 521.55 ± 20.42 b; 2 | 240.00 ± 25.32 a |
| Cysteine | 83.43 ± 8.06 a; 1 | 133.74 ± 29.61 b; 2 | 137.40 ± 22.39 b; 2 | 59.12 ± 7.16 a; 1 | 75.05 ± 12.52 a; 2 | 63.18 ± 1.01 a; 2 | 69.04 ± 6.73 a |
| Tyrosine | 87.92 ± 9.13 a; 1 2 | 62.02 ± 14.31 a; 2 | 71.01 ± 11.47 a; 1 | 182.36 ± 20.37 b; 1 2 | 194.14 ± 10.17 b c; 2 | 236.45 ± 25.07 c; 1 | 74.56 ± 8.42 a |
| Hydroxyproline | 5.08 ± 2.02 a; 1 | 2.83 ± 1.98 a b; 1 | 4.06 ± 0.64 a c; 1 | 1.77 ± 0.10 b c; 1 | 1.83 ± 1.01 b c; 1 | 2.46 ± 0.12 a c; 1 | 0.26 ± 0.09 b |
| Taurine | nd | nd | nd | nd | nd | nd | nd |
| Total NEAA | 2449.37 ± 224.53 a; 1 | 1963.60 ± 252.36 a; 2 | 2028.88 ± 236.29 a; 1 2 | 3764.57 ± 98.07 b; 1 | 3413.75 ± 280.92 b; 2 | 3799.70 ± 279.34 b; 1 2 | 2147.54 ± 235.50 a |
| Total AA | 4821.74 ± 399.53 a; 1 | 3837.43 ± 463.93 a; 2 | 4023.06 ± 439.94 a; 1 2 | 6819.65 ± 204.87 b; 1 | 6223.76 ± 484.31 b; 2 | 7064.69 ± 420.17 b; 1 2 | 3971.62 ± 383.11 a |
Q: sourdough quinoa; A: sourdough amaranth; BR: sourdough brown rice; QM: sourdough quinoa and Moringa oleifera; AM: sourdough amaranth and Moringa oleifera; BRM: sourdough amaranth and Moringa oleifera; COM: commercial. Different subscript letters indicate significant differences (p < 0.005) between columns a–d. NEAA: non-essential amino acids; AA: essential amino acids. Nd: not identified. Different subscripts indicate differences between samples depending on the sourdough 1–3.
Table 9.
Fatty acid profiles (mg 100 g−1) of the gluten-free breads.
| Fatty Acids | Sample | ||||||
|---|---|---|---|---|---|---|---|
| QM | AM | BRM | Q | A | BR | COM | |
| C4:0 | 2.85 ± 0.25 a; 1 | 3.60 ± 0.38 b; 2 | 1.91 ± 0.02 c; 3 | 0.00 ± 0.00 d; 1 | 0.00 ± 0.00 d; 2 | 0.00 ± 0.00 d; 3 | 2.49 ± 0.36 a c |
| C6:0 | 1.64 ± 0.14 a; 1 | 2.18 ± 0.28 b; 2 | 1.14 ± 0.01 c d; 1 | 0.73 ± 0.10 d; 1 | 0.99 ± 0.03 c d; 2 | 0.85 ± 0.20 c d; 1 | 1.41 ± 0.24 a c |
| C8:0 | 1.63 ± 0.15 a b; 1 | 2.01 ± 0.20 b; 2 | 1.12 ± 0.03 c; 1 | 0.84 ± 0.11 c; 1 | 1.28 ± 0.16 a c; 2 | 1.07 ± 0.24 c; 1 | 11.23 ± 0.24 d |
| C10:0 | 1.07 ± 0.11 a b; 1 2 | 1.40 ± 0.18 b; 2 | 0.73 ± 0.03 a c; 1 | 0.29 ± 0.26 c; 1 2 | 0.36 ± 0.31 c; 2 | 0.26 ± 0.22 c; 1 | 8.17 ± 0.24 d |
| C11:0 | 0.00 ± 0.00 a; 1 | 0.00 ± 0.00 a; 1 | 0.00 ± 0.00 a; 1 | 0.00 ± 0.00 a; 1 | 0.00 ± 0.00 a; 1 | 0.00 ± 0.00 a; 1 | 0.00 ± 0.00 a |
| C12:0 | 0.88 ± 0.07 a; 1 | 1.08 ± 0.12 a; 2 | 0.62 ± 0.03 b; 3 | 0.40 ± 0.04 c; 1 | 0.49 ± 0.09 b c; 2 | 0.39 ± 0.04 c; 3 | 0.90 ± 0.09 a |
| C13:0 | 0.00 ± 0.00 a; 1 | 0.00 ± 0.00 a; 1 | 0.00 ± 0.00 a; 1 | 0.00 ± 0.00 a; 1 | 0.00 ± 0.00 a; 1 | 0.00 ± 0.00 a; 1 | 0.00 ± 0.00 a |
| C14:0 | 3.14 ± 0.09 a b; 1 2 | 3.42 ± 0.15 b; 2 | 2.50 ± 0.08 c; 1 | 3.12 ± 0.21 a b; 1 2 | 3.00 ± 0.06 a; 2 | 3.47 ± 0.03 a b; 1 | 3.35 ± 0.19 a b |
| C14:1n-5 | 0.00 ± 0.00 a; 1 | 0.00 ± 0.00 a; 1 | 0.00 ± 0.00 a; 1 | 0.00 ± 0.00 a; 1 | 0.00 ± 0.00 a; 1 | 0.00 ± 0.00 a; 1 | 0.00 ± 0.00 a |
| C15:0 | 1.64 ± 0.04 a; 1 | 1.73 ± 0.05 a; 1 | 1.16 ± 0.02 b; 2 | 1.56 ± 0.15 a; 1 | 1.53 ± 0.04 a b; 1 | 1.42 ± 0.32 a b; 2 | 0.75 ± 0.02 c |
| C15:1n-5 | 0.00 ± 0.00 a; 1 | 0.00 ± 0.00 a; 1 | 0.00 ± 0.00 a; 1 | 0.00 ± 0.00 a; 1 | 0.00 ± 0.00 a; 1 | 0.00 ± 0.00 a; 1 | 0.00 ± 0.00 a |
| C16:0 | 373.82 ± 11.24 a; 1 | 482.83 ± 0.93 b c; 2 | 326.91 ± 16.05 c; 1 | 473.07 ± 28.14 c; 1 | 510.11 ± 16.91 c; 2 | 556.47 ± 6.23 d; 1 | 195.95 ± 16.87 e |
| C16:1n-7 | 20.18 ± 0.47 a; 1 | 27.80 ± 0.21 b e; 2 | 17.31 ± 0.65 a; 1 | 24.30 ± 1.07 c; 1 | 28.17 ± 2.70 e; 2 | 30.49 ± 0.58 e; 1 | 3.57 ± 0.27 f |
| C17:0 | 2.24 ± 0.02 a b; 1 | 2.83 ± 0.06 b; 2 | 1.90 ± 0.15 c a; 1 | 1.61 ± 0.04 c a; 1 | 1.84 ± 0.55 c a; 2 | 1.80 ± 0.25 c a; 1 | 1.55 ± 0.09 c |
| C17:1n-7 | 0.00 ± 0.00 a; 1 | 0.00 ± 0.00 a; 1 | 0.00 ± 0.00 a; 1 | 0.00 ± 0.00 a; 1 | 0.00 ± 0.00 a; 1 | 0.00 ± 0.00 a; 1 | 0.00 ± 0.00 a |
| C18:0 | 61.29 ± 1.13 a; 1 | 89.39 ± 0.46 b; 2 | 66.47 ± 1.82 a; 2 | 124.94 ± 8.76 c; 1 | 124.39 ± 1.11 c; 2 | 143.56 ± 1.32 d; 2 | 90.40 ± 5.58 b |
| 9t-C18:1 | 1.33 ± 0.04 a; 1 | 1.68 ± 0.16 b; 2 | 0.98 ± 0.02 c; 3 | 0.00 ± 0.00 a; 1 2 3 | 0.00 ± 0.00 a; 1 2 3 | 0.00 ± 0.00 a; 1 2 3 | 1.21 ± 0.11 a |
| 11t-C18:1 | 0.00 ± 0.00 a; 1 2 | 0.00 ± 0.00 a; 1 2 | 0.00 ± 0.00 a; 1 2 | 3.92 ± 0.64 b; 1 | 6.06 ± 1.27 d; 2 | 4.59 ± 0.55 b d; 1 2 | 0.00 ± 0.00 a |
| C18:1n-9 | 1211.26 ± 21.30 e; 1 | 1585.44 ± 5.65 a; 2 | 1020.77 ± 28.00 b; 1 | 1676.39 ± 107.74 a c; 1 | 1841.46 ± 99.77 c; 2 | 2045.27 ± 12.67 d; 1 | 909.10 ± 55.57 b |
| C18:1n-7 | 52.51 ± 1.22 a; 1 | 68.43 ± 0.16 b; 2 | 42.28 ± 0.98 c; 1 | 56.37 ± 4.24 a d; 1 | 59.97 ± 4.26 d; 2 | 67.94 ± 3.04 b; 1 | 19.89 ± 1.04 e |
| C18:2n-6 | 726.22 ± 11.37 a b, 1 | 777.80 ± 4.31 b c; 1 | 605.49 ± 24.46 a; 1 | 888.88 ± 63.75 c d; 1 | 849.78 ± 13.11 a c d; 1 | 937.65 ± 13.33 d; 1 | 1439.02 ± 109.71 e |
| C18:3n-6 | 0.46 ± 0.03 a; 1 | 0.00 ± 0.00 b; 2 | 0.00 ± 0.00 b; 2 | 0.00 ± 0.00 b; 1 2 | 0.00 ± 0.00 b; 1 2 | 0.00 ± 0.00 b; 1 2 | 0.00 ± 0.00 b |
| C18:3n-3 | 47.22 ± 0.52 a b; 1 | 41.92 ± 0.20 b c; 1 | 32.53 ± 0.99 c; 2 | 52.62 ± 4.56 a b; 1 | 48.84 ± 9.64 a b; 1 | 52.93 ± 1.94 a b; 2 | 17.75 ± 0.91 d |
| 9t,11t-C18:2 (CLA) | 4.57 ± 0.37 a b; 1 | 6.02 ± 0.74 b; 2 | 3.09 ± 0.26 c d; 1 | 1.67 ± 0.33 d; 1 | 2.50 ± 0.45 d; 2 | 2.45 ± 0.57 a d; 1 | 4.47 ± 0.79 c |
| C20:0 | 15.79 ± 0.30 a; 1 | 20.29 ± 0.09 e; 2 | 16.36 ± 0.59 a; 1 | 26.90 ± 2.10 b; 1 | 30.64 ± 0.65 c; 2 | 29.26 ± 0.98 b c; 1 | 7.96 ± 0.22 d |
| C20:1n-9 | 16.45 ± 0.29 a; 1 | 14.89 ± 0.31 a; 1 2 | 11.26 ± 0.36 b; 2 | 18.10 ± 2.35 a; 1 | 16.83 ± 1.35 a; 1 2 | 18.04 ± 1.78 a; 2 | 6.18 ± 0.25 c |
| C20:2n-6 | 1.56 ± 0.06 a b; 1 | 1.49 ± 0.11 a b; 1 | 1.04 ± 0.04 b d; 1 | 1.81 ± 0.24 a; 1 | 2.04 ± 0.36 a; 1 | 1.88 ± 0.33 a; 1 | 0.68 ± 0.03 d |
| C21:0 | 1.10 ± 0.05 a b c; 1 | 1.40 ± 0.05 b d; 2 | 0.91 ± 0.04 c; 1 | 1.42 ± 0.44 b d; 1 | 1.72 ± 0.12 d; 2 | 1.50 ± 0.03 a b d; 1 | 0.61 ± 0.08 c |
| C20:3n-6 | 0.00 ± 0.00 a; 1 | 0.00 ± 0.00 a; 1 | 0.00 ± 0.00 a; 1 | 0.00 ± 0.00 a; 1 | 0.00 ± 0.00 a; 1 | 0.00 ± 0.00 a; 1 | 0.00 ± 0.00 a |
| C20:4n-6 | 0.00 ± 0.00 a; 1 | 0.00 ± 0.00 a; 1 | 0.00 ± 0.00 a; 1 | 0.00 ± 0.00 a; 1 | 0.00 ± 0.00 a; 1 | 0.00 ± 0.00 a; 1 | 0.00 ± 0.00 a |
| C20:3n-3 | 0.98 ± 0.03 a; 1 | 0.73 ± 0.03 b; 2 | 0.41 ± 0.01 c; 3 | 0.00 ± 0.00 d; 1 2 3 | 0.00 ± 0.00 d; 1 2 3 | 0.00 ± 0.00 d; 12 3 | 0.39 ± 0.37 |
| C22:0 | 10.49 ± 0.20 a; 1 | 10.91 ± 0.17 a; 1 | 8.73 ± 0.37 a; 1 | 15.58 ± 1.10 b; 1 | 15.11 ± 1.99 b; 1 | 16.35 ± 0.32 b; 1 | 20.27 ± 0.72 c |
| C20:5n-3 | 0.00 ± 0.00 a; 1 | 0.00 ± 0.00 a; 1 | 0.00 ± 0.00 a; 1 | 0.00 ± 0.00 a; 1 | 0.00 ± 0.00 a; 1 | 0.00 ± 0.00 a; 1 | 0.00 ± 0.00 a |
| C22:1n-9 | 6.90 ± 0.23 a; 1 | 4.35 ± 0.04 b; 2 | 3.81 ± 0.28 b c; 3 | 3.58 ± 0.36 c; 1 | 1.82 ± 0.14 d; 2 | 1.55 ± 0.35 d; 3 | 3.61 ± 0.32 b c |
| C22:2n-6 | 0.80 ± 0.18 b; 1 | 0.76 ± 0.22 b; 1 | 0.38 ± 0.03 c; 2 | 0.00 ± 0.00 a; 1 2 3 | 0.00 ± 0.00 a; 1 2 3 | 0.00 ± 0.00 a; 1 2 3 | 0.00 ± 0.00 a |
| C23:0 | 2.00 ± 0.08 a b; 1 | 2.36 ± 0.05 a; 2 | 1.55 ± 0.06 b; 1 | 3.10 ± 0.34 c; 1 | 3.42 ± 0.22 c; 2 | 3.19 ± 0.16 c; 1 | 1.16 ± 0.04 b |
| C24:0 | 7.17 ± 0.25 a; 1 | 7.67 ± 0.13 a; 1 | 5.92 ± 0.21 a; 1 | 11.06 ± 1.31 b; 1 | 11.21 ± 0.84 b; 1 | 12.44 ± 1.24 b; 1 | 7.25 ± 0.08 a |
| C22:5n-3 | 0.00 ± 0.00 a; 1 | 0.00 ± 0.00 a; 1 | 0.00 ± 0.00 a; 1 | 0.00 ± 0.00 a; 1 | 0.00 ± 0.00 a; 1 | 0.00 ± 0.00 a; 1 | 0.00 ± 0.00 a |
| C24:1n-9 | 0.00 ± 0.00 a; 1 | 0.00 ± 0.00 a; 1 | 0.00 ± 0.00 a; 1 | 0.00 ± 0.00 a; 1 | 0.00 ± 0.00 a; 1 | 0.00 ± 0.00 a; 1 | 0.00 ± 0.00 a |
| C22:6n-3 | 1.18 ± 0.12 a; 1 | 1.08 ± 0.16 a; 1 | 0.56 ± 0.05 a c; 2 | 0.35 ± 0.61 c; 1 | 0.00 ± 0.00 b; 1 | 0.00 ± 0.00 b; 2 | 0.74 ± 0.02 a |
| SFA | 486.76 ± 10.39 a; 1 | 633.10 ± 2.26 b; 2 | 437.95 ± 18.65 a; 1 | 664.63 ± 40.61 b c; 1 | 706.10 ± 6.14 c; 2 | 772.02 ± 6.14 d; 1 | 353.47 ± 20.27 e |
| MUFA | 1288.49 ± 22.74 a; 1 | 1686.58 ± 5.06 b; 2 | 1083.54 ± 29.43 c; 1 | 1764.35 ± 112.94 b c; 1 | 1939.23 ± 100.40 c; 2 | 2151.60 ± 10.86 d; 1 | 935.21 ± 56.70 c |
| PUFA | 783.41 ± 12.53 a c; 1 | 830.33 ± 3.15 a b; 1 | 643.81 ± 25.23 c; 1 | 945.50 ± 68.10 b; 1 | 903.54 ± 15.71 a b; 1 | 994.99 ± 16.56 b; 1 | 1463.49 ± 110.56 d |
| n3 | 53.89 ± 0.72 a b; 1 | 53.91 ± 0.33 b c; 1 2 | 41.82 ± 1.28 c; 2 | 68.55 ± 5.44 a; 1 | 63.96 ± 11.43 a b; 1 2 | 69.28 ± 2.26 a; 2 | 18.77 ± 1.55 c |
| n6 | 729.01 ± 11.60 a b; 1 | 780.49 ± 4.00 b; 1 | 607.10 ± 24.52 a; 1 | 890.47 ± 64.02 c; 1 | 851.87 ± 13.41 b c; 1 | 939.22 ± 15.27 c; 1 | 1440.06 ± 109.77 d |
| Total | 2578.82 ± 40.21 a; 1 | 3166.01 ± 6.10 b d; 2 | 2178.17 ± 69.17 c; 1 | 3392.79 ± 211.89 d e; 1 | 3563.94 ± 132.18 e; 2 | 3934.89 ± 0.64 f; 1 | 2760.52 ± 145.25 a |
Q: sourdough quinoa; A: sourdough amaranth; BR: sourdough brown rice; QM: sourdough quinoa and Moringa oleifera; AM: sourdough amaranth and Moringa oleifera; BRM: sourdough amaranth and Moringa oleifera; COM: commercial. Different subscript letters indicate significant differences (p < 0.005) between columns a–f. SFA: saturated fatty acids; MUFA: monounsaturated fatty acids; PUFA: polyunsaturated fatty acids. Different subscripts indicate differences between samples depending on the sourdough 1–3.
Table 10.
Folate vitamers (FA, THF, 5M-THF, 5F-THF expressed as µg/100 g FW) and total folate (expressed as µg folic acid equivalents/100 g FW).
Table 10.
Folate vitamers (FA, THF, 5M-THF, 5F-THF expressed as µg/100 g FW) and total folate (expressed as µg folic acid equivalents/100 g FW).
| Sample | Folate Vitaminer | ||||
|---|---|---|---|---|---|
| FA C19H19N7O6 | THF C19H23N7O6 | 5M-THF C20H25N7O6 | 5F-THF C20H23N7O7 | Total Folate Content | |
| QM | 122.04 ± 4.52 d; 1 | 123.31 ± 7.26 a; 2 | 766.09 ± 12.73 b; 1 | 384.42 ± 0.99 a; 1 | 1395.86 ± 14.48 a; 1 |
| AM | 882.53 ± 35.98 c; 2 | 449.17 ± 3.60 c; 1 | 2660.99 ± 41.51 a; 2 | 450.89 ± 6.07 b; 2 | 4443.58 ± 8.00 b; 2 |
| BRM | 956.91 ± 11.73 c; 3 | 280.02 ± 3.71 a; 3 | 2074.29 ± 29.98 c; 2 | 493.19 ± 6.87 c; 3 | 3804.42 ± 36.91 c; 3 |
| Q | 35.39 ± 1.04 a; 1 | 56.95 ± 0.30 b; 2 | 628.05 ± 20.34 d; 1 | 274.85 ± 2.94 d; 1 | 995.25 ± 16.67 d; 1 |
| A | 66.79 ± 0.80 b; 2 | 125.41 ± 4.95 a; 1 | 2649.11 ± 53.96 a; 2 | 111.19 ± 1.00 e; 2 | 2952.50 ± 48.80 e; 2 |
| BR | 12.60 ± 0.61 a; 3 | 104.32 ± 0.21 d; 3 | 1682.26 ± 27.46 e; 2 | 345.57 ± 16.97 f; 3 | 2144.76 ± 9.67 f; 3 |
| COM | 25.57 ± 0.68 a | 33.86 ± 1.90 e | 495.06 ± 4.15 f | 85.48 ± 0.59 g | 639.96 ± 3.37 g |
Q: sourdough quinoa; A: sourdough amaranth; BR: sourdough brown rice; QM: sourdough quinoa and Moringa oleifera; AM: sourdough amaranth and Moringa oleifera; BRM: amaranth and Moringa oleifera; COM: commercial. Different subscript letters indicate significant differences (p < 0.005) between samples a–g. FA: folic acid; 5MTHF: 5-methyl-5,6,7,8-tetrahydrofolic acid; THF: 5,6,7,8-tetrahydrofolic acid; 5FTHF: 5-Formyl-5,6,7,8-tetrahydrofolic acid; FW: fresh weight. Different subscripts indicate differences between samples depending on the sourdough 1–3.
Disclaimer/Publisher’s Note: The statements, opinions and data contained in all publications are solely those of the individual author(s) and contributor(s) and not of MDPI and/or the editor(s). MDPI and/or the editor(s) disclaim responsibility for any injury to people or property resulting from any ideas, methods, instructions or products referred to in the content. |
© 2023 by the authors. Licensee MDPI, Basel, Switzerland. This article is an open access article distributed under the terms and conditions of the Creative Commons Attribution (CC BY) license (https://creativecommons.org/licenses/by/4.0/).
Share and Cite
MDPI and ACS Style
Peñalver, R.; Ros, G.; Nieto, G. Development of Functional Gluten-Free Sourdough Bread with Pseudocereals and Enriched with Moringa oleifera. Foods 2023, 12, 3920. https://doi.org/10.3390/foods12213920
AMA Style
Peñalver R, Ros G, Nieto G. Development of Functional Gluten-Free Sourdough Bread with Pseudocereals and Enriched with Moringa oleifera. Foods. 2023; 12(21):3920. https://doi.org/10.3390/foods12213920
Chicago/Turabian StylePeñalver, Rocío, Gaspar Ros, and Gema Nieto. 2023. "Development of Functional Gluten-Free Sourdough Bread with Pseudocereals and Enriched with Moringa oleifera" Foods 12, no. 21: 3920. https://doi.org/10.3390/foods12213920
Note that from the first issue of 2016, this journal uses article numbers instead of page numbers. See further details here.