
Effect of Fat to Lean Meat Ratios on the Formation of Volatile Compounds in Mutton Shashliks
by
Mingcheng Zhang
1,†,
Mingyang Li
1,†,
Fangfang Bai
1,
Wensheng Yao
1,
Litang You
2 and
Dengyong Liu
1,3,* 1
College of Food Science and Technology, Bohai University, Jinzhou 121013, China
2
Anshan Jiuguhe Food Co., Ltd., Anshan 114100, China
3
Jiangsu Collaborative Innovation Center of Meat Production and Processing, Quality and Safety Control, Nanjing 210095, China
*
Author to whom correspondence should be addressed.
†
These authors contributed equally to this work.
Foods 2023, 12(10), 1929; https://doi.org/10.3390/foods12101929
Submission received: 11 April 2023
/
Revised: 28 April 2023
/
Accepted: 4 May 2023
/
Published: 9 May 2023
(This article belongs to the Special Issue Meat Quality and Microbial Analysis II)
Abstract
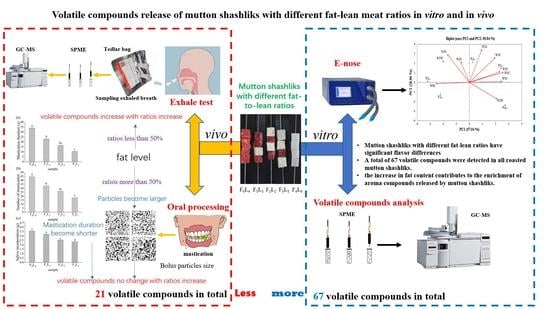
:This study aimed to investigate the release of volatile compounds in mutton shashliks (named as FxLy, x-fat cubes: 0-4; y-lean cubes: 4-0) with different fat–lean ratios before and during consumption, respectively. In total, 67 volatile compounds were identified in shashliks using gas chromatography/mass spectrometry. Aldehyde, alcohol, and ketone were the major volatile substances, accounting for more than 75% of the total volatile compounds. There were significant differences in the volatile compounds of mutton shashliks with different fat–lean ratios. With the increase of the fat content, the types and content of volatile substances released also increase. However, when the percentage of fat exceeded 50%, the number of furans and pyrazine, which were characteristic of the volatile compounds of roasted meat, was decreased. The release of volatiles during the consumption of mutton shashliks was measured using the exhaled breath test and the results showed that adding an appropriate amount of fat (<50%) helps to enrich the volatile compound components in the mouth. However, shashliks with higher fat–lean ratios (>2:2) shorten the mastication duration and weaken the breakdown of bolus particles in the consumption process, which is not conducive to the release potential of volatile substances. Therefore, setting the fat to lean ratio to 2:2 is the best choice for making mutton shashliks, as it (F2L2) can provide rich flavor substances for mutton shashliks before and during consumption.
1. Introduction
Mutton shashlik is a popular food in China because of its unique flavor [1]. These unique flavors are related to the volatile compounds released by mutton during roasting. Changes that occur in meat roasting include pyrolysis of peptides and amino acids, degradation of sugar and ribonucleotides, Maillard’s and Strecker’s reactions, lipid oxidation, as well as the degradation of thiamine and fats, and these reactions promote the production of volatile compounds [2,3]. In general, the type and content of these volatile compounds are often key factors affecting consumers’ preference for roasted meat aroma.
There are both lean and fat cubes in mutton shashlik and the assignment of the fat–lean ratio is considered to be an important factor affecting the odor intensity of meat products [4,5,6]. This is because meat flavor is created by compounds that are derived from either lean or fat tissues. There is a difference in the contribution of fat and lean meat to the flavor of roast meat, which can be divided into two categories: the common meat flavor to all species of animals and the specific flavor of animals [7,8]. Sulfur-containing amino acids in lean meat, such as cystine and cysteine, contribute to the volatile compounds of roasted meat; however, it is generally thought that these contributions mainly involve the common meat flavor [9]. For example, volatile compounds isolated from the lean mutton as well as the physical data obtained for compounds completely characterized are similar to those obtained from lean beef and pork, but do not reflect the unique flavor of mutton [8]. However, fat acts as a substrate for the formation of odor-active volatiles from lipid oxidation, and its hydrocarbons, alcohols, ketones, and aldehydes are critical for producing the characteristic flavor of roasted meat [6]. Due to the significant difference in volatile substances produced by fat and lean meat, for the mutton shashlik, the different proportions of fat and lean meat added may have a significant impact on the flavor of lamb skewers. However, in daily life, the proportion of fat and lean meat used for mutton shashlik is uncertain and arbitrary. Therefore, it is necessary to clarify the proportion of fat and lean meat added to mutton shashlik through research, in order to promote the release of volatile flavor compounds and enhance consumers’ perception of aroma.
Currently, the analysis of volatile flavor compounds in food is mostly focused on the food before intake. People’s perception of these volatile substances is carried out through ortho-nasal perception. In fact, humans’ perception of aroma includes not only ortho-nasal perception, but also retro-nasal perception [10]. Retro-nasal perception occurs in humans while eating and the volatile compounds transfer from food to saliva, then pass through the oro-nasal cavity and finally reach the olfactory receptor, forming the retro-nasal perception [11]. Currently, various studies on the ortho-nasal aroma of roasted mutton have been conducted; however, studies on the retro-nasal perception of roasted mutton/mutton were insufficient. In fact, retro-nasal perception plays a crucial role in human perceptions of different food aromas because the flavor characteristics of food consumption are primarily detected in the retro-nasal cavity [12]. Therefore, a comprehensive understanding of the release of volatile compounds from mutton shashliks should be studied from two aspects: pre-consumption and during consumption.
The aim of this work was to investigate the release of volatile compounds from mutton shashliks with different fat–lean meat ratios. Therefore, in this study, in addition to analyzing the volatile flavor compounds that can be released into the environment after roasting, the release of volatile compounds from mutton shashliks during oral processing is also emphasized. At the same time, by measuring the changes in the oral processing parameters of mutton shashliks caused by the different proportions of fat and lean meat, the reasons for the differences in volatile substances released in the oral cavity were deeply analyzed. This study could provide a comprehensive and clear understanding of the changes in the aroma release of mutton shashliks with different fat to lean ratios before and during consumption, providing a theoretical basis for improving the flavor of mutton shashliks.
2. Materials and Methods
2.1. Mutton Shashlik Preparation
The hindquarter meat and the belly fat from 12-month-old Sunit sheep were purchased from Yang-yang Animal Husbandry Co., Ltd. (Inner Mongolia Autonomous Region, China), and was transported to the laboratory through the cold chain (−18 °C) as the raw material to produce mutton shashliks. The feeding conditions of these sheep before slaughter were the same, and the slaughtering was performed according to the China standard protocols of GB 2707–2016. Hindquarter meat (20.0 kg, boneless mutton, 6–7 kg per batch) and the belly fat (16.0 kg, 5–6 kg per batch) were randomly selected from 20 male sheep carcasses (31.5 ± 1.5 kg) and randomly assigned to each batch of mutton shashliks. The fat and lean meat were all cut into 10 × 10 × 10 mm3 cubes, which were skewered on an iron skewer (20 cm length) with different fat–lean ratios. The ratio of fat and lean meat in different samples were set as shown in Figure 1: 4 lean cubes (F0L4), 1 fat cube, and 3 lean cubes (F1L3); 2 fat cubes and 2 lean cubes (F2L2); 3 fat cubes and 1 lean cube (F3L1); and 4 pieces of fat (F4L0). However, mutton shashliks with all fat do not exist in real-life consumer contexts, and this sample was only used as a control. In total, 606 mutton shashliks were prepared for each batch (150 for F0L4, F1L3, F2L2, and F3L1, and 6 for F4L0) for each experiment (15 for E-Nose, 15 for GC-MS, and 576 for oral processing parameter determination and exhaled breath analysis). The raw shashliks were frozen (−18 °C) and taken out, thawed, and roasted before each test (same processing conditions). The shashliks were roasted in an electric oven 10 cm from the heating tub (NB-HM3810) at 210 ± 5 °C for 12 min while turning over the shashliks every 30 s. For all the roasted mutton shashliks, the moisture content, crude fat, and crude protein were determined based on the method as described by the AOAC Method 930.15 (2000), the AOAC Method 920.39 (2000), and the AOAC Method 954.01 (2000) [13].
All four roasted meat (fat and/or lean meat) cubes were separated from the iron skewers and cut into minced meat (approximately 1–2 mm3). The minced meat was homogeneously mixed and put into a cone of material, which was then flattened as evenly as possible. The material was then divided into quarters, whereupon two opposite quarters were discarded. The remaining two quarters were recombined, and we repeated the above operation until the weight of the remaining sample met the test requirements. These minced meat samples were used for the subsequent E-Nose analysis and GC-MS testing.
2.2. E-Nose Analysis
The E-Nose device PEN3 system (Win Muster Air-sense Analytic Inc., provided by AIRSENSE Company, Schwerin, Germany) consisted of 10 sensor probes, including W1C (aromatic compounds), W5S (nitrogen oxides), W3C (ammonia and aromatic compounds), W6S (hydrogen), W5C (alkanes and aromatics), W1S (methane, broad range of compounds), W1W (sulfur compounds, terpenes), W2S (alcohols, aldehydes, and ketones), W2W (aromatics and organic sulfur compounds), and W3S (long-chain alkanes) (we have presented this information in the manuscript and submitted it through the Supplementary Materials). Our analysis of the information from the mutton shashliks using an electronic nose was based on Gong’s method [14] with appropriate modifications. All determinations were conducted in triplicate and analyzed using principal component analysis (PCA).
2.3. Volatile Compounds
2.3.1. HS-SPME Analysis of Mutton Shashliks before Consumption
The determination of volatile compounds was carried out according to Vasta’s method [15] with appropriate modifications. GC-MS analysis was operated using an Agilent 7890 A gas chromatograph (Agilent Technologies, Santa Clara, CA, USA) coupled to an Agilent 5973 C mass spectrometer. The following conditions were used: For the SPME analysis, desorption was at 280 °C for 4 min in splitless mode and MS was detected with no solvent delay; the ion source and quadrupole were set at 230 °C and 150 °C, respectively. The mass spectra were obtained in electron ionization mode (70 eV), and the range of mass spectrum scanning was 30–550 m/z.
2.3.2. Identification of Volatile Compounds
All volatile compounds were tentatively identified after comprehensive evaluation by comparing the results with the NIST 14 spectrum library and standard compound linear retention index (LRI) [16]. The semi-quantitative method with cyclohexanone as an internal standard was employed to determine the volatile compounds content. The peak area of volatile flavor substances was compared with that of the internal standard, and the absolute concentration of each substance was calculated. The LRI was calculated based on the retention of a homologous series of n-alkanes (C7–C40).
2.3.3. Subjects
In total, 36 volunteers with a good dental status were recruited to participate in the study, and 12 subjects (5 females and 7 males) were selected for their similar oral physiological parameters (mastication duration, number of mastication cycles, and saliva incorporation) and reproducibility. Each subject participated in two individual sessions of oral processing measurements and exhaled breath collection. The subjects were not allowed to smoke, eat, or drink for one hour before the test session. Prior to the study, each subject was informed of the project and the purpose of the experiment to obtain their signed consent.
2.3.4. Oral Processing Parameters
The oral processing experiment was carried out in the sensory evaluation room, and the mutton shashliks were prepared in an independent preparation room. Each subject was given one freshly prepared shashlik for each oral processing session. Because there are almost no mutton shashliks made entirely of fat meat, the oral processing experiment and subsequent exhaled breath test for F4L0 was not performed in this study.
The subjects were asked to eat all four meat cubes from the same shashliks (60 ± 1 °C, meat cubes weighed, WWmeat, about 8.5 g) in one bite and chew them in a natural way. When the subjects thought they were ready to swallow, they raised their hands, which meant that the oral processing experiment was over. The whole oral processing was recorded by the camera opposite the subjects. From this recording, the total mastication duration and number of mastication cycles (N) were determined. Total mastication duration refers to the time from the beginning of bite to the swallowing point. The number of mastication cycles was defined after a complete opening–occlusion sequence.
2.3.5. Bolus Collection and Saliva Incorporation
Bolus collection and saliva incorporation were performed according to Pematilleke’s method [17] with some modifications. After they raised their hands, the subjects were asked to spit out the boluses and saliva into a pre-weighed plastic container, which was weighed again just after collection to calculate the wet weight of the bolus (WWbolus, g) and the saliva incorporation (Wsaliva, g). During the study, we also considered possible meat juice loss, partial swallows, and particles retained in the mouth after spitting. Therefore, the corrected mass of the bolus (WWtbolus_corrected, g) was calculated according to the following Equation (1):
WWtbolus_corrected = WWtbolus + (DWtmeat − DWtbolus)
DWtmeat represents the dry matter of meat cubes, and DWtbolus represents the dry matter in boluses. The sample was placed in a dry aluminum tray (90 mm in diameter), dried in a drying oven (105 °C) for 2 h (Shanghai Yiheng Instrument Co., Ltd., Shanghai, China), and finally transferred to a dryer to cool to room temperature before weighing. The above procedure was repeated until the difference in weight before and after drying was less than 0.005 g. The moisture content determination was carried out by three independent replicates [18].
The mass of saliva incorporation (WWSalivary incorporation, g) was expressed as the following Equation (2):
WWSalivary incorporation = WWtbolus_corrected − WWmeat
WWmeat represents the wet weight of meat cubes in a whole mutton shashlik.
2.3.6. Sieve Analysis of Meat Bolus
The meat bolus particle size distribution was measured using Pematilleke’s wet sieving method [17] with some modifications. The collected meat bolus was transferred to a beaker containing 100 mL distilled water and was stirred for 2 min with a magnetic stirrer at 200 rpm (Shanghai Tianping Instrument Co., Ltd., Shanghai, China). After suspending in water, each bolus was processed through a series of 5 sieves (0.6, 1.6, 3.0, 4.0, and 5.0 mm; Shaoxing Huafeng Instrument Co., Ltd., Shaoxing, China). Each sieve was eventually oven dried at 105 °C until a constant weight. The result was expressed as a percentage of the mass of the dry matter on each sieve and the combined weight of all the dry matter on the sieves.
2.3.7. Image Analysis of Meat Particles
The 2.0 g sample was weighed from the collected food bolus and placed in a Petri dish (94 mm × 16 mm). Then, 15 mL ethanol (70%) was added to the Petri dish so that the bolus particles could be evenly dispersed. A CCD camera (Shenzhen Medway Vision Technology Co., Ltd., Shenzhen, China) was fixed on a bracket (ES400300, Dongguan LeTV Automation Technology Co., Ltd., Dongguan, China) and used to take pictures of the dispersed food particles. The radius, length, and width of the food particles were obtained by analyzing the image information using the Image-Pro 6.0 software (Media Cybernetics, Silver Spring, MD, USA).
2.4. Exhaled Breath Collection and Analysis
Before exhaled breath collection, we ensured the subjects fully understood the breath collection procedure and signed the informed consent. All breath collection experiments were conducted at a fixed time (9:30 a.m.–11:30 a.m.). The subjects were not allowed to smoke and consume alcohol a day before the test. Before breath collection, the subject needs to stay in the sensory evaluation room for at least 30 min. During the oral processing, the subjects were asked to keep their mouth tightly closed and to wear a nose clip to prevent them from breathing through their nose. When they needed to breathe, they could exhale the gas through into a 1 L Tedlar bag (Restek, Bellefonte, PA, USA). The Tedlar bag was made up of polyvinyl fluoride and a disposable mouthpiece and was inflated and deflated with N2 gas (99.99% purity) three times before the exhalation collection [19]. Then, the subject opens his/her mouth to inhale quickly and continues to chew and breathe until the end of oral processing. After exhalations collection, the valve of the Tedlar bag was immediately tightened to prevent leakage. Such exhalations contained mostly gas in the mouth; however, they also included some air from the respiratory system head space. We selected the Tedlar bag as the eventual sampling system because, according to the literature, they allow predictable results [20]. Simultaneously, the subject rinsed his/her mouth and rested for 15 min before the next collection. Each subject’s breath without food was collected for background correction according to their number of exhalations during oral processing. The subjects were always seated given that body position can change the composition of exhaled breath [21]. Additionally, exhaled breath samples should be stored at 4 °C and used within 12 h.
We penetrated the HS-SPME fiber (75 μm, carboxen/polydimethylsiloxane; Supelco, Bellefonte, PA, USA) into the Tedlar sampling bag and absorbed for 60 min at 40 °C, then we quickly transferred it to the GC-MS for analysis. The subsequent GC-MS analysis operation was the same as that in Section 2.3.1.
2.5. Statistical Analyses
The data were analyzed by the software IBM SPSS 19.0 (SPSS Statistical Software, Inc., Chicago, IL, USA), and the results were expressed through mean ± standard error (SE). Significant differences between means (p < 0.05) were determined by one-way analysis of variance (ANOVA) with Duncan’s multiple comparisons. Three batches of mutton shashliks with different fat–lean meat ratios (replicates) were prepared (cooking procedure was the same), and the experimental measurements were performed in triplicate for each batch. The GC-MS, oral processing parameters (mastication duration, number of mastication, saliva incorporation, and bolus practices analysis), and exhaled breath test for each treatment were analyzed using a mixed model. In this model, each replicate was included as a random effect, and different fat–lean ratios were included as fixed terms. To evaluate the potential of E-Nose to distinguish the odor profiles of roasted mutton shashliks with different fat–lean ratios, PCA was performed using the response values of E-Nose sensors. The data were normalized to make the variables comparable.
3. Results and Discussion
3.1. Moisture, Protein, and Fat Content
Table 1 showed the changes in the moisture, protein, and fat content of mutton shashliks with different fat–lean ratios after roasting. The moisture and protein contents of F0L4 were the highest among the five samples, which were 53.28 g/100 g and 41.17 g/100 g, respectively, but the fat content was the lowest, which was 3.54 g/100 g. When the mutton shashliks had more fat cubes, the fat content of F4L0 significantly increased, while the moisture and protein content gradually decreased until the whole mutton skewer was composed of fat pieces (a hypothetical situation), the moisture content and protein content of F4L0 decreased to 9.09 g/100 g and 1.01 g/100 g, respectively, while the fat content increased to 87.81 g/100 g.
3.2. E-Nose
In this experiment, an electronic nose with ten sensors was used to obtain the odor information of different mutton shashliks. PCA is a statistical technique to reduce input data dimensions and is largely used for feature extraction [14]. It captures the relevant information in a set of input data and provides a lower dimension [22]. Principal component analysis can be used to analyze the electronic nose data, allowing an evaluation of the flavor attributes of shashliks with different fat–lean ratios [23]. As illustrated in Figure 2, the first principal component, PC1, was responsible for 57.04% of the total variation, while 27.80% of the total variance was explained by PC2. The total accumulative variance contribution rate of PC1 and PC2 was 84.84%, indicating that the first two principal components could explain the multi-index odor information of the vast majority of the samples. The figure shows that the distance between the four samples (F4L0, F3L1, F2L2, F1L3) was relatively far, indicating that different fat–lean ratios make the odor attributes of mutton shashliks vary considerably for the first principal component. F0L4 and F1L3 are located on the negative axis of PC1 and were mainly differentiated from the other samples by W6S. This suggested that the shashlik with a high proportion of lean meat (F0L4 and F1L3) contained more hydrogen compounds. When the fat proportion increased, the coordinate point of the samples transferred to the positive axis of PC1. The W2W, W5C, W3C, and W5S sensors provided stronger responses to the F3L1 and F4L0, which indicated that shashliks with a higher fat ratio (F4L0 and F3L1) would release more aromatic and organic sulfur compounds, short chain alkanes, alkane, and aromatics, ammonia and aromatic compounds, and nitrogen oxides. In the PC2, the W1W, W1S, W1C, W3S, and W2S sensors provided stronger responses to the F2L2 compared with F1L3 and F4L0, which suggested that the F2L2 contained more terpenes, inorganic sulfur compounds, methyl compounds, aromatic compounds, long-chain alkanes, alcohols, and carbonyls (aldehydes and ketones). Liu [10] also reported that the predominant odors of roasted lamb contained aldehydes, ketones, and alcohols by flash GC E-Nose. The electronic nose test shows that there are significant differences in the information of the volatile compounds of mutton shashliks with different fat–lean ratios.
3.3. Volatile Compounds of Mutton Shashliks with Different Fat–Lean Ratios
The volatile compounds of roasted shashliks with different fat–lean ratios are shown in Table 2. In total, sixty-seven volatile compounds were detected in all roasted muttons, including twenty-one aldehydes, sixteen alcohols, eight ketones, eight esters, fourteen hydrocarbons, three furans, and two pyrazines, which was similar to the profiles of volatile compounds in roasted mutton shashliks with Xu [6]. Among all the samples, the aldehyde, alcohol, and ketone contents were the highest, accounting for more than 75% of the total volatile substances (F0L4: 75.22%, F1L3: 87.96%, F2L2: 81.25%, F3L1: 83.08%, and F4L0: 82.6%). Among the three volatile compound groups, aldehydes have the highest content, mainly comprising glutaraldehyde, hexanal, heptanaldehyde, and octanal, followed by alcohols (1-octanol-3-ol was the main alcohol in mutton shashliks) and ketones, which is consistent with Liu’s results [24].
Twenty-four volatile compounds were detected in F0L4, including five alcohols, four ketones, one aldehyde, three esters, six hydrocarbons, four furans, one pyrazine, and two others. When fat was added to the shashlik, the volatile compound types of F1L3 significantly increased to thirty-six. Compared with sample F0L4, the shashlik with fat could release a higher abundance of volatile substances, including (E)-2-octal, (E)-2-Nonenal, trans, trans-2,4-nonadienal, Cuminaldehyde, (2E)-2-Decenal, 3-Cyclohexene-1-carboxaldehyde, (E)-2-Hexenol, 1-Nonanol, (E)-2-decen-1-ol, and 2-Cyclopenten-1-one,2-butyl-3-methyl-.
When the proportion of fat and lean meat was equal, the volatile compounds species in F2L2 sharply increased to fifty-five, including fifteen aldehydes, thirteen alcohols, five ketones, eight esters, ten hydrocarbons, one furan, and one pyrazine. Compared with F0L4 and F1L3, nine new odorants were detected in F2L2, including phenylacetaldehyde (honey sweetness), undecanal, lauraldehyde, 3-methyl-6-ethyl-5-octene-1-ol, 2,3-dimethyl-2-cyclopentene-1-one, gamma-caprolactone, ethyl octanoate, and ethyl 4-pentenoate. Alcohols were mainly derived from the oxidative degradation of lipids, while ketones mainly come from the oxidation of unsaturated fatty acids, which could give shashlik a pleasant fruity and flower-like aroma [6]. Therefore, the addition of fat meat plays a considerable role in enriching the aroma profile of mutton shashliks. After all, fat is the main source of mutton’s characteristic flavor, and you cannot get the unique flavor of roast lamb from lean meat alone [25]. Wasserman and Talley [26] found that only a few panels could correctly identify cooked lean mutton; however, the proportion of correct identifications for mutton improved upon adding 10% of fat. Therefore, the major species differences in the volatile compounds of heated mutton do not arise from fat rather than the lean extracts [27]. Fat acts as a substrate for the formation of odor-active volatiles from lipid oxidation, and its hydrocarbons, alcohols, ketones, and aldehydes are critical for producing the characteristic flavor of roasted meat [6]. Berry [28] reported that when comparing beef patties with 4% and 20% fat, the higher-fat samples had greater beef flavor scores. Therefore, the contribution of fat to the flavor of meat cannot be ignored.
Hexanal, heptanal, octanal, and nonanal were the major aldehyde volatile compounds in F2L2, and their contents were higher than that of F1L3, which may be because the increase in fat content was conducive to the enrichment of aldehydes in shashliks. Phospholipid in fat is rich in linoleic acid, arachidonic acid, oleic acid, eicosapentaenoic acid, and linolenic acid, among which the n-3 unsaturated fatty acids of linolenic acid and eicosapentaenoic acid can be oxidized to saturated and unsaturated aldehydes when heated [29]. Hexanal, octanal, and nonanal are roasted mutton’s main odor substances [24]. Due to the low threshold of aldehydes, they usually make a prominent contribution to the overall flavor of meat products [30]. Hexanal has a grass-like smell, while heptanal has a cheese- and fat-like aroma, and octanal elicits sweet and light fat odor qualities [31].
When the ratio of fat to lean meat reached 50%, the content of furans (5-Butyldihydro-2(3H)-furanone, 2-amylfuran, 2-butyl tetrahydrofuran, and 2,5-dimethyltetrahydrofuran) in mutton shashliks gradually decreased (p < 0.05). Furans mainly come from the degradation of thiamine in lean meat, providing a strong meat flavor, as well as a roasted flavor for roasted meat [32]. The changes in pyrazines were also similar to the furans. The odors of the alkylpyrazines are generally associated with pleasant roasted foods, e.g., chocolate, coffee, and roasted nuts [24]. This suggested that as the proportion of lean meat in mutton shashlik decreased some odorants that contribute to the roast flavor also decreased. When the fat–lean ratio exceeded 50%, the volatile substances content (especially aldehydes, alcohols, and ketones) further increased with the increase in fat–lean ratios. However, the types of volatile compounds in F3L1 and F4L0 did not increase more than F2L2. Thus, you do not have to add more than 50% fat to the shashliks.
3.4. Oral Processing
3.4.1. Mastication Duration and Number
The mastication of food is a series of motor sensory activities, where food ingested to the mouth is ground into small particles and transformed into a safe-to-swallow cohesive bolus [33]. This particle breakdown pattern and the bolus formation process can vary depending on changes in the initial food’s intrinsic characteristics. Figure 3 shows the changes in the oral parameters (including the mastication duration and masticatory number) of the subjects during the oral processing of roasted mutton shashlik with different fat–lean ratios. Figure 3A shows the mastication time required for F0L4 was 34.05 s, during which the subjects completed 44.58 mastication cycles. With the increase in the proportion of fat in shashlik, the mastication time gradually decreased. When the fat–lean ratio was 3:1 (the content of fat increased to 66.24 g/100 g), the mastication duration was significantly shortened (p < 0.05) to 10.61 s, and the masticatory number was also reduced (p < 0.05) to 7.92. The decreases in mastication time and number were related to the increase in fat content. Because fat meat is more tender than lean meat, the increase in fat would inevitably lead to the decrease in the overall hardness of the meat cubes, thereby weakening the resistance of food to teeth during chewing [33]. As the chewing behavior becomes easier, the time required for the meat cubes to be crushed to form a swallowable food bolus was shortened. Another possible explanation is the higher fat level helps to improve the lubricity of the food bolus, making it easier to achieve the safe swallowing threshold, thus shortening the oral processing (mastication) time from food intake to swallowing [34].
3.4.2. Saliva Incorporation
Saliva flow relates to the texture and flavor perception of any food [35]. Therefore, understanding the critical role that saliva plays in bolus formation can help in elucidating the volatile compounds release mechanism of food. Figure 3C shows the amount of saliva incorporated into the food bolus after oral processing. The amount of saliva mixed into the food bolus of F0L4 was 3.58 g, which was gradually decreased (p < 0.05) with the increase in the ratio of fat to lean meat in the sample. Thus, when the ratio of fat to lean meat reached 3:1, the amount of saliva incorporated in the food bolus (F3L1) decreased to the lowest value, which was 2.36 g. The increases in fat content reduced the amount of saliva incorporation. Frank [36] reported that lower-fat meat had a greater capacity to absorb and hold saliva compared with high-fat samples, affecting bolus formation. Samples with a high lean meat content increased the mastication duration and masticatory number. It was previously found that when the masticatory number and mastication duration increased, the amount of saliva incorporation generally increased accordingly [17]. As a result, more saliva was required to agglomerate harder particles to make a safe-to-swallow and cohesive bolus. Moreover, another possible reason is that fat replaced saliva’s lubricating function, resulting in a decrease in its incorporation. Under normal conditions, a lubrication threshold is achieved through saliva incorporation [17]. However, fat cubes release oil as they are crushed during chewing, covering the bolus surface and improving its lubricity. Thus, even in the presence of a small amount of saliva, the pellet’s surface lubrication can still reach the threshold that triggers swallowing.
3.4.3. Sieve Analysis of Meat Bolus
To explore the fragmentation of roast mutton shashlik with different fat–lean ratios after mastication, two different methods, namely wet screening and image analysis, were used to analyze the particle size distribution of the bolus particles. The wet sieve method is the most used to evaluate the particle size distribution of chewed food. It can intercept particles of different sizes using a sieve with different apertures, and then analyze the particle size distribution [37]. Based on the wet screen method, image analysis can further provide more intuitive and accurate information about particle distribution [38].
The particle mass percentage retained on the sieves with different aperture sizes (0.6–5 mm) is presented in Figure 3A. More than half of the particles were stained on the sieve with the largest aperture (5 mm), especially F3L1, which had an interception rate of 71.12%, which was significantly heavier than F2L2 (55.3%), F1L3 (52.47%), and F0L4 (40.52%). This result indicated that shashliks with a high fat level had larger particles after oral processing. However, particle breakdown was significantly higher in the samples with a large proportion of lean meat, and most of the fine particles were intercepted on the smaller-aperture sieves (0.6–4 mm). For example, the mass percentage of F0L4 particles retained on the sieves with 0.6 mm, 1.6 mm, and 3 mm aperture sizes was 1.79 times, 2.50 times, and 2.16 times that of F3L1, respectively. This might be because the meat cubes with a higher proportion of lean meat have been thoroughly chewed during oral processing, resulting in thinner muscle fibers that can more easily pass through the larger sieve apertures.
Image analysis can provide more intuitive information about food particles, including the size, shape, etc. [39]. Figure 4B,C show the image analysis results for bolus particle size variation amongst the different shashliks. The image shows that the meat bolus particles after chewing are coarse and fibrous, which is consistent with Pematilleke’s results [17]. The variation in size of muscle fibers might have resulted from the intraoral manipulation of meat [40]. After chewing for the longest time, the muscle fibers of F0L4 were cut through bite force and eventually formed particles with the smallest diameter (0.35 mm), smallest length (0.447 mm), and smallest width (0.227 mm) of all the samples. With the increase in the proportion of fat in the sample, the diameter, length, and width of the particles began to increase continuously until the ratio of fat to lean meat was 3:1, and the particles of F3L1 were the largest observed in the sample, which was consistent with the results of the wet sieve method.
3.5. Exhaled Breath Analysis
Table 3 shows the volatile compounds in the subjects’ exhaled breaths after oral processing. In total, 21 volatile compounds were detected in all the samples, including 7 aldehydes, 2 alcohols, 2 esters, 7 hydrocarbons, and 1 pyrazine. At the initial stage of oral processing (bolus has not yet formed), meat cubes were broken down and food particles were highly dispersed. There was a larger exchange area between the meat particles and the gas phase in the mouth, which should be conducive to the release of volatile compounds into the oral cavity [41]. However, from the test results, the types of volatile compounds that release into the mouth were significantly less than before intake (56 species). We inferred that, on the one hand, the sampling temperature (about 60 °C) to determine the amount of volatile compounds in mutton shashliks was significantly higher than the sampling temperature for oral processing (close to the human oral temperature), so at relatively low temperatures, some volatile compounds may be difficult to release from meat to the mouth [42,43]. On the other hand, the release of retro-nasal volatile compounds is a complex physiological process. The decrease in volatile substances in exhalation may be related to changes in oral processing parameters, such as the oral processing duration, the amount of saliva incorporation, and the food’s morphological deformation during mastication, including crushing, grinding, disintegration, melting, and dilution by saliva [42,44]. Among these factors, the impact of saliva was evidenced, with an increase in saliva incorporation significantly decreasing the release of volatile compounds [42]. During food oral processing, the continuously secreted saliva coats surfaces and clusters particles, participates in the formation insoluble aggregates, and binds aromas.
The table shows that nine volatile compounds (five aldehydes, one alcohol, and one hydrocarbon) were detected in F0L4 exhalation, while no esters were detected. After adding fat, the volatile compounds in the F1L3 exhaled breath were more abundant than in F0L4. In addition to the increase in aldehydes, ethyl hexanoate, undecane, dodecane, hexadecane, and other substances began to be detected in the exhalation. When the fat ratio continued to increase, the types of volatile compounds in the F2L2 breath increased to 16, and alcohols, esters, hydrocarbons, and other compounds in the exhalation further increased compared with F0L4 and F1L3. At this time, the contents of hexal, octyal, heptal, nonaldehyde, ethyl caproate, cisanisole, and some alkanes in F2L2 were the highest of all the exhalation samples. This might be because F2L2 contains relatively more fat, more than three and four times higher than F0L4 and F1L3, respectively (Table 1). Mutton shashliks with higher fat content may release richer and more types of volatile compounds than those with lower fat content during oral processing. Moreover, differences in saliva incorporation caused by different samples during oral processing might influence the release of volatile compounds [45]. Because the subjects secreted more saliva when chewing F0L4 and F1L3 (Figure 4C), it may have hindered the release of volatile substances from the bolus into the oral cavity. Therefore, the types and amounts of volatile compounds released from F0L4 and F1L3 were less than those from F2L2.
Although increasing the fat content contributes to more volatile compounds being released into the oral cavity, the types and content of volatile compounds in F3L1 and F2L2 did not change significantly (p > 0.05) when the fat to lean ratio was further increased (Table 3). This result might be related to the effect of oral processing on the release mechanism of volatile compounds. When meat cubes were masticated, volatile compounds were released from food to saliva. Then, they were partitioned between saliva and the air phase in the oral cavity [16]. Because of the faster oral breakdown of F3L1, its degree of fragmentation was lower than that of F2L2, resulting in the formation of larger food pellets, which may weaken the release potential of volatile substances from meat. Additionally, in foods that contain fat, the retention and release of volatile compounds mainly depend on their solubility in the oil phase or hydrophobicity [45]. In some cases, lipophilic volatile organic compounds are typically more soluble in oil than water. Consequently, the release of volatile compounds in the mouth from low-fat foods was found to be higher than regular-fat foods [16,36]. Frank [36] found that fat at 37 °C also acts as a solvent or “flavor sink”, solubilizing lipophilic volatiles and impeding their in-mouth release. Therefore, even though the fat content of F3L1 increased by 25% compared with F2L2, the further increase in volatile compounds did not occur under the oral processing conditions.
4. Conclusions
This study showed that the difference in the ratios of fat and lean meat in mutton shashliks significantly affected the release of volatile compounds. The analysis of volatile substances released by mutton shashliks after roasting showed that the increase of fat content could enrich the type and content of volatile substances in mutton shashliks. F2L2 could provide more volatile substances for mutton shashliks than other samples. Analysis of the gases collected from the oral cavity showed that the increased ratios of fat cubes help to released more volatile substances from meat bolus into the oral cavity. However, when the fat addition level exceeded 50% (F2L2), the time required to chew the shashliks decreased and the bolus particles became larger, which inhibited the release of volatile compounds from the food bolus. In summary, mutton shashliks with the same proportion of fat and lean meat (F2L2) can release more volatile substances both before and during consumption.
Supplementary Materials
The following supporting information can be downloaded at: https://www.mdpi.com/article/10.3390/foods12101929/s1, Table S1: Ten electronic nose sensors and their compound detection sensitivity.
Author Contributions
Conceptualization, M.Z., W.Y., L.Y. and D.L.; Methodology, M.Z., F.B., W.Y., L.Y. and D.L.; Software, F.B.; Validation, M.L. and F.B.; Formal analysis, M.L. and F.B.; Investigation, M.L. and F.B.; Data curation, M.Z. and M.L.; Writing—original draft, M.Z. and M.L.; Writing—review & editing, M.Z. and M.L.; Visualization, W.Y.; Supervision, M.Z., W.Y., L.Y. and D.L.; Project administration, M.Z. and D.L.; Funding acquisition, M.Z. and D.L. All authors have read and agreed to the published version of the manuscript.
Funding
This work was supported by the Doctoral Research Start-up Foundation Program of Liao Ning Province (2021-BS-254), Young Science and Technology Talents Program of Education Department of Liaoning Province (LQ2020006), the Doctoral Research Start-up Foundation Program of Bohai University (0520-bs005), and the Science and Technology Plan Project of Liaoning Province (2021JH1/10400033).
Institutional Review Board Statement
The study was conducted in accordance with the Declaration of Helsinki and approved by the Institutional Review Board of Bohai University (2/2, 13 April 2022). The approval code: (IRBBHU-2022-2-2).
Informed Consent Statement
Informed consent was obtained from all subjects involved in the study.
Data Availability Statement
All related data and methods are presented in this paper. Additional inquiries should be addressed to the corresponding author.
Conflicts of Interest
The authors declare that they have no known competing financial interests or personal relationships that could have appeared to influence the work reported in this paper.
References
- Liu, H.; Hui, T.; Zheng, X.; Li, S.; Wei, X.; Li, P.; Zhang, D.; Wang, Z. Characterization of key lipids for binding and generating aroma compounds in roasted mutton by UPLC-ESI-MS/MS and Orbitrap Exploris GC. Food Chem. 2022, 374, 131723. [Google Scholar] [CrossRef] [PubMed]
- Sohail, A.; Al-Dalali, S.; Wang, J.; Xie, J.; Shakoor, A.; Asimi, S.; Shah, H.; Patil, P. Aroma compounds identified in cooked meat: A review. Food Res. Int. 2022, 157, 111385. [Google Scholar] [CrossRef] [PubMed]
- Ortner, E.; Granvogl, M. Thermally Induced Generation of Desirable Aroma-Active Compounds from the Glucosinolate Sinigrin. J. Agric. Food Chem. 2018, 66, 2485–2490. [Google Scholar] [CrossRef] [PubMed]
- Wojtasik-Kalinowska, I.; Szpicer, A.; Binkowska, W.; Hanula, M.; Marcinkowska-Lesiak, M.; Poltorak, A. Effect of Processing on Volatile Organic Compounds Formation of Meat—Review. Appl. Sci. 2023, 13, 705. [Google Scholar] [CrossRef]
- Rasinska, E.; Rutkowska, J.; Czarniecka-Skubina, E.; Tambor, K. Effects of cooking methods on changes in fatty acids contents, lipid oxidation and volatile compounds of rabbit meat. LWT 2019, 110, 64–70. [Google Scholar] [CrossRef]
- Xu, Y.; Zhang, D.; Liu, H.; Wang, Z.; Hui, T.; Sun, J. Comprehensive Evaluation of Volatile and Nonvolatile Compounds in Oyster Cuts of Roasted Lamb at Different Processing Stages Using Traditional Nang Roasting. Foods 2021, 10, 1508. [Google Scholar] [CrossRef]
- Frank, D.C.; Ball, A.J.; Hughes, J.M.; Piyasiri, U.; Stark, J.; Watkins, P.; Warner, R.D. Sensory and flavor chemistry characteristics of Australian beef: Influence of intramuscular fat, feed, and breed. J. Agric. Food Chem. 2016, 64, 4299–4311. [Google Scholar] [CrossRef]
- Myers, A.J.; Scramlin, S.M.; Dilger, A.C.; Souza, C.M.; McKeith, F.K.; Killefer, J. Contribution of lean, fat, muscle color and degree of doneness to pork and beef species flavor. Meat Sci. 2009, 82, 59–63. [Google Scholar] [CrossRef]
- Sink, J.D.; Caporaso, F. Lamb and mutton flavour: Contributing factors and chemical aspects. Meat Sci. 1977, 1, 119–127. [Google Scholar] [CrossRef]
- Berry, B. Fat level, high temperature cooking and degree of doneness affect sensory, chemical and physical properties of beef patties. J. Food Sci. 1994, 59, 10–14. [Google Scholar] [CrossRef]
- Pu, D.; Shan, Y.; Wang, J.; Sun, B.; Xu, Y.; Zhang, W.; Zhang, Y. Recent trends in aroma release and perception during food oral processing: A review. Crit. Rev. Food Sci. 2022, 1–17. [Google Scholar] [CrossRef]
- Labouré, H.; Repoux, M.; Courcoux, P.; Feron, G.; Guichard, E. Inter-individual retronasal aroma release variability during cheese consumption: Role of food oral processing. Food Res. Int. 2014, 64, 692–700. [Google Scholar] [CrossRef]
- Horwitz, W. Methods 930.15, 942.05, 920.39, 954.01, 991.43, 50.1.14, 9.1.09. In Official Methods of Analysis, 17th ed.; Association of Official Analytical Chemists: Gaithersburg, MD, USA, 2000. [Google Scholar]
- Gong, H.; Yang, Z.; Liu, M.; Shi, Z.; Li, J.; Chen, W.; Qiao, X. Time-dependent categorization of volatile aroma compound formation in stewed Chinese spicy beef using electron nose profile coupled with thermal desorption GC–MS detection. Food Sci. Hum. Well. 2017, 6, 137–146. [Google Scholar] [CrossRef]
- Vasta, V.; Ventura, V.; Luciano, G.; Andronico, V.; Pagano, R.I.; Scerra, M.; Biondi, L.; Avondo, M.; Priolo, A. The volatile compounds in lamb fat are affected by the time of grazing. Meat Sci. 2012, 90, 451–456. [Google Scholar] [CrossRef]
- Zhang, Y.; Sun, Y.; Song, H. Variation in Volatile Flavor Compounds of Cooked Mutton Meatballs during Storage. Foods 2021, 10, 2430. [Google Scholar] [CrossRef]
- Pematilleke, N.; Kaur, M.; Adhikari, B.; Torley, P. Influence of meat texture on oral processing and bolus formation. J. Food Eng. 2020, 283, 110038. [Google Scholar] [CrossRef]
- Ling, J.; Xu, J.; Lin, H.; Lin, J. Prediction and fusion algorithm for meat moisture content measurement based on loss-on-drying method. Int. J. Agric. Biol. Eng. 2020, 13, 198–204. [Google Scholar] [CrossRef]
- Kang, N. Comparison of Sampling Methods to Determine Methane in Tedlar Bag Directly Against High Pressurized Calibration Gas Cylinder by Gas Chromatography. SSRN Electron. J. 2023, 4313962. [Google Scholar] [CrossRef]
- Phillips, M.; Gleeson, K.; Hughes, J.M.B.; Greenberg, J.; Cataneo, R.N.; Baker, L.; McVay, W.P. Volatile organic compounds in breath as markers of lung cancer: A cross-sectional study. Lancet 1999, 353, 1930–1933. [Google Scholar] [CrossRef]
- Ross, B.M.; Babgi, R. Volatile compounds in blood headspace and nasal breath. J. Breath Res. 2017, 11, 046001. [Google Scholar] [CrossRef]
- Zhang, L.; Chen, Q.; Liu, Q.; Xia, X.; Wang, Y.; Kong, B. Effect of different types of smoking materials on the flavor, heterocyclic aromatic amines, and sensory property of smoked chicken drumsticks. Food Chem. 2022, 367, 130680. [Google Scholar] [CrossRef] [PubMed]
- Mi, R.; Chen, X.; Xiong, S.; Qi, B.; Li, J.; Qiao, X.; Chen, W.; Qu, C.; Wang, S. Predominant yeasts in Chinese Dong fermented pork (Nanx Wudl) and their aroma-producing properties in fermented sausage condition. Food Sci. Hum. Well. 2021, 10, 231–240. [Google Scholar] [CrossRef]
- Liu, H.; Ma, J.; Pan, T.; Suleman, R.; Wang, Z.; Zhang, D. Effects of roasting by charcoal, electric, microwave and superheated steam methods on (non) volatile compounds in oyster cuts of roasted lamb. Meat Sci. 2021, 172, 108324. [Google Scholar] [CrossRef] [PubMed]
- Buttery, R.G.; Ling, L.C.; Teranishi, R.; Mon, T.R. Roasted lamb fat: Basic volatile components. J. Agric. Food Chem. 1977, 25, 1227–1229. [Google Scholar] [CrossRef]
- Liu, H.; Hui, T.; Fang, F.; Li, S.; Wang, Z.; Zhang, D. The formation of key aroma compounds in roasted mutton during the traditional charcoal process. Meat Sci. 2022, 184, 108689. [Google Scholar] [CrossRef]
- Wasserman, A.E.; Talley, F. Organoleptic Identification of Roasted Beef, Veal, Lamb and Pork as Affected by Fat. J. Food Sci. 1968, 33, 219–223. [Google Scholar] [CrossRef]
- Pearson, A.M.; Love, J.D.; Shorland, F.B. “Warmed-Over” Flavor in Meat, Poultry, and Fish. Adv. Food Res. 1977, 23, 1–74. [Google Scholar]
- Elmore, J.S.; Mottram, D.S.; Enser, M.; Wood, J.D. Effect of the polyunsaturated fatty acid composition of beef muscle on the profile of aroma volatiles. J. Agric. Food Chem. 1999, 47, 1619–1625. [Google Scholar] [CrossRef]
- Zou, Y.; Kang, D.; Rui, L.; Qi, J.; Zhang, W. Effects of ultrasonic assisted cooking on the chemical profiles of taste and flavor of spiced beef. Ultrason. Sonochem. 2018, 46, 36–45. [Google Scholar] [CrossRef]
- Shen, D.; Li, M.; Song, H.; Zou, T.; Zhang, L.; Xiong, J. Characterization of aroma in response surface optimized no-salt bovine bone protein extract by switchable GC/GC×GC-olfactometry-mass spectrometry, electronic nose, and sensory evaluation. LWT 2021, 147, 111559. [Google Scholar] [CrossRef]
- Kerth, C. Determination of volatile aroma compounds in beef using differences in steak thickness and cook surface temperature. Meat Sci. 2016, 117, 27–35. [Google Scholar] [CrossRef]
- Guo, Q. Understanding the oral processing of solid foods: Insights from food structure. Compr. Rev. Food Sci. Food Saf. 2021, 20, 2941–2967. [Google Scholar] [CrossRef]
- Liu, D.; Deng, Y.; Gong, A.; Han, Y.H.; Wang, H. Impact of the Breakdown Behavior on Chinese Traditional Stewed Pork with Brown Sauce: Physical Properties Using Microstructural Analysis. J. Food Qual. 2017, 2017, 1–10. [Google Scholar] [CrossRef]
- Mosca, A.C.; Chen, J. Food-saliva interactions: Mechanisms and implications. Trends Food Sci. Technol. 2017, 66, 125–134. [Google Scholar] [CrossRef]
- Frank, D.; Kaczmarska, K.; Paterson, J.; Piyasiri, U.; Warner, R. Effect of marbling on volatile generation, oral breakdown and in mouth flavor release of grilled beef. Meat Sci. 2017, 133, 61–68. [Google Scholar] [CrossRef]
- Peyron, M.A.; Mishellany, A.; Woda, A. Particle size distribution of food boluses after mastication of six natural foods. J. Dent. Res. 2004, 83, 578–582. [Google Scholar] [CrossRef]
- Hoebler, M.-F.; Devaux, A.; Karinthi, C.; Belleville, J.-L.; Barry, C. Particle size of solid food after human mastication and in vitro simulation of oral breakdown. Int. J. Food Sci. Nutr. 2000, 51, 353–366. [Google Scholar] [CrossRef]
- Marine, D.; Derks, J.; Ketel, E.C.; Wijk, R.D.; Stieger, M. Eating behaviour explains differences between individuals in dynamic texture perception of sausages. Food Qual. Prefer. 2015, 41, 189–200. [Google Scholar]
- Mioche, L.; Bourdiol, P.; Monier, S.; Martin, J.-F. The relationship between chewing activity and food bolus properties obtained from different meat textures. Food Qual. Prefer. 2002, 13, 583–588. [Google Scholar] [CrossRef]
- Okawa, J.; Hori, K.; Yoshimoto, T.; Salazar, S.E.; Ono, T. Higher Masticatory Performance and Higher Number of Chewing Strokes Increase Retronasal Aroma. Front. Nutr. 2021, 8, 623507. [Google Scholar] [CrossRef]
- Canon, F.; Neiers, F.; Guichard, E. Saliva and Flavor Perception: Perspectives. J. Agric. Food Chem. 2018, 66, 7873–7879. [Google Scholar] [CrossRef] [PubMed]
- Chen, L.; Yan, R.; Zhao, Y.; Sun, J.; Zhang, Y.; Li, H.; Zhao, D.; Wang, B.; Ye, X.; Sun, B. Characterization of the aroma release from retronasal cavity and flavor perception during baijiu consumption by Vocus-PTR-MS, GC×GC-MS, and TCATA analysis. LWT 2023, 174, 114430. [Google Scholar] [CrossRef]
- Lu, C.; Zhe, W.; Pla, B.; Al, C.; Yz, D.; Hla, B.; Jsa, B. The effect of saliva on the aroma release of esters in simulated baijiu under the impact of high ethanol concentration. J. Food Compos. Anal. 2021, 104, 104134. [Google Scholar]
- Paola, P.; Alessandro, G.; Silvia, E.; Luigi, M.; Paolo, C.P.; Angela, C.; Valeria, S.; Elisabetta, M.; Smith, D.P.; Owens, S.M. Saliva from Obese Individuals Suppresses the Release of Aroma Compounds from Wine. PLoS ONE 2014, 9, e85611. [Google Scholar]
Figure 1.
Schematic diagram showing the experimental design.

Figure 2.
Typical response values of electronic nose (E-Nose) PCA results of roasted mutton shashliks with different fat–lean ratios. W1C: aromatic compounds, W5S: nitrogen oxides, W3C: ammonia and aromatic compounds, W6S: hydrogen, W5C: alkanes and aromatics, W1S: methane, broad range of compounds, W1W: sulfur compounds, terpenes, W2S: alcohols, aldehydes, and ketones, W2W: aromatics and organic sulfur compounds, and W3S: long-chain alkanes. F0L4 represented the mutton shashliks with 4 lean cubes; F1L3 represented the mutton shashliks with 1 fat cube and 3 lean cubes; F2L2 represented the mutton shashliks with 2 fats cubes and 2 lean cubes; F3L1 represented the mutton shashliks with 3 fat cubes and 1 lean cube; F4L0 represented the mutton shashliks with 4 fat cubes.

Figure 3.
Oral processing parameters of shashliks with different fat–lean ratios, including mastication duration (A), masticatory number (B), and saliva incorporation (C). Different letters indicate that there is significant difference (p < 0.05). F0L4 represented the mutton shashliks with 4 lean cubes; F1L3 represented the mutton shashliks with 1 fat cube and 3 lean cubes; F2L2 represented the mutton shashliks with 2 fats cubes and 2 lean cubes; F3L1 represented the mutton shashliks with 3 fat cubes and 1 lean cube. Error bars represent S.E.M (standard error of mean).

Figure 4.
The mass of particle mass retained on each sieve after wet sieving of roasted mutton shashliks with four different fat–lean ratios after oral processing (sieve apertures range from 5–0.60 mm) (A). Optical microscopic images (×10 magnification) of particle masses collected in the receiving pan for four different fat–lean ratios of roasted mutton shashliks (B). The diameter, length, and width of the kebab particle masses of four different fat–lean ratios of roasted mutton shashliks after chewing were measured by software analysis (C). Different letters indicate that there is significant difference (p < 0.05). F0L4 represented the mutton shashliks with 4 lean cubes; F1L3 represented the mutton shashliks with 1 fat cube and 3 lean cubes; F2L2 represented the mutton shashliks with 2 fats cubes and 2 lean cubes; F3L1 represented the mutton shashliks with 3 fat cubes and 1 lean cube. Error bars represent S.E.M (standard error of mean).


Table 1.
Moisture, protein, and fat content of mutton shashliks with different fat–lean ratios (g/100 g).
Table 1.
Moisture, protein, and fat content of mutton shashliks with different fat–lean ratios (g/100 g).
| F0L4 | F1L3 | F2L2 | F3L1 | F4L0 | |
|---|---|---|---|---|---|
| Moisture | 53.28 ± 2.81 a | 42.13 ± 2.31 b | 31.57 ± 2.19 c | 20.75 ± 1.31 d | 9.09 ± 1.24 e |
| Protein | 41.17 ± 1.71 a | 31.34 ± 1.56 b | 21.03 ± 1.97 c | 11.20 ±1.03 d | 1.01 ± 0.27 e |
| Fat | 3.54 ± 0.62 e | 25.26 ± 1.48 d | 46.21 ± 2.53 c | 66.24 ± 3.17 b | 87.81 ±4.28 a |
Different lowercase letters in the same row indicate that there is significant difference (p < 0.05). F0L4 represented the mutton shashliks with 4 lean cubes; F1L3 represented the mutton shashliks with 1 fat cube and 3 lean cubes; F2L2 represented the mutton shashliks with 2 fats cubes and 2 lean cubes; F3L1 represented the mutton shashliks with 3 fat cubes and 1 lean cube; F4L0 represented the mutton shashliks with 4 fat cubes.
Table 2.
Volatile compounds in roasted mutton shashliks with different fat–lean ratios (μg/kg).
| Volatile Compounds | LRI * | Identification + | F0L4 | F1L3 | F2L2 | F3L1 | F4L0 | |
|---|---|---|---|---|---|---|---|---|
| Literature | Calculated | |||||||
| Hexanal | 800 | 802 | MS + LRI | 150.47 ± 12.65 d | 649.30 ± 7.76 c | 687.64 ± 16.91 b | 697.77 ± 8.84 b | 713.10 ± 7.36 a |
| Heptanal | 900 | 904 | MS + LRI | 119.55 ± 6.65 e | 261.82 ± 8.97 d | 313.80 ± 7.80 c | 339.42 ± 6.73 b | 380.33 ± 3.79 a |
| 2-hexen-1-al | 854 | 860 | MS + LRI | ND | ND | ND | ND | 111.84 ± 11.77 |
| Benzaldehyde | 959 | 963 | MS + LRI | 98.30 ± 9.89 d | 246.00 ± 12.37 c | 435.32 ± 10.63 b | 443.25 ± 19.60 b | 515.44 ± 11.54 a |
| Octanal | 1004 | 1005 | MS + LRI | 124.99 ± 2.93 e | 476.33 ± 3.74 d | 582.55 ± 8.12 c | 629.81 ± 3.20 b | 642.84 ± 6.07 a |
| (E, E)-2,4-Heptadienal | 1011 | 1012 | MS + LRI | ND | ND | ND | ND | 51.65 ± 9.70 |
| Phenylacetaldehyde | 1051 | 1053 | MS + LRI | ND | ND | 225.08 ± 15.24 c | 331.29 ± 12.58 b | 491.30 ± 12.38 a |
| (E)-2-Octenal | 1065 | 1067 | MS + LRI | ND | 144.96 ± 37.60 d | 291.13 ± 9.23 c | 346.03 ± 11.25 b | 335.25 ± 10.39 a |
| Nonanal | 1112 | 1114 | MS + LRI | 139.87 ± 18.15 d | 517.66 ± 12.06 c | 612.80 ± 17.22 b | 636.29 ± 15.17 a | 646.76 ± 10.22 a |
| (E)-2-Nonenal | 1163 | 1167 | MS + LRI | ND | 88.63 ± 12.87 e | 190.62 ± 10.13 b | 164.51 ± 16.77 c | 276.85 ± 12.91 a |
| Decanal | 1202 | 1205 | MS + LRI | ND | 110.67 ± 21.46 d | 215.67 ± 11.67 c | 269.43 ± 16.76 b | 281.88 ± 10.61 a |
| (E, E)-2,4-Nonadienal | 1212 | 1216 | MS + LRI | ND | 359.43 ± 20.46 | ND | ND | ND |
| Cuminaldehyde | 1238 | 1240 | MS + LRI | ND | 45.54 ± 28.03 d | 55.90 ± 3.61 c | 59.61 ± 4.78 b | 61.22 ± 6.58 a |
| (2E)-2-Decenal | 1265 | 1268 | MS + LRI | ND | 51.56 ± 20.95 c | 179.75 ± 27.12 b | 187.60 ± 14.19 b | 420.70 ± 17.54 a |
| 2,4-Decadienal | 1295 | 1299 | MS + LRI | ND | ND | ND | ND | 28.83 ± 2.51 |
| Undecanal | 1305 | 1307 | MS + LRI | ND | ND | 142.98 ± 14.17 a | 85.58 ± 13.02 b | 72.49 ± 14.18 c |
| Undecenal | 1359 | 1360 | MS + LRI | ND | ND | 64.86 ± 8.36 b | 72.74 ± 8.98 b | 141.57 ± 11.02 a |
| Dodecanal | 1407 | 1410 | MS + LRI | ND | ND | 15.51 ± 7.62 b | 24.00 ± 4.25 b | 28.05 ± 6.94 a |
| Pentadecanal | 1715 | 1718 | MS + LRI | ND | ND | ND | 31.01 ± 11.82 | 34.10 ± 12.51 |
| (E)-4-Nonenal | - | 1435 | MS | ND | ND | ND | ND | 40.84 ± 12.88 |
| 3-Cyclohexene-1-carboxaldehyde | - | 1490 | MS | ND | 53.88 ± 5.14 c | 70.71 ± 5.38 c | 102.03 ± 7.33 b | 132.64 ± 9.09 a |
| (E)-2-Hexenol | 849 | 853 | MS + LRI | ND | 32.23 ± 1.96 b | 55.32 ± 1.36 a | 66.49 ± 44.86 a | ND |
| 1-Hexanol | 890 | 891 | MS + LRI | 34.25 ± 3.26 b | 56.46 ± 5.36 a | 40.36 ± 6.36 b | ND | ND |
| 1-Heptanol | 969 | 973 | MS + LRI | 106.35 ± 5.17 d | 362.92 ± 8.46 c | 373.9 ± 16.01 c | 552.42 ± 10.63 b | 621.57 ± 16.02 a |
| 1-Octen-3-ol | 981 | 984 | MS + LRI | 146.83 ± 8.8 b | 256.14 ± 8.49 a | 259.8 ± 17.27 a | 259.24 ± 11.87 a | ND |
| 1-Nonanol | 1150 | 1152 | MS + LRI | ND | 62.33 ± 6.32 b | 82.69 ± 3.95 a | 88.33 ± 6.33 a | ND |
| 3-methyl-6-ethyl-5-octen-1-ol | - | 1163 | MS | ND | ND | 133.48 ± 9.69 | ND | ND |
| 2-Propylcyclohexanol | - | 1264 | MS | ND | ND | ND | 64.64 ± 2.34 | 107.55 ± 7.41 |
| (E)-2-decen-1-ol | - | 1250 | MS | ND | 45.69 ± 6.69 a | 70.93 ± 2.11 a | 52.36 ± 3.98 a | 38.21 ± 1.80 a |
| Pentanol | 762 | 760 | MS + LRI | 62.36 ± 6.56 d | 91.33 ± 7.32 c | 99.22 ± 6.96 c | 143.63 ± 9.65 b | 156.26 ± 8.65 a |
| Cyclohexanol,3,5-dimethyl- | - | 970 | MS | ND | ND | ND | ND | 272.69 ± 8.79 |
| 2-Methylcyclopentanone | 846 | 850 | MS + LRI | ND | ND | 559.00 ± 17.1 | ND | ND |
| 2,3-Octandeione | 986 | 990 | MS + LRI | 132.25 ± 5.23 d | 231.96 ± 7.36 c | 553.36 ± 25.33 a | 423.36 ± 7.32 b | 134.36 ± 6.00 d |
| 2-Nonanone | 1089 | 1092 | MS + LRI | ND | ND | ND | 63.77 ± 7.66 | 171.66 ± 7.69 |
| 2-Decanone | 1194 | 1198 | MS + LRI | ND | ND | 63.91 ± 0.90 c | 157.27 ± 80.66 b | 310.12 ± 17.26 a |
| 2-Undecanone | 1296 | 1300 | MS + LRI | ND | ND | ND | 106.82 ± 7.99 | 217.96 ± 8.15 |
| 2-Tridecanone | 1498 | 1500 | MS + LRI | ND | ND | ND | 30.19 ± 2.37 | 49.30 ± 4.73 |
| 2,3-dimethyl-2-cyclopenten-1-one | 1035 | 1040 | MS + LRI | ND | ND | 694.55 ± 11.56 a | 119.71 ± 12.88 b | 63.41 ± 3.00 c |
| 2-Cyclopenten-1-one,2-butyl-3-methyl- | - | 979 | MS | ND | 75.74 ± 8.90 b | 141.99 ± 9.41 a | 80.36 ± 6.33 b | 39.96 ± 6.26 c |
| Ethyl hexanoate | 998 | 1000 | MS + LRI | 134.20 ± 8.35 d | 199.84 ± 8.83 c | 226.51 ± 12.23 b | 379.16 ± 8.92 a | 350.14 ± 7.36 a |
| γ-Caprolactone | 1055 | 1058 | MS + LRI | ND | ND | 264.16 ± 10.24 a | 134.52 ± 7.88 b | 64.55 ± 5.90 c |
| Ethyl heptanoate | 1097 | 1100 | MS + LRI | 28.17 ± 2.98 d | 66.69 ± 9.25 c | 243.41 ± 9.68 b | 303.13 ± 10.10 a | ND |
| Ethyl caprylate | 1199 | 1200 | MS + LRI | 32.66 ± 5.20 d | 50.28 ± 8.20 c | 94.95 ± 8.34 b | 147.70 ± 9.35 a | ND |
| Ethyl caprate | 1397 | 1400 | MS + LRI | ND | ND | 40.05 ± 5.37 a | 32.26 ± 7.36 ab | 15.21 ± 5.23 c |
| 5-Butyldihydro-2(3H)-furanone | 1260 | 1263 | MS + LRI | 172.65 ± 8.79 a | 168.25 ± 9.54 a | 165.13 ± 8.40 a | 83.94 ± 8.48 b | 70.36 ± 7.41 c |
| 4-Pentenoic acid ethyl ester | - | 1403 | MS | ND | ND | 100.72 ± 9.11 | 65.90 ± 5.47 | ND |
| 1-Decene | 989 | 992 | MS + LRI | ND | ND | 197.02 ± 8.48 c | 235.26 ± 8.89 b | 413.73 ± 13.09 a |
| Undecane | 1100 | 1103 | MS + LRI | 34.87 ± 5.83 a | 60.45 ± 4.83 a | 67.84 ± 6.49 a | 73.75 ± 9.50 a | 130.01 ± 15.24 a |
| Dodecane | 1200 | 1204 | MS + LRI | 68.89 ± 9.28 c | 98.82 ± 5.93 b | 207.11 ± 5.40 a | ND | ND |
| Tridecane | 1300 | 1301 | MS + LRI | 11.49 ± 2.48 e | 36.25 ± 2.36 d | 66.96 ± 5.96 c | 87.88 ± 4.47 b | 127.14 ± 12.63 a |
| 3-Methyltridecane | 1371 | 1373 | MS + LRI | ND | 82.60 ± 67.70 | ND | ND | ND |
| 2,6,10-Trimethyldodecane | 1376 | 1380 | MS + LRI | ND | 81.45 ± 11.60 c | 252.42 ± 11.91 a | 207.31 ± 5.71 b | 51.90 ± 5.44 d |
| 1-Tetradecene | 1396 | 1400 | MS + LRI | ND | ND | 337.85 ± 19.89 b | 356.20 ± 8.21 b | 437.06 ± 28.48 a |
| Tetradecane | 1400 | 1402 | MS + LRI | 9.95 ± 0.43 d | 68.02 ± 9.59 c | 99.89 ± 8.50 a | 85.76 ± 16.42 b | 70.99 ± 6.60 c |
| Hexadecane | 1600 | 1605 | MS + LRI | 4.57 ± 1.41 c | 7.93 ± 2.60 c | 31.56 ± 9.36 b | 39.22 ± 55.01 ab | 43.64 ± 6.50 a |
| Nonadecane | 1900 | 1901 | MS + LRI | ND | ND | 121.53 ± 8.23a | 84.57 ± 43.95 b | 24.13 ± 4.88 c |
| Oxirane, 2-octyl- | - | 1264 | MS + LRI | ND | ND | ND | ND | 93.15 ± 7.76 |
| 2,7-Dimethyloctane | - | 1172 | MS + LRI | ND | ND | ND | ND | 32.03 ± 7.38 |
| ( ± )-Limonene | - | 1081 | MS + LRI | 307.89 ± 7.53 e | 398.55 ± 9.33 d | 540.20 ± 17.41 c | 687.57 ± 13.56 b | 917.28 ± 9.11 a |
| 3,5-Dimethyl-1-Hexene | - | 1639 | MS + LRI | ND | ND | ND | ND | 248.17 ± 12.26 |
| Toluene | 757 | 760 | MS + LRI | 127.40 ± 9.75 b | 129.56 ± 7.83 b | 244.88 ± 12.00 a | 257.23 ± 6.11 a | 102.35 ± 12.96 c |
| 2,5-Dimethylpyrazine | 917 | 920 | MS + LRI | ND | ND | ND | ND | 586.28 ± 15.37 |
| 2-Amylfuran | 991 | 993 | MS + LRI | 47.87 ± 7.82 | ND | ND | ND | ND |
| cis-Anethol | 1286 | 1290 | MS + LRI | 42.93 ± 9.78 d | 45.90 ± 4.09 cd | 56.61 ± 6.05 c | 84.66 ± 8.96 b | 127.83 ± 9.02 a |
| 2-Ethyl-3,5-dimethylpyrazine | - | 1302 | MS + LRI | 243.59 ± 30.29 a | 120.11 ± 3.99 b | 87.87 ± 9.82 c | 70.11 ± 3.92 d | 60.11 ± 3.92 e |
| 2-butyl tetrahydrofuran | - | 1325 | MS + LRI | 155.36 ± 11.52 a | 150.36 ± 8.27 a | 140.46 ± 10.25 a | 74.71 ± 6.68 b | 57.96 ± 7.34 b |
| 2-Pentylpyridine | - | 1453 | MS + LRI | ND | ND | ND | ND | 32.32 ± 9.76 |
| 2,5-Dimethyltetrahydrofuran | - | 1520 | MS + LRI | 32.54 ± 4.32 | ND | ND | ND | ND |
Different lowercase letters in the same row indicate that there is significant difference (p < 0.05). * The Linear retention index of volatile compounds on HP-5 MS columns and calculated data was based on n-alkanes (C7–C40). + Means of identification: MS, mass spectrum comparison using NIST libraries; LRI, linear retention index compared with literature values. ND: volatile compounds not detected. “-”: not reported in the literature. F0L4 represented the mutton shashliks with 4 lean cubes; F1L3 represented the mutton shashliks with 1 fat cube and 3 lean cubes; F2L2 represented the mutton shashliks with 2 fats cubes and 2 lean cubes; F3L1 represented the mutton shashliks with 3 fat cubes and 1 lean cube; F4L0 represented the mutton shashliks with 4 fat cubes.
Table 3.
Volatile compounds in oral processing of roasted mutton shashliks with different fat–lean ratios (μg/kg).
Table 3.
Volatile compounds in oral processing of roasted mutton shashliks with different fat–lean ratios (μg/kg).
| Volatile Compounds | LRI * | Identification + | F0L4 | F1L3 | F2L2 | F3L1 | |
|---|---|---|---|---|---|---|---|
| Literature | Calculated | ||||||
| Hexanal | 800 | 802 | MS + LRI | 91.32 ± 10.97 c | 237.98 ± 12.33 b | 378.81 ± 10.00 a | 397.18 ± 11.26 a |
| Heptanal | 901 | 904 | MS + LRI | 69.14 ± 5.23 c | 232.18 ± 2.17 b | 351.09 ± 16.74 a | 374.97 ± 12.63 a |
| Octanal | 1004 | 1005 | MS + LRI | 63.13 ± 2.42 c | 160.22 ± 7.29 b | 264.52 ± 12.96 a | 280.03 ± 18.29 a |
| Nonanal | 1112 | 1114 | MS + LRI | 94.62 ± 10.03 c | 181.54 ± 11.6 b | 206.70 ± 16.03 a | 213.49 ± 12.64 a |
| Decanal | 1202 | 1205 | MS + LRI | 121.43 ± 6.47 c | 123.90 ± 9.11 c | 143.39 ± 9.55 b | 277.83 ± 11.08 a |
| (2E)-2-Decenal | 1265 | 1268 | MS + LRI | ND | 29.04 ± 1.86 b | 50.34 ± 2.03 a | 54.06 ± 1.98 a |
| 7-Hydroxy-3,7-dimethyloctanal | 1300 | 1303 | MS + LRI | ND | ND | ND | 118.10 ± 4.03 a |
| Ethyl hexanoate | 998 | 1000 | MS + LRI | ND | 63.49 ± 2.65 c | 103.54 ± 1.61 a | 94.32 ± 2.31 b |
| γ-Caprolactone | 1055 | 1058 | MS + LRI | ND | ND | 74.15 ± 4.01 a | 57.32 ± 1.51 b |
| (±)-Limonene | - | 1081 | MS | 75.53 ± 3.75 c | 183.83 ± 6.24 b | 205.24 ± 6.98 a | 207.29 ± 6.01 a |
| Undecane | 1100 | 1103 | MS + LRI | ND | 66.67 ± 2.36 b | 80.33 ± 1.87 a | 82.14 ± 3.35 a |
| Dodecane | 1200 | 1204 | MS + LRI | ND | 60.77 ± 4.36 | ND | ND |
| 2,6,10-Trimethyldodecane | 1376 | 1380 | MS + LRI | ND | ND | 48.34 ± 3.02 b | 63.75 ± 0.80 a |
| 1-Tetradecene | 1396 | 1400 | MS + LRI | ND | ND | 41.29 ± 1.12 | ND |
| Tetradecane | 1400 | 1402 | MS + LRI | ND | ND | 61.58 ± 4.43 a | 49.34 ± 4.54 b |
| Hexadecane | 1600 | 1605 | MS + LRI | ND | 46.42 ± 2.15 c | 74.02 ± 6.26 b | 97.00 ± 0.02 a |
| 2,5-Dimethylpyrazine | 917 | 920 | MS + LRI | 32.98 ± 0.18 b | ND | ND | 118.10 ± 4.03 a |
| 1-Heptanol | 969 | 973 | MS + LRI | ND | ND | 33.40 ± 2.55 | 36.15 ± 3.11 |
| P-Xylene | 875 | 880 | MS + LRI | ND | ND | 112.55 ± 36.38 | ND |
| cis-Anethol | 1286 | 1290 | MS + LRI | 62.17 ± 2.32 c | 141.35 ± 5.33 b | 201.82 ± 12.44 a | 196.00 ± 8.93 a |
| 2-Ethyl-3,5-dimethylpyrazine | - | 1302 | MS + LRI | 33.69 ± 2.31 c | 93.15 ± 5.75 ab | 87.93 ± 2.81 b | 97.29 ± 4.88 a |
Different lowercase letters in the same row indicate that there is significant difference (p < 0.05). * The Linear retention index of volatile compounds on HP-5 MS columns and calculated data was based on n-alkanes (C7–C40). + Means of identification: MS, mass spectrum comparison using NIST libraries; LRI, linear retention index compared with literature values. ND: volatile compounds not detected. “-”: not reported in the literature. F0L4 represented the mutton shashliks with 4 lean cubes; F1L3 represented the mutton shashliks with 1 fat cube and 3 lean cubes; F2L2 represented the mutton shashliks with 2 fats cubes and 2 lean cubes; F3L1 represented the mutton shashliks with 3 fat cubes and 1 lean cube.
Disclaimer/Publisher’s Note: The statements, opinions and data contained in all publications are solely those of the individual author(s) and contributor(s) and not of MDPI and/or the editor(s). MDPI and/or the editor(s) disclaim responsibility for any injury to people or property resulting from any ideas, methods, instructions or products referred to in the content. |
© 2023 by the authors. Licensee MDPI, Basel, Switzerland. This article is an open access article distributed under the terms and conditions of the Creative Commons Attribution (CC BY) license (https://creativecommons.org/licenses/by/4.0/).
Share and Cite
MDPI and ACS Style
Zhang, M.; Li, M.; Bai, F.; Yao, W.; You, L.; Liu, D. Effect of Fat to Lean Meat Ratios on the Formation of Volatile Compounds in Mutton Shashliks. Foods 2023, 12, 1929. https://doi.org/10.3390/foods12101929
AMA Style
Zhang M, Li M, Bai F, Yao W, You L, Liu D. Effect of Fat to Lean Meat Ratios on the Formation of Volatile Compounds in Mutton Shashliks. Foods. 2023; 12(10):1929. https://doi.org/10.3390/foods12101929
Chicago/Turabian StyleZhang, Mingcheng, Mingyang Li, Fangfang Bai, Wensheng Yao, Litang You, and Dengyong Liu. 2023. "Effect of Fat to Lean Meat Ratios on the Formation of Volatile Compounds in Mutton Shashliks" Foods 12, no. 10: 1929. https://doi.org/10.3390/foods12101929
Note that from the first issue of 2016, this journal uses article numbers instead of page numbers. See further details here.