
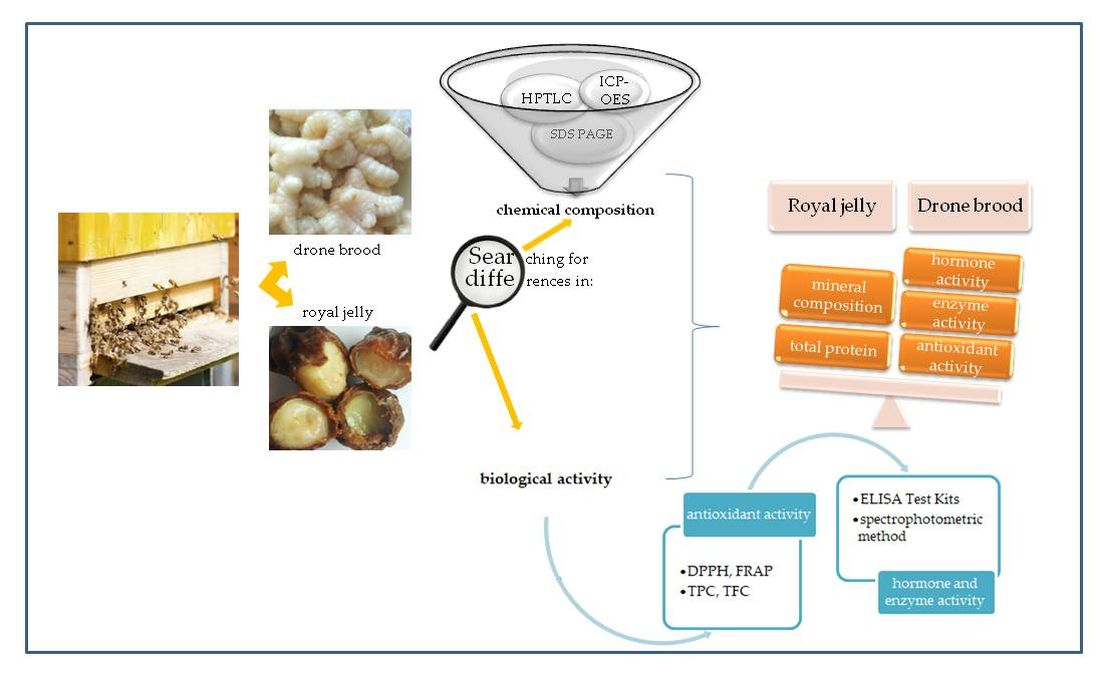
Searching for Differences in Chemical Composition and Biological Activity of Crude Drone Brood and Royal Jelly Useful for Their Authentication

 , , ,
, , ,  and
and
Abstract
:
1. Introduction
2. Materials and Methods
2.1. Chemicals
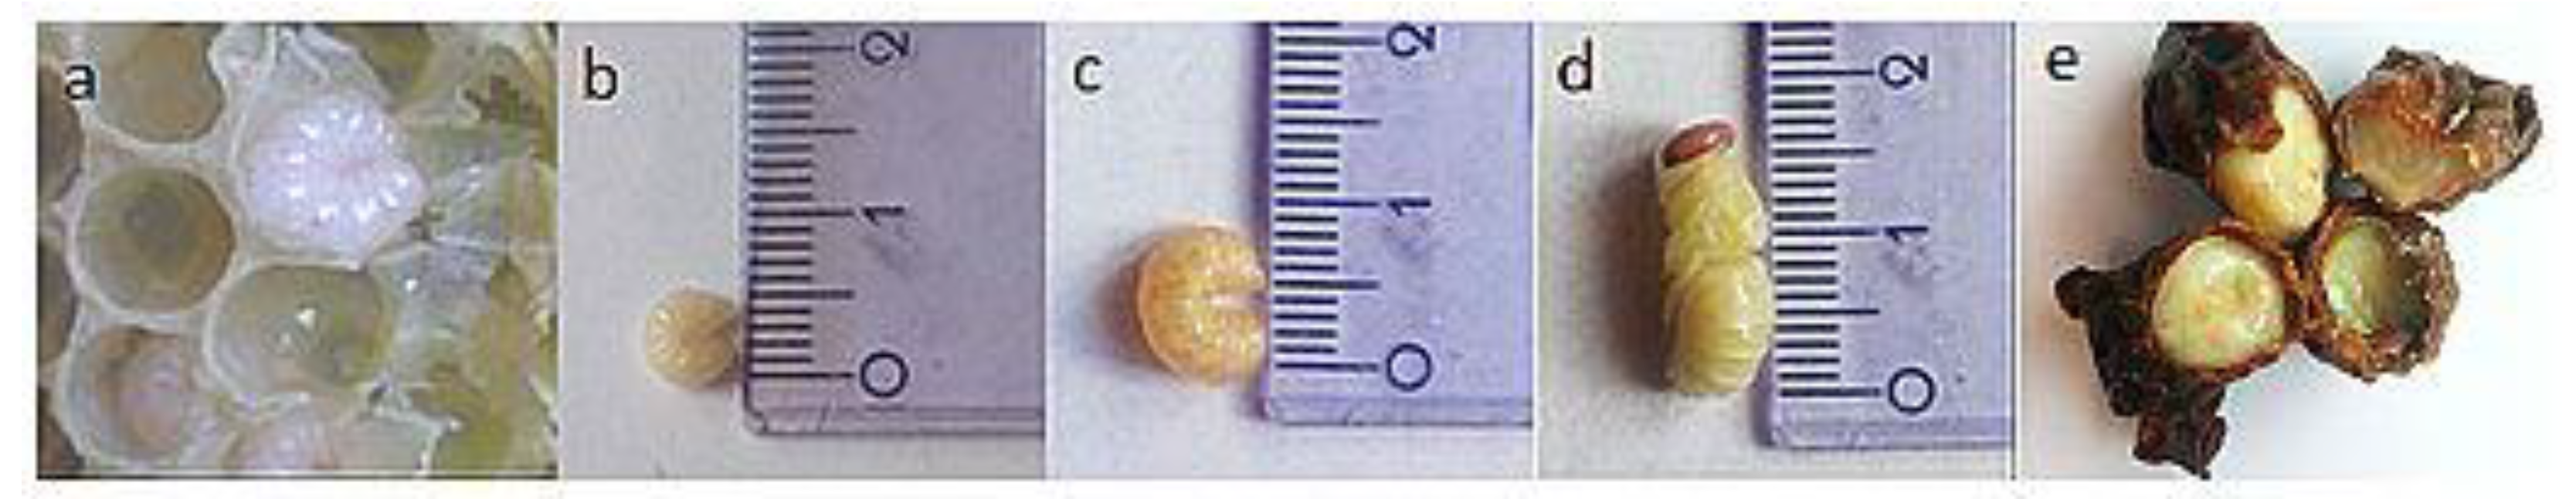
2.2. Material Collection
2.3. Preparation of Drone Brood and Royal Jelly Extracts
2.4. Determination of the Physicochemical Properties of Drone Brood and Royal Jelly
2.4.1. Water Content
2.4.2. Refractive Index
2.4.3. Active and Free Acidity
2.4.4. Conductivity
2.4.5. Protein Analyses
Total Protein
Soluble Protein Fraction
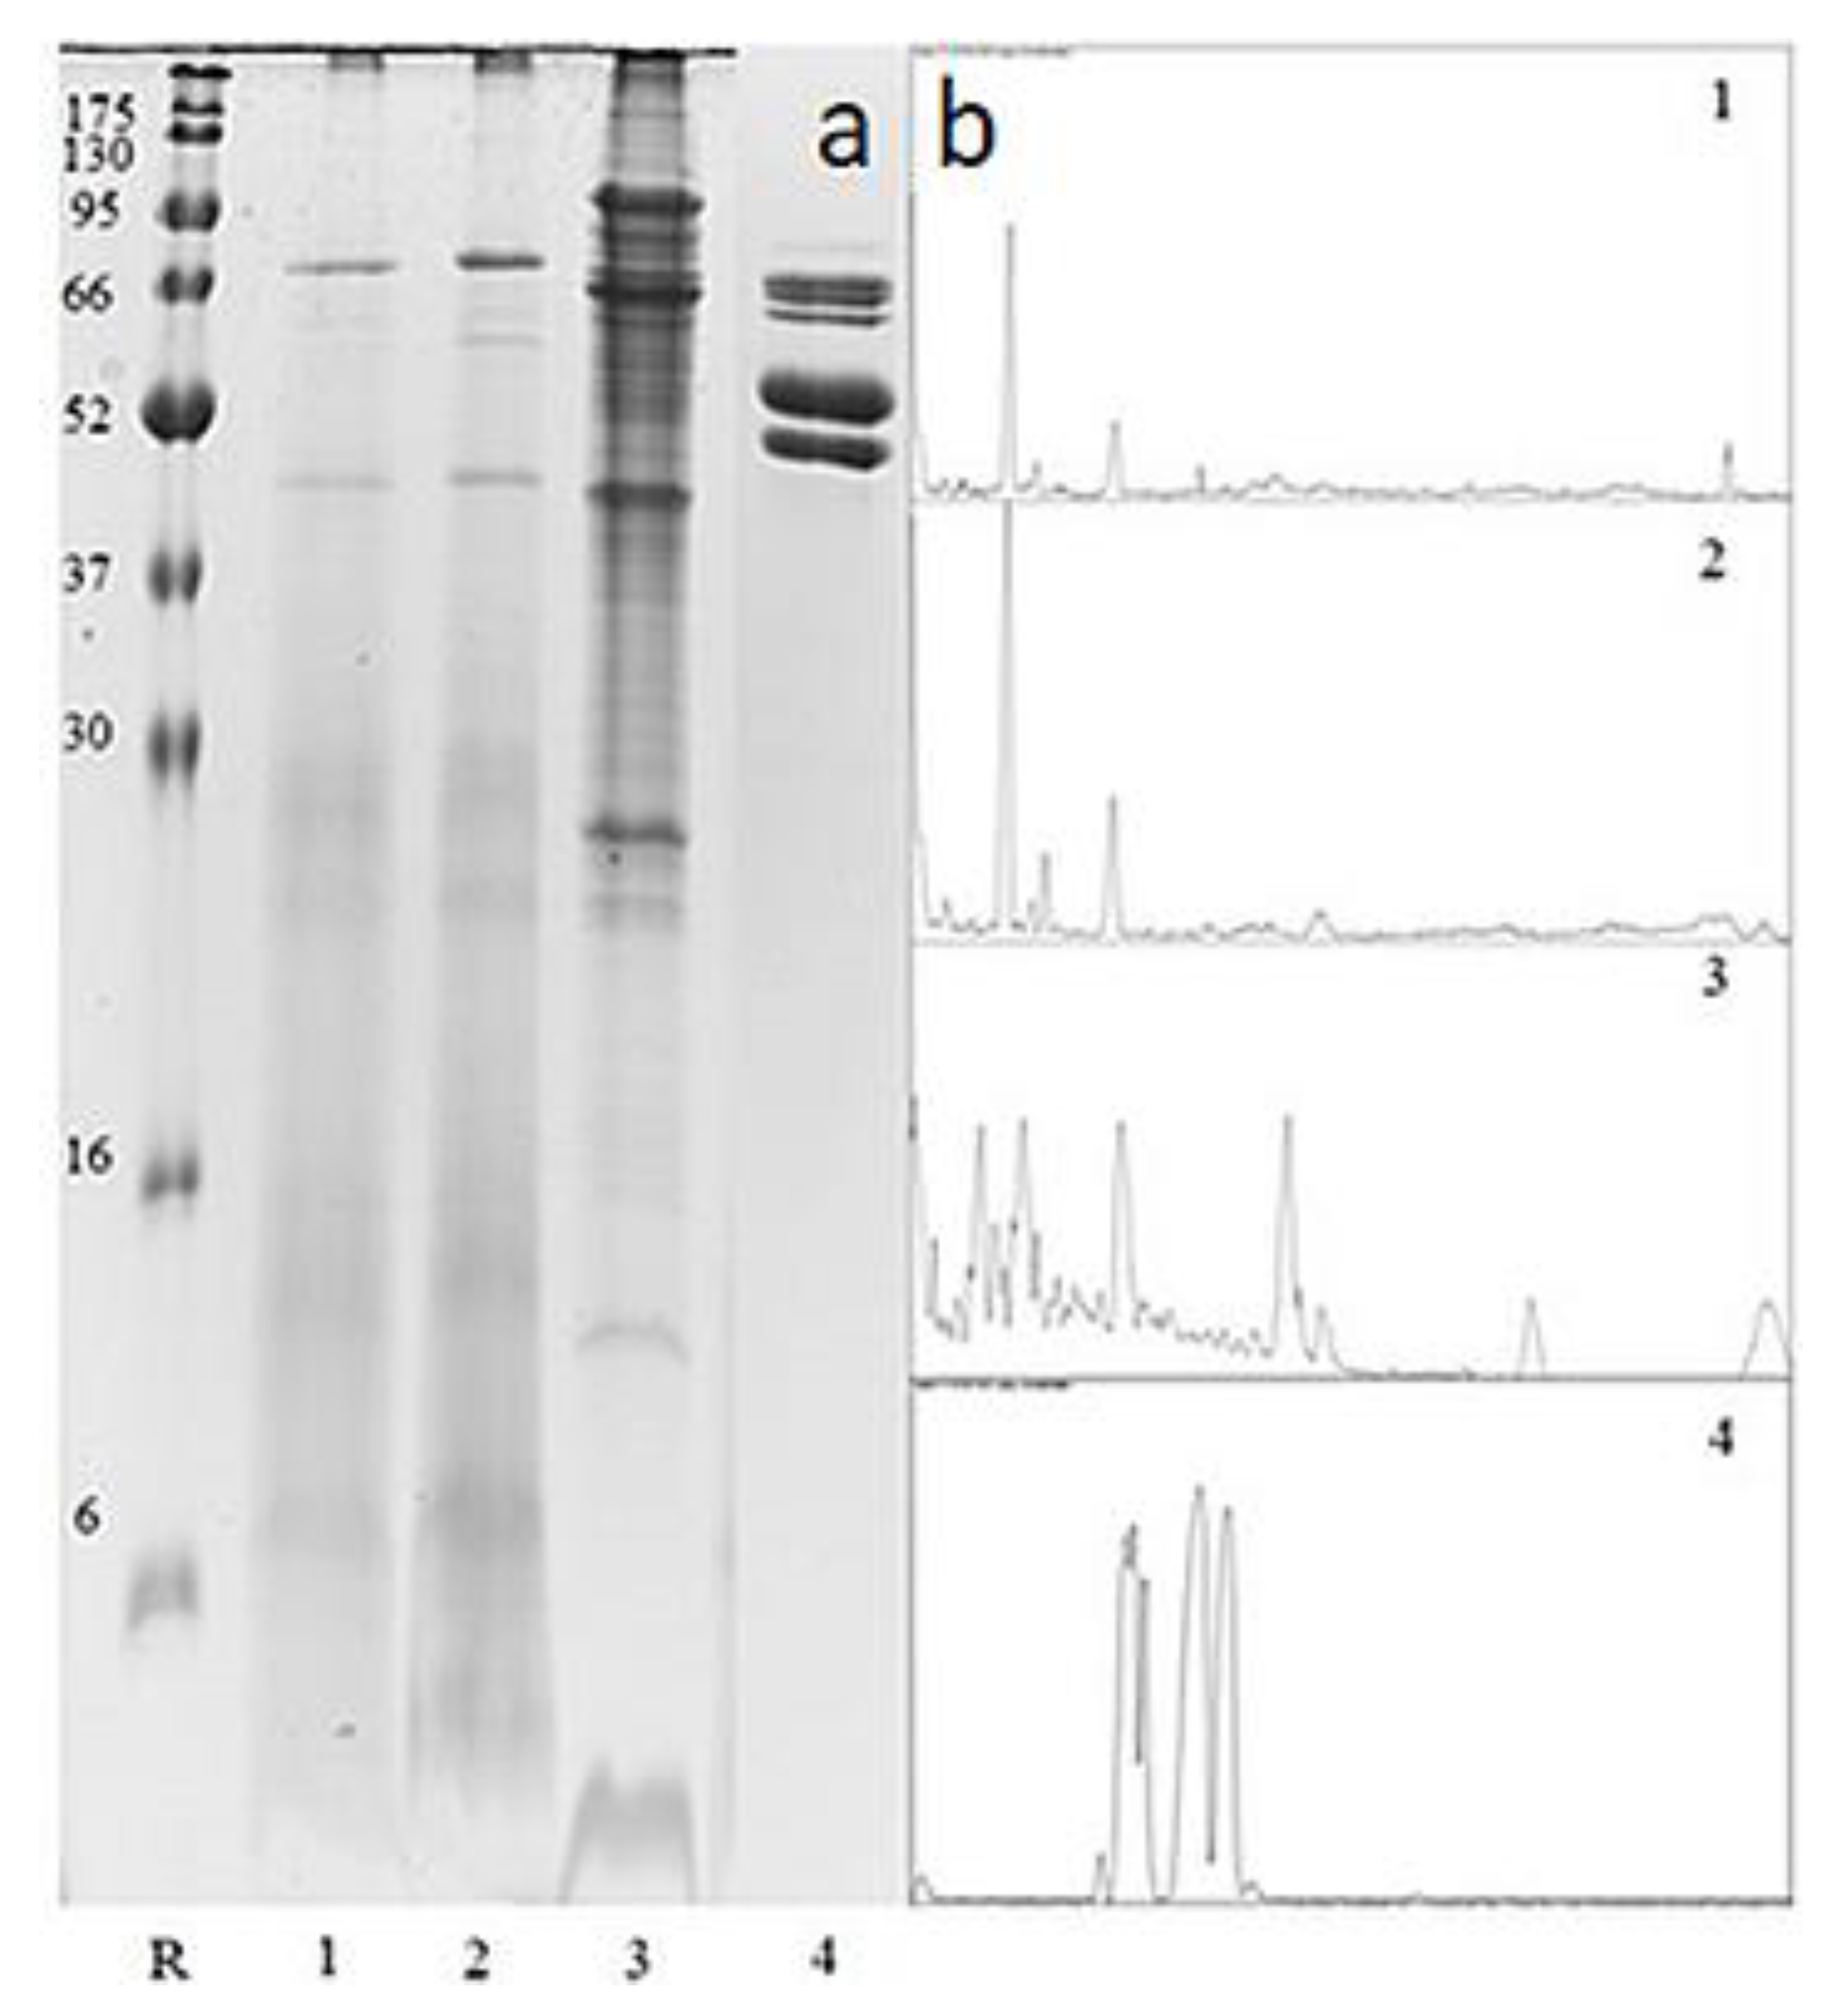
Protein Profiling by SDS-PAGE
2.4.6. Mineral Composition of Bioelements Using the ICP-OES Method
2.5. Hormonal Activity Determination
2.6. Antioxidants Assay
2.6.1. DPPH Test
2.6.2. FRAP Test
2.6.3. Total Phenolic Content (TPC) Determination
2.6.4. Total Flavonoid Content (TFC) Determination
2.7. HPTLC Analysis
2.8. Enzymatic Activity Assay
2.9. Statistical Analysis
3. Results
3.1. Physicochemical Properties of Drone Brood and Royal Jelly
3.2. Total Protein and Soluble Protein Fraction
Proteomic Identification of Drone Brood and Royal Jelly Using SDS PAGE
3.3. Biological Activity
3.3.1. Antioxidant Activity Determination
3.3.2. Hormonal Activity
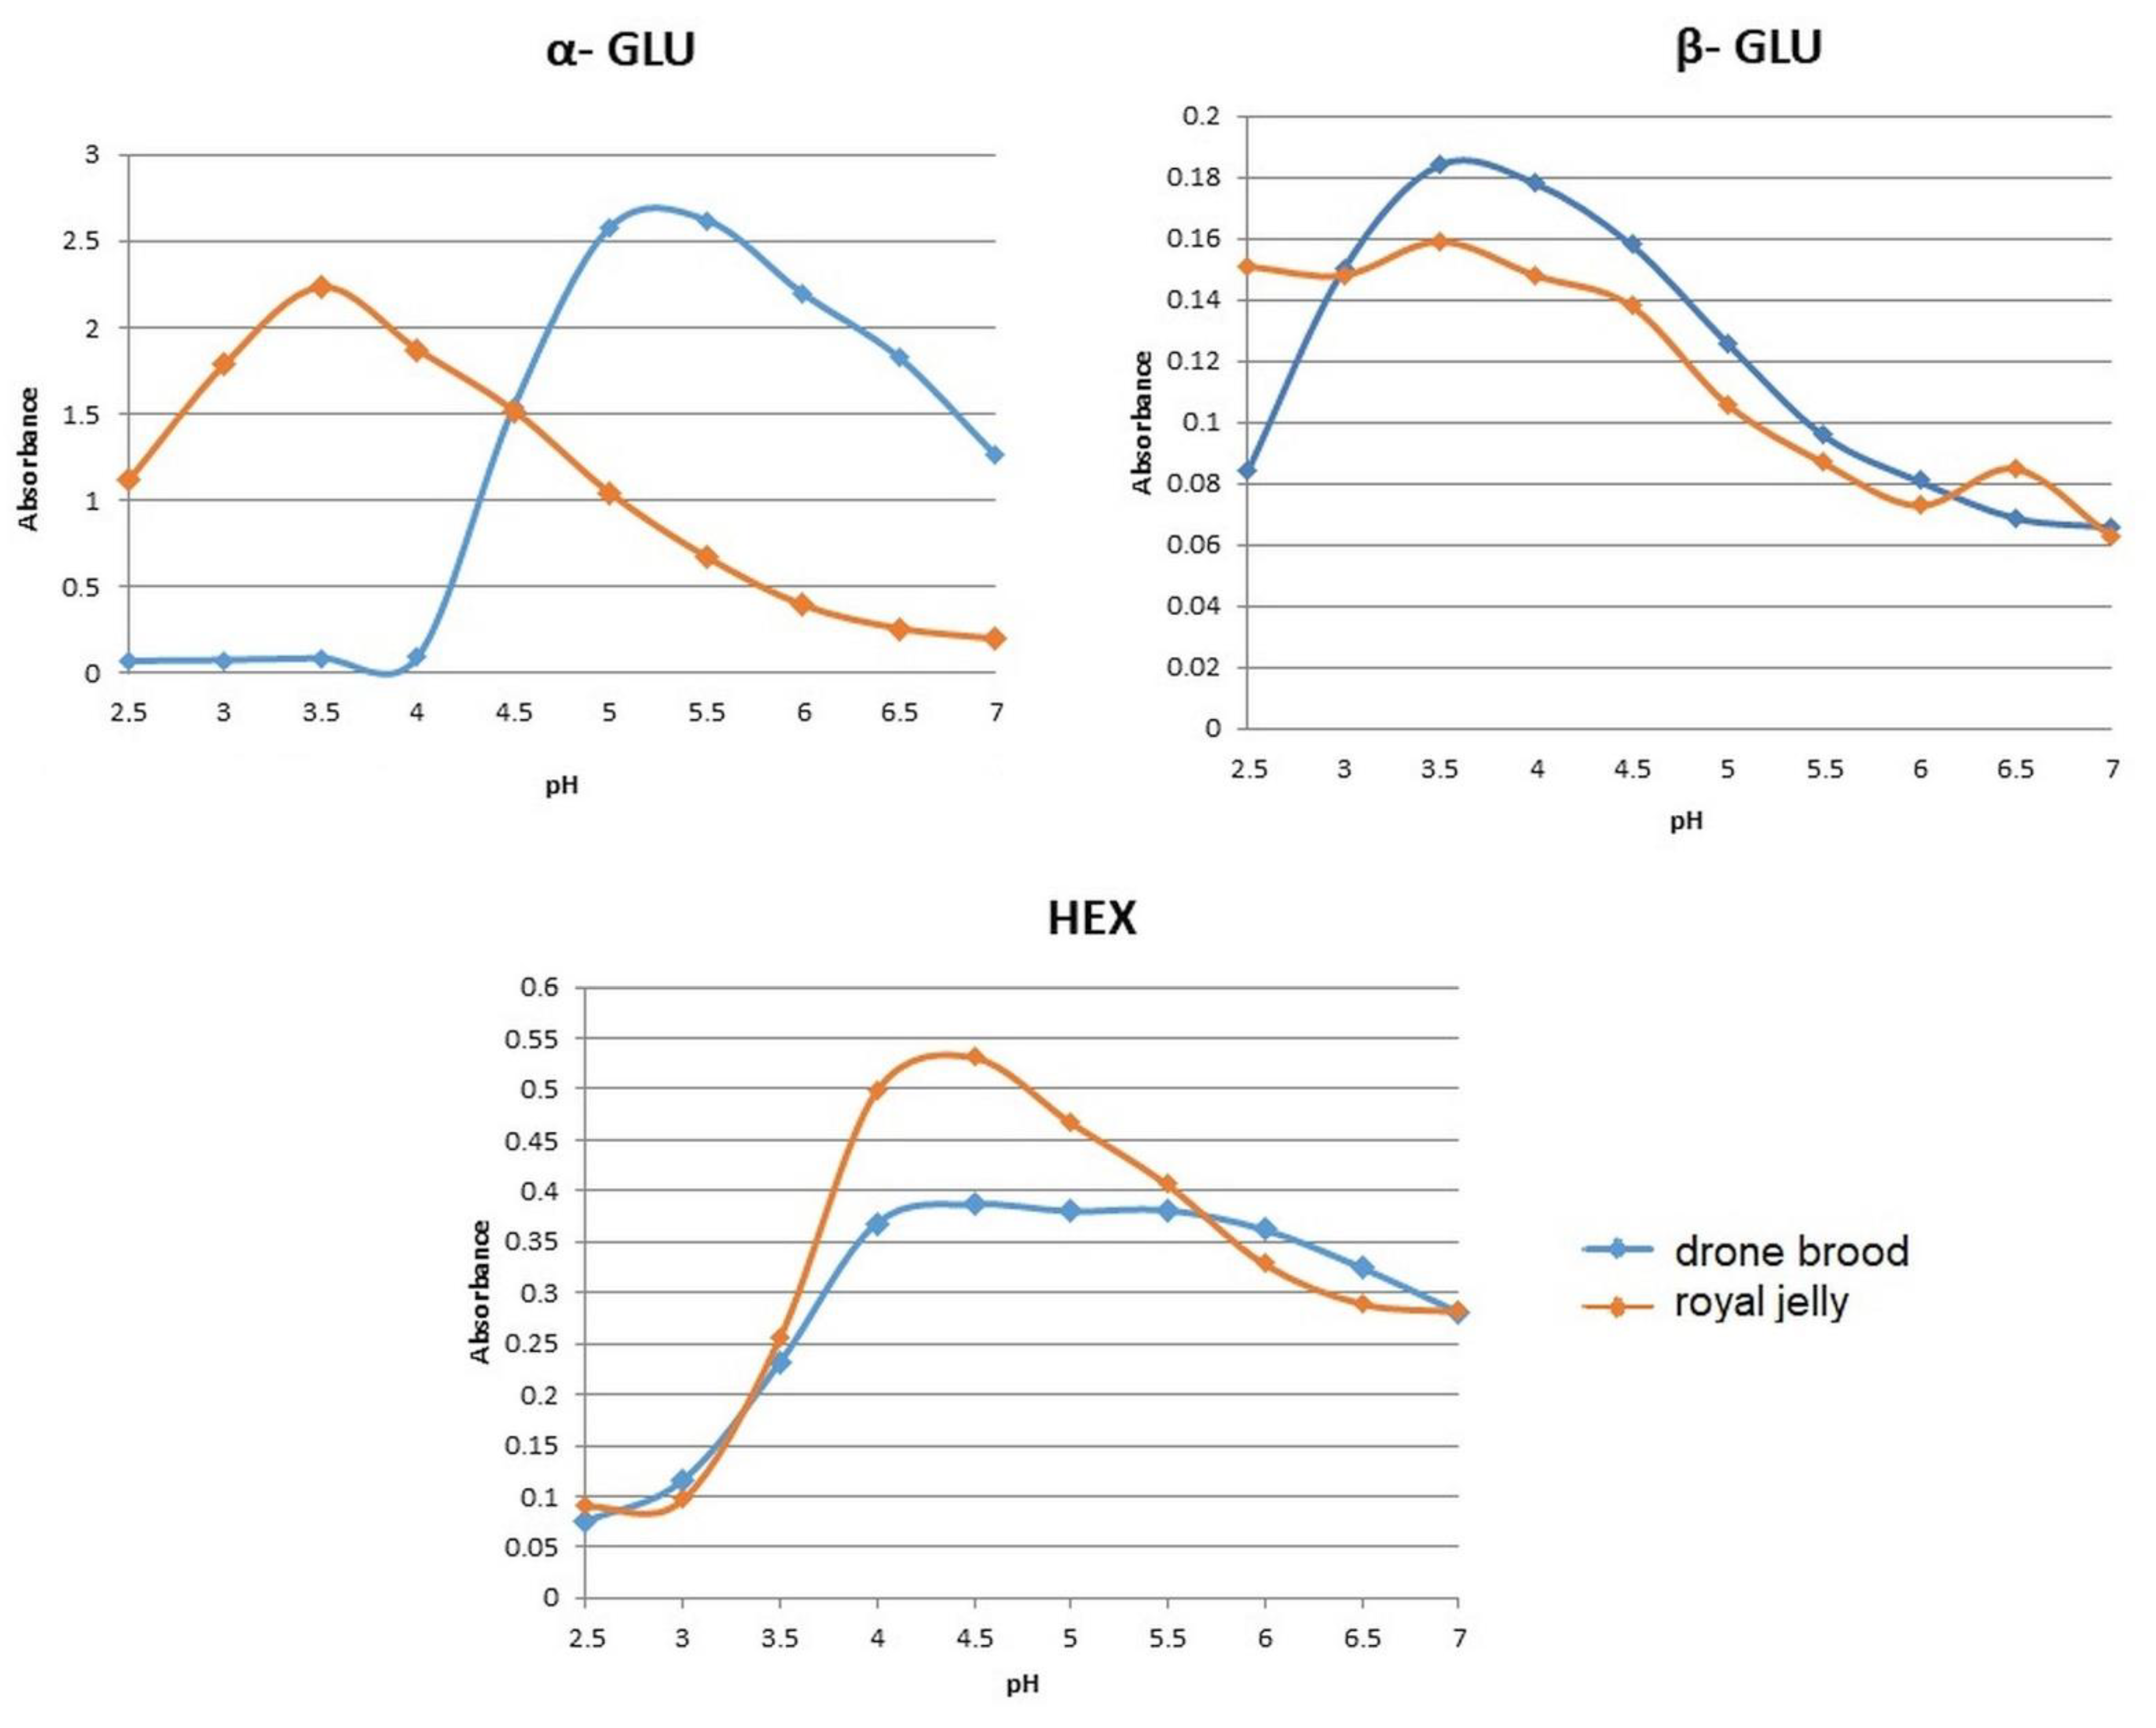
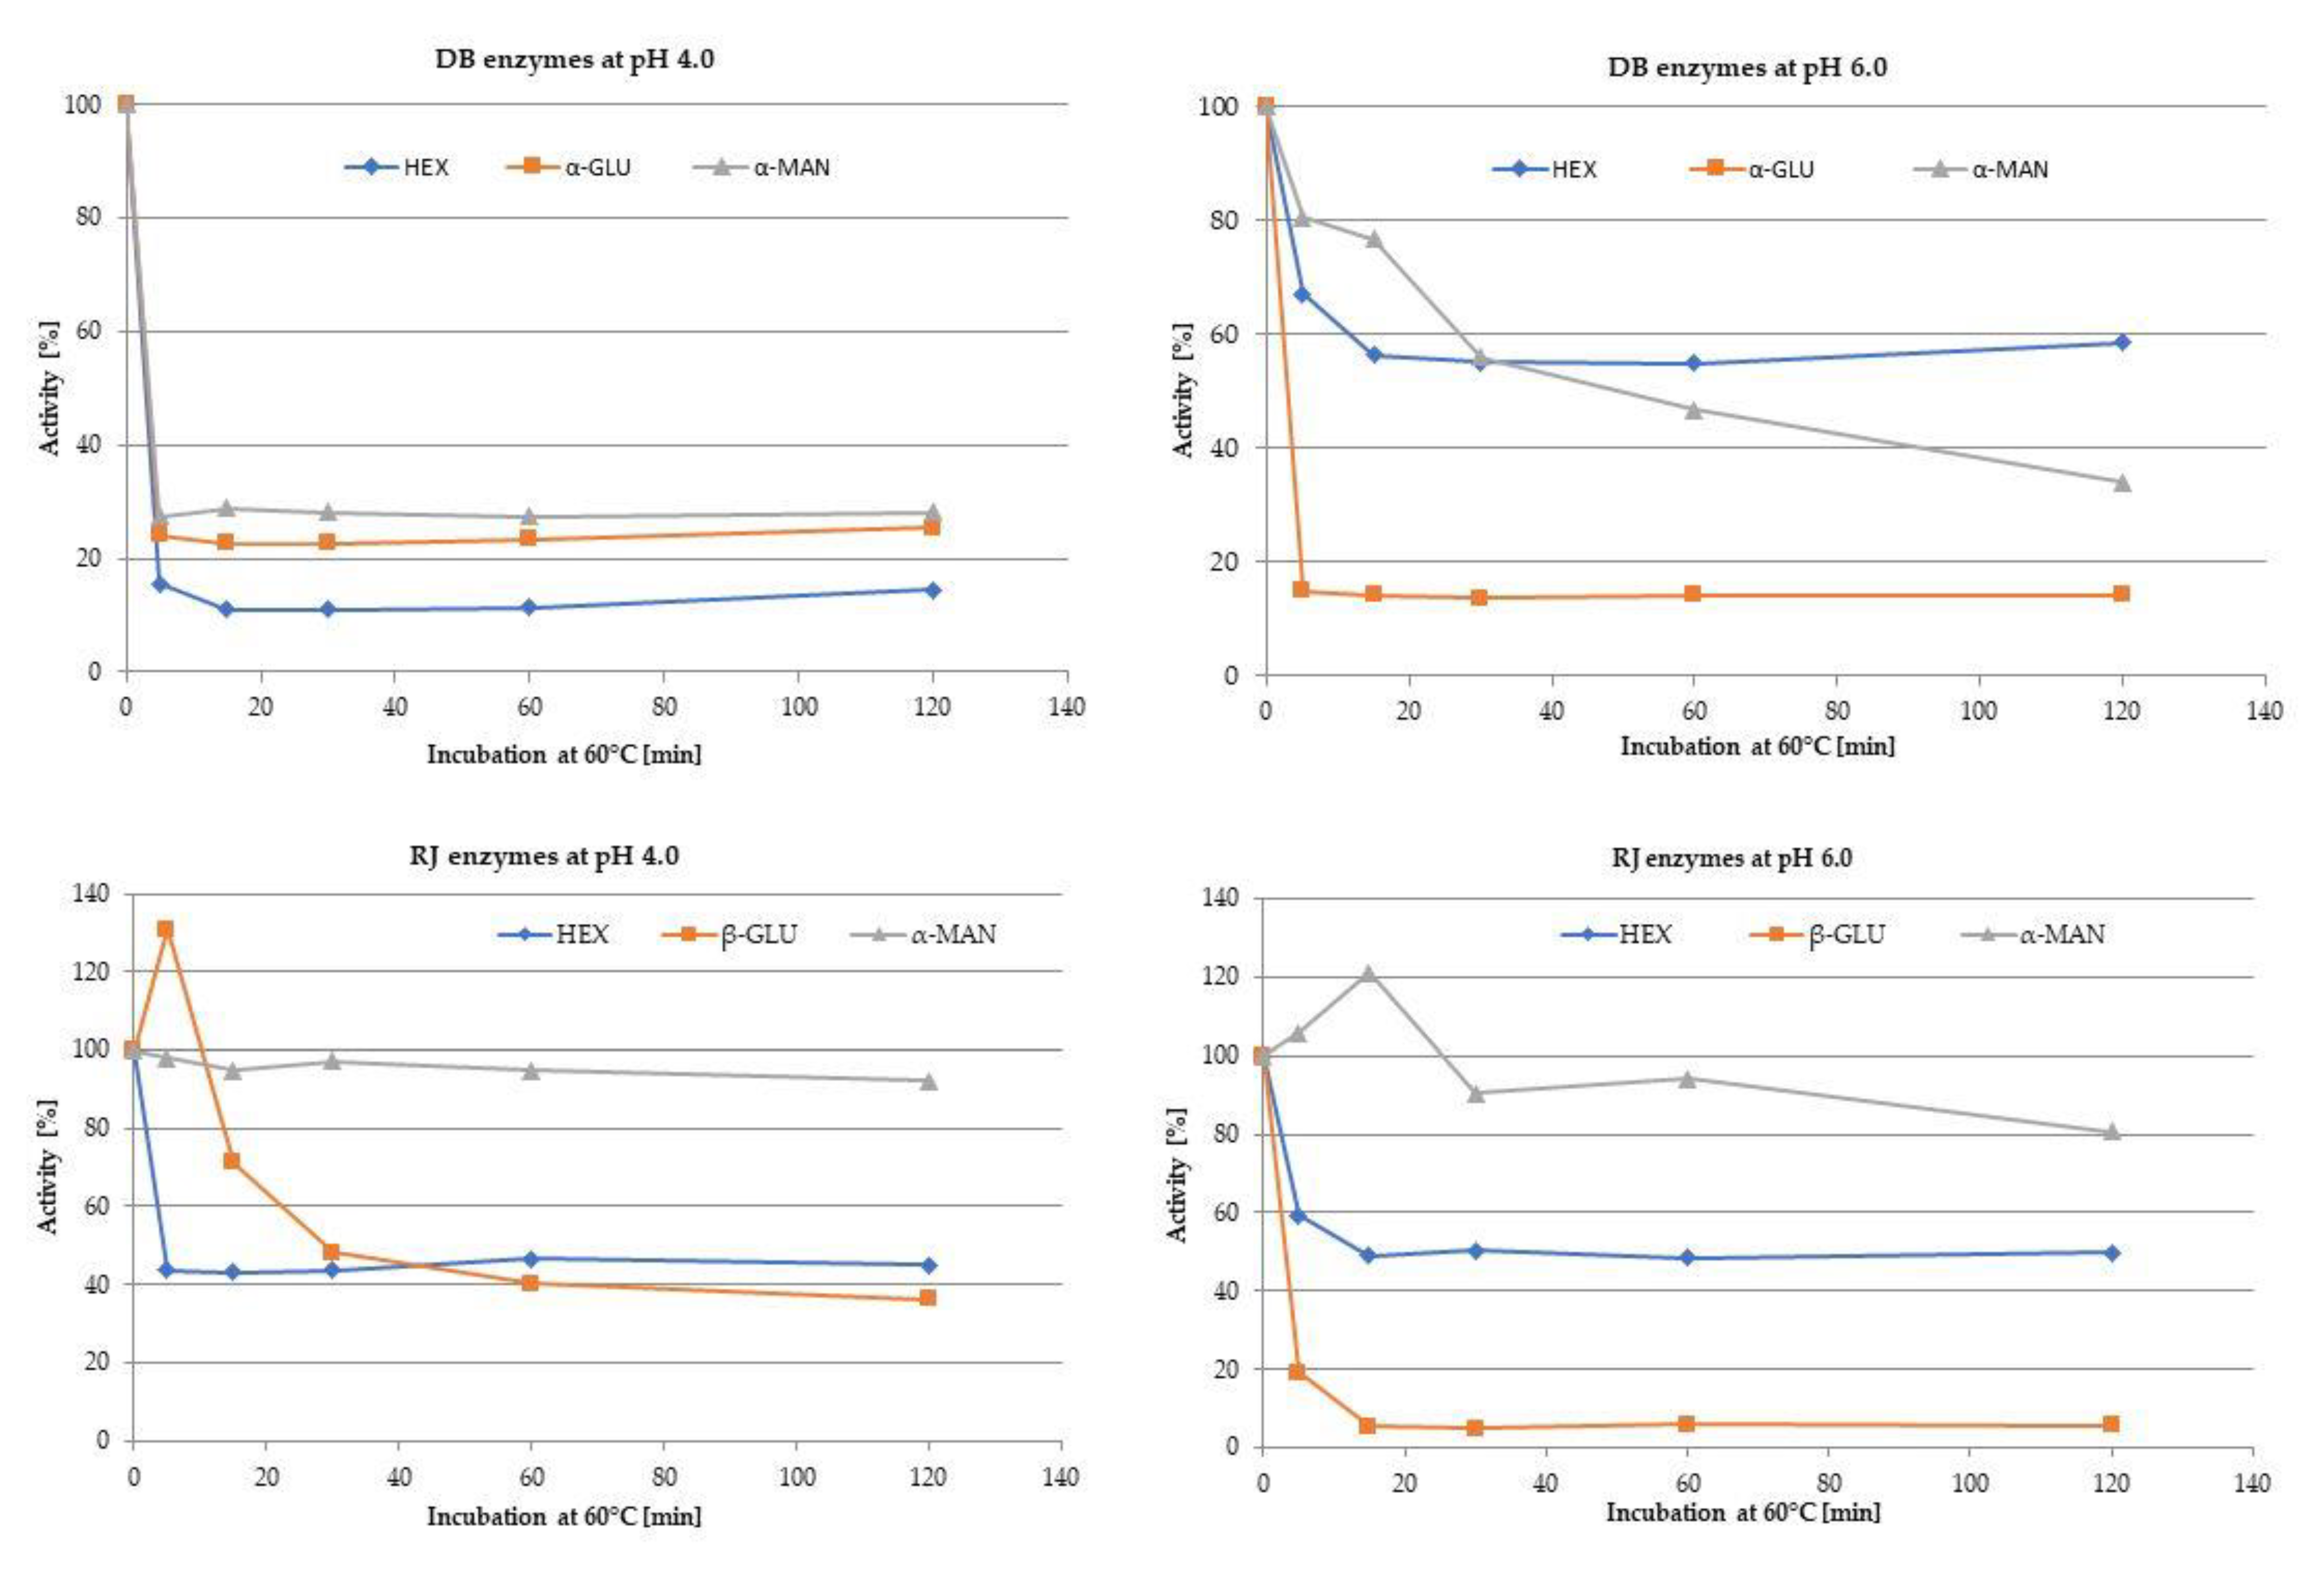
3.3.3. Enzyme Activity
3.4. High Performance Thin Layer Chromatography Analysis
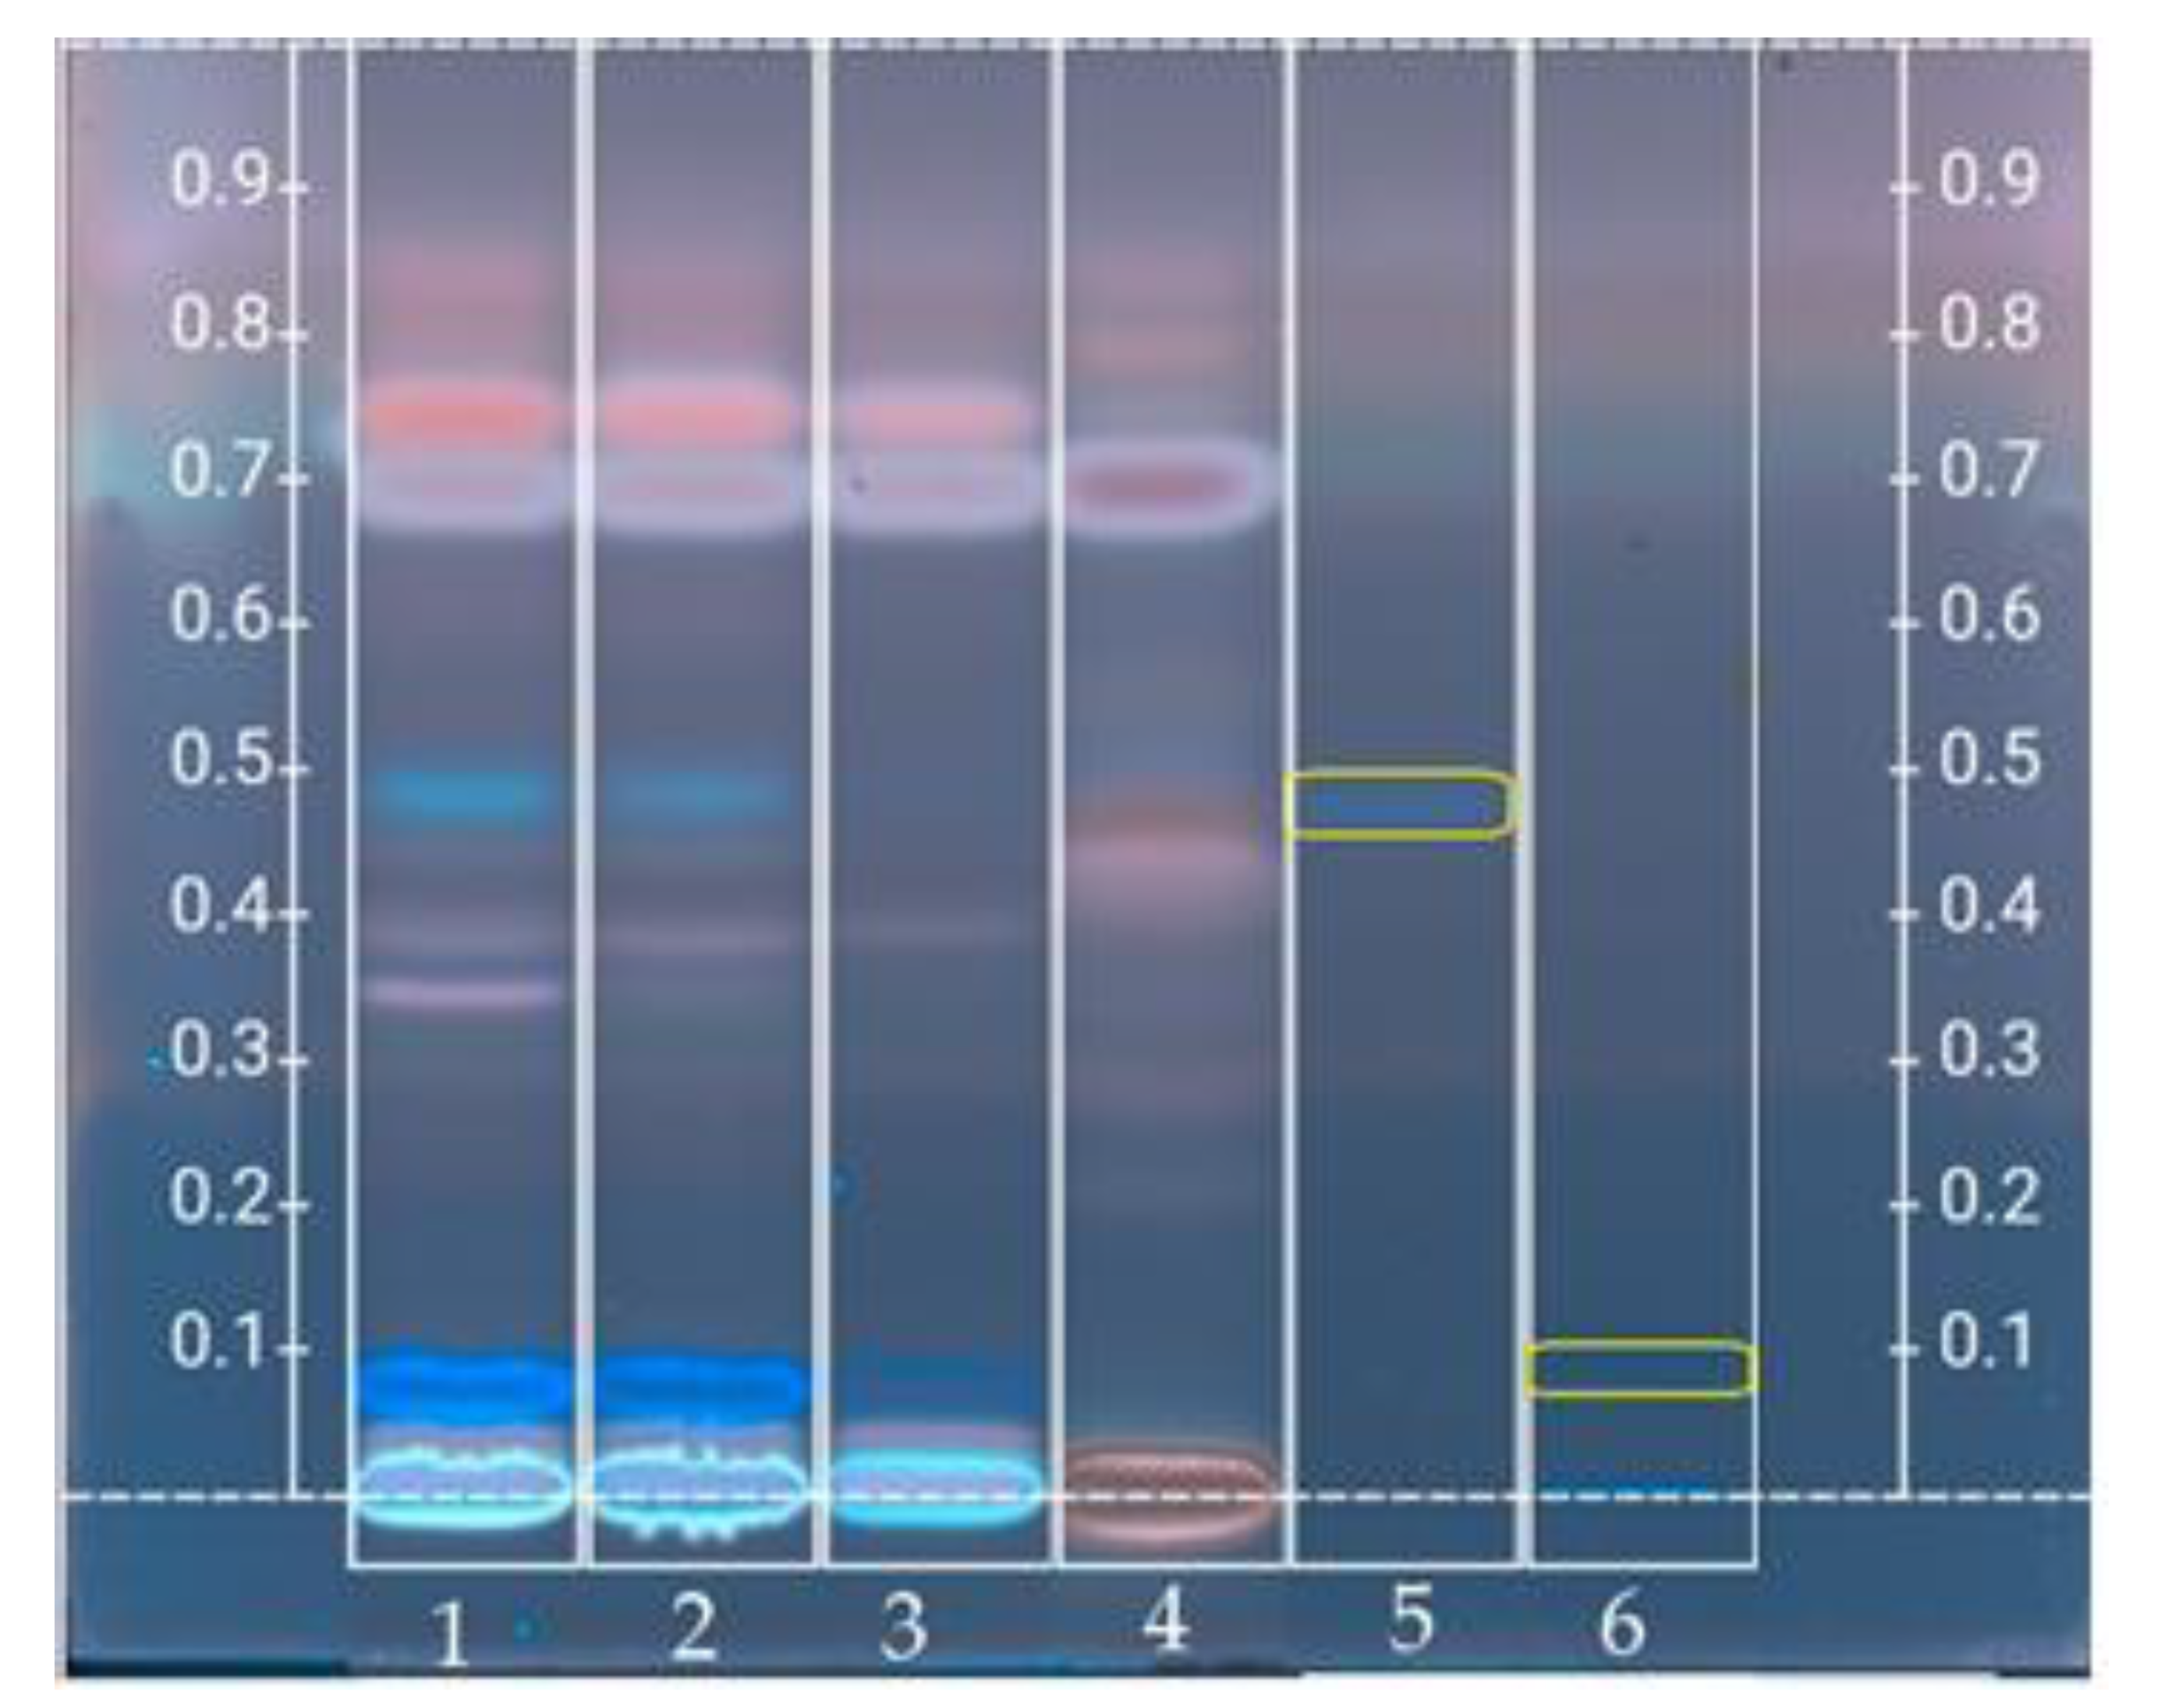
3.4.1. Polyphenolic Profile
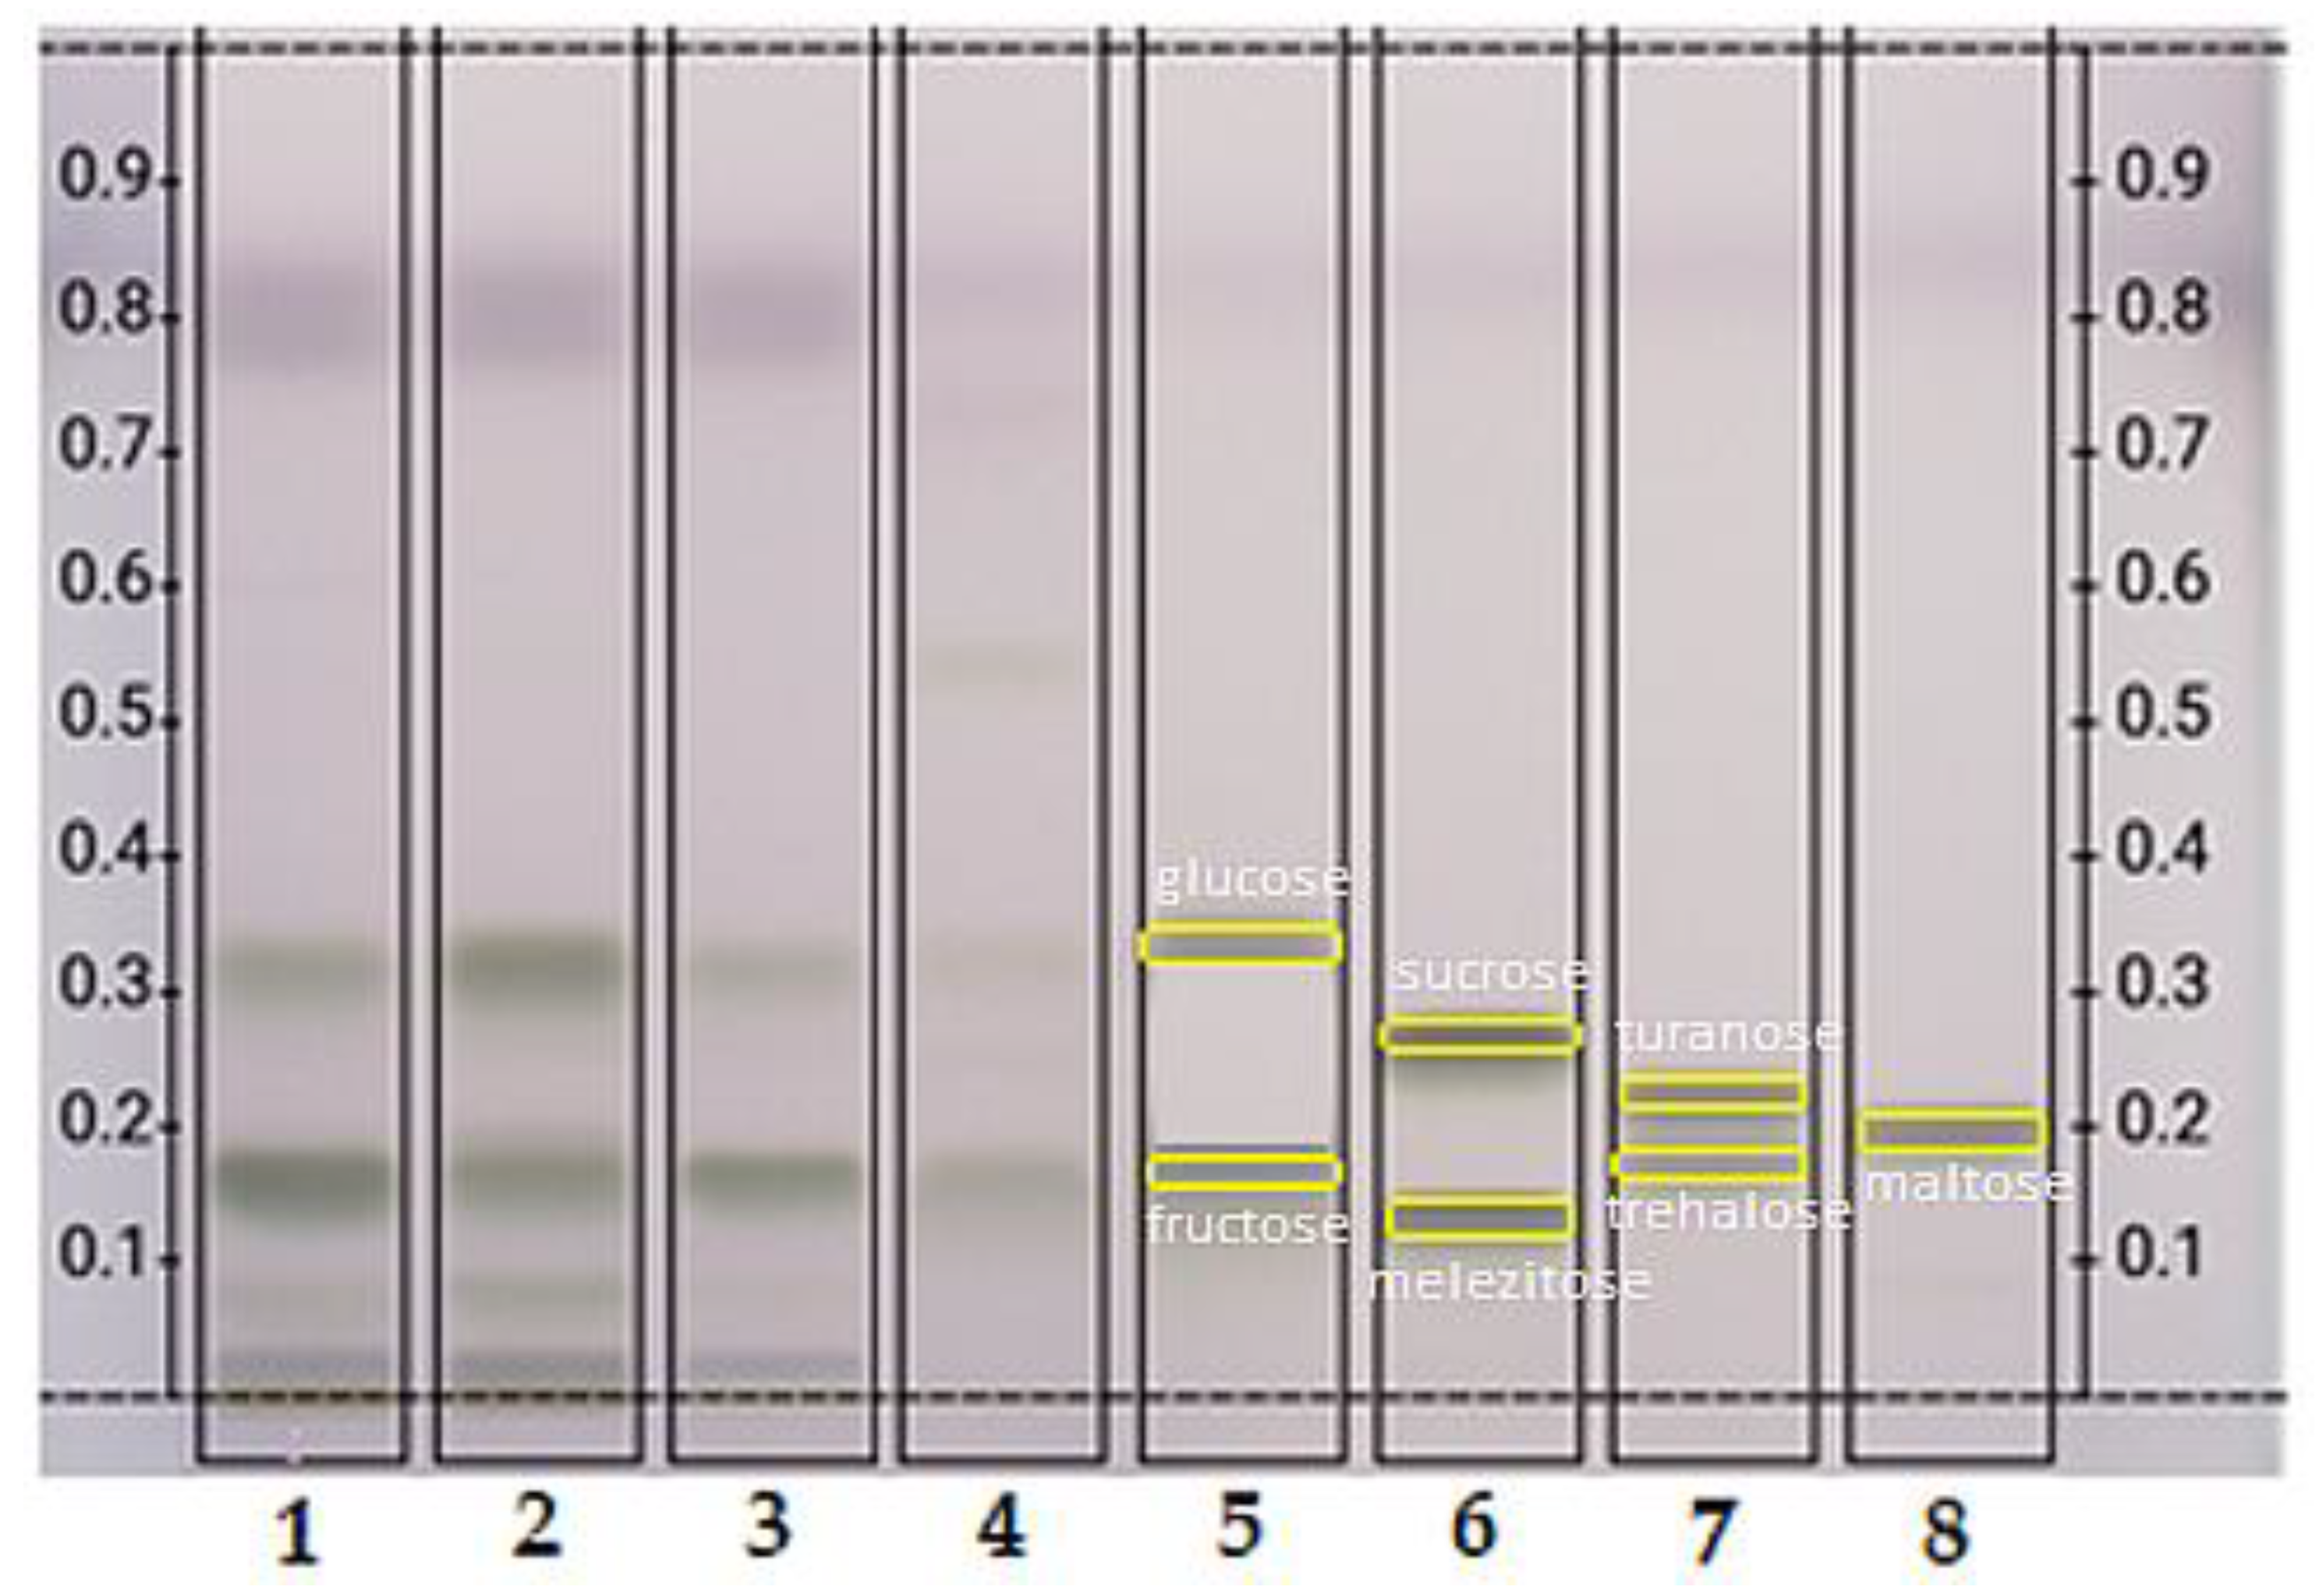
3.4.2. Sugars
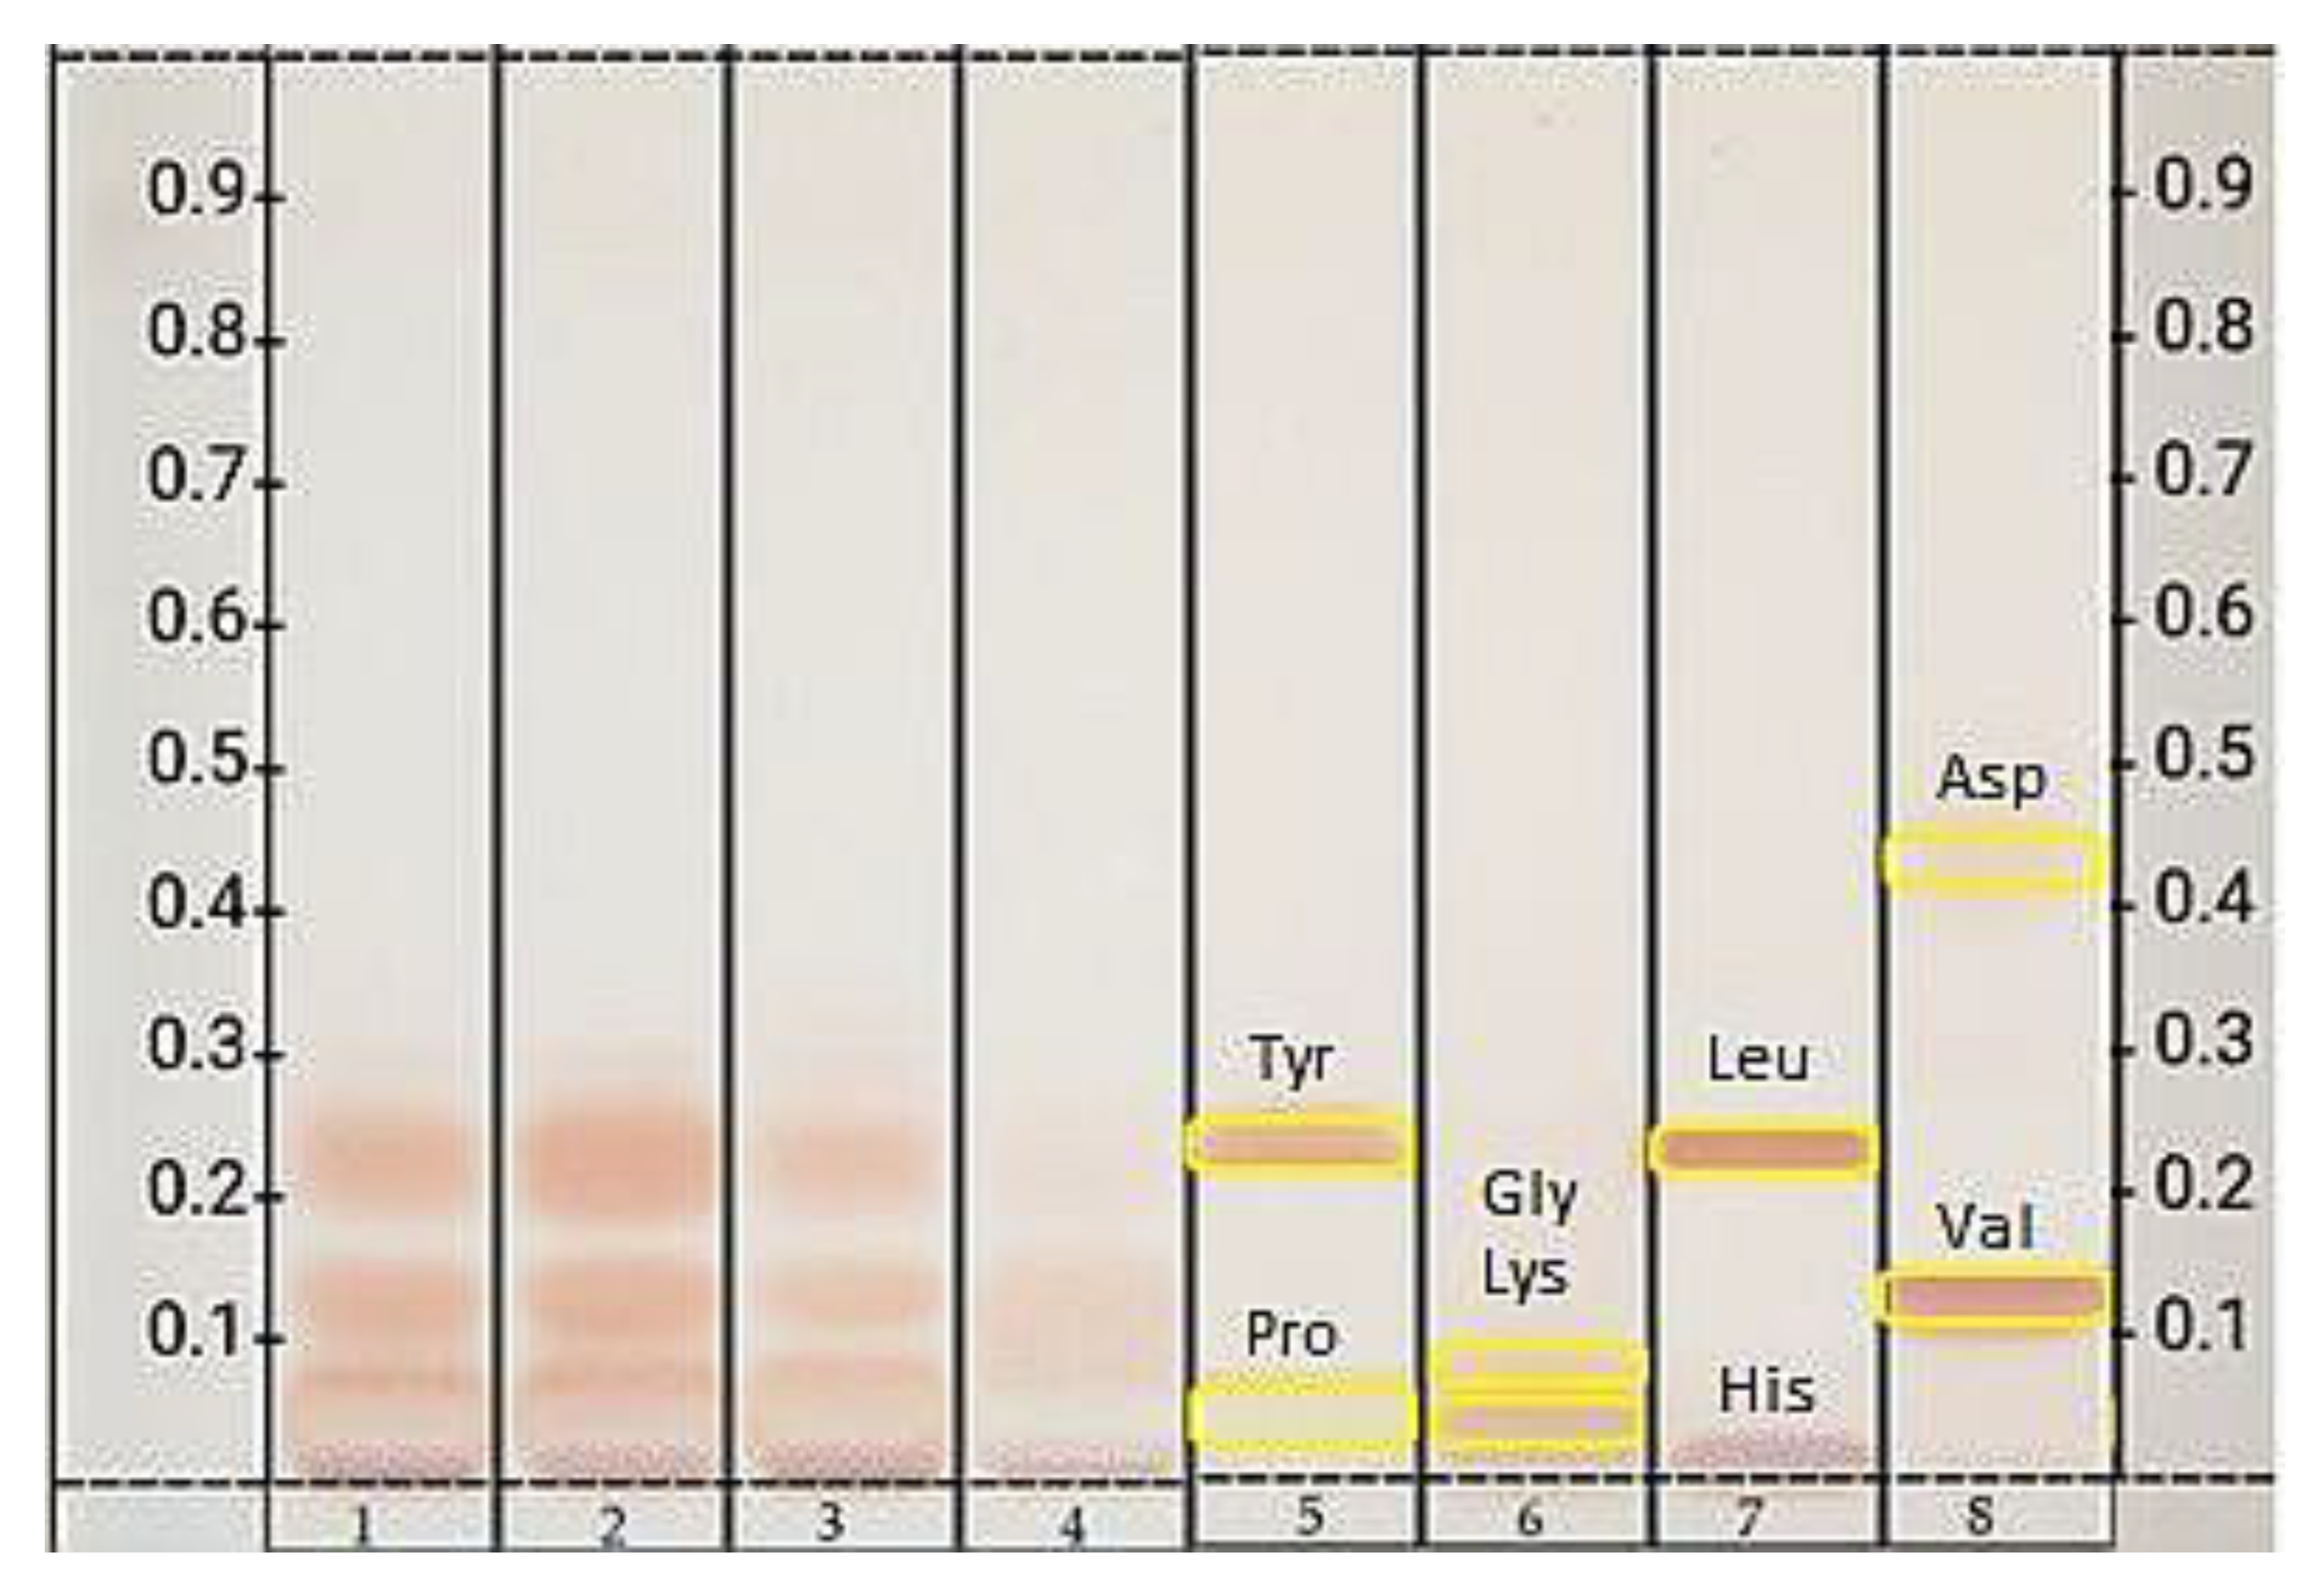
3.4.3. Amino Acids
4. Discussion
5. Conclusions
Author Contributions
Funding
Institutional Review Board Statement
Informed Consent Statement
Data Availability Statement
Acknowledgments
Conflicts of Interest
References
- Shoinbayeva, K.B.; Omirzak, T.; Bigara, T.; Abubakirova, A.; Dauylbay, A. Biologically active preparation and reproductive function of stud rams. Asian J. Pharm. 2017, 11, 184–191. [Google Scholar] [CrossRef]
- Sidor, E.; Dżugan, M. Drone brood homogenate as a natural remedy for treating health care problem—A scientific and practical approach. Molecules 2020, 25, 5699. [Google Scholar] [CrossRef]
- Collazo, N.; Carpena, M.; Nuñez-Estevez, B.; Otero, P.; Simal-Gandara, J.; Prieto, M.A. Health Promoting Properties of Bee Royal Jelly: Food of the Queens. Nutrients 2021, 13, 543. [Google Scholar] [CrossRef]
- Droba, B.; Droba, M.; Sibirnaja, L. Aktywność kwaśnych glikozydaz w mleczku pszczelim pozyskiwanym z mateczników na różnych etapach rozwoju larwy. Zesz. Probl. Postęp. Nauk Rol. 2016, 584, 13–21. (In Polish) [Google Scholar]
- Droba, B.; Droba, M.; Sibirnaja, L. Enzymy hydrolityczne z grupy kwaśnych glikozydaz występujące w mleczku pszczelim. In Właściwości Produktów i Surowców Żywnościowych, Wybrane Zagadnienia; PTTŻ: Kraków, Poland, 2014; pp. 125–135. (In Polish) [Google Scholar]
- Wilde, J. Encyklopedia Pszczelarska; PWRiL: Warszawa, Poland, 2013; pp. 1–453. (In Polish) [Google Scholar]
- Martinello, M.; Mutinelli, F. Antioxidant activity in bee products: A review. Antioxidants 2021, 10, 71. [Google Scholar] [CrossRef] [PubMed]
- Ramadan, M.F.; Al-Ghamdi, A. Bioactive compounds and health-promoting properties of royal jelly: A review. J. Funct. Foods 2012, 4, 39–52. [Google Scholar] [CrossRef]
- Wang, Y.; Ma, L.; Zhang, W.; Cui, X.; Wang, H.; Xu, B. Comparison of the nutrient composition of royal jelly and worker jelly of honey bees (Apis mellifera). Apidologie 2016, 47, 48–56. [Google Scholar] [CrossRef] [Green Version]
- Bałkańska, R. Sugar Composition of Royal Jelly Adulterated with Drone Brood and Bee Honey. Int. J. Curr. Microbiol. Appl. Sci. 2018, 7, 1876–1881. [Google Scholar] [CrossRef]
- Wang, Z.; Ren, P.; Wu, Y.; He, Q. Recent advances in analytical techniques for the detection of adulteration and authenticity of bee products—A review. Food Addit. Contam. Part A 2021, 38, 533–549. [Google Scholar] [CrossRef]
- Bogdanov, S. Royal Jelly and Bee Brood: Harvest, Composition, Quality. In The Royal Jelly Book; Bee Product Science: Muethlethurnen, Switzerland, 2012; Available online: www.bee-hexagon.net (accessed on 10 July 2021).
- Silici, S. Chemical Content and Bioactive Properties of Drone Larvae (Apilarnil). Mellifera 2019, 19, 14–22. [Google Scholar]
- Sawczuk, R.; Karpińska, J.; Miltyk, W. What do we need to know about drone brood homogenate and what is known. J. Ethnopharmacol. 2019, 245, 111581. [Google Scholar] [CrossRef]
- Thompson, M.; Owen, L.; Wilkinson, K.; Wood, R.; Damant, A. A comparison of the Kjeldahl and Dumas methods for the determination of protein in foods, using data from a proficiency testing scheme. Analyst 2002, 127, 1666–1668. [Google Scholar] [CrossRef] [PubMed]
- Latimer, G.W. Official Methods of Analysis of AOAC International; AOAC International: Gaithersburg, MD, USA, 2016. [Google Scholar]
- Laemmli, U.K. Cleavage of structural proteins during the assembly of the head of bacteriophage T4. Nature 1970, 15, 680–685. [Google Scholar] [CrossRef] [PubMed]
- Neuhoff, V.; Arold, N.; Taube, D.; Ehrhardt, W. Improved staining of proteins in polyacrylamide gels including isoelectric focusing gels with clear background at nanogram sensitivity using Coomassie Brilliant Blue G-250 and R-250. Electrophoresis 1988, 9, 255–262. [Google Scholar] [CrossRef]
- Estradiol; Elisa Test Kit. Abbexa, UK. Available online: https://www.abbexa.com/estradiol-elisa-kit (accessed on 13 September 2021).
- Testosterone; Elisa Test Kit. Abbexa, UK. Available online: https://www.abbexa.com/testosterone-t-elisa-kit (accessed on 13 September 2021).
- Dżugan, M.; Tomczyk, M.; Sowa, P.; Grabek-Lejko, D. Antioxidant Activity as Biomarker of Honey Variety. Molecules 2018, 23, 2069. [Google Scholar] [CrossRef] [Green Version]
- Biju, J.; Reddy, V.; Sulaiman, C.T. Total Phenolics and Flavonoids in Selected Justicia Species. J. Pharmacogn. Phytochem. 2013, 2, 51–52. [Google Scholar]
- Barrett, A.; Heath, M. Lysosomal enzymes. In Lysosomes: A Laboratory Handbook; Dingle, J., Ed.; Elsevier/North-Holland Biomedical Press: Amsterdam, The Netherlands, 1977; pp. 19–30. [Google Scholar]
- Sidor, E.; Miłek, M.; Tomczyk, M.; Dżugan, M. Antioxidant activity of frozen and freeze-dried drone brood homogenate regarding the stage of larval development. Antioxidants 2021, 10, 639. [Google Scholar] [CrossRef]
- Bertrams, J.; Kunz, N.; Müller, M.; Kammerer, D.; Stintzing, F.C. Phenolic compounds as marker compounds for botanical origin determination of German propolis samples based on TLC and TLC-MS. J. Appl. Bot. Food Qual. 2013, 86, 143–153. [Google Scholar] [CrossRef]
- Glinka, M.; Łukajtis, R.; Nowak, P.; Kamiński, M. Liquid chromatography techniques, used in technical analysis of hydrolysis processes, of lignocellulosic biomass. Camera Sep. 2017, 9, 92–105. [Google Scholar]
- Bałkańska, R.; Karadjova, I.; Ignatova, M. Comparative analyses of chemical composition of royal jelly and drone brood. Bulg. Chem. Commun. 2014, 46, 412–416. [Google Scholar]
- Barnutiu, L.I.; Marghitaş, L.A.; Dezmirean, D.; Bobiş, O.; Mihai, C.; Pavel, C. Physico-chemical composition of apilarnil (bee drone larvae). Lucr. Ştiinţifice-Seria Zooteh. 2013, 59, 199–202. [Google Scholar]
- Wytrychowski, M.; Chenavas, S.; Daniele, G.; Casabianca, H.; Batteau, M.; Guibert, S.; Brion, B. Physicochemical characterisation of French royal jelly: Comparison with commercial royal jellies and royal jellies produced through artificial bee-feeding. J. Food Compos. Anal. 2013, 29, 126–133. [Google Scholar] [CrossRef]
- Kolayli, S.; Sahin, H.; Can, Z.; Yildiz, O.; Malkoc, M.; Asadov, A. A member of complementary medicinal food: Anatolian royal jellies, their chemical compositions, and antioxidant properties. J. Evid.-Based Complement. Altern. Med. 2016, 21, NP43–NP48. [Google Scholar] [CrossRef] [PubMed] [Green Version]
- Krell, R. Value—Added from Beekeeping; Bulletin No. 124; FAO Agricultural Services: Rome, Italy, 1996; pp. 409–411. [Google Scholar]
- Nabas, Z.; Haddadin, M.S.; Haddadin, J.; Nazer, I.K. Chemical composition of royal jelly and effects of symbiotic with two different locally isolated probiotic strains on antioxidant activities. Pol. J. Food Nutr. Sci. 2014, 64, 171–180. [Google Scholar] [CrossRef]
- Stocker, A.; Schramel, P.; Kettrup, A.; Bengsch, E. Trace and mineral elements in royal jelly and homeostatic effects. J. Trace Elem. Med. Biol. 2005, 19, 183–189. [Google Scholar] [CrossRef]
- Bengü, A.Ş.; Ayna, A.; Özbolat, S.; Tunç, A.; Aykutoğlu, G. Content and antimicrobial activities of bingol royal jelly. Türk Tarım ve Doğa Bilimleri Derg. 2020, 7, 480–489. [Google Scholar] [CrossRef]
- Prokhoda, A.; Yankina, O.; Kim, N.; Koltun, G.; Skolov, A. Chemical composition of the far eastern homogenate of drone brood. E3S Web Conf. 2020, 203, 4015. [Google Scholar] [CrossRef]
- Iliesiu, N. A modern preparation of bees “Apilarnil”. Inf. Reg. Zrzesz. Pszczel. Apipol. 1988, 10, 15–20. [Google Scholar]
- Sabatini, A.M.; Caboni, G.; Bogdanov, M.S.; Almeida-Muradian, L. Quality and standardisation of Royal Jelly. J. ApiProd. ApiMed. Sci. 2009, 1, 16–21. [Google Scholar] [CrossRef]
- Han, B.; Li, C.X.; Zhang, L.; Fang, Y.; Feng, M.; Li, J. Novel Royal Jelly Proteins Identified by Gel-Based and Gel-free Proteomics. J. Agric. Food Chem. 2011, 59, 10346–10355. [Google Scholar] [CrossRef]
- Dżugan, M.; Lis, M.; Droba, M.; Niedziółka, J.W. Effect of cadmium injected in ovo on hatching results and the activity of plasma hydrolytic enzymes in newly hatched chicks. Acta Vet. Hung. 2011, 59, 337–347. [Google Scholar] [CrossRef]
- Dżugan, M.; Lis, M. Cadmium-induced changes in hatchability and in the activity of aminotransaminases and selected lysosomal hydrolases in the blood plasma of Muscovy ducklings (Cairina moschata). Acta Vet. Hung. 2016, 64, 239–249. [Google Scholar] [CrossRef] [PubMed] [Green Version]
- Thrasyvoulou, A.T. The use of HMF and diastase as criteria of quality of Greek honey. J. Apic. Res. 1986, 25, 186–195. [Google Scholar] [CrossRef]
- Mitrofanov, D.V.; Vakhonina, E.A.; Budnikova, N.V. Reducing agents of drone brood products supplemented by royal jelly, propolis and chitosan derivatives. IOP Conf. Ser. Earth Environ. Sci. 2021, 624, 8–13. [Google Scholar] [CrossRef]
- Farag, S. Separation and Analysis of Some Sugars by Using Thin Layer Chromatography. J. Sugarbeet Res. 1978, 20, 251–254. [Google Scholar] [CrossRef]
- Margaoan, R.; Marghitas, L.A.; Dezmirean, D.S.; Bobis, O.; Bonta, V.; Catana, C.; Urcan, A.; Muresan, C.I.; Margin, M.G. Comparative Study on Quality Parameters of Royal Jelly, Apilarnil and Queen Bee Larvae Triturate. Bull. Univ. Agric. Sci. Vet. Med. Cluj-Napoca Anim. Sci. Biotechnol. 2017, 74, 51–58. [Google Scholar] [CrossRef] [Green Version]
- Mbaya, J.S.K. Usages of bee products in folk medicine in Kenia. In Bee Products: Properties, Application and Apitherapy; Springer: NewYork, NY, USA, 1996; p. 98. [Google Scholar]
- López-Gutiérrez, N.; Aguilera-Luiz, M.D.M.; Romero-González, R.; Vidal, J.L.M.; Frenich, A.G. Fast analysis of polyphenols in royal jelly products using automated TurboFlowTM-liquid chromatography-Orbitrap high resolution mass spectrometry. J. Chromatogr. B Anal. Technol. Biomed. Life Sci. 2014, 973, 17–28. [Google Scholar] [CrossRef]
- Meda, A.; Lamien, C.E.; Millogo, J. Therapeutic uses of honey and honeybee larvae in central Burkina Faso. J. Ethnopharmacol. 2004, 95, 103–107. [Google Scholar] [CrossRef] [PubMed]
- Burmistrova, L. Physico-Chemical and Biological Appreciation of Drone Brood. Ph.D. Thesis, Ryazan Medical University, Ryazan, Russia, 1999. (In Russian). [Google Scholar]


| Identified Group | Mobile Phase (v:v:v) | Derivatization Reagent | Used Standards |
|---|---|---|---|
| Polyphenolics | Chloroform:ethyl acetate:formic acid (5:4:1) | p-anisaldehyde-sulfuric acid reagent | Ferulic acid, ellagic acid |
| Sugars | 1-propanol:1-butanol:boric acid 5 mg/mL H2O (3:5:1) | p-anisaldehyde-sulfuric acid reagent | Glucose, fructose, trehalose, melezitose, sucrose, turanose, maltose |
| Amino acids | 1-butanol:acetic acid:water (3:1:1) | Ninhydrin in ethanol (2 mg/50 mL) | Proline, tyrosine, glycine, lysine, histidine, leucine, aspartic acid, valine |
| Physicochemical Composition Min–Max (Mean) | |||||
|---|---|---|---|---|---|
| Drone Brood | Royal Jelly (n = 3) | ||||
| 7-day-old (n = 3) | 11-day-old (n = 3) | 14-day-old (n = 3) | Mean (7–14-day-old) | ||
| Water content [%] | 69.6–70.3 (69.9) a | 69.4–72.8 (71.6) a | 68.7–73.1 (71.9) a | 71.1 A | 65.4–69.0 (68.4) aA |
| pH | 6.52–6.58 (6.53) b | 6.62–6.70 (6.66) b | 6.58–6.78 (6.63) b | 6.60 A | 3.97–3.98 (3.97) aB |
| Acidity [mval/g WW] | 10.0–18.0 (13.3) b | 10.0–18.5 (14.3) b | 9.90–19.0 (14.4) b | 14.0 B | 6.30–6.50 (6.36) aA |
| Conductivity [mS/cm] | 0.03–0.04 (0.03) a | 0.03–0.04 (0.03) a | 0.03–0.04 (0.03) a | 0.03 A | 0.03–0.04 (0.03) aA |
| Refractive index [nD] | 1.337–1.339 (1.338) a | 1.337–1.339 (1.338) a | 1.337–1.339 (1.338) a | 1.338 A | 1.340–1.342 (1.341) aA |
| Macroelements min–max (mean) [mg/100 g WW] | |||||
| Na | 6.45–10.27 (8.73) b | 8.63–26.09 (6.99) a | 7.32–9.93 (8.40) b | 8.04 A | 10.3–13.8 (12.0) cB |
| K | 276.06–337.06 (287.32) a | 240.96–313.99 (286.36) a | 259.30–314.32 (292.58) a | 288.75 A | 321.1–357.4 (391.0) bB |
| Ca | 15.16–21.02 (17.77) b | 8.91–57.05 (27.98) d | 8.13–17.47 (12.52) a | 19.42 A | 22.8–24.0 (23.5) cB |
| Mg | 29.21–34.02 (32.04) a | 15.25–33.24 (26.18) a | 21.02–122.73 (56.57) c | 38.26 A | 44.0–50.4 (47.2) bB |
| P | 296.69–324.02 (302.40) a | 212.22–348.70 (287.92) a | 267.26–351.35 (316.21) b | 302.17 A | 338.4–412.1 (375.0) cB |
| S | 392.37–99.27 (96.30) b | 53.33–100.99 (75.85) a | 99.27–126.87 (110.39) c | 94.18 A | 153.2–169.3 (161.2) dB |
| Microelements min–max (mean) [mg/100 g WW] | |||||
| Fe | 1.17–1.23 (1.20) b | 0.57–1.17 (0.93) a | 1.29–1.62 (1.41) c | 1.18 A | n.d. |
| Mn | 0.21–0.45 (0.33) c | 0.27–0.33 (0.21) b | 0.06–0.39 (0.18) a | 0.24 B | 0.01–0.08 (0.05) aA |
| Zn | 41.44–1.71 (1.56) b | 0.89–1.80 (1.29) a | 1.14–2.04 (1.49) ab | 1.44 A | 2.07–2.58 (2.32) cB |
| Cr | 0.01–0.03 (0.02) a | 0.00–0.03 (0.01) a | 0.02–0.07 (0.04) a | 0.02 A | 0.03–0.15 (0.09) aA |
| Cu | 0.29–0.44 (0.36) b | 0.15–0.39 (0.27) a | 0.32–0.38 (0.35) b | 0.32 A | 0.31–0.39 (0.33) abA |
| Other min–max (mean) [mg/100 g WW] | |||||
| Sr | 0.00–0.006 (0.004) a | 0.00–0.18 (0.06) a | 0.00–0.006 (0.003) a | 0.022 A | n.d. |
| As | 0.00–0.002 (0.03) a | 0.00–0.006 (0.003) a | 0.003–0.003 (0.003) a | 0.003 A | 0.01–0.09 (0.04) aB |
| Contaminants min–max (mean) [mg/100 g WW] | |||||
| Al | 0.39–0.64 (0.48) a | 0.48–1.19 (0.76) b | 0.54–1.15 (0.93) c | 0.62 A | 0.48–3.35 (0.64) bA |
| Cd | 0.003–0.003 (0.003) a | 0.00–0.007 (0.003) a | 0.00–0.003 (0.0003) a | 0.0021 A | n.d. |
| Pb | 0.00–0.005 (0.003) a | 00.00–0.004 (0.004) a | 0.003–0.006 (0.003) a | 0.0033 A | 0.04–0.07 (0.02) aA |
| Drone Brood | Royal Jelly (n = 3) | ||||
|---|---|---|---|---|---|
| 7–day-old (n = 3) | 11-day-old (n = 3) | 14-day-old (n = 3) | Mean (7–14-day-old) | ||
| CHN elemental analysis | |||||
| C [%] | 16.49–16.70 (16.58) b | 16.49–16.60 (16.54) b | 15.92–16.99 (16.57) b | 16.56 B | 13.23–14.06 (13.64) aA |
| H [%] | 2.09–2.12 (2.11) a | 2.06–2.12 (2.10) a | 2.12–2.17 (2.14) a | 2.11 A | 2.89–2.41 (2.15) aA |
| N [%] | 2.08–2.25 (2.16) a | 2.12–2.35 (2.25) a | 2.01–2.34 (2.21) a | 2.20 A | 2.02–2.89 (2.45) aA |
| Total protein [%] | 12.52–13.53 (12.99) a | 12.75–14.17 (13.54) a | 12.09–14.09 (13.31) a | 13.28 A | 10.43–18–14 (14.12) aA |
| Soluble protein [%] | 3.30–4.20 (3.41) a | 4.19–4.57 (4.32) b | 4.48–4.72 (4.63) b | 4.12 A | 6.88–7.96 (7.28) cB |
| Antioxidant Activity: | Drone Brood | Royal Jelly (n = 3) | |||
|---|---|---|---|---|---|
| 7-day-old (n = 3) | 11-day-old (n = 3) | 14-day-old (n = 3) | Mean (7–14-day-old) | ||
| DPPH [%] | 9.2–16.36 (12.95) b | 6.91–24.76 (16.82) c | 10.43–16.98 (13.60) bc | 14.45 B | 7.94–11.03 (10.52) aA |
| FRAP [µmol TE/100 g] | 0.80–1.16 (0.97) b | 0.79–1.27 (1.04) b | 0.86–1.63 (1.03) b | 1.01 B | 0.18–0.20 (0.19) aA |
| TPC [mg GAE/100 g] | 234.62–268.84 (267.57) c | 180.05–320.43 (259.79) c | 200.89–285.21 (234.12) b | 253.82 B | 181.54–191.96 (189.72) aA |
| TFC [mg/100 g] | 6.71–9.92 (8.94) a | 10.30–13.0 (11.42) b | 4.12–9.80 (7.46) a | 9.27 A | 10.7–11.9 (11.3) bB |
| Hormonal activity | |||||
| Testosterone [nmol/100 g] | 0.47–1.10 (0.79) a | 3.64–3.96 (3.80) b | 8.24–9.10 (8.67) c | 4.42 B | 0.64–0.72 (0.68) aA |
| Estradiol [nmol/100 g] | 653.70–680.26 (664.75) d | 332.37–370.45 (355.67) c | 217.90–274.16 248.78 b | 426.06 B | 94.12–116.03 (106.46) aA |
| Enzyme | pH Optimum | Drone Brood [U/100 g WW] | Royal Jelly [U/100 g WW] (n = 3) | |||
|---|---|---|---|---|---|---|
| 7-day-old (n = 3) | 11-day-old (n = 3) | 14-day-old (n = 3) | Mean (7–14-day-old) | |||
| α-GLU | 5.0 DB; 3.5 RJ | 47.0–47.8 (47.4) c | 82.2–84.1 (82.9) d | 19.5–22.0 (20.7) b | 50.3 B | 0.6–0.9 (0.7) aA |
| β-GLU | 4.0 DB; RJ | 2.2–3.9 (3.0) ab | 3.9–5.6 (4.7) b | 0.00–0.8 (1.0) a | 2.90 A | 6.9–7.7 (7.4) cB |
| α-GAL | 4.0 DB; RJ | 0.4–1.4 (0.9) ab | 0.8–2.3 (1.2) c | 0.3–1.7 (1.1) bc | 0.99 B | 0.5–0.7 (0.6) aA |
| β-GAL | 4.0 DB; RJ | 1.6–2.4 (2.0) b | 2.7–4.2 (3.3) d | 1.2–4.1 (2.9) cd | 2.73 B | 0.6–0.7 (0.6) aA |
| α-MAN | 5.0 DB; RJ | 21.0–22.8 (21.9) c | 33.0–34.4 (33.9) d | 2.0–4.6 (3.4) b | 19.71 B | 1.2–1.5 (1.3) aA |
| β-MAN | 5.0 DB; RJ | 0.6–1.0 (0.8) a | 1.0–2.7 (1.8) b | 0.1–1.3 (0.7) a | 0.99 A | 0.7–0.9 (0.8) aA |
| HEX | 5.0 DB; RJ | 59.0–68.3 (64.1) b | 156.8–157.7 (157.1) d | 80.8–88.0 (81.8) c | 101.0 B | 0.9–8.1 (4.5) aA |
| Alkaline phosphatase | 10.5 DB; RJ | 0.1–1.2 (0.5) a | 0.1–1.4 (0.7) a | 0.1–1.0 (0.5) a | 0.56 A | 0.8–1.5 (1.1) bB |
| Acid phosphatase | 5.0 DB; RJ | 1.6–3.4 (2.4) b | 3.7–5.5 (4.5) c | 1.0–3.7 (2.1) ab | 3.0 B | 1.5–1.6 (1.6) aA |
| α-amylase (U/g) | 5.0 DB; RJ | 14.0–17.60 (16.4) d | 13.1–14.5 (13.8) c | 5.2–11.9 (8.15) b | 12.78 B | 0.46–0.64 (0.56) aA |
Publisher’s Note: MDPI stays neutral with regard to jurisdictional claims in published maps and institutional affiliations. |
© 2021 by the authors. Licensee MDPI, Basel, Switzerland. This article is an open access article distributed under the terms and conditions of the Creative Commons Attribution (CC BY) license (https://creativecommons.org/licenses/by/4.0/).
Share and Cite
Sidor, E.; Miłek, M.; Zaguła, G.; Bocian, A.; Dżugan, M. Searching for Differences in Chemical Composition and Biological Activity of Crude Drone Brood and Royal Jelly Useful for Their Authentication. Foods 2021, 10, 2233. https://doi.org/10.3390/foods10092233
Sidor E, Miłek M, Zaguła G, Bocian A, Dżugan M. Searching for Differences in Chemical Composition and Biological Activity of Crude Drone Brood and Royal Jelly Useful for Their Authentication. Foods. 2021; 10(9):2233. https://doi.org/10.3390/foods10092233
Chicago/Turabian StyleSidor, Ewelina, Michał Miłek, Grzegorz Zaguła, Aleksandra Bocian, and Małgorzata Dżugan. 2021. "Searching for Differences in Chemical Composition and Biological Activity of Crude Drone Brood and Royal Jelly Useful for Their Authentication" Foods 10, no. 9: 2233. https://doi.org/10.3390/foods10092233