Proximate Chemical Composition, Fatty Acid Profile, and Lipid Qualitative Indices of Brown Bear Meat

 ,
, 
Abstract
:
1. Introduction
2. Materials and Methods
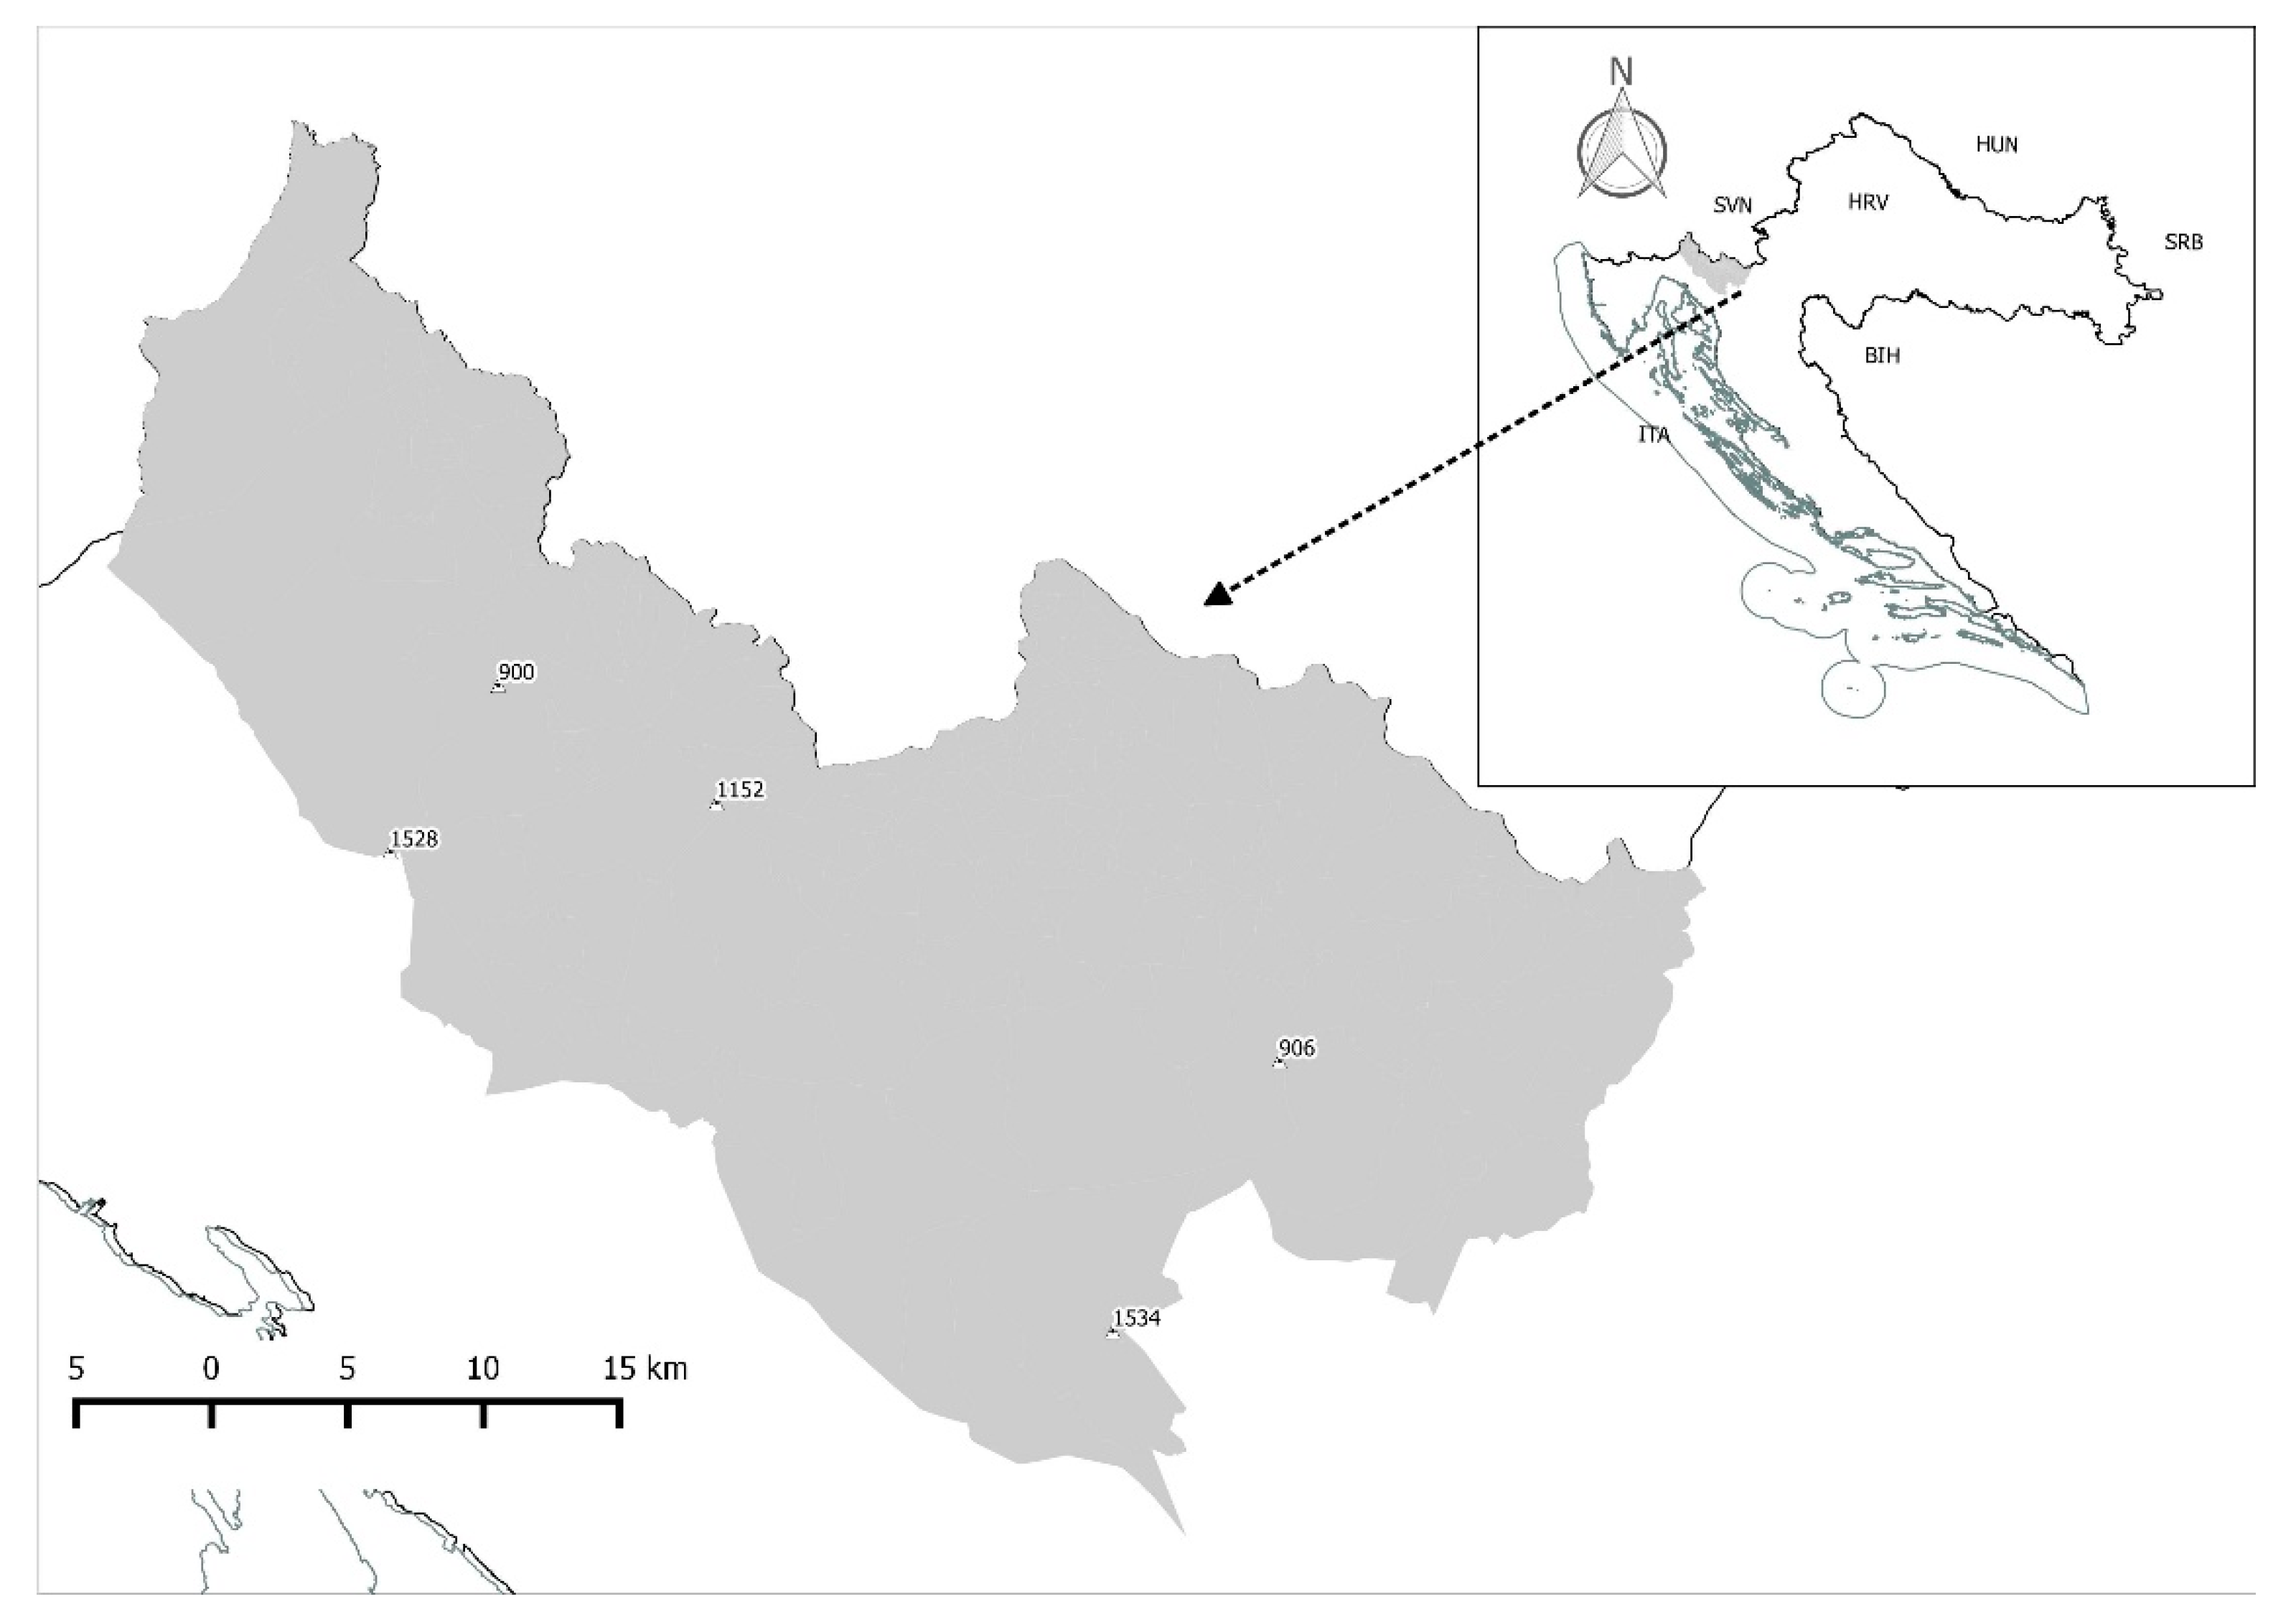
2.1. Study Area, Animals, and Sampling
2.2. Proximate Chemical Composition Analyses
2.3. Determination of the Fatty Acid Composition
2.4. Calculation of Lipid Quality Indices
2.5. Statistical Analysis
3. Results
3.1. Proximate Chemical Composition
3.2. Fatty Acid Composition
4. Discussions
5. Conclusions
Author Contributions
Funding
Acknowledgments
Conflicts of Interest
References
- Skobrák, E.B.; Bodnár, K.; Jónás, E.M.; Gundel, J.; Jávor, A. The comparison analysis of the main chemical composition parameters of wild boar meat and pork. J. Anim. Sci. Biotechnol. 2011, 44, 105–112. [Google Scholar]
- Strazdiņa, V.; Jemeļjanovs, A.; Šterna, V. Nutrition Value of Wild Animal Meat. J. Proc. Latv. Acad. Sci. Sect. B Nat. Exact Appl. Sci. 2013, 67, 373–377. [Google Scholar] [CrossRef] [Green Version]
- Tomasevic, I.; Novakovic, S.; Solowiej, B.; Zdolec, N.; Skunca, D.; Krocko, M.; Nedomova, S.; Kolaj, R.; Aleksiev, G.; Djekic, I. Consumers’ perceptions, attitudes and perceived quality of game meat in ten European countries. Meat Sci. 2018, 142, 5–13. [Google Scholar] [CrossRef] [PubMed]
- Russo, C.; Balloni, S.; Altomonte, I.; Martini, M.; Nuvoloni, R.; Cecchi, F.; Pedonese, F.; Salari, F.; Da Silva, A.M.S.; Torracca, B.; et al. Fatty acid and microbiological profile of the meat (longissimus dorsi muscle) of wild boar (Sus scropha scropha) hunted in Tuscany. Ital. J. Anim. Sci. 2017, 16, 1–8. [Google Scholar] [CrossRef] [Green Version]
- Gálik, B.; Šmehýl, P.; Gašparík, J.; Candrák, J.; Jahnátek, A.; Bíro, D.; Rolinec, M.; Juráček, M.; Šimko, M. The effect of age on the fatty acids composition in wild boar (Sus scrofa) hunted in the southwest region of Slovakia. Acta Vet. Brno 2018, 87, 85–90. [Google Scholar] [CrossRef]
- Rolinec, M.; Biro, D.; Galik, B.; Šimko, M.; Juračak, M.; Hanušovsky, O.; Imrich, I.; Bučko, O.; Lieskovcova, B. Fatty acid composition of meat of wild boar (Sus scrofa) hunted in the southwest region of Slovakia. J. Res. Pig Breed. 2018, 12, 10–14. [Google Scholar]
- Razmaite, V.; Šiukščius, A. Seasonal variation in fatty acid composition of wild boar in Lithuania. Ital. J. Anim. Sci. 2019, 18, 350–354. [Google Scholar] [CrossRef] [Green Version]
- Daszkiewicz, T.; Janiszewski, P.; Wajda, S. Quality characteristics of meat from wild red deer (Cervus elaphus L.) hinds and stags. J. Muscle Foods 2009, 20, 428–448. [Google Scholar] [CrossRef]
- Daszkiewicz, T.; Kubiak, D.; Winarski, R.; Koba-Kowalczyk, M. The effect of gender on the quality of roe deer (Capreolus capreolus L.) meat. Small Rumin. Res. 2012, 103, 169–175. [Google Scholar] [CrossRef]
- Bureš, D.; Bartoň, L.; Kotrba, R.; Hakl, J. Quality attributes and composition of meat from red deer (Cervus elaphus), fallow deer (Dama dama) and Aberdeen Angus and Holstein cattle (Bos taurus). J. Sci. Food Agric. 2014, 95, 2299–2306. [Google Scholar] [CrossRef]
- Bykowska, M.; Stanisz, M.; Ludwiczak, A.; Składanowska-Baryza, J.; Slósarz, P. The effect of muscle, time post-mortem and sex on the quality of meat from fallow deer ( Dama dama ) farmed in Poland. Small Rumin. Res. 2018, 160, 12–18. [Google Scholar] [CrossRef]
- Šnirc, M.; Kral, M.; Ošťádalová, M.; Golian, J.; Tremlová, B. Application of principal component analysis method for characterization chemical, technological, and textural parameters of farmed and pastured red deer. Int. J. Food Prop. 2017, 20, 754–761. [Google Scholar] [CrossRef] [Green Version]
- Cawthorn, D.-M.; Fitzhenry, L.B.; Kotrba, R.; Bureš, D.; Hoffman, L.C. Chemical Composition of Wild Fallow Deer (Dama Dama) Meat from South Africa: A Preliminary Evaluation. Foods 2020, 9, 598. [Google Scholar] [CrossRef] [PubMed]
- Ugarković, N.K.; Ugarković, D. Chemical and fatty acid composition of male mouflon (Ovis ammon musimon Pal.) meat. Eur. J. Wildl. Res. 2013, 59, 469–475. [Google Scholar] [CrossRef]
- Ugarković, N.K.; Konjačić, M.; Prpić, Z.; Tomljanović, K.; Ugarković, D. Effect of Sex and Age on Nutritional Content in Wild Axis Deer (Axis axis Erx.) Meat. Animals 2020, 10, 1560. [Google Scholar] [CrossRef] [PubMed]
- Needham, T.; Engles, R.E.; Bureš, D.; Kotrba, R.; van Resburg, B.J.; Hoffman, L.C. Carcass xields and physiochemical meat quality of semi-extensive and intensively farmed impala (Aepyceros melampus). Foods 2020, 9, 418. [Google Scholar] [CrossRef] [Green Version]
- Hoffman, L.C. The yield and carcass chemical composition of impala (Aepyceros melampus), a southern African antelope species. J. Sci. Food Agric. 2000, 80, 752–756. [Google Scholar] [CrossRef]
- Hoffman, L.C.; Kritzinger, B.; Ferreira, A. The effects of region and gender on the fatty acid, amino acid, mineral, myoglobin and collagen contents of impala (Aepyceros melampus) meat. Meat Sci. 2005, 69, 551–558. [Google Scholar] [CrossRef]
- Hoffman, L.C.; Kroucamp, M.; Manley, M. Meat quality characteristics of springbok (Antidorcas marsupialis). 2: Chemical composition of springbok meat as influenced by age, gender and production region. Meat Sci. 2007, 76, 762–767. [Google Scholar] [CrossRef]
- Proust, F.; Johnson-Down, L.; Berthiaume, L.; Greffard, K.; Julien, P.; Robinson, E.; Lucas, M.; Dewailly, É. Fatty acid composition of birds and game hunted by the Eastern James Bay Cree people of Québec. Int. J. Circumpolar Heal. 2016, 75, 30583. [Google Scholar] [CrossRef] [Green Version]
- Razmaite, V.; Pileckas, V.; Juškiene, V. Effect of muscle anatomical location on fatty acid composition of beaver (Castor fiber) females. Czech J. Food Sci. 2019, 37, 106–111. [Google Scholar] [CrossRef]
- McLellan, B.N.; Proctor, M.F.; Huber, D.; Michel, S. Ursus Arctos (Amended Version of 2017 Assessment). The IUCN Red List of Threatened Species 2017: e.T41688A121229971. 2017. Available online: https://www.iucnredlist.org/species/41688/121229971 (accessed on 15 November 2020).
- IUCN (International Union for Conservation of Nature). Available online: https://www.iucnredlist.org/species/41688/121229971 (accessed on 15 November 2020).
- Anonymous. Nature protection law. Official Gazette of Republic Croatia, 28 June 2013; 80/13, 15/18, 14/19, 127/19. [Google Scholar]
- Anonymous. Regulation on endangered species. Official Gazette of Republic Croatia, 4 December 2013; 144/13, 73/16. [Google Scholar]
- Anonymous. Hunting Law. Official Gazette of Republic Croatia, 9 November 2018; 98/18, 32/19, 32/20. [Google Scholar]
- Knapp, A. Bear Necessities. An Analysis of Brown Bear Management and Trade in Selected Range States and the European Union’s Role in the Trophy Trade; TRAFFIC Europe for the European Commission: Brussels, Belgium, 2007; ISBN 2–9600505–2–5. [Google Scholar]
- Mei, Y. Recipes from the Garden of Contentment: Yuan Mei’s Manual of Gastronomy, 1st ed.; Berkshire Publishing Group LLC: Great Barrington, MA, USA, 2018; p. 428. ISBN 9781614720430. [Google Scholar]
- The Atlantic. Available online: https://www.theatlantic.com/health/archive/2010/11/bear-a-meat-worth-trying/67024/ (accessed on 18 November 2020).
- DJI, DJI Developer. Available online: https://developer.dji.com/mobile-sdk/ (accessed on 19 October 2020).
- Šprem, N.; Babić, I.; Barišić, D.; Barišić, D. Concentration of 137Cs and 40K in meat of omnivore and herbivore game species in mountain forest ecosystems of Gorski Kotar, Croatia. J. Radioanal Nucl. Chem. 2013, 298, 513–517. [Google Scholar] [CrossRef]
- The European Parliament and the Council of the European Union. Directive 2010/63/EU of the European Parliament and of the Council of 22 September 2010 on the Protection of Animals Used for Scientific Purposes. Off. J. Eur. Union 2010, 276, 33–79. Available online: https://eur-lex.europa.eu/legal-content/EN/TXT/?uri=celex%3A32010L0063 (accessed on 24 December 2020).
- Skrbinšek, T.; Bragalanti, N.; Calderola, S.; Groff, C.; Huber, Đ.; Kaczensky, P.; Majić Skrbinšek, A.; Molinari-Jobin, A.; Molinari, P.; Rauer, G.; et al. Annual Population Status Report for Brown Bears in Northern Dinaric Mountains and Central-Eastern Alps. Action C.5: Population Surveillance. LIFE DINALP BEAR, LIFE13NAT/SI/000550. 2017. Available online: https://dinalpbear.eu/wp-content/uploads/C5_PopulationStatusReport2017.pdf (accessed on 21 October 2020).
- Jerina, K.; Polaina, E.; Huber, Đ.; Reljić, S.; Bartol, M.; Skrbinšek, T.; Jonozovič, M. Reconstruction of Brown Bear Population Dynamics in Slovenia and Croatia for the Period 1998–2018; C5 Report of LIFE DINALP BEAR Project; University of Ljubljana, University of Zagreb Faculty of Veterinary Medicine, Slovenia Forest Service: Ljubljana, Slovenia, 2018. [Google Scholar]
- Huber, Đ.; Bišćan, A.; Reljić, S.; Domazetović, Z.; Frković, A.; Majnarić, D.; Majić-Skrbinšek, A.; Sindičić, M.; Šprem, N.; Modrić, M.; et al. Brown Bear Management Plan for the Republic of Croatia for 2019. Ministry of Agriculture, Department of Forestry, Hunting and Timber Industry; Ministry of Environment and Energetic, Directorate for Nature Protection, Zagreb. 2019. Available online: https://dinalpbear.eu/wp-content/uploads/Plan-gospodarenja-medvjedom-2019.pdf (accessed on 21 October 2020).
- Bišćan, A.; Budor, I.; Domazetović, Z.; Gospočić, S.; Grubešić, M.; Huber, Đ.; Jeremić, J.; Sindičić, M.; Šprem, N.; Žuglić, T.; et al. Action plan for brown bear management in the Republic of Croatia. Ministry of Agriculture, Department of Forestry, Hunting and Timber Industry; Ministry of Environment and Energetic, Directorate for Nature Protection, Zagreb. 2020. Available online: https://poljoprivreda.gov.hr/UserDocsImages/dokumenti/sume/smedji_medvjed/Akcijski_plan_gospodarenja_smedjim_medvjedom2020.pdf (accessed on 21 October 2020).
- Guskov, V.Y. Skull-Based Method of Age Determination fot the Brown bear Ursus arctos Linnaeus, 1758. Achiev. Life Sci. 2014, 8, 137–141. [Google Scholar]
- International Organization for Standardization. Meat and Meat Products-Determination of Moisture Content-Reference Method, 2nd ed.; ISO: Geneva, Switzerland, 1997; Available online: https://www.iso.org/standard/6037.html (accessed on 21 October 2020).
- International Organization for Standardization. Meat and Meat Products-Determination of Total Fat Content, 1st ed.; ISO: Geneva, Switzerland, 1973; Available online: https://www.iso.org/standard/6038.html (accessed on 21 October 2020).
- International Organization for Standardization. Meat and Meat Products-Determination of Nitrogen Content-Reference Method, 2nd ed.; ISO: Geneva, Switzerland, 1978; Available online: https://www.iso.org/standard/5356.html (accessed on 21 October 2020).
- International Organization for Standardization. Meat and Meat Products-Determination of Total Ash, 2nd ed.; ISO: Geneva, Switzerland, 1998; Available online: https://www.iso.org/standard/24783.html (accessed on 21 October 2020).
- International Organization for Standardization. Animal and Vegetable Fats and Oils—Gas Chromatography of Fatty acid Methyl Esters—Part 2: Preparation of Methyl Esters of Fatty Acids, 2nd ed.; ISO: Geneva, Switzerland, 2017; Available online: https://www.iso.org/standard/72142.html (accessed on 21 October 2020).
- Ulbricht, T.L.V.; Southgate, D.A.T. Coronary heart disease: Seven dietary factors. Lancet 1991, 338, 985–992. [Google Scholar] [CrossRef]
- Santossilva, J.; Bessa, R. Effect of genotype, feeding system and slaughter weight on the quality of light lambs. Livest. Prod. Sci. 2002, 77, 187–194. [Google Scholar] [CrossRef]
- Du, C.; Sato, A.; Watanabe, S.; Wu, C.-Z.; Ikemoto, A.; Ando, K.; Kikugawa, K.; Fujii, Y.; Okuyama, H. Cholesterol Synthesis in Mice Is Suppressed but Lipofuscin Formation Is Not Affected by Long-Term Feeding of n-3 Fatty Acid-Enriched Oils Compared with Lard and n-6 Fatty Acid-Enriched Oils. Biol. Pharm. Bull. 2003, 26, 766–770. [Google Scholar] [CrossRef] [Green Version]
- SAS Institute Inc. SAS® 9.4 Statements: Reference; SAS Institute Inc.: Cary, NC, USA, 2013. [Google Scholar]
- Volpelli, L.; Valusso, R.; Morgante, M.; Pittia, P.; Piasentier, E. Meat quality in male fallow deer (Dama dama): Effects of age and supplementary feeding. Meat Sci. 2003, 65, 555–562. [Google Scholar] [CrossRef]
- Razmaite, V.; Šiukščius, A.; Šveistiene, R.; Bliznikas, S.; Švirmickas, G.J. Comparative evaluation of longissimus and semimembranosus muscle characteristics from free-living and farmed red deer (Cervus elaphus) in Lithuania. Zool. Ecol. 2017, 27, 176–183. [Google Scholar] [CrossRef]
- Švrčula, V.; Košinová, K.; Okrouhlá, M.; Chodová, D.; Hart, V. The effect of sex on meat quality of fallow deer (Dama dama) from the farm located in the Middle Bohemia. Ital. J. Anim. Sci. 2019, 18, 498–504. [Google Scholar] [CrossRef] [Green Version]
- Dannenberger, D.; Nuernberg, G.; Hagemann, E. The effects of gender, age and region on macro- and micronutrient contents and fatty acid profiles in the muscles of roe deer and wild boar in Mecklenburg-Western Pomerania (Germany). Meat Sci. 2013, 94, 39–46. [Google Scholar] [CrossRef] [PubMed]
- Tesařová, S.; Ježek, F.; Hulankova, R.; Plhal, R.; Drimaj, J.; Steinhauserová, I.; Borilova, G. The individual effect of different production systems, age and sex on the chemical composition of wild boar meat. Acta Veter-Brno 2018, 87, 395–402. [Google Scholar] [CrossRef]
- Ludwiczak, A.; Składanowska-Baryza, J.; Stanisz, M. Effect of Age and Sex on the Quality of Offal and Meat of the Wild Boar (Sus scrofa). Animals 2020, 10, 660. [Google Scholar] [CrossRef] [PubMed] [Green Version]
- Piaskowska, N.; Daszkiewicz, T.; Kubiak, D.; Janiszewski, P. The Effect of Gender on Meat (Longissimus LumborumMuscle) Quality Characteristics in the Fallow Deer (Dama DamaL.). Ital. J. Anim. Sci. 2015, 14, 389–393. [Google Scholar] [CrossRef]
- Lorenzo, J.M.; Maggiolino, A.; Gallego, L.; Pateiro, M.; Serrano, M.P.; Domínguez, R.; García, A.; Landete-Castillejos, T.; De Palo, P. Effect of age on nutritional properties of Iberian wild red deer meat. J. Sci. Food Agric. 2019, 99, 1561–1567. [Google Scholar] [CrossRef]
- Vranković, L.; Delaš, I.; Reljić, S.; Huber, D.; Maltar-Strmečki, N.; Klobučar, K.; Krivić, G.; Stojević, Z.; Aladrović, J. The lipid composition of subcutaneous adipose tissue of brown bears (Ursus arctos) in Croatia. Physiol. Biochem. Zool. 2017, 90, 399–406. [Google Scholar] [CrossRef]
- Astrup, A.; Magkos, F.; Bier, D.M.; Brenna, J.T.; de Oliveira Otto, M.C.; Hill, J.O.; King, J.C.; Mente, A.; Ordovas, J.M.; Volek, J.S.; et al. Saturated Fats and Health: A Reassessment and Proposal for Food-Based Recommendations: JACC State-of-the-Art Review. J. Am. Coll. Cardiol. 2020, 76, 844–857. [Google Scholar] [CrossRef]
- Tsiaganis, M.C.; Laskari, K.; Melissari, E. Fatty acid composition of Allium species lipids. J. Food Compos. Anal. 2006, 19, 620–627. [Google Scholar] [CrossRef]
- Christie, W.W. 13-Phenyltridec-9-enoic and 15-phenylpentadec-9-enoic acids inArum maculatum seed oil. Eur. J. Lipid Sci. Technol. 2003, 105, 779–780. [Google Scholar] [CrossRef]
- Paulson, D.R.; Saranto, J.R.; Forman, W.R. The fatty acid composition of edible oils and fats: A beginning glc experiment. J. Chem. Educ. 1974, 51, 406–408. [Google Scholar] [CrossRef]
- Smith, S.B.; Lunt, D.K.; Smith, D.R.; Walzem, R.L. Producing high-oleic acid beef and the impact of ground beef consumption on risk factors for cardiovascular disease: A review. Meat Sci. 2020, 163, 108076. [Google Scholar] [CrossRef] [PubMed]
- Fernández, M.; Ordóñez, J.A.; Cambero, I.; Santos, C.; Pin, C.; De La Hoz, L. Fatty acid compositions of selected varieties of Spanish dry ham related to their nutritional implications. Food Chem. 2007, 101, 107–112. [Google Scholar] [CrossRef]
- Kerr, B.J.; Kellner, T.A.; Shurson, G.C. Characteristics of lipids and their feeding value in swine diets. J. Anim. Sci. Biotechnol. 2015, 6, 30. [Google Scholar] [CrossRef] [PubMed] [Green Version]


| Parameter (%) | Sex | P-Value | Age | P-Value | ||
|---|---|---|---|---|---|---|
| Male (n = 9) | Female (n = 9) | Group I (n = 9) | Group II (n = 9) | |||
| Moisture | 71.40 ± 1.19 | 72.15 ± 1.28 | 0.676 | 74.00 ± 0.90 | 69.81 ± 0.83 | 0.006 |
| Protein | 20.00 ± 0.25 | 20.18 ± 0.27 | 0.653 | 20.37 ± 0.25 | 19.84 ± 0.23 | 0.550 |
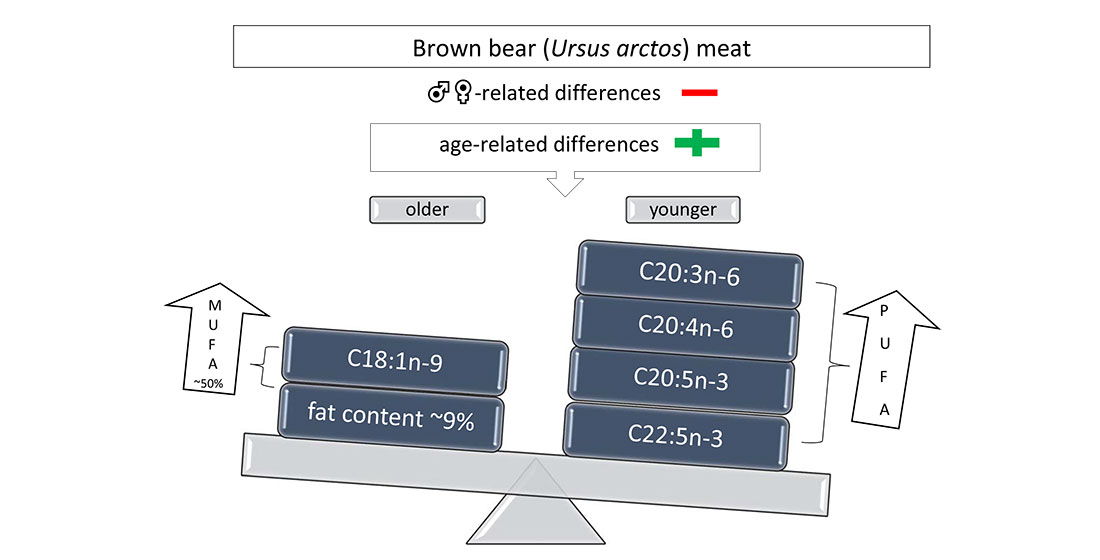
| Total fat | 7.26 ± 1.31 | 6.37 ± 1.41 | 0.626 | 4.32 ± 0.98 | 9.01 ± 0.91 | 0.045 |
| Ash | 1.17 ± 0.06 | 1.18 ± 0.07 | 0.903 | 1.20 ± 0.07 | 1.16 ± 0.06 | 0.659 |
| Fatty Acids (%) | Sex | P-Value | Age | P-Value | ||
|---|---|---|---|---|---|---|
| Male (n = 9) | Female (n = 9) | Group I (n = 9) | Group II (n = 9) | |||
| C12:0 | 0.02 ± 0.00 | 0.02 ± 0.00 | 0.634 | 0.02 ± 0.00 | 0.02 ± 0.00 | 0.332 |
| C14:0 | 1.22 ± 0.10 | 1.18 ± 0.09 | 0.822 | 1.23 ± 0.11 | 1.26 ± 0.10 | 0.819 |
| C15:0 | 0.26 ± 0.02 | 0.31 ± 0.04 | 0.287 | 0.29 ± 0.04 | 0.30 ± 0.04 | 0.812 |
| C16:0 | 23.10 ± 0.72 | 23.34 ± 0.56 | 0.797 | 23.11 ± 0.75 | 23.13 ± 0.71 | 0.980 |
| C17:0 | 0.48 ± 0.03 | 0.56 ± 0.05 | 0.199 | 0.52 ± 0.06 | 0.54 ± 0.05 | 0.809 |
| C18:0 | 8.11 ± 0.52 | 8.35 ± 0.44 | 0.735 | 7.96 ± 0.61 | 8.38 ± 0.50 | 0.625 |
| C20:0 | 0.26 ± 0.02 | 0.26 ± 0.03 | 0.829 | 0.29 ± 0.02 | 0.24 ± 0.02 | 0.139 |
| C22:0 | 0.06 ± 0.01 | 0.06 ± 0.01 | 0.889 | 0.08 ± 0.01 | 0.06 ± 0.01 | 0.347 |
| C14:1 | 0.19 ± 0.03 | 0.20 ± 0.02 | 0.736 | 0.22 ± 0.03 | 0.19 ± 0.02 | 0.529 |
| C16:1 | 4.19 ± 0.51 | 3.73 ± 0.23 | 0.433 | 4.36 ± 0.49 | 3.86 ± 0.46 | 0.478 |
| C18:1n-9 | 42.79 ± 1.13 | 41.19 ± 1.45 | 0.397 | 40.38 ± 1.23 | 44.22 ± 1.14 | 0.004 |
| C18:1n-7 | 2.92 ± 0.16 | 2.80 ± 0.20 | 0.656 | 2.81 ± 0.19 | 2.72 ± 0.18 | 0.724 |
| C20:1 | 1.13 ± 0.23 | 1.13 ± 0.13 | 0.989 | 1.07 ± 0.23 | 1.23 ± 0.22 | 0.640 |
| C22:1 | 0.13 ± 0.03 | 0.13 ± 0.02 | 0.913 | 0.14 ± 0.02 | 0.13 ± 0.02 | 0.613 |
| C18:2n-6 | 11.43 ± 1.12 | 11.80 ± 0.87 | 0.797 | 12.11 ± 1.24 | 10.80 ± 1.14 | 0.455 |
| C18:3n-6 | 0.06 ± 0.01 | 0.06 ± 0.01 | 0.938 | 0.06 ± 0.01 | 0.06 ± 0.02 | 0.919 |
| C18:3n-3 | 0.66 ± 0.08 | 1.20 ± 0.52 | 0.317 | 1.35 ± 0.47 | 0.72 ± 0.44 | 0.351 |
| C20:2n-6 | 0.21 ± 0.02 | 0.16 ± 0.02 | 0.078 | 0.17 ± 0.02 | 0.20 ± 0.02 | 0.420 |
| C20:3n-6 | 0.29 ± 0.04 | 0.28 ± 0.03 | 0.882 | 0.32 ± 0.03 | 0.21 ± 0.03 | 0.015 |
| C20:3n-3 | 0.03 ± 0.01 | 0.04 ± 0.01 | 0.640 | 0.04 ± 0.01 | 0.04 ± 0.01 | 0.928 |
| C20:4n-6 | 1.85 ± 0.28 | 2.20 ± 0.47 | 0.536 | 2.39 ± 0.22 | 1.24 ± 0.20 | 0.003 |
| C20:5n-3 | 0.06 ± 0.01 | 0.11 ± 0.03 | 0.107 | 0.12 ± 0.03 | 0.05 ± 0.02 | 0.050 |
| C22:5n-3 | 0.46 ± 0.07 | 0.74 ± 0.17 | 0.131 | 0.79 ± 0.13 | 0.34 ± 0.12 | 0.027 |
| C22:6n-3 | 0.10 ± 0.01 | 0.12 ± 0.02 | 0.465 | 0.15 ± 0.02 | 0.08 ± 0.01 | 0.025 |
| Sums of Fatty Acids (%) | Sex | P-Value | Age | P-Value | ||
|---|---|---|---|---|---|---|
| Male (n = 9) | Female (n = 9) | Group I (n = 9) | Group II (n = 9) | |||
| SFA | 33.51 ± 0.90 | 34.09 ± 0.72 | 0.619 | 33.50 ± 1.02 | 33.94 ± 0.95 | 0.758 |
| MUFA | 51.35 ± 0.84 | 49.19 ± 1.39 | 0.204 | 48.99 ± 1.09 | 52.34 ± 1.01 | 0.046 |
| PUFA | 15.14 ± 1.30 | 16.72 ± 1.23 | 0.389 | 17.50 ± 1.24 | 13.72 ± 1.14 | 0.050 |
| PUFA n-6 | 13.84 ± 1.21 | 14.50 ± 1.07 | 0.688 | 15.05 ± 1.18 | 12.51 ± 1.03 | 0.043 |
| PUFA n-3 | 1.30 ± 0.10 | 2.21 ± 0.60 | 0.158 | 2.45 ± 0.53 | 1.21 ± 0.50 | 0.116 |
| PUFA/SFA | 0.46 ± 0.05 | 0.49 ± 0.04 | 0.612 | 0.52 ± 0.05 | 0.41 ± 0.04 | 0.031 |
| n-6/n-3 | 10.75 ± 0.71 | 8.69 ± 1.23 | 0.170 | 8.59 ± 1.27 | 10.39 ± 1.18 | 0.320 |
| Lipid Indices | Sex | P-Value | Age | P-Value | ||
|---|---|---|---|---|---|---|
| Male (n = 9) | Female (n = 9) | Group I (n = 9) | Group II (n = 9) | |||
| AI | 0.42 ± 0.02 | 0.43 ± 0.01 | 0.849 | 0.42 ± 0.02 | 0.43 ± 0.02 | 0.825 |
| TI | 0.89 ± 0.03 | 0.86 ± 0.03 | 0.497 | 0.82 ± 0.04 | 0.91 ± 0.04 | 0.111 |
| h/H | 2.38 ± 0.13 | 2.35 ± 0.08 | 0.811 | 2.36 ± 0.13 | 2.38 ± 0.12 | 0.931 |
| PI | 26.27 ± 2.17 | 31.23 ± 3.36 | 0.236 | 33.26 ± 1.98 | 22.24 ± 1.83 | 0.002 |
Publisher’s Note: MDPI stays neutral with regard to jurisdictional claims in published maps and institutional affiliations. |
© 2020 by the authors. Licensee MDPI, Basel, Switzerland. This article is an open access article distributed under the terms and conditions of the Creative Commons Attribution (CC BY) license (http://creativecommons.org/licenses/by/4.0/).
Share and Cite
Kelava Ugarković, N.; Konjačić, M.; Malnar, J.; Tomljanović, K.; Šprem, N.; Ugarković, D. Proximate Chemical Composition, Fatty Acid Profile, and Lipid Qualitative Indices of Brown Bear Meat. Foods 2021, 10, 36. https://doi.org/10.3390/foods10010036
Kelava Ugarković N, Konjačić M, Malnar J, Tomljanović K, Šprem N, Ugarković D. Proximate Chemical Composition, Fatty Acid Profile, and Lipid Qualitative Indices of Brown Bear Meat. Foods. 2021; 10(1):36. https://doi.org/10.3390/foods10010036
Chicago/Turabian StyleKelava Ugarković, Nikolina, Miljenko Konjačić, Josip Malnar, Kristijan Tomljanović, Nikica Šprem, and Damir Ugarković. 2021. "Proximate Chemical Composition, Fatty Acid Profile, and Lipid Qualitative Indices of Brown Bear Meat" Foods 10, no. 1: 36. https://doi.org/10.3390/foods10010036