
Increasing Fuel Loads, Fire Hazard, and Carbon Emissions from Fires in Central Siberia
by
 , and
, and
Elena A. Kukavskaya
1,* ,
,
Evgeny G. Shvetsov
1,
Ludmila V. Buryak
1,2,3,
Pavel D. Tretyakov
1 and
Pavel Ya. Groisman
4 1
V.N. Sukachev Institute of Forest of the Siberian Branch of the Russian Academy of Sciences—Separate Subdivision of the Federal Research Center “Krasnoyarsk Science Center SB RAS”, Akademgorodok 50/28, 660036 Krasnoyarsk, Russia
2
The Branch of FBU VNIILM “Centre of Forest Pyrology”, Krupskaya 42, 660062 Krasnoyarsk, Russia
3
Institute of Forest Technologies, Reshetnev Siberian State University of Science and Technology, Krasnoyarsky Rabochiy Prospect 31, 660037 Krasnoyarsk, Russia
4
North Carolina State University at NOAA National Center for Environmental Information, Asheville, NC 28801, USA
*
Author to whom correspondence should be addressed.
Fire 2023, 6(2), 63; https://doi.org/10.3390/fire6020063
Submission received: 29 December 2022
/
Revised: 5 February 2023
/
Accepted: 6 February 2023
/
Published: 9 February 2023
Abstract
:The vast Angara region, with an area of 13.8 million ha, is located in the southern taiga of central Siberia, Russia. This is one of the most disturbed regions by both fire and logging in northern Asia. We have developed surface and ground fuel-load maps by integrating satellite and ground-based data with respect to the forest-growing conditions and the disturbance of the territory by anthropogenic and natural factors (fires and logging). We found that from 2001 to 2020, fuel loads increased by 8% in the study region, mainly due to a large amount of down woody debris at clearcuts and burned sites. The expansion of the disturbed areas in the Angara region resulted in an increase in natural fire hazards in spring and summer. Annual carbon emissions from fires varied from 0.06 to 6.18 Mt, with summer emissions accounting for more than 95% in extreme fire years and 31–68% in the years of low fire activity. While the trend in the increase in annual carbon emissions from fires is not statistically significant due to its high interannual variability and a large disturbance of the study area, there are significantly increasing trends in mean carbon emissions from fires per unit area (p < 0.005) and decadal means (p < 0.1). In addition, we found significant trends in the increase in emissions released by severe fires (p < 0.005) and by fires in wetter, dark, coniferous (spruce, p < 0.005 and Siberian pine, p < 0.025) forests. This indicates deeper burning and loss of legacy carbon that impacts on the carbon cycle resulting in climate feedback.
1. Introduction
Wildfire is the most important disturbance factor in Russia controlling forest species composition and age structure, as well as influencing biogeochemical cycles [1,2]. While in many ecosystems fire is a natural, essential, and ecologically significant force shaping landscape diversity [3], recent evidence suggests higher rates of climate warming in Siberia compared to the other regions [4] resulting in prolonged fire season duration, and increased fire severity, frequency, and burned area [5,6,7,8]. Changes in fire regimes have already lead to a shift of vegetation and forest loss in some Siberian regions [9,10,11], with shorter fire return intervals predicted by different future climatology scenarios resulting in drastic post-fire recruitment failure over large forest areas [12].
Along with fires, logging represents an important disturbance factor in Siberian forests [13]. Russia accounts for about 15% of the world’s total growing stock [14], with almost 65% of its forested area located in Siberia [15]. From 159 to 239 million m3 of wood is logged annually in Russia, with 41 to 46% harvested in Siberia. Irkutsk oblast and Krasnoyarsk krai are the national leaders of timber production, accounting for 14 and 12% of total wood logged in Russia, respectively [16]. In addition, according to official statistical data, the volume of wood illegally logged in Krasnoyarsk krai varies from 0.1 to 0.7% of the officially harvested volume [17]. Different experts estimate the volume of illegally logged wood in Krasnoyarsk krai at the beginning of 2000 to be from 0.5 to 15% of the officially logged volume [18,19], with a significant decrease (by at least 3 times) by 2005 [19]. Clearcutting is a dominant harvest practice in Krasnoyarsk krai, while illegal logging often is selective [20].
About 60% of the wood harvested in Krasnoyarsk krai is from the Angara region [21], which is famous for its high productivity Scots-pine forests with high-quality wood [22]. The Angara region was already identified as a deforestation “hot spot” at the beginning of the 21st century [13]; thereafter, the region experienced a number of more severe disturbances. Analyses of satellite data show an expansion of disturbed areas northward to the previously undisturbed territories due to depletion of forest resources in the southern regions that had already been subjected to anthropogenic pressure and deforestation since the 1970s [23]. Various scenarios show that current harvest levels could not be sustained over a longer period of time, with growing stock projected to decline rapidly in the near future [2].
Logged areas in the Angara region typically contain high loads of down woody material left onsite [20]. This becomes readily ignitable more easily than fuels under forest canopies [24]. Fires often begin on logged sites [23,25] and result in higher amounts of fuel consumed and carbon emissions [20]. While detailed analyses have been performed of the disturbance of the Angara region by both fires and logging [23,24], there is no information on surface and ground fuel loads over the region and its transformation due to anthropogenic and natural disturbances. Meanwhile, fuel loads and characteristics significantly affect fire risks and behavior in the boreal forests [26,27]. Knowledge of vegetation types and fuel loads allows for evaluation of a potential fire’s size, rate, and severity, as well as aids in short- and long-term fire planning and resource allocation [28]. Fire behavior simulation and consumption models (e.g., Consume, FOFEM, and CanFIRE) rely on data from the pre-fire fuels. Wildland fuels can be mapped using various approaches and datasets, such as LANDSAT images [29], ASTER images [30], LIDAR [31], topography data and statistical modeling [32], etc. However, generating regional maps with relatively high accuracy remains an extremely difficult task [33]. The existing global fuel data set [34] cannot be used for local and regional studies but rather for country and continental scale research and fire-related applications. While some attempts to map fuel and carbon loads with the use of forest inventory datasets have been made for several parts of the Russian territory [35,36,37,38], these maps are not freely available and do not include all individual fuels that contribute to burning to varying degrees. Detailed fuel-loading maps for the extensive area of Siberia are still absent.
The main goal of our research was to develop maps of the surface and ground fuel loads for the Angara region of central Siberia using ground-based and remote sensing information and, thereafter, to analyze the dynamics of fuel loads, fire hazard, and carbon emissions from fires from 2001 to 2020. We expect increases of these characteristics during the study period due to increasing climatic and anthropogenic pressure in the Angara region.
2. Materials and Methods
2.1. Study Region
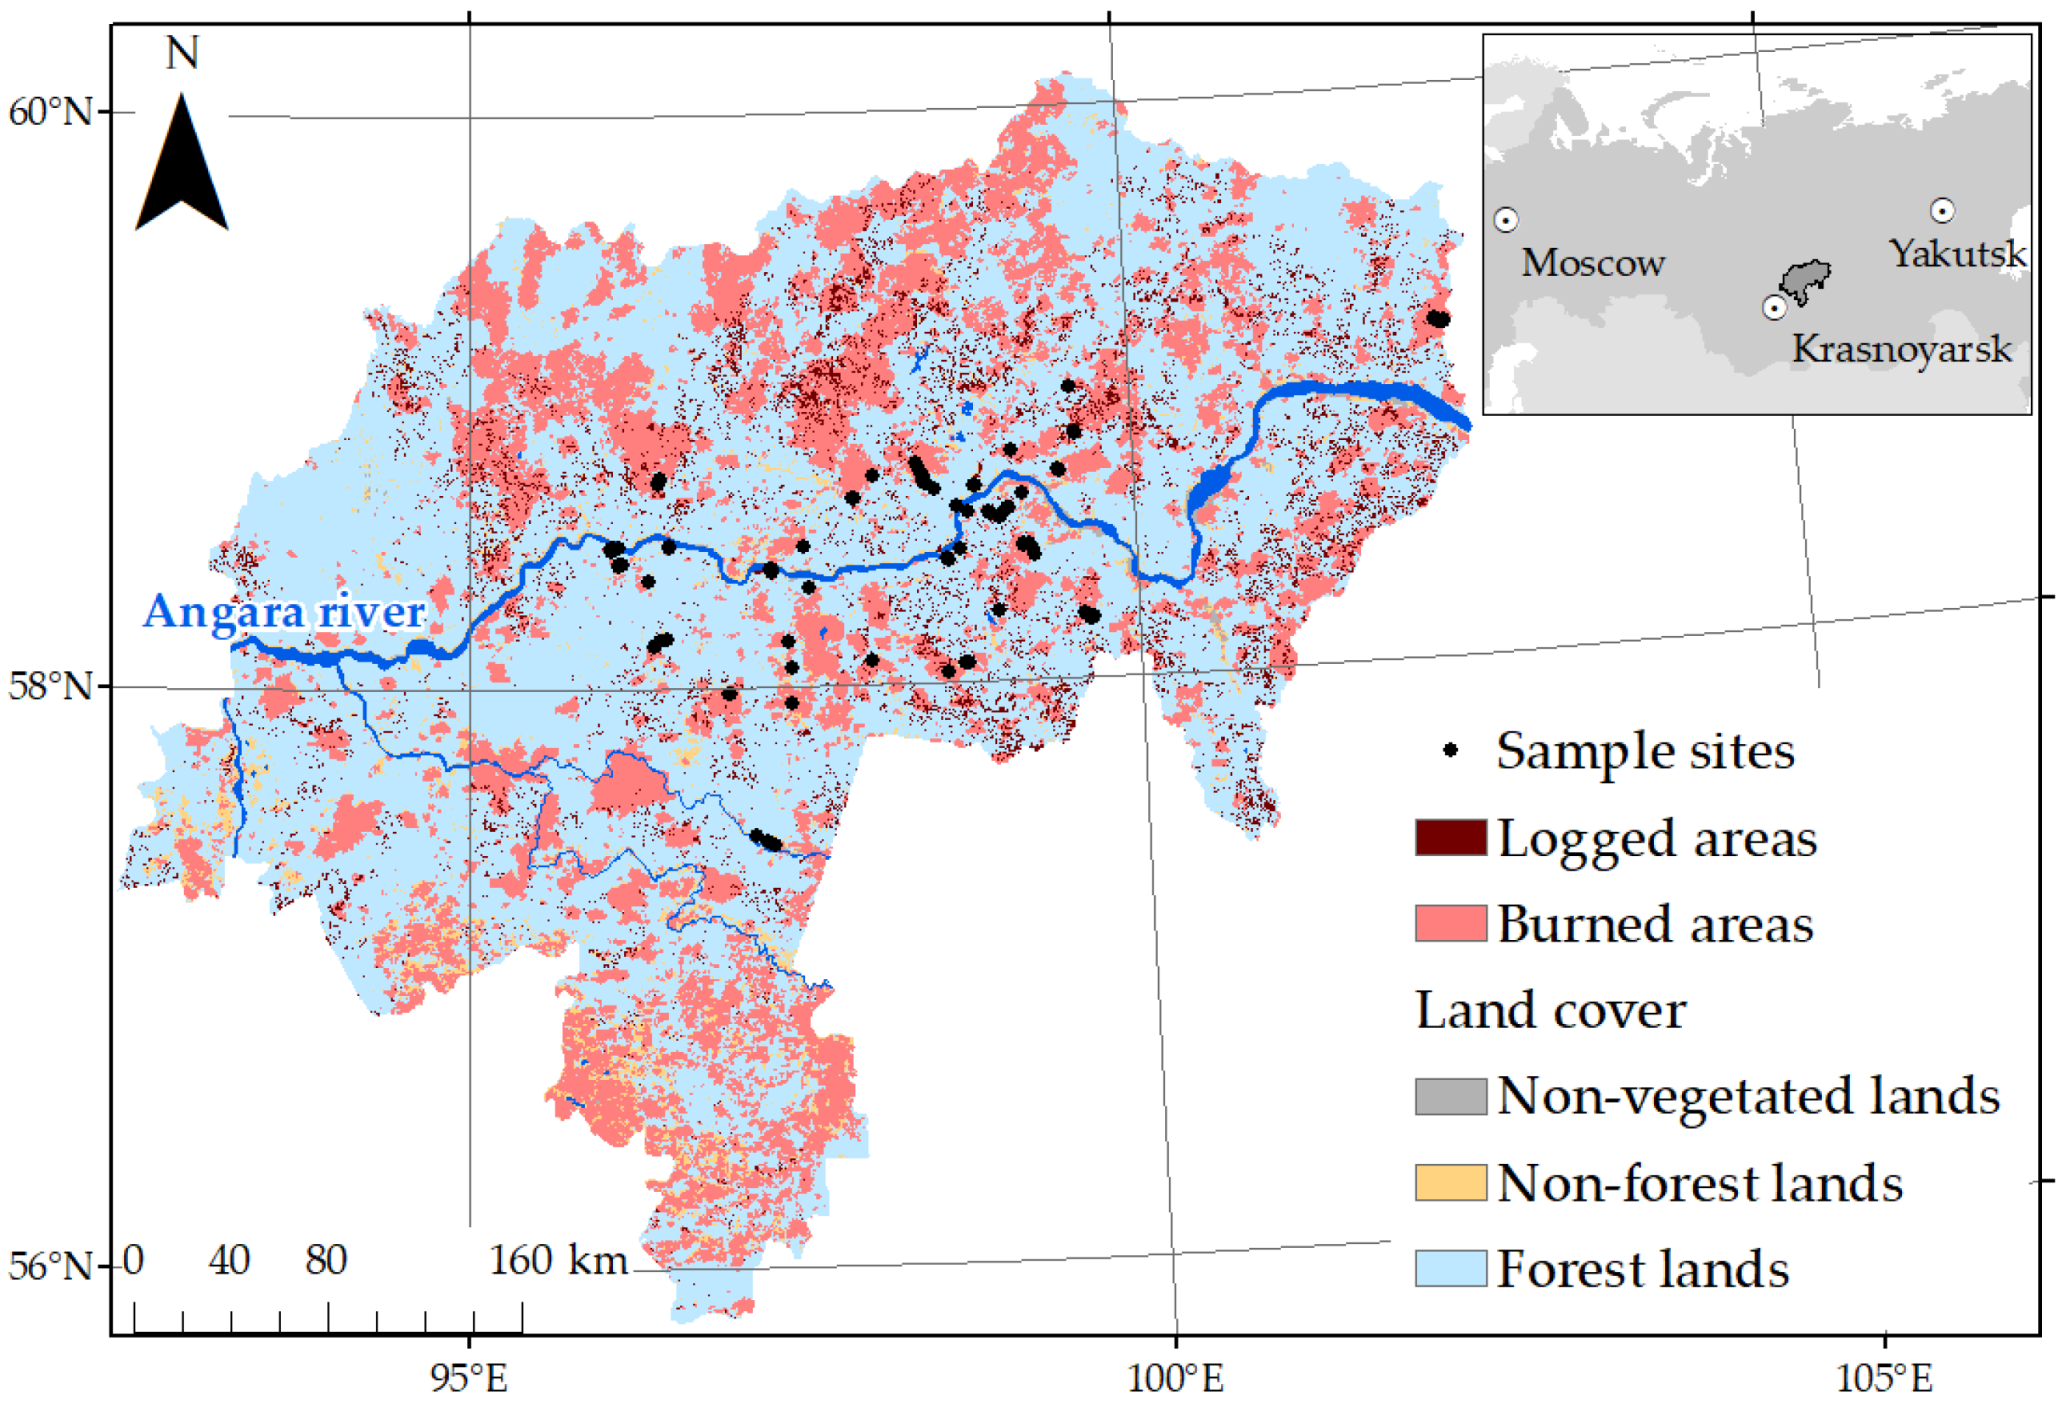
The Angara region is located in the southern taiga zone of central Siberia. The borders of the region correspond to the official forest zoning [39] within administrative boundaries of Krasnoyarsk krai, Russia. The study region occupies over 13.8 million ha between 56°–60° N and 92°–102° E (Figure 1).
The climate of the Angara region is continental, with a mean annual temperature for the period of 1991 to 2020 of −0.95 °C and mean annual precipitation of −359.8 mm (www.climexp.knmi.nl; accessed on 1 November 2022). Snow depth totals vary in a range from 30 to 80 cm. The average length of the growing season is 140 days, and the average summer frost-free period is 103 days. The relief of the study area is hilly upland with a mean altitude above sea level varying between 250 and 350 m [40]. The dominant tree species are Scots pine (Pinus sylvestris L.; 34% of the study area), larch (Larix sibirica Ledeb; 22%), spruce (Picea obovata Ledeb; 14%), and birch (Betula spp.; 14%) [41]. Mature and over-mature stands prevail in the Angara region, accounting for more than 70% among the coniferous species and about 60% among the deciduous species [2].
Because of its high anthropogenic and climatic pressure, the Angara region is severely disturbed by both logging and fires. From 2001 to 2020, about 3.4 million ha were burned and 0.6 million ha were logged in the study region (Figure 1 and Figure S1 in Supplementary Materials).
2.2. Surface and Ground Fuel-Load Sampling
To evaluate in situ surface and ground fuel loads, we carried out extensive fieldwork in the Angara region from 2002 to 2015. Surface fuels included herbs, small shrubs, and down woody debris, while ground fuels consisted of litter, moss, lichen, and duff [42]. Ground-based sampling was conducted on 168 sites to cover the range of forest and disturbance (fire and logging) conditions (Figure 1). We sampled at least three sites per forest type. At each 2–4 ha sampling site, we measured stand characteristics (species composition, diameter, and height), described living ground vegetation, and evaluated fuel loads. To quantify living surface vegetation (small shrubs and herbs) and ground fuel (litter, mosses, lichens, and duff) loads, we sampled ten to twenty-five 33 × 33 cm squares at each site [43]. For each square, small shrubs and herbs, litter, mosses, lichens, and duff fuels were collected separately and then taken to the laboratory to determine their oven-dry weights. We sampled dead surface fuels (dead and down woody debris above the litter layer) using the line intersect method developed by Van Wagner [44] as adapted by McRae et al. [45]. Twenty to forty 5-m sample lines were laid uniformly across each site. Our sampling procedure provided sufficient accuracy for the data obtained. Standard errors relative to the total fuel-load means varied 5 to 9% in the undisturbed forests and 6 to 15% in the logged and burned forests. Other studies have also reported an increase in error estimates post-fire due to patchy burning patterns [46]. While total fuel loads in some forest types could be similar, the difference between separate fuel categories is significant. For example, total fuel loads in larch forests that grow on slopes more than 10° on iron-illuvial podzols and sod-carbonated soils are 54.3 t/ha and 52.7 t/ha, respectively (Table S1 in Supplementary Materials). However, forests grown on iron-illuvial soils are characterized by significantly higher loads of mosses and duff, while forests on sod-carbonated soils have higher loads of down woody debris due to their higher productivity. The distribution of various fuel types in the total loads would drastically impact fire behavior, fuel consumption, and post-fire effects [27,43]. Overall, our study sites covered more than 40 forest types in the Angara region and various types of disturbances such as clearcut logging and fires with respect to fire severity (low vs. high) (Figure 2).
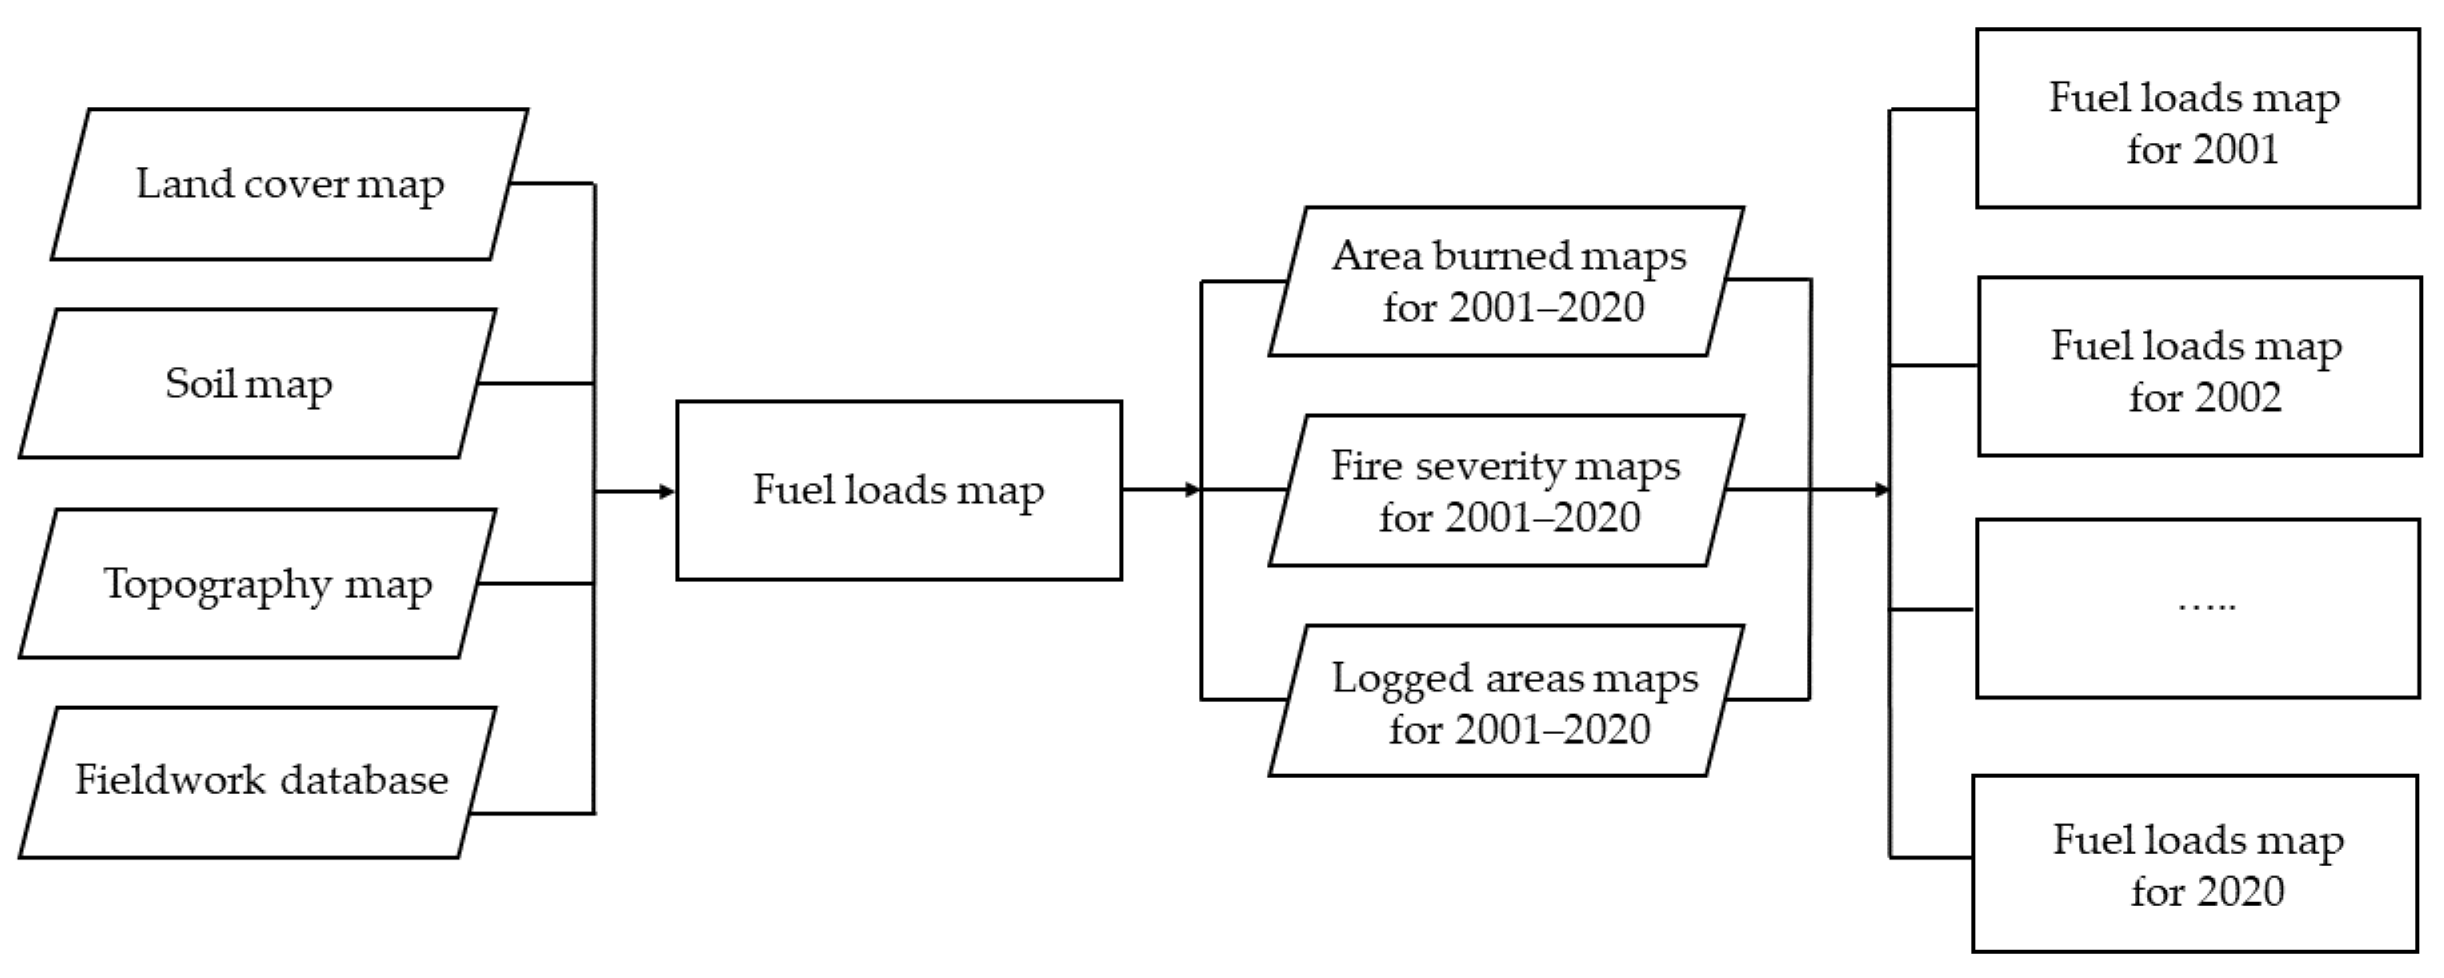
2.3. Generation of the Fuel-Load Maps
To develop fuel-loading maps, we first combined available data on topography from the ASTER Global Digital Elevation Model [40], land-cover type and dominant tree species from a forest cover map of Russia [41], and soil types from a Russian map of soil characteristics [47] (Figure 3). We defined two classes for slopes (more than 10° and less than 10°) and converted all land-cover types and soil types found in the study region into GIS layers using the nearest-neighbor resampling method. As a result, we ended up with more than 55 million 50 × 50 m grid cells in the whole Angara region, each of which was characterized by a certain land-cover type or dominant tree species (e.g., pine, larch, spruce, birch, or grasslands), soil type (e.g., iron-illuvial and humus-illuvial podzols, sod-carbonated soils, or iron sod-taiga soils), and slope (more or less than 10°). Then, based on our in situ knowledge of the region, we affiliated obtained conditions of dominant tree species, soil, and orography with the various forest types (e.g., Figure 2) and assigned our fieldwork data on ground and surface fuels loads to conditions at each site, i.e., to each output grid cell (Table S1 in Supplementary Materials). We assumed that all undisturbed forests are mature or over-mature. These stands occupy over 70% of the region [2]. The change in stand age is mainly associated with disturbances (fires and logging) in the region that are taken into account in post-disturbance fuel-load dynamics (Figure S2 in Supplementary Materials).
To account for the dynamic of fuel loads, we used fire and logging products developed annually from MODIS and Landsat data [23]. For logged area (clearcut) mapping, we used moderate-resolution Landsat imagery and manually delineated cut blocks using GIS software. Composite Landsat images were created using red, near-infrared, and short-wave infrared bands. The acquisition year of the Landsat image where a logged site was detected for the first time was considered as the year when the site was logged. To map fires, we used MODIS active fire and geolocation products [48]. We converted MODIS data to a GIS shapefile format where each active fire pixel was represented as a polygon. The active fire hotspots for each year were then clustered to derive polygons corresponding to larger fire events using several temporal and spatial thresholds. This procedure was described in more detail by Shvetsov et al. [23].
The selection of severely burned sites followed by high tree mortality was performed based on the Global Forest Change product [49]. Following the approach of Krylov et al. [50], we classified fire pixels as severe if they were located within 4 km of recorded fire pixels and occurred within 3 years after MODIS-detected fire events.
Burned areas that experienced multiple fire events during the study period were also separated into a special class. Such classification was performed to account for differences in fuel loads between sites that burned once and those that burned several times. However, since 84% of the burned sites that experienced multiple fires were burned only twice during the study period [23], we considered only two fires. These two fires were selected based on the delta normalized burn ratio (dNBR) obtained from the MODIS surface reflectance product (MOD09A1) with a spatial resolution of 500 m [51].
To calculate the normalized burn ratio (NBR), the reflectances from MODIS band 2 (0.841–0.876 µm) and band 7 (2.105–2.155 µm) were used as follows:
where R2 and R7 represent reflectances in MODIS band 2 and band 7, respectively.
NBR = (R2 − R7)/(R2 + R7)
The index of the dNBR was calculated as the difference between pre- and post-fire normalized burn ratio (NBR) values:
where NBRpre-fire represents NBR measured during the year preceding the fire and NBRpost-fire represents NBR measured during the year following the fire. Thus, we considered the fires having the highest dNBR index for the sites that burned only once and two fires with the highest dNBR values for the sites that burned multiple times.
dNBR = NBRpre-fire − NBRpost-fire
For every year from 2001 to 2020, we combined the fuel-load maps developed using data on forest cover, soil, and topography with our logging and fire products (Figure 3) and changed fuel loads in each grid cell depending on the disturbance type (logging vs. fire) and severity (high-severity fire vs. low-severity fire) using fieldwork data on post-disturbance loads (Figure S2 in Supplementary Materials). Then, to account for the change in fuel loads after disturbances, we used fuel recovery curves developed for various forest and disturbance types based on our fieldwork data (Figure S2 in Supplementary Materials).
2.4. Generation of the Fire-Hazard Maps
To develop natural fire-hazard maps, we used the Melekhov classification [52], which was adapted by the Russian Federal Forestry Agency (Table S2 in Supplementary Materials [53]), and materials from our own research [54]. The classification includes five classes of fire hazard, with the 1st class accounting for a very high fire hazard, 2nd for high, 3rd for moderate, 4th for low, and the 5th class accounting for the absence of a fire hazard. Each of the fire hazard classes is associated with different forest types (Table S2 in Supplementary Materials). We defined fire-hazard classes in the Angara region using the maps developed for each of the 50 × 50 m grid cells which contain information on the dominant land cover types and tree species [41], slope [40], soils [47], and disturbances (logging, high-severity fire, or low-severity fire) by associating these conditions with the dominant ground vegetation (i.e., forest type) based on our in situ knowledge of the study area (Table S3 in Supplementary Materials). We defined fire hazards for spring and summer separately to cover the vegetation change over the growing season. For example, Scots pine forests grown on iron-illuvial podzols are characterized by the dominance of feather moss with some amount of small shrubs (e.g., Vaccinium vitis-idaea, Vaccinium myrtillus) in the ground cover leading to a moderate fire hazard (class 3) during the entire fire season. At the same time, Scots pine forests on sod-carbonated soils are associated with a dominance of grasses in the ground cover, which results in a very high (class 1) fire hazard in spring due to the prevalence of dry-cured grasses in the ground cover, and in a low (class 4) fire hazard in summer due to the propagation of green grasses (Table S3 in Supplementary Materials). The fire hazard at sites located on slopes of more than 10° was increased by 1 class (e.g., from 4th to 3rd class) [53]. We calculated the average annual fire hazard class for the entire Angara region as a mean of all 50 × 50 m grid cells for each of the years from 2001 to 2020, taking into account the change in vegetation due to disturbances (logging and fires).
2.5. Evaluation of Carbon Emissions from Fires
Carbon emissions from fires were estimated based on fuel consumption data calculated as the difference between ground fuel-load data in the undisturbed forests (Table S1 in Supplementary Materials) and in the burned forests (Figure S2 in Supplementary Materials) depending on forest type with respect to fire severity. Carbon content in combusted material was assumed to be half of the biomass [55]. Our fuel consumption and carbon emissions estimates (Figure S2 in Supplementary Materials) are in accordance with data obtained in the course of carrying out experimental fires [42,45] and examining wildfires [20] in the study region.
3. Results
3.1. Surface and Ground Fuel-Load Maps
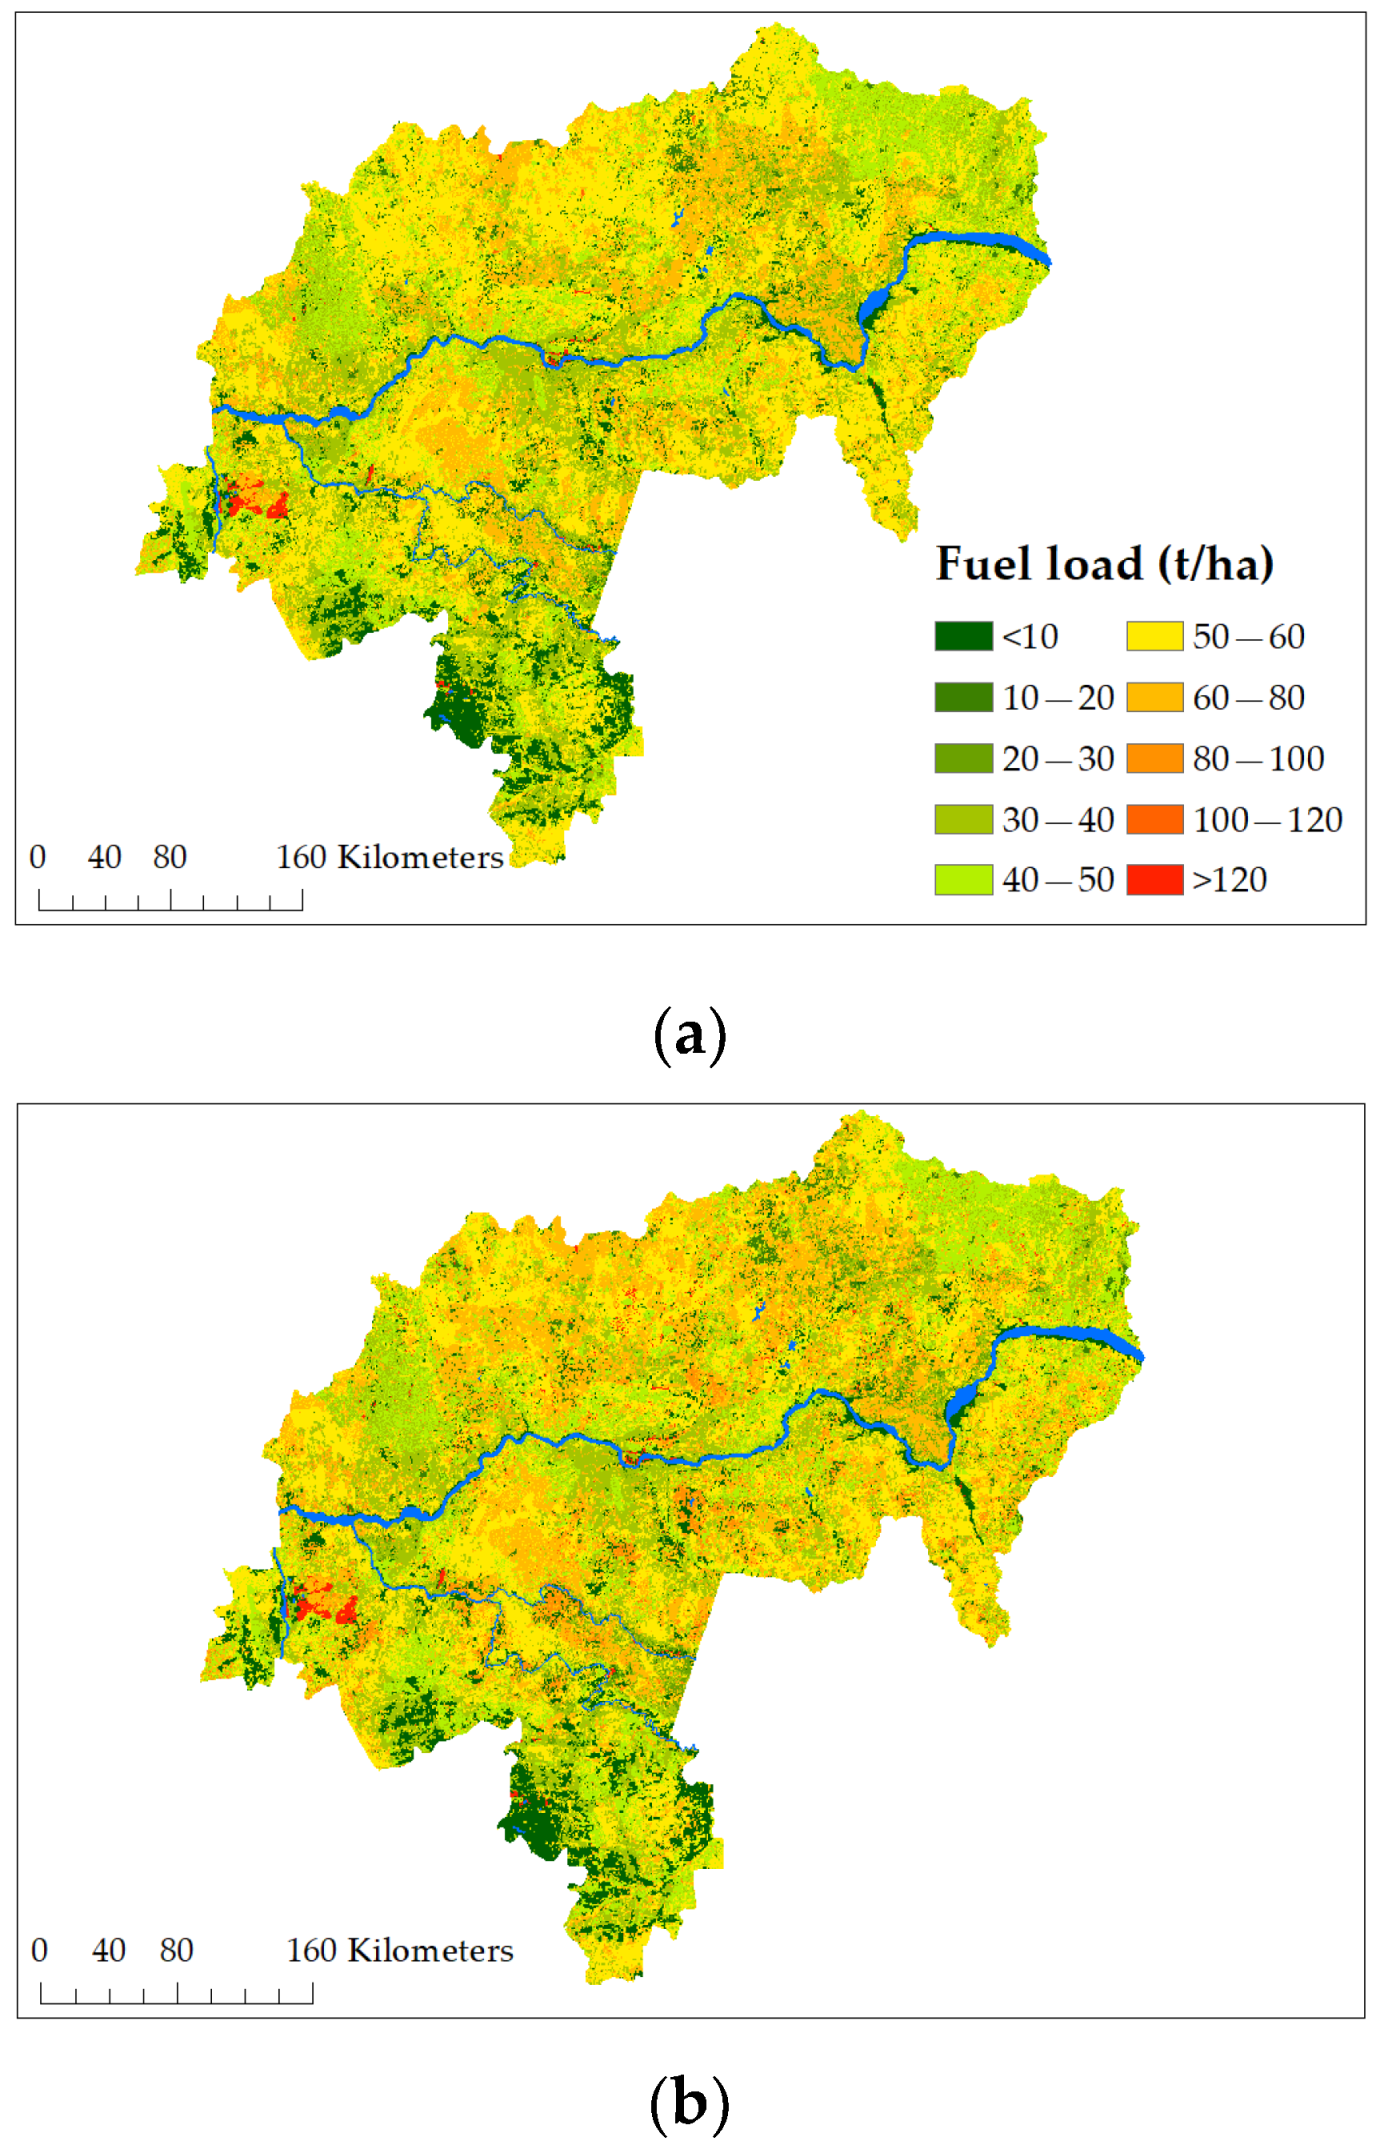
Based on the maps that we developed (Figure 4), the total surface and ground fuel loads in the Angara region accounted for 713 Mt, varying among various forest types from 26 t/ha in the dry lichen Scots pine forests (Figure 2a) to 80–200 t/ha in spruce stands grown in wet soil (Figure 2d and Table S1 in Supplementary Materials). High fuel loads (up to 135 t/ha in the light-coniferous forests) were also attributed to logged forests, which are characterized by a high amount of down woody material left onsite (Figure 2h). In general, in 2001 living vegetation (grasses, small shrubs, moss, and lichen) accounted for 22%, down woody debris for 25%, and duff for 53% of the total surface and ground fuel loads in the region. From 2001 to 2020, fuel loads increased by 8% (up to 766 Mt), mainly due to a significant increase in clearcuts and burned sites in the Angara region. While logged sites occupied 4.8% of the region, they accounted for 6.3% of the total fuel loads in 2020. Over the last two decades, the annual surface and ground fuel-load increase rate was 2.8 ± 2.6 Mt.
3.2. Fire hazards in the Angara Region
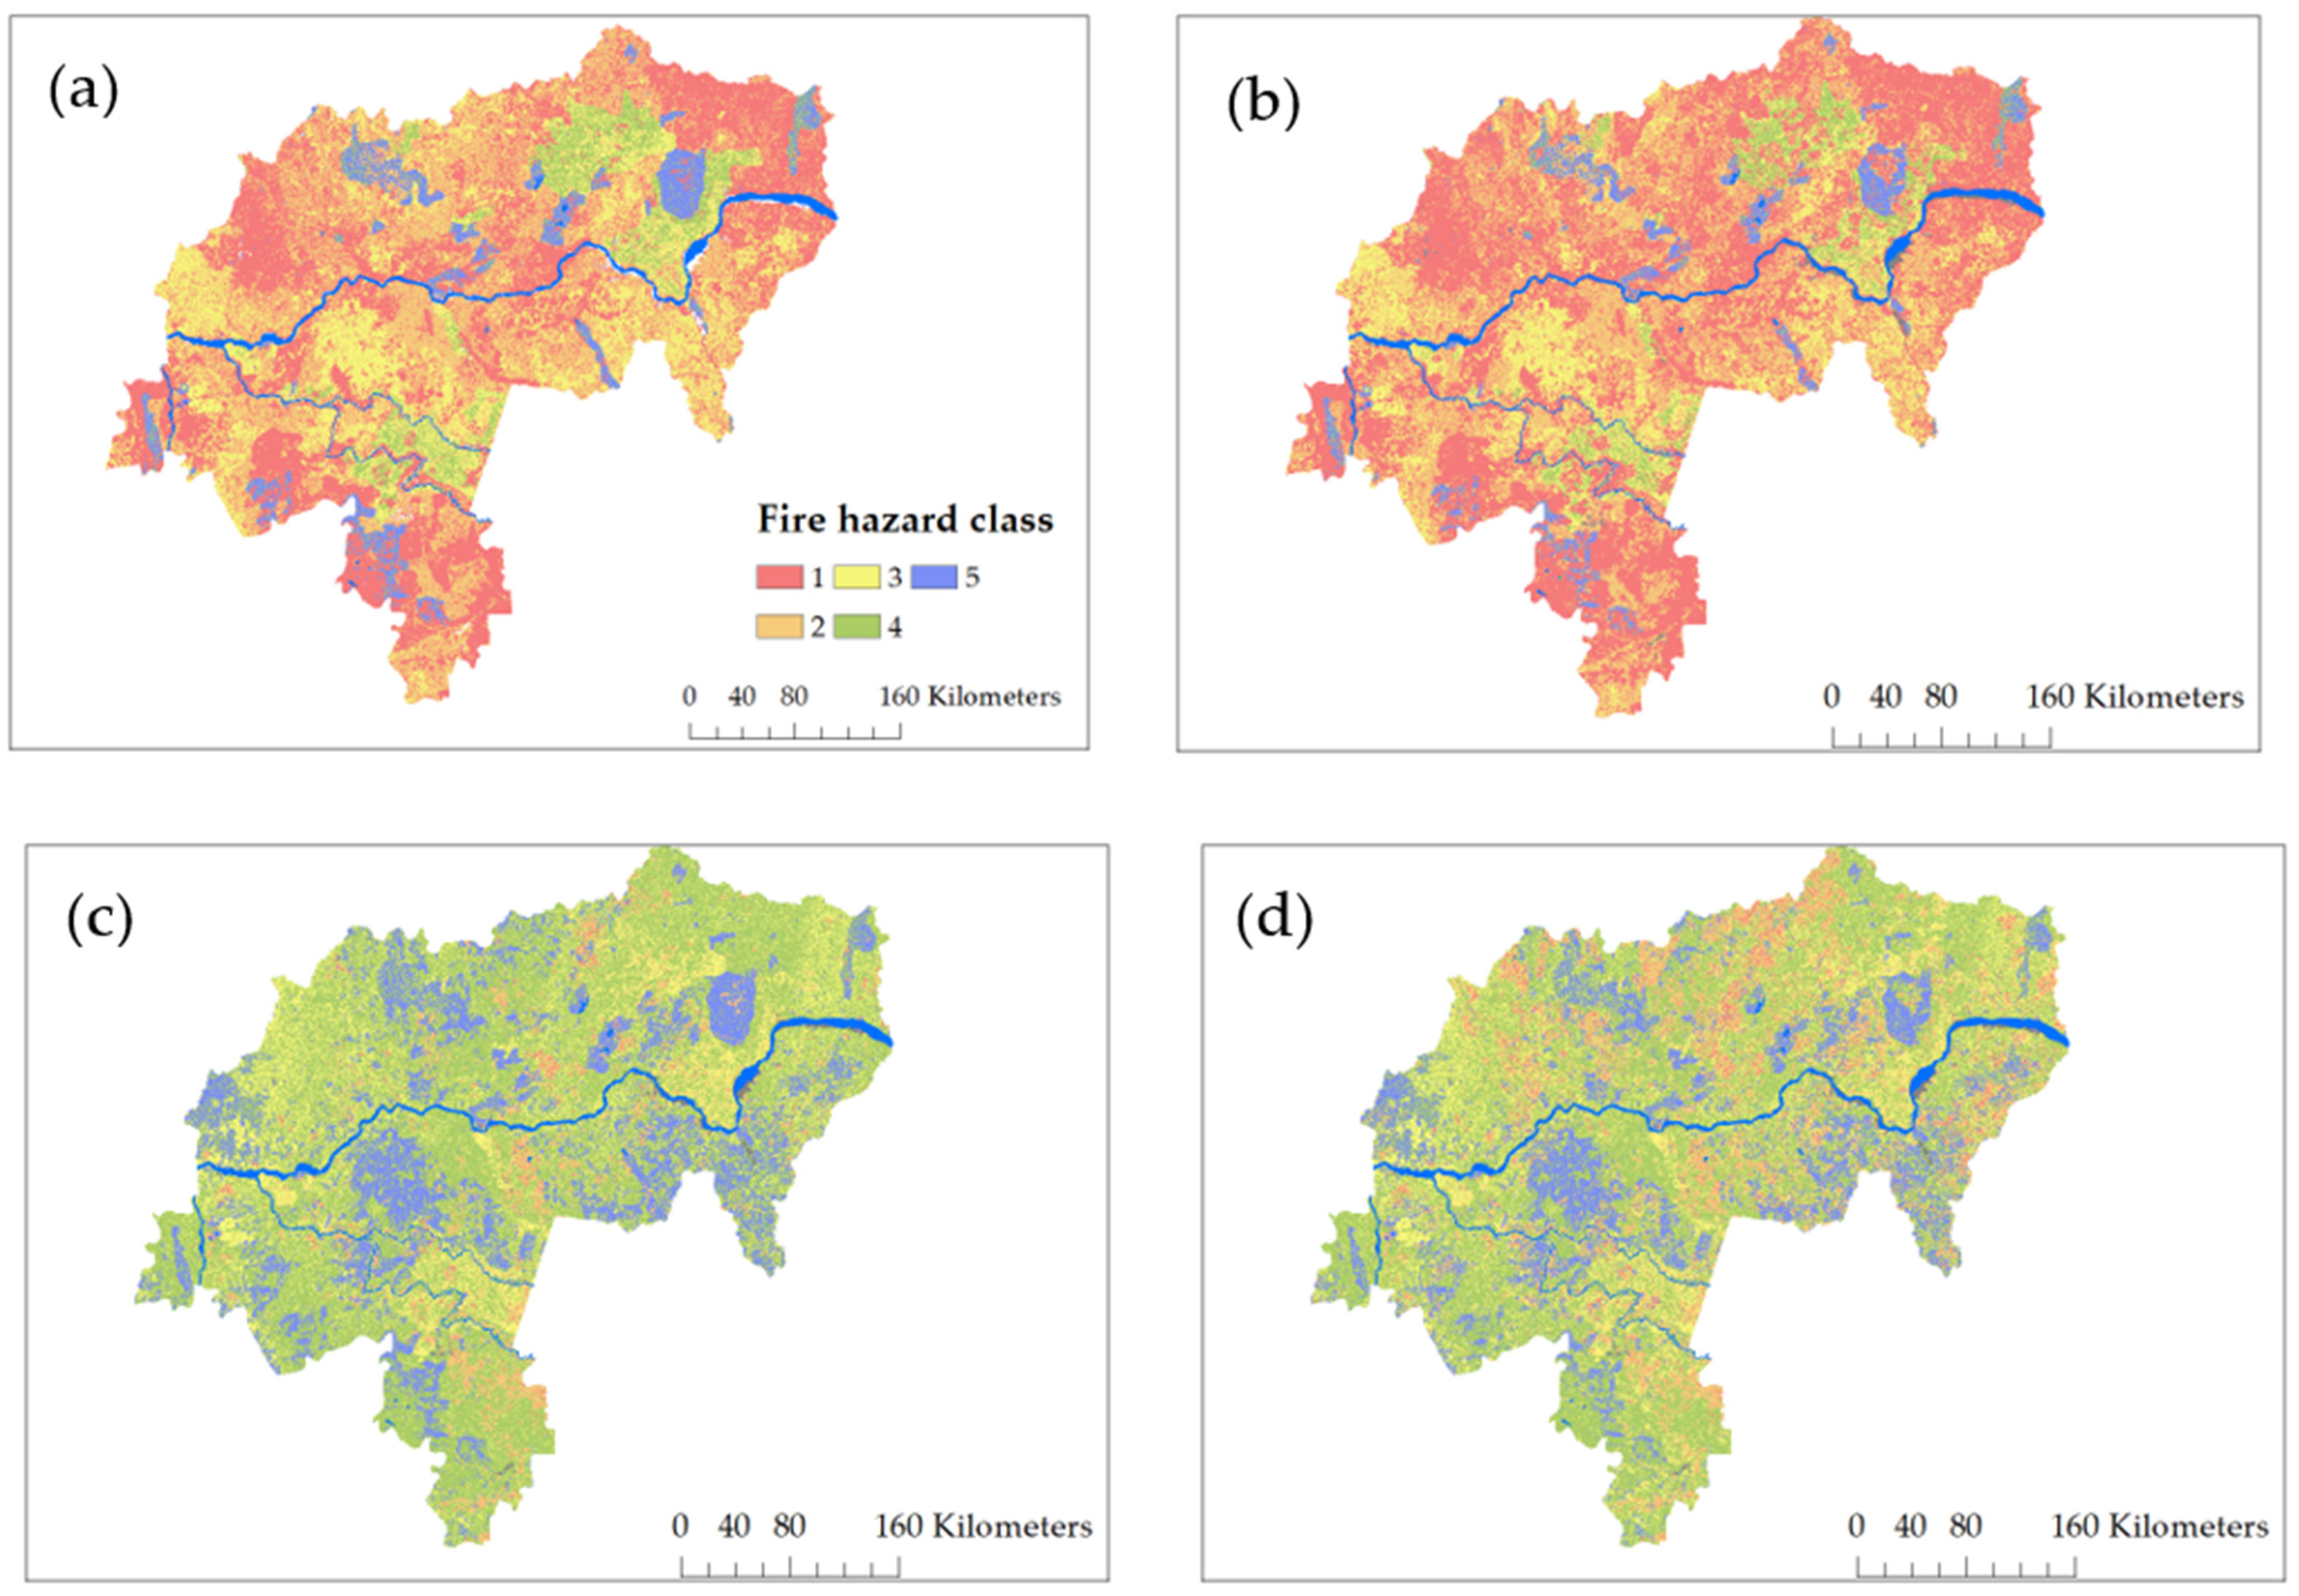
The average natural fire hazard was determined based on forest conditions in the Angara region from 2001 to 2020. It was high (1.96 ± 0.06) in spring and low (3.70 ± 0.08) in summer (Figure 5). Over the observed period, it increased from 2.06 to 1.86 in spring and from 3.81 to 3.56 in summer (Table S4 in Supplementary Materials) due to the increase in the disturbed areas in the region. The annual fire hazard increase rate over the 20-year period was 0.010 for spring and 0.012 for summer (with the probability, p, of the event “no trend” being below one in a thousand, p-value (level of significance) < 0.001). While the transition from one fire hazard class to another across the whole Angara region could not be linear, the increasing trends indicate a significant change in fire hazard over the large areas in the study region.
3.3. Carbon Emissions from Fires in the Angara Region
Annual carbon emissions from fires in the Angara region varied from 0.06 to 6.18 Mt during the 2001–2020 period (Figure 6a). While there was no significant trend in the increase in annual carbon emissions over the study period (p > 0.05), the decadal means doubled (1.17 to 2.33 Mt) from the 2001–2010 period to the 2011–2020 period, and differed significantly (with p < 0.1). Moreover, the share of the emissions from high-severity fires increased significantly (p < 0.005), averaging from 0.32 MtC per year during the first decade to 1.32 MtC per year during the second decade (Figure 6a). Annual mean carbon emissions from fires across the whole study area were 8 to 13 tC/ha (Figure 6b), varying from 2.5 tC/ha in the grasslands to 25.2 tC/ha in the dark-coniferous forests and to 41.3 tC/ha at logged sites. There was a significant (p < 0.005) increasing trend in mean carbon emissions from fires per unit area over the study period (Figure 6b).
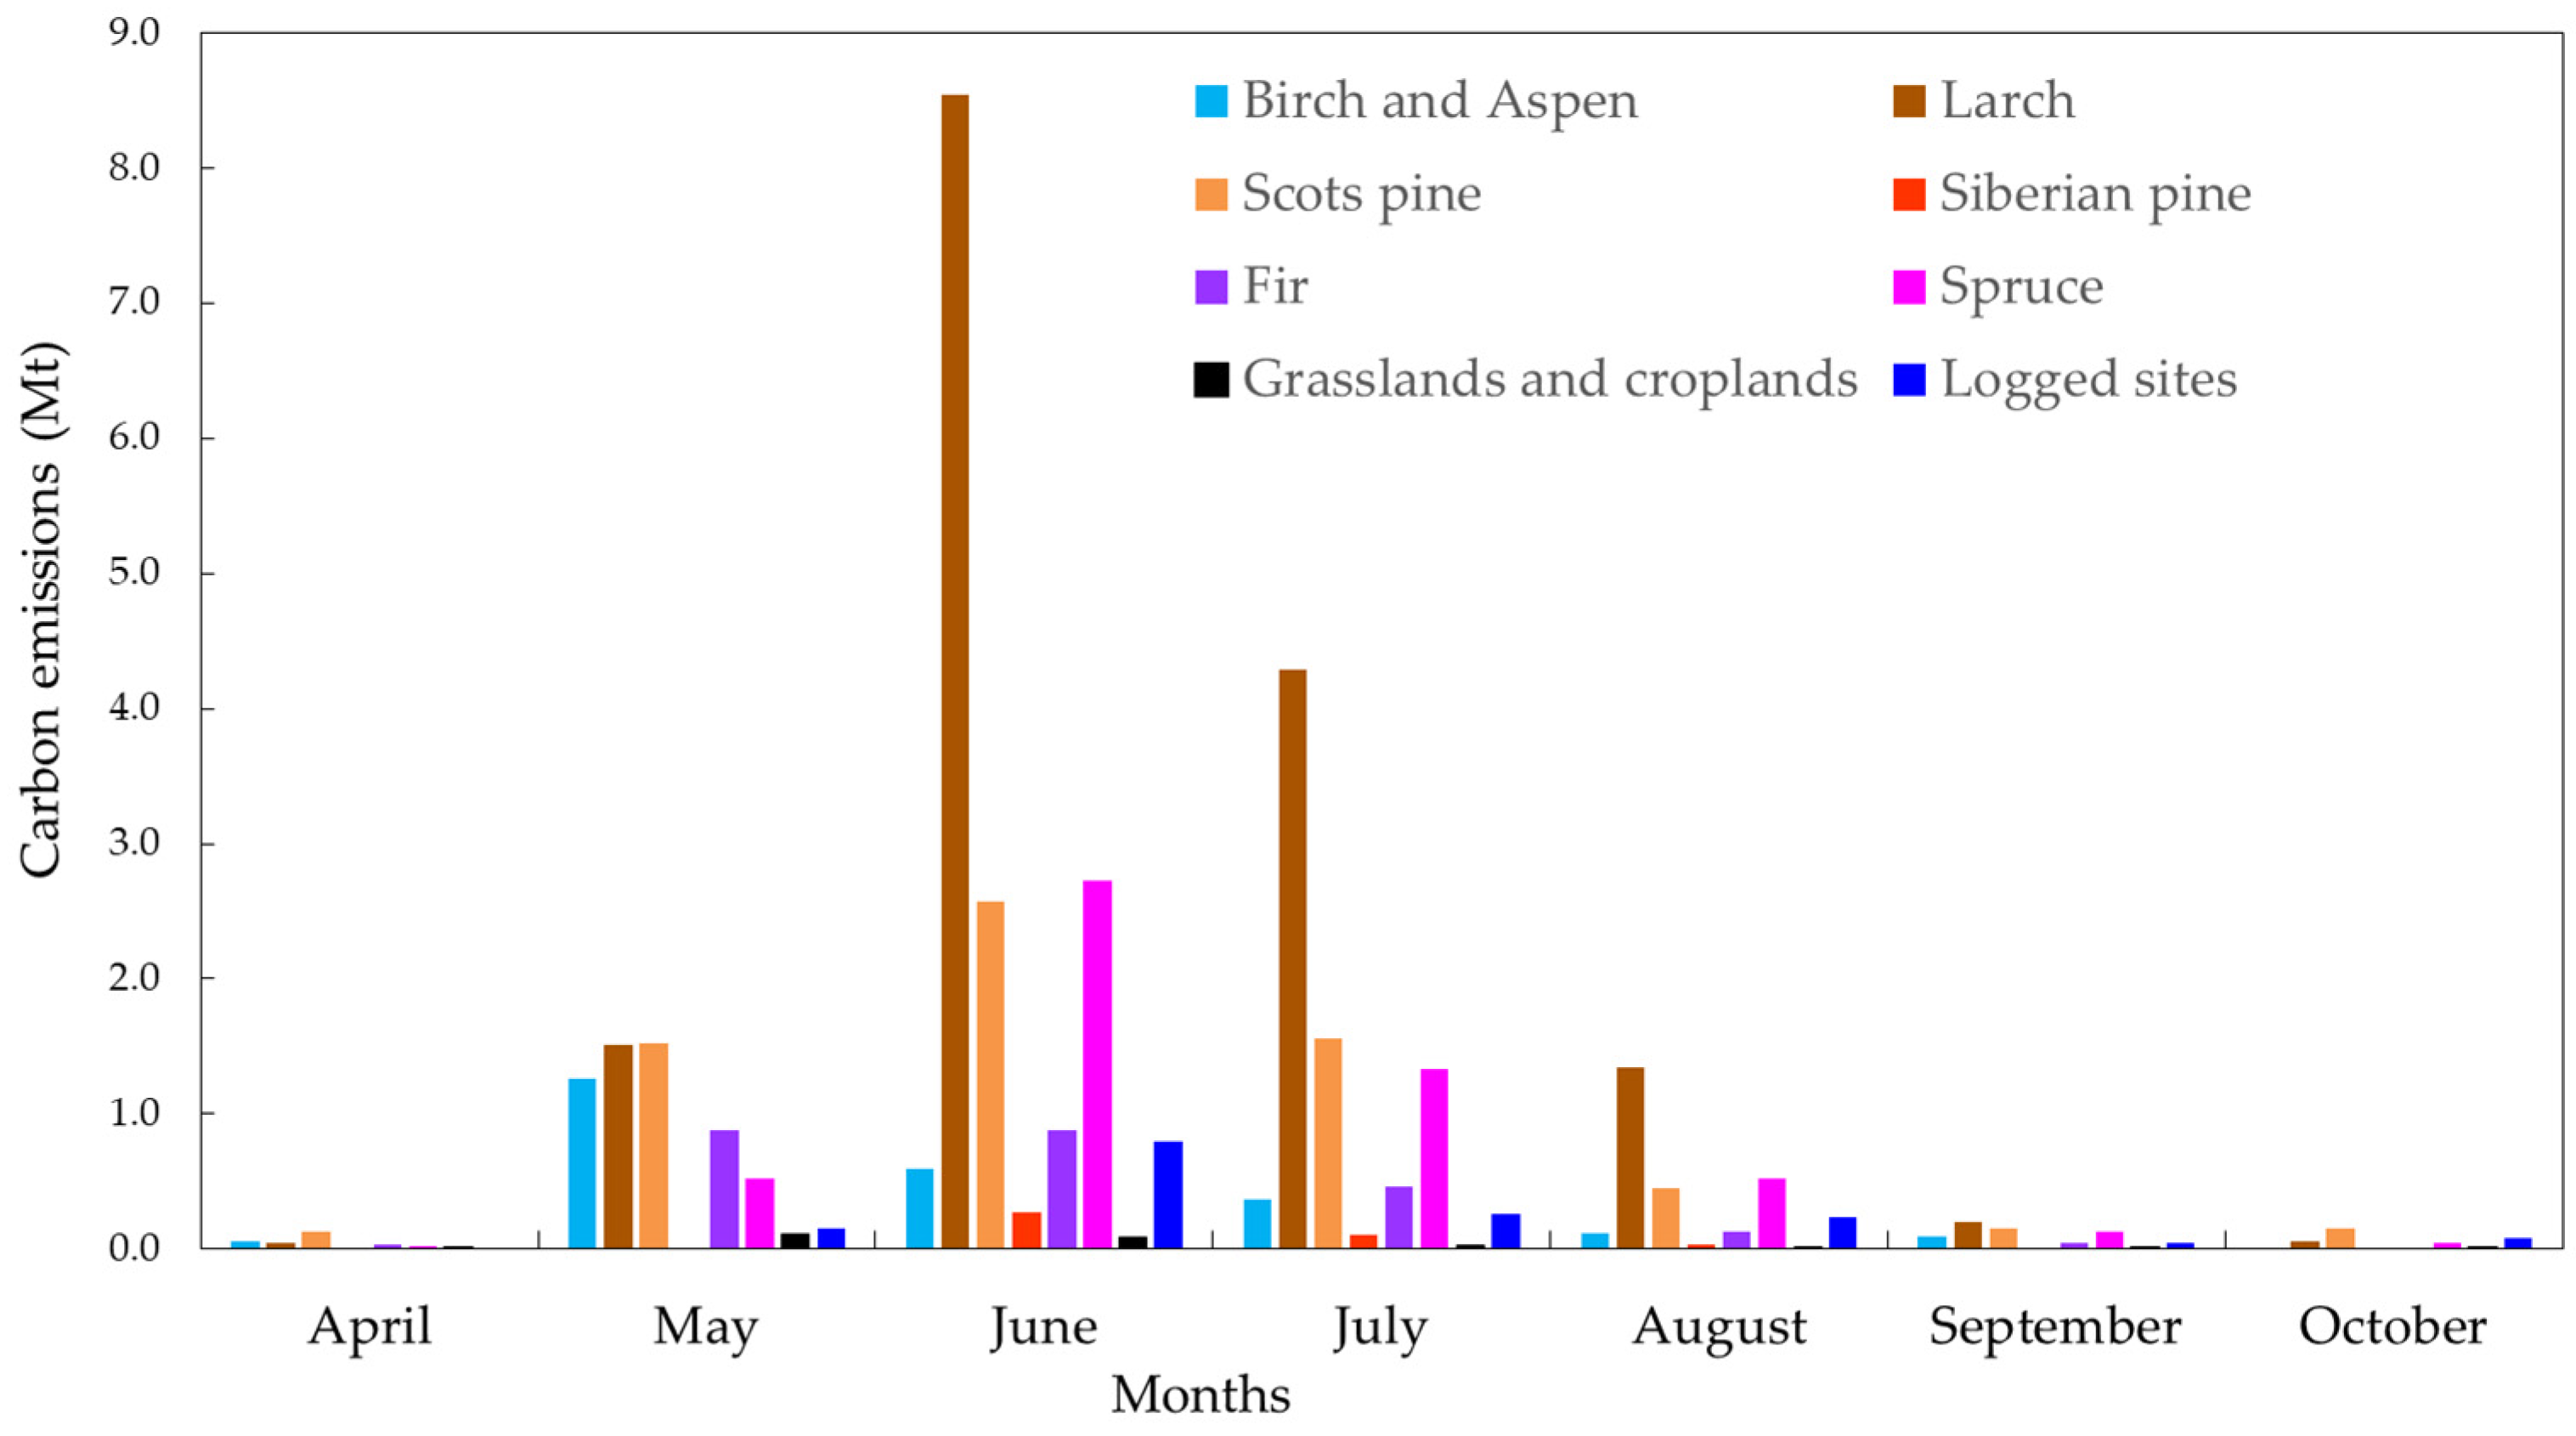
In the extreme fire years (2006, 2012, and 2019), summer (June, July, and August) carbon emissions accounted for more than 95% of the annual value, while in the years of low fire activity (2002, 2005, 2009, 2010, and 2015), the share of spring emissions increased to 31–64% of the total annual emissions (Figure S3 in Supplementary Materials). Overall, from 2001 to 2020, 31%, 64%, and 5% of emissions were released in spring, summer, and autumn, respectively (Figure 7). The majority of carbon emissions from fires was released in June, which corresponds to the largest area burned in the study region [54].
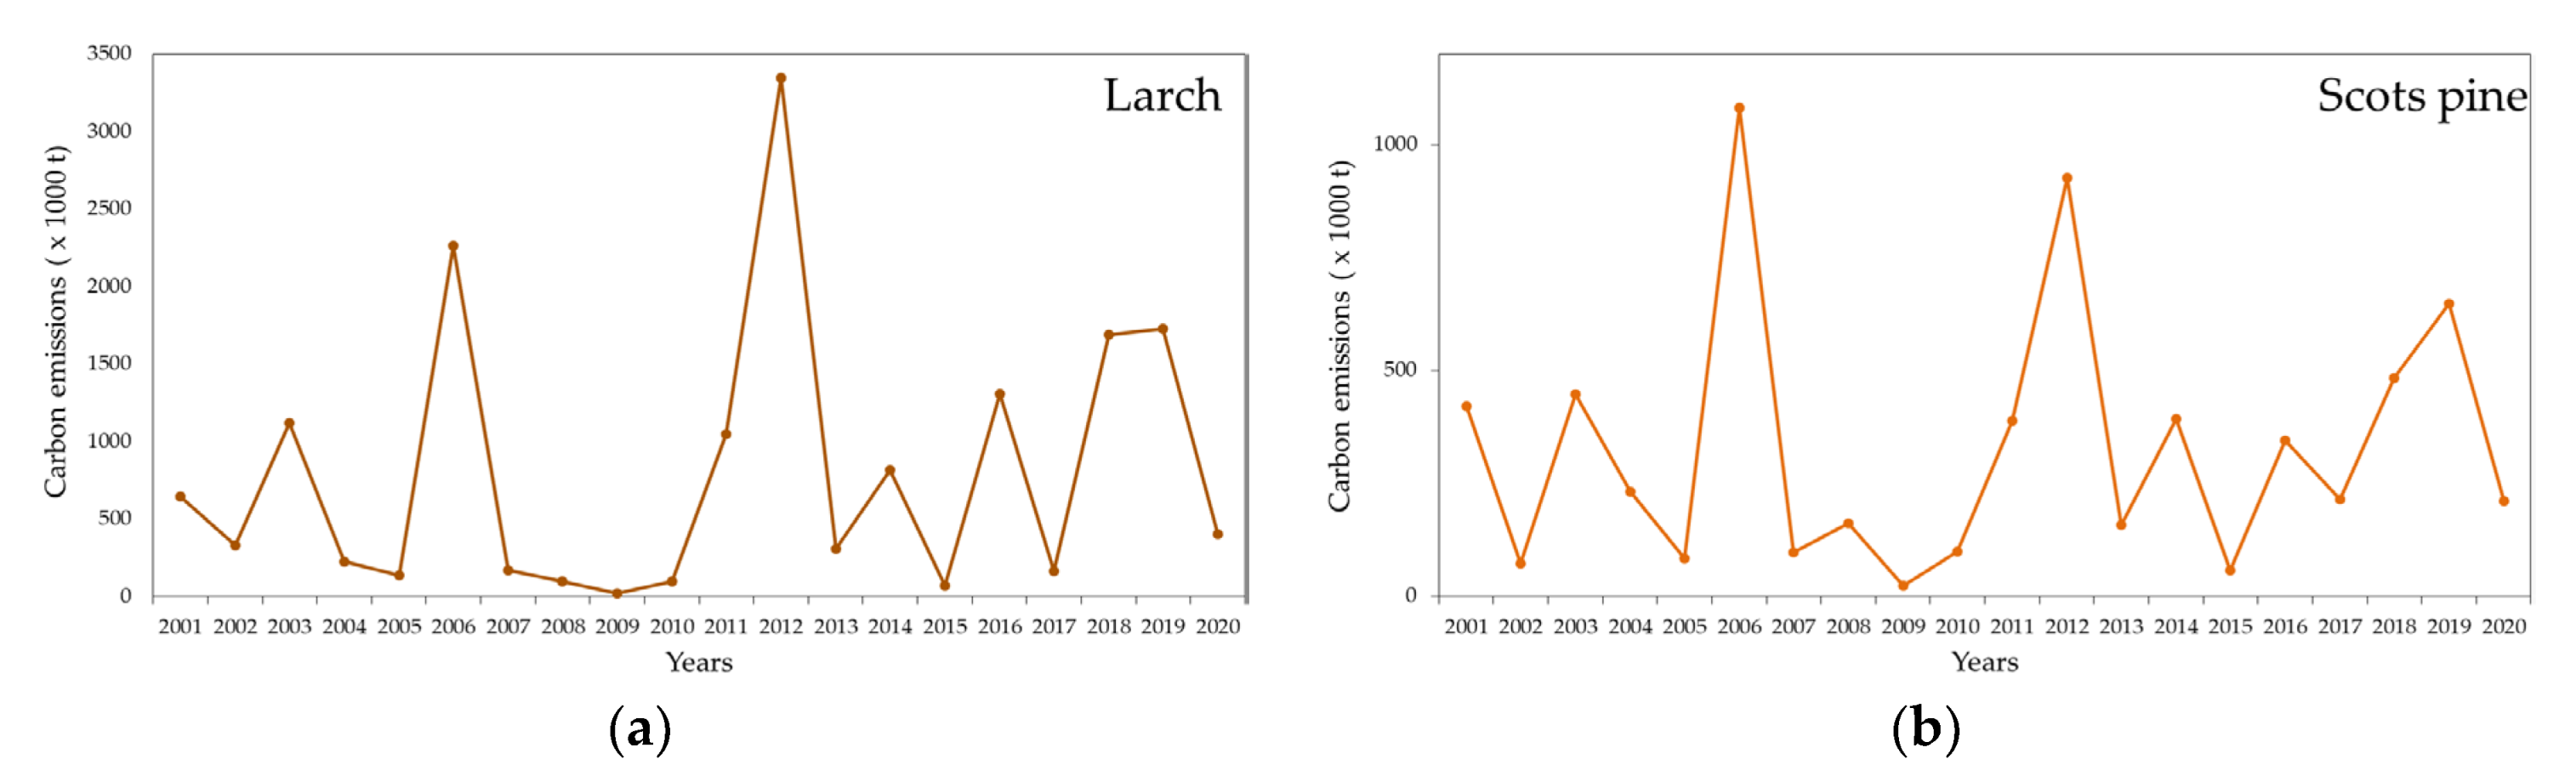
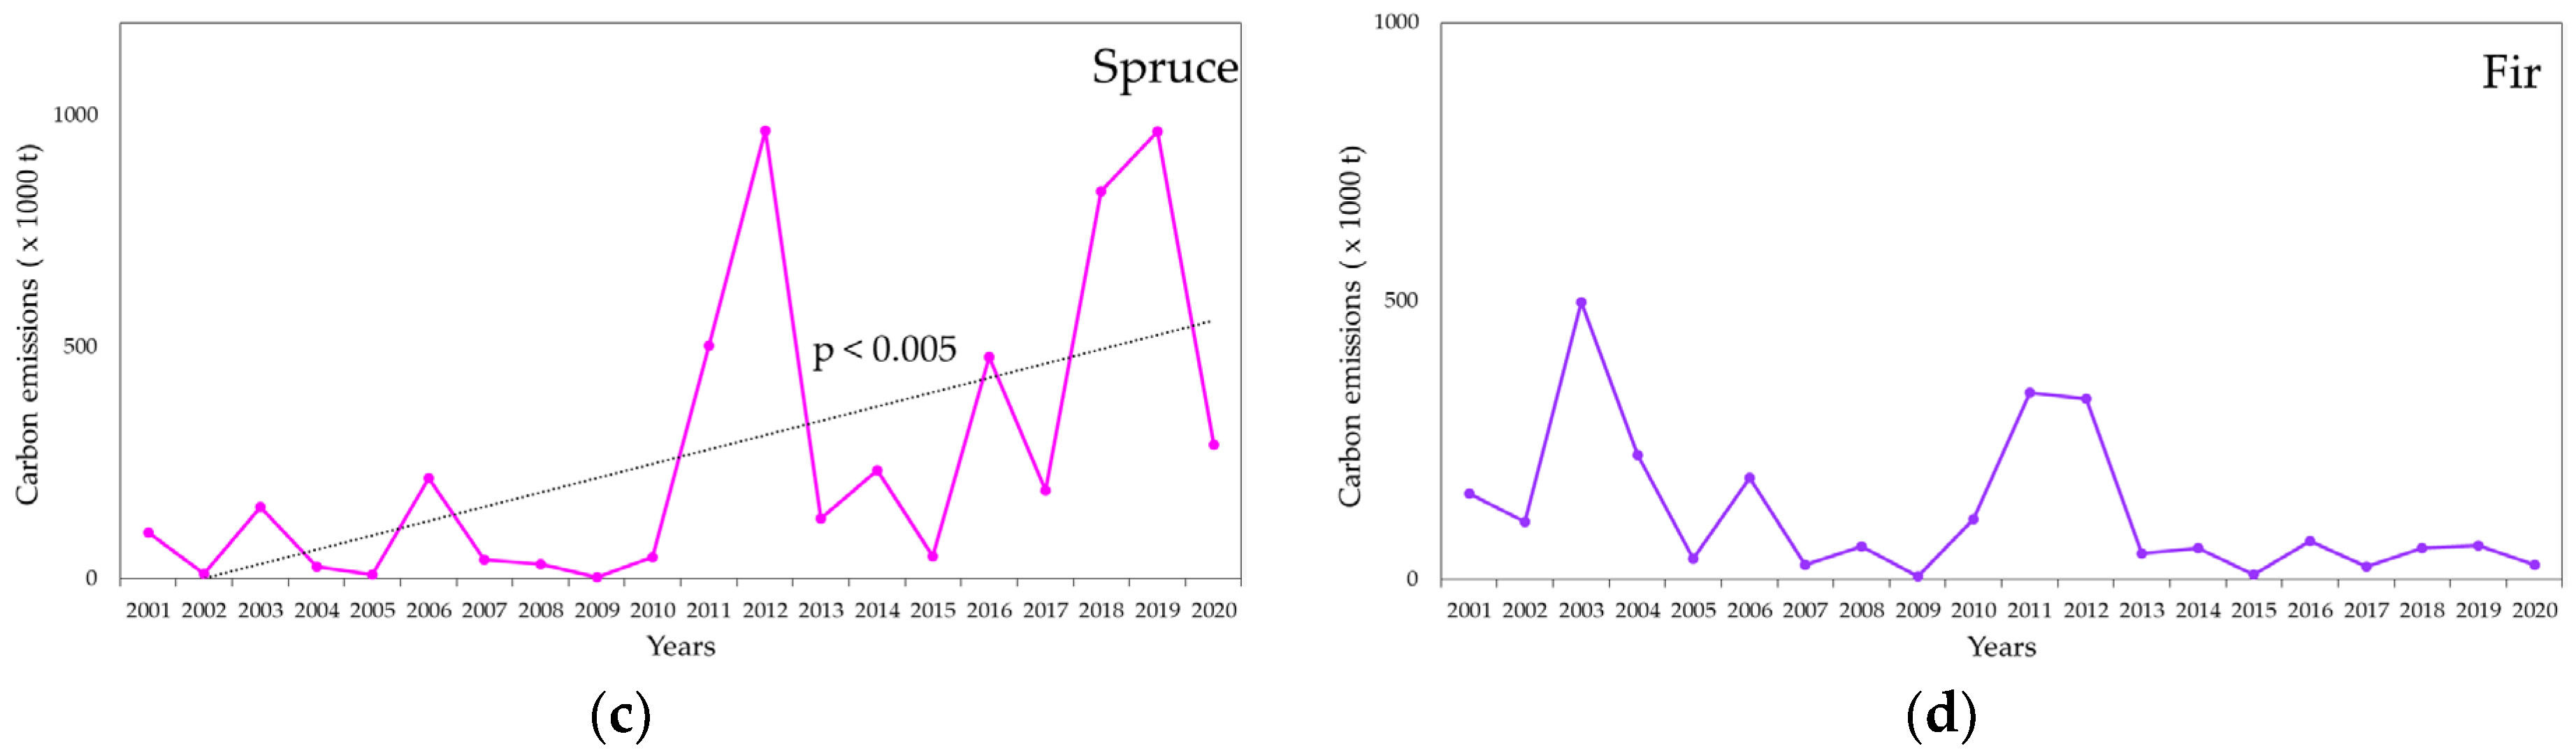
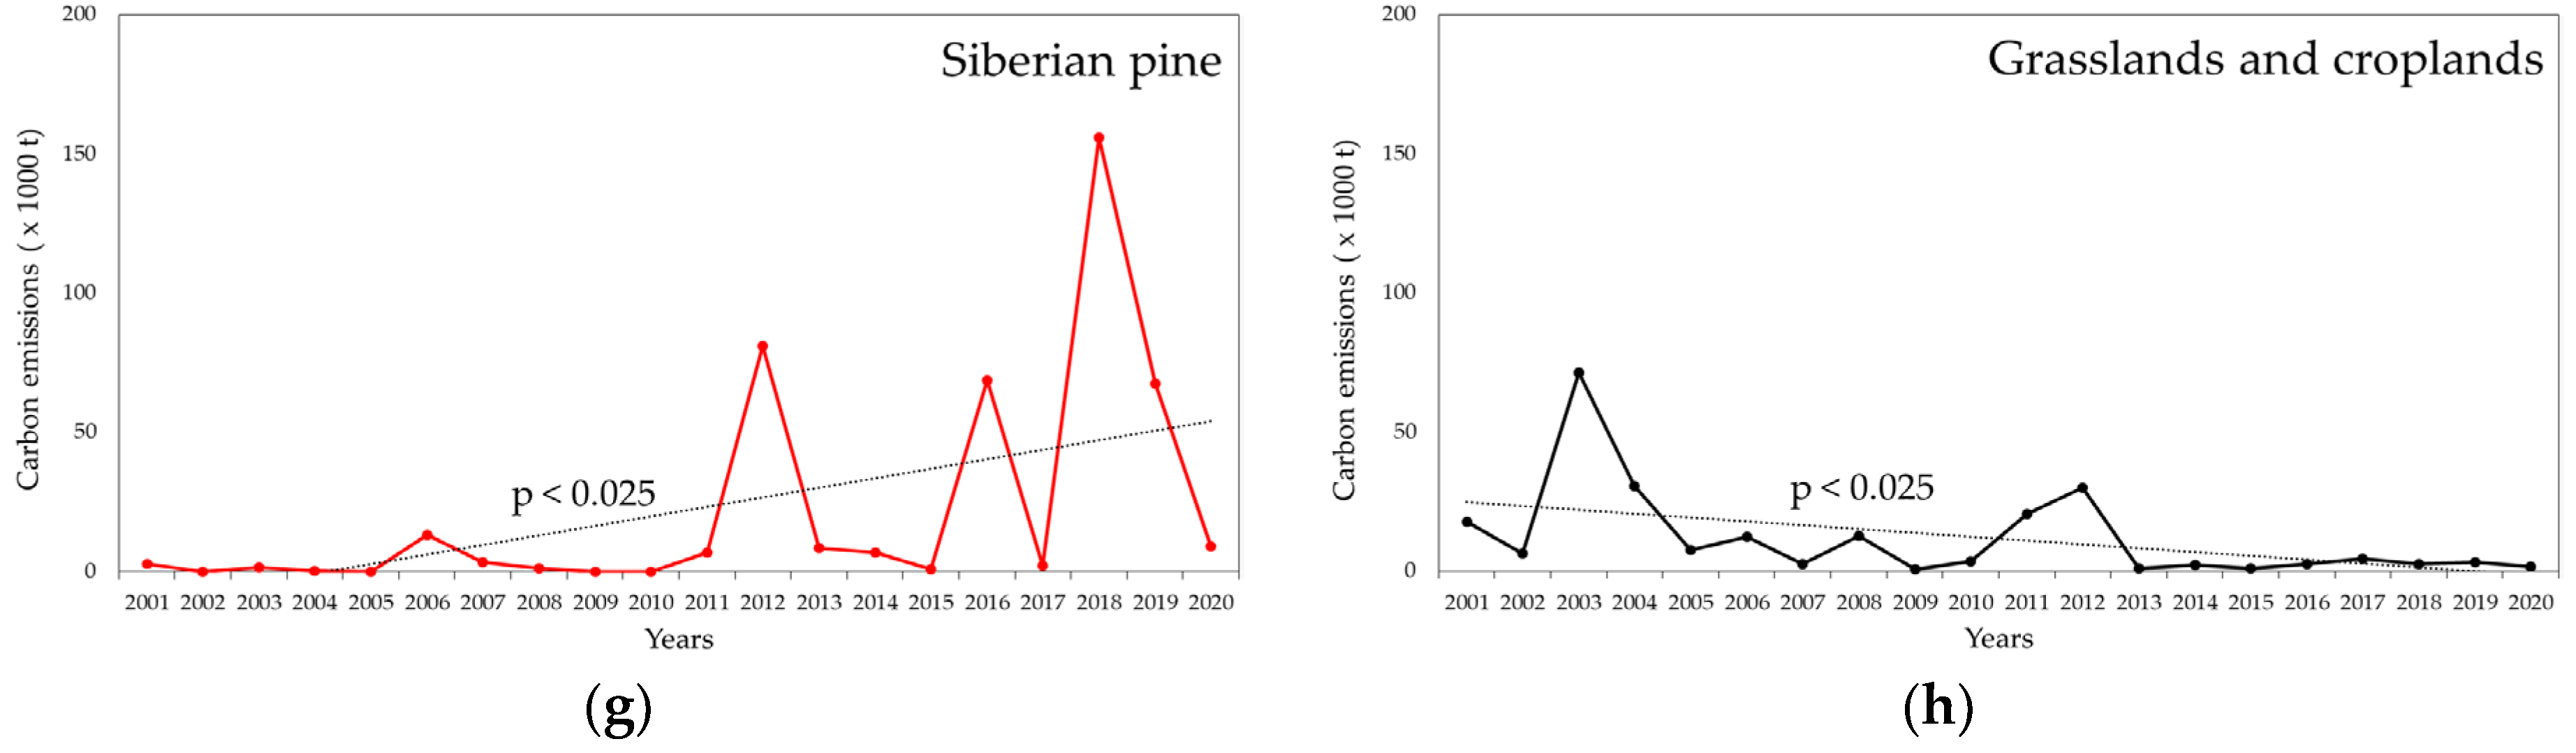
Larch forests accounted for the highest carbon emissions from fires (45% of the total value for the period from 2001 to 2020) due to their widespread nature in the Angara region (22% of the study area) and large area burned (37% of the total burnt area). At the same time, emissions produced in the Scots pine forests comprised 19% of total emissions, while the area burned there was quite high (30%). Lower emissions in the Scots pine forests were due to the smaller pre-fire fuel loads in these forests (Table S1 in Supplementary Materials and Figure 2a,b). Carbon emissions from fires in the deciduous (birch and aspen) forests were highest in May because of the high natural fire hazard due to the dominance of easily flammable grass vegetation on the ground and the spread of agricultural burning from croplands often located near the deciduous forests where 60% of fires occur in April and May. While the logged burnt area was rather small (2% of the total area burned), the contribution of carbon emissions produced there to the total amount reached 5% over the study period due to high fuel consumption at logged sites. Moreover, there is a significant (p < 0.005) trend in the increase in carbon emissions at logged sites over the study period (Figure 8). Carbon emissions from fires in spruce and Siberian pine (Pinus sibirica Du Tour) forests also significantly increased from 2001 to 2020 (p < 0.005 and p < 0.025, respectively) while carbon release in the deciduous forests as well as in grasslands and croplands significantly decreased (p < 0.025). Emissions in light coniferous (larch and Scots pine) forests did not show any significant change trend (Figure 8). Carbon emissions at repeatedly burned forest sites accounted for 11.04 MtC, which was 16% of total emissions from fires over the 2001–2020 period.
4. Discussion
Surface and ground fuels account for about 75–90% of fuel potentially available to burn during fires in the light-coniferous forests of Siberia. In the case of fire spreading to the crown, the contribution of needles and small branches in the tree canopy to overall fuel consumption is 10 to 25% [42,45]. However, the majority of fires in the southern taiga that spread as surface fires resulted in low tree mortality [50]. Therefore, the maps that we developed encompass the majority of fuels potentially available to burn and could be used to accurately evaluate fuel consumption and carbon emissions from fires. Currently, there is still a lack of regional estimates of fuel loads and fuel consumption, especially for extensive areas of Siberia [56,57]. Meanwhile, surface and ground fuel loads may vary drastically depending on the forest type even within the same tree genera. Thus, in the dry-lichen Scots pine stands, fuel loads account for 18–26 t/ha, while in the wet feather moss/sphagnum Scots pine stands, they reach 40 t/ha and more [42,58] (Table S1 in Supplementary Materials). This irregularity results in drastic differences in fire behavior [59] as well as in fuel consumption and carbon emissions [60]. In addition, logging substantially increases fuel loads in the forested areas of Siberia leading to higher carbon emissions from fires [20]. We found a significant increase in the total surface and ground fuel loads in the Angara region (from 713 to 766 Mt) over the study period. Higher fuel loads potentially available to burn may lead to higher fire severity, fuel consumption, and carbon emitted to the atmosphere. Taking into account that the majority of fuel-load increase is associated with an increase in down woody debris loads at the disturbed-by-fires and loggings sites, we observed the increase in fire hazard in the region. Natural and anthropogenic disturbances should be taken into account when estimating fire hazard and fire effects.
The natural fire hazard in Russia is assessed based on a scale developed by Melekhov [52] with a few additions [53], which defines fire risks in the forests for the summer period. Thus, forests with grasses as the dominant ground cover are classified as a low (4) class of fire hazard. In summer, these forest types are indeed characterized by a low fire risk. However, in spring and autumn, forests with a grass ground cover have a high fire hazard and often burn [54]. So, the natural fire hazard in Russia should be assessed for at least two seasons, taking into account change in vegetation over the growing season. Our maps indicated a high (1.96) fire hazard in the Angara region in spring. This corresponds with the fact that the majority of fires (about 50%) occur between March and May [54]. The fire hazard of the forests disturbed by clearcut logging and fires is high due to grass proliferation and large amounts of dry surface and ground fuels, which become readily ignitable sooner than fuels under the forest canopy [20]. These sites are classified as a very high (1) class of fire hazard in spring and a high (2) class in summer if they are located in dry or mesic soil. Logged sites and burned forests with high tree mortality located in wet soil have a very high (1) class of fire hazard in spring and a low (4) class in summer (Table S3 in Supplementary Materials). An increase of anthropogenic pressure over the last two decades resulted in accumulation of large unforested areas across the Angara region [2,23], thus increasing the overall natural fire hazard of the territory. Within some forestries (i.e., official administrative forestry regions) of the Angara region, only one large fire event could change the natural fire hazard from moderate- (3) to high- (2) class [54]. To properly evaluate the natural fire hazard, it should be reassessed at the end of each severe fire season, as logged sites and burned areas with high to total tree mortality are characterized by higher fire risks than undisturbed forest areas.
While over the entire area of Siberia researchers observed an increase in carbon emissions from fires over the last two decades [61], we did not observe a significant trend of increase of the annual total emissions in the Angara region. We suppose this is because of the high interannual variability of the area burned (Figure S1 in Supplementary Materials) and the fact that the forests in the study region have been actively harvested since the 1970s and for a long time experienced high anthropogenic pressure and an increased number of fires (and, therefore, fire emissions) due to local population activities [20]. This is opposite of the Siberian Arctic, where the decadal frequency of fires tripled from the 2001–2010 to the 2011–2020 periods [7].
While the decadal area burned increased by 150% from the 2001–2010 to the 2011–2020 periods (Figure S1 in Supplementary Materials), decadal mean carbon emissions increased by almost 200% (Figure 6a). We suppose that this phenomenon, as well as the significant increase in carbon emissions per unit area (Figure 6b), was associated with the increase in severe fires (Figure 6a) which spread to wetter forest types (Figure 2d) previously unburned (Figure 8). These forests have longer fire return intervals [1] and high fuel loads compared to the dry, light, coniferous (Scots pine and larch) stands (Table S1 in Supplementary Materials). The spreading of fires to the wet, dark, coniferous (Siberian pine and spruce) forests may result in the release of legacy carbon, which has a net climate warming effect [62,63]. At the same time, a significant decrease in carbon emissions due to fires in the croplands and grasslands (Figure 8) located mainly in the southern part of the Angara region might be associated with enactment of the federal law by the Government of the Russian Federation in the beginning of the last decade that prohibits the burning of agricultural lands. Carbon emissions from fires in the deciduous forests also show a significant decreasing trend because they usually burn in spring from agricultural fires.
Our data on carbon emissions from fires are twice as big as the data obtained by [58] for the Angara region from 2014 to 2019. The difference in data could be associated with the use of official fire statistic data by Ivanov et al. [58], which often underestimates the area burned [64], as well as to the fact that they calculated emissions only for the most burnable areas in the region’s light coniferous (Scots pine and larch) forests and did not take into account previous disturbances (fires/logging). Meanwhile, we found that carbon emissions from fires in the dark, coniferous forests (spruce, fir, and Siberian pine) accounted for 23% of the total emissions in the Angara region over the study period. Carbon emissions from fires in these forests usually exceed those in the light-coniferous forests by at least 2 times per unit area due to higher pre-fire fuel loads [63,65].
We have also compared our data with estimates of fire emissions from GFED4s global database for 2001–2015 [66]. While for the fifteen-year period the overall difference between the datasets was rather small (15%), in some years the difference in emissions reached up to 60%, with our estimates exceeding GFED4s values in nine of the years and being lower than GFED4s values in six of the years (Figure S4 in Supplementary Materials). The global database uses reference data for fuel loads and consumption mainly for the boreal forests of northern America (NA), with limited data obtained for the vast Russian territory (mainly for the northern forests) [56,57]. Thus, GFED might overestimate emissions from fires in the southern boreal forests of Siberia where fuel consumption is usually less compared to northern Russia and NA. On the other hand, GFED does not take into account increased fuel loads at the disturbed forests resulting in lower fuel consumption estimates in these areas. The other source of uncertainty is different algorithms used to evaluate the area burned.
5. Conclusions
For the first time, we have developed regional dynamic maps of surface and ground fuel loads in the Angara region of central Siberia based on satellite datasets on orography, land-cover types, and disturbances, as well as fieldwork data on fuel loads in different forest types. Fuel maps could be used for fire danger assessment for different weather conditions, thus enhancing current fire danger systems. The maps are required to predict the probability of fire occurrence, fire characteristics (e.g., fire severity, rate of spread, and fuel consumption), and environmental consequences as well as to evaluate socio-economic damage from fires, including fire emissions. Moreover, improved planning could be carried out with the use of maps developed to identify the most at-risk areas and to minimize potential fire damage, ensuring the forest ecosystem’s stability.
We found an increase in fuel loads, fire hazard, and carbon emissions from high-severity fires and from fires in the dark coniferous forests and logged sites from 2001 to 2020 in the study region. Mean carbon emissions from fires per unit area and decadal emissions also significantly increased over the past twenty years. Climate change and increasing anthropogenic pressure have intensified wildfire impacts in the boreal forests over recent decades [67,68]. Moreover, fire frequency and area burned are projected to increase with expected climate warming and drying [69]. When fires became more frequent or severe, legacy carbon that had escaped a previous fire may be emitted, resulting in the transition of forests from net C uptake to net C loss [62,63]. Vast areas of Siberia disturbed by logging and high-severity fires are characterized by a high fire hazard [25] and are a source of increased fire emissions [20]. Therefore, fuel loads and fire emissions should be evaluated with respect to disturbance of the territory. In addition to logging and fires, another important disturbance factor in many regions of Siberia is insect invasion (e.g., Dendrolimus sibiricus Tschetverikov and Polygraphus proximus Blandford). Insect-killed forests have high fuel loads, fire hazards, and consumption [70,71].
To improve the accuracy of fire emissions estimates, vegetation and fuel maps for the various regions of Siberia should be complied and regularly updated with respect to all types of forest disturbances.
Supplementary Materials
The following supporting information can be downloaded at: https://www.mdpi.com/article/10.3390/fire6020063/s1. Figure S1: Area burned and logged in the Angara region based on satellite data during the 2001–2020 period; Figure S2: Recovery of surface and ground fuel loads after fires of low to moderate and high severities in various forests and logged sites (a) and after clearcut logging (b). The bars indicate standard deviation; Figure S3: Distribution of carbon emissions from fires by months from 2001 to 2020; Figure S4: Comparison of annual carbon emissions due to fires from our estimates and GFED4s [66] in the Angara region for the period from 2001 to 2015; Table S1: Surface and ground fuel loads in the dominant forest conditions of the Angara region; Table S2: Classification of natural forest-fire hazard (according to [53]); Table S3: Fire hazard in the dominant site conditions of the Angara region; Table S4: Spring and summer fire hazard (mean value ± SD) in the Angara region from 2001 to 2020.
Author Contributions
Conceptualization, E.A.K.; methodology, E.A.K., E.G.S. and L.V.B.; formal analysis, E.A.K., E.G.S. and P.D.T.; investigation, E.A.K., E.G.S. and L.V.B.; resources, E.A.K. and E.G.S.; data curation, E.A.K., E.G.S. and L.V.B.; writing—original draft preparation, E.A.K., E.G.S. and P.Y.G.; visualization, E.G.S.; supervision, E.A.K.; project administration, E.A.K.; funding acquisition, E.A.K. and P.Y.G. All authors have read and agreed to the published version of the manuscript.
Funding
This research was funded by the RFBR, Government of the Krasnoyarsk Krai, the Krasnoyarsk regional foundation of scientific and scientific-technical support (Grant # 20-44-242004), and the State Assignment (Grant # 0287-2021-0041). The work of P.Y.G. is partially supported by the NSF Grants # 2020404 ‘Belmont Forum Collaborative Research: Coastal OceAn SusTainability in Changing Climate’ and #. 2127343 ‘NNA Collaborative Research: Frozen Commons: Change, Resilience and Sustainability in the Arctic’.
Institutional Review Board Statement
Not applicable.
Informed Consent Statement
Not applicable.
Data Availability Statement
The data used in this study are openly available: topography data at https://earthdata.nasa.gov/ (accessed on 1 November 2022) [40]; forest cover map at http://pro-vega.ru/maps/ (accessed on 1 November 2022) [41]; soil types at https://nsidc.org/data/ggd601/versions/1 (accessed on 1 November 2022) [47]; hotspots at https://ladsweb.modaps.eosdis.nasa.gov (accessed on 1 November 2022) [48]; surface reflectance product at https://ladsweb.modaps.eosdis.nasa.gov (accessed on 1 November 2022) [51], GFED4s at https://daac.ornl.gov/VEGETATION/guides/fire_emissions_v4_R1.html (accessed on 1 November 2022) [66]. The developed maps of fuel loads and fire hazards as well as area burned and clearcut datasets for the Angara region are available at the following URL/DOI: https://github.com/data-store-a/fuel-load-and-fire-hazard.
Conflicts of Interest
The authors declare no conflict of interest.
References
- Goldammer, J.G.; Furyaev, V.V. (Eds.) Fire in Ecosystems of Boreal Eurasia; Forestry Sciences; Springer: Dordrecht, The Netherlands, 1996; Volume 48, Available online: https://link.springer.com/book/10.1007/978-94-015-8737-2 (accessed on 10 September 2022).
- Leskinen, P.; Lindner, M.; Verkerk, P.J.; Nabuurs, G.J.; Van Brusselen, J.; Kulikova, E.; Hassegawa, M.; Lerink, B. (Eds.) Russian Forests and Climate Change. What Science Can Tell Us 11; European Forest Institute: Joensuu, Finland, 2020. [Google Scholar] [CrossRef]
- Kharuk, V.I.; Ponomarev, E.I.; Ivanova, G.A.; Dvinskaya, M.L.; Coogan, S.C.P.; Flannigan, M.D. Wildfires in the Siberian taiga. Ambio 2021, 50, 1953–1974. [Google Scholar] [CrossRef] [PubMed]
- Masson-Delmotte, V.; Zhai, P.; Pirani, A.; Connors, S.L.; Pean, C.; Chen, Y.; Goldfarb, L.; Gomis, M.I.; Matthews, J.B.R.; Berger, S.; et al. (Eds.) IPCC 2021: Climate Change 2021: The Physical Science Basis. Contribution of Working Group I to the Sixth Assessment Report of the Intergovernmental Panel on Climate Change; Cambridge University Press: Cambridge, UK; New York, NY, USA, 2021. [Google Scholar] [CrossRef]
- Kirillina, K.; Shvetsov, E.G.; Protopopova, V.V.; Thiesmeyer, L.; Yan, W. Consideration of anthropogenic factors in boreal forest fire regime changes during rapid socio-economic development: Case study of forestry districts with increasing burnt area in the Sakha Republic, Russia. Environ. Res. Lett. 2020, 15, 035009. [Google Scholar] [CrossRef]
- Feurdean, A.; Florescu, G.; Tantau, I.; Vanniere, B.; Diaconu, A.C.; Pfeiffer, M.; Warren, D.; Hutchinson, S.M.; Gorina, N.; Galka, M.; et al. Recent fire regime in the southern boreal forests of western Siberia is unprecedented in the last five millennia. Quat. Sci. Rev. 2020, 244, 106495. [Google Scholar] [CrossRef]
- Kharuk, V.I.; Dvinskaya, M.L.; Im, S.T.; Golyukov, A.S.; Smith, K.T. Wildfires in the Siberian Arctic. Fire 2022, 5, 106. [Google Scholar] [CrossRef]
- Talucci, A.C.; Loranty, M.M.; Alexander, H.D. Siberian taiga and tundra fire regimes from 2001–2020. Environ. Res. Lett. 2022, 17, 025001. [Google Scholar] [CrossRef]
- Kukavskaya, E.A.; Buryak, L.V.; Shvetsov, E.G.; Conard, S.G.; Kalenskaya, O.P. The impact of increasing fire frequency on forest transformations in southern Siberia. For. Ecol. Manag. 2016, 382, 225–235. [Google Scholar] [CrossRef]
- Barrett, K.; Baxter, R.; Kukavskaya, E.; Balzter, H.; Shvetsov, E.; Buryak, L. Postfire recruitment failure in Scots pine forests of southern Siberia. Remote Sens. Environ. 2020, 237, 111539. [Google Scholar] [CrossRef]
- Tyukavina, A.; Potapov, P.; Hansen, M.C.; Pickens, A.H.; Stehman, S.V.; Turubanova, S.; Parker, D.; Zalles, V.; Lima, A.; Kommareddy, I.; et al. Global trends of forest loss due to fire from 2001 to 2019. Front. Remote Sens. 2022, 3, 825190. [Google Scholar] [CrossRef]
- Burrell, A.L.; Sun, Q.; Baxter, R.; Kukavskaya, E.A.; Zhila, S.; Shestakova, T.; Rogers, B.M.; Kaduk, J.; Barrett, K. Climate change, fire return intervals and the growing risk of permanent forest loss in boreal Eurasia. Sci. Total Environ. 2022, 831, 154885. [Google Scholar] [CrossRef]
- Achard, F.; Mollicone, D.; Stibig, H.-J.; Aksenov, D.; Laestadius, L.; Li, Z.; Popatov, P.; Yaroshenko, A. Areas of rapid forest-cover change in boreal Eurasia. For. Ecol. Manag. 2006, 237, 322–334. [Google Scholar] [CrossRef]
- FAO. Global Forest Resources Assessment 2020: Main Report; FAO: Rome, Italy, 2020. [Google Scholar] [CrossRef]
- Rosstat. Unified Interdepartmental Information and Statistical System (EMISS). Forested Area. Available online: https://fedstat.ru/indicator/38194 (accessed on 6 October 2022). (In Russian).
- Rosstat. Unified Interdepartmental Information and Statistical System (EMISS). Volume of Logged Wood. Available online: https://fedstat.ru/indicator/37848 (accessed on 6 October 2022). (In Russian).
- Kuzmichev, E.; Trushina, I.; Lopatin, E. Volumes of illegal forest logging in Russian Federation. For. Inf. 2018, 1, 63–77. (In Russian) [Google Scholar]
- Kotlobai, A.; Lopina, O.; Kharchenkov, Y.; Bryukhanov, A.; Shchegolev, A.; Smirnov, D. Assessment of Volumes of Timber of Dubious Origin and Analysis of the Wood Tracking Systems Implementation in Some Forest-Rich Regions of the North-West, Siberia and Far East of Russia; WWF: Moscow, Russia, 2006. (In Russian) [Google Scholar]
- Bryukhanov, A.V. Experience in combating illegal wood trafficking in the Krasnoyarsk krai. Sustain. For. 2007, 1, 33–36. (In Russian) [Google Scholar]
- Kukavskaya, E.A.; Buryak, L.V.; Ivanova, G.A.; Conard, S.G.; Kalenskaya, O.P.; Zhila, S.V.; McRae, D.J. Influence of logging on the effects of wildfire in Siberia. Environ. Res. Lett. 2013, 8, 045034. [Google Scholar] [CrossRef]
- Forest Plan of the Krasnoyarsk Krai for the Period 2019–2028. Available online: http://zakon.krskstate.ru/0/doc/54526 (accessed on 6 October 2022). (In Russian).
- Sokolov, V.A.; Farber, S.K. Organization of Forest Management in the Lower Angara Region; Siberian branch of the Russian Academy of Sciences Publishing House: Novosibirsk, Russia, 1999; p. 217. (In Russian) [Google Scholar]
- Shvetsov, E.G.; Kukavskaya, E.A.; Shestakova, T.A.; Laflammy, J.; Rogers, B.M. Increasing fire and logging disturbances in Siberian boreal forests: A case study of the Angara region. Environ. Res. Lett. 2021, 16, 115007. [Google Scholar] [CrossRef]
- Ivanov, V.A.; Ivanova, G.A.; Korchunov, N.A.; Moskalchenko, S.A.; Ponomarev, E.I. Correlation of forest fire occurrence with disturbance level of forest territories in the Lower Angara region. Forestry 2011, 1, 39–41. (In Russian) [Google Scholar]
- Ivanov, V.A.; Moskalchenko, S.A.; Ponomarev, E.I. Impact of forest disturbance on fire occurrence in the Lower Angara region. Conifer. Boreal Zone 2009, 26, 249–254. [Google Scholar]
- Butler, B.W.; Ottmar, R.D.; Rupp, T.; Jandt, R.; Miller, E.; Howard, K.; Schmoll, R.; Theisen, S.; Vihnanek, R.E.; Jimenez, D. Quantifying the effect of fuel reduction treatments on fire behavior in boreal forests. Can. J. For. Res. 2013, 43, 97–102. [Google Scholar] [CrossRef]
- Johnston, D.C.; Turetsky, M.R.; Benscoter, B.W.; Wotton, B.M. Fuel load, structure, and potential fire behaviour in black spruce bogs. Can. J. For. Res. 2015, 45, 888–899. [Google Scholar] [CrossRef]
- Keane, R.E.; Mincemoyer, S.A.; Schmidt, K.M.; Long, D.G.; Garner, J.L. Mapping Vegetation and Fuels for Fire Management on the Gila National Forest Complex, New Mexico; US Department of Agriculture, Forest Service, Rocky Mountain Research Station: Missoula, MT, USA, 2000. [Google Scholar] [CrossRef]
- Wilson, B.A.; Ow, C.F.; Heathcott, M.; Milne, D.; McCaffrey, T.M.; Ghitter, G.; Franklin, S.E. Landsat MSS Classification of Fire Fuel Types in Wood Buffalo National Park, Northern Canada. Glob. Ecol. Biogeogr. Lett. 1994, 4, 33–39. [Google Scholar] [CrossRef]
- Falkowski, M.J.; Gessler, P.E.; Morgan, P.; Hudak, A.T.; Smith, A.M.S. Characterizing and mapping forest fire fuels using ASTER imagery and gradient modeling. For. Ecol. Manag. 2005, 217, 129–146. [Google Scholar] [CrossRef] [Green Version]
- Mutlu, M.; Popescu, S.C.; Stripling, C.; Spencer, T. Mapping surface fuel models using lidar and multispectral data fusion for fire behavior. Remote Sens. Environ. 2008, 112, 274–285. [Google Scholar] [CrossRef]
- Rollins, M.G.; Keane, R.E.; Parsons, R.A. Mapping fuels and fire regimes using remote sensing, ecosystem simulation, and gradient modeling. Ecol. Appl. 2004, 14, 75–95. [Google Scholar] [CrossRef]
- Keane, R.E.; Reeves, M. Use of Expert Knowledge to Develop Fuel Maps for Wildland Fire Management. In Expert Knowledge and Its Application in Landscape Ecology; Perera, A., Drew, C., Johnson, C., Eds.; Springer: New York, NY, USA, 2012; pp. 211–228. [Google Scholar] [CrossRef]
- Pettinari, M.L.; Chuvieco, E. Generation of a global fuel data set using the Fuel Characteristic Classification System. Biogeosciences 2016, 13, 2061–2076. [Google Scholar] [CrossRef]
- Soja, A.J.; Cofer, W.R.; Shugart, H.H.; Sukhinin, A.I.; Stackhouse, P.W.; McRae, D.J.; Conard, S.G. Estimating fire emissions and disparities in boreal Siberia (1998 through 2002). J. Geophys. Res. Atmos. 2004, 109, D14S06. [Google Scholar] [CrossRef]
- Usoltsev, V.A.; Chasovskikh, V.P.; Barakovskikh, E.V.; Nakai, N.V.; Voronov, M.P. Forest fuels mapping by combining State forest fund account and stand phytomass. Fires in Forest Ecosystems of Siberia. In Proceedings of the All-Russian Conference with Foreign Participation, Krasnoyarsk, Russia, 17–19 September 2008; pp. 81–83. (In Russian). [Google Scholar]
- Sochilova, E.N.; Erchov, D.V.; Korovin, G.N. Methods of low spatial resolution forest fuel mapping. Curr. Probl. Remote Sens. Earth Space 2009, 6, 441–449. (In Russian) [Google Scholar]
- Shvidenko, A.; Schepaschenko, D.; Sukhinin, A.; McCallum, I.; Maksyutov, S. Carbon Emissions from Forest Fires in Boreal Eurasia between 1998–2010. In Proceedings of the 5th International Wildland Fire Conference, Sun City, South Africa, 9–13 May 2011. [Google Scholar]
- Decree of the Ministry of Natural Resources and Environment of the Russian Federation No. 367 of August 18, 2014 “On Approval of the List of Forest Zones in the Russian Federation and the List of Forest Regions of the Russian Federation” Revised on February 19, 2019. Available online: https://docs.cntd.ru/document/420224339 (accessed on 10 September 2022). (In Russian).
- Abrams, M.; Crippen, R.; Fujisada, H. ASTER Global Digital Elevation Model (GDEM) and ASTER Global Water Body Dataset (ASTWBD). Remote Sens. 2020, 12, 1156. [Google Scholar] [CrossRef]
- Bartalev, S.; Egorov, V.; Zharko, V.; Loupian, E.; Plotnikov, D.; Khvostikov, S.; Shabanov, N. Land Cover Mapping over Russia using Earth Observation Data; Russian Academy of Sciences’ Space Research Institute: Moscow, Russia, 2016; ISBN 978-5-00015-006-1. Available online: http://www.iki.rssi.ru/books/2016bartalev.pdf (accessed on 10 September 2022). (In Russian)
- Ivanova, G.A.; Kukavskaya, E.A.; Ivanov, V.A.; Conard, S.G.; McRae, D.J. Fuel characteristics, loads and consumption in Scots pine forests of central Siberia. J. For. Res. 2020, 31, 2507–2524. [Google Scholar] [CrossRef]
- Kurbatsky, N.P. Investigating forest fuel loading and properties. In Forest Fire Science Problems; Kurbatsky, N.P., Ed.; V.N. Sukachev Institute of Forest: Krasnoyarsk, Russia, 1970; pp. 5–58. (In Russian) [Google Scholar]
- Van Wagner, C.E. The line intersect method in forest fuel sampling. For. Sci. 1968, 14, 20–26. [Google Scholar] [CrossRef]
- McRae, D.J.; Conard, S.G.; Ivanova, G.A.; Sukhinin, A.I.; Baker, S.P.; Samsonov, Y.N.; Blake, T.W.; Ivanov, V.A.; Ivanov, A.V.; Churkina, T.V.; et al. Variability of fire behavior, fire effects and emissions in Scotch pine forests of central Siberia. Mitig. Adapt. Strateg. Glob. Change 2006, 11, 45–74. [Google Scholar] [CrossRef]
- Sofronov, M.A.; Volokitina, A.V. Fire Zoning at Taiga Forest; Nauka Publications: Novosibirsk, Russia, 1990. (In Russian) [Google Scholar]
- Stolbovoi, V.; Savin, I. Land Resources of Russia—Maps of Soil Characteristics; Version 1 [Data Set]; National Snow and Ice Data Center: Boulder, Colorado USA. Available online: https://nsidc.org/data/ggd601/versions/1 (accessed on 10 September 2022).
- Giglio, L.; Schroeder, W.; Justice, C. The collection 6 MODIS active fire detection algorithm and fire products. Remote Sens. Environ. 2016, 178, 31–41. [Google Scholar] [CrossRef] [Green Version]
- Hansen, M.C.; Potapov, P.V.; Moore, R.; Hancher, M.; Turubanova, S.A.; Tyukavina, A.; Thau, D.; Stehman, S.V.; Goetz, J.S.; Loveland, T.R.; et al. High-Resolution Global Maps of 21st-Century Forest Cover Change. Science 2013, 342, 850–853. [Google Scholar] [CrossRef]
- Krylov, A.; McCarty, J.L.; Potapov, P.; Loboda, T.; Tyukavina, A.; Turubanova, S.; Hansen, M.C. Remote sensing estimates of stand-replacement fires in Russia, 2002–2011. Environ. Res. Lett. 2014, 9, 105007. [Google Scholar] [CrossRef]
- Vermote, E. MOD09A1 MODIS/Terra Surface Reflectance 8-Day L3 Global 500m SIN Grid V006 [Data set]. NASA EOSDIS Land Processes DAAC. Available online: https://ladsweb.modaps.eosdis.nasa.gov/missions-and-measurements/products/MOD09A1 (accessed on 10 September 2020).
- Melekhov, I.S. Forest Nature and Forest Fires; OGIZ: Arkhangelsk, Russia, 1947. (In Russian) [Google Scholar]
- Order of Rosleskhoz No. 287 of July 5, 2011 “On Approval of Classification of Natural Fire Danger in Forests and Classification of Fire Danger in Forests Depending on Weather Conditions”. Available online: http://docs.cntd.ru/document/902289183 (accessed on 10 September 2022). (In Russian).
- Buryak, L.V.; Kukavskaya, E.A.; Ivanov, V.A.; Malykh, O.F.; Kotelnikov, R.V. Assessment of Fire Hazard and Its Dynamics in Forest Areas of Siberia. Contemp. Probl. Ecol. 2021, 14, 803–814. [Google Scholar] [CrossRef]
- Alexeyev, V.A.; Birdsey, R.A. (Eds.) Carbon Storage in Forests and Peatlands of Russia; Gen. Tech. Rep. NE-244; U.S. Department of Agriculture, Forest Service, Northeastern Research Station: Radnor, PA, USA, 1998. [Google Scholar] [CrossRef]
- van Leeuwen, T.T.; van der Werf, G.R.; Hoffmann, A.A.; Detmers, R.G.; Rucker, G.; French, N.H.F.; Archibald, S.; Carvalho, J.A.; Cook, G.D.; de Groot, W.J.; et al. Biomass burning fuel consumption rates: A field measurement database. Biogeosciences 2014, 11, 7305–7329. [Google Scholar] [CrossRef]
- van Wees, D.; van der Werf, G.R.; Randerson, J.T.; Rogers, B.M.; Chen, Y.; Veraverbeke, S.; Giglio, L.; Morton, D.C. Global biomass burning fuel consumption and emissions at 500 m spatial resolution based on the Global Fire Emissions Database (GFED). Geosci. Model Dev. 2022, 15, 8411–8437. [Google Scholar] [CrossRef]
- Ivanov, V.A.; Ivanova, G.A.; Baksheeva, E.O.; Morozov, A.S. Estimating of greenhouse gas emissions from fires in light coniferous forests of the Lower Angara region. Sib. Lesn. Zurnal 2021, 6, 3–17. (In Russian) [Google Scholar] [CrossRef]
- Loudermilk, E.L.; Hiers, J.K.; O’Brien, J.J. The role of fuels for understanding fire behavior and fire effects. In Ecological Restoration and Management of Longleaf Pine Forests; Kirkman, L.K., Jack, S.B., Eds.; CRC Press, Taylor & Francis Group: Boca Raton, FL, USA, 2018; pp. 107–122. [Google Scholar]
- French, N.H.; Goovaerts, F.P.; Kasischke, E.S. Uncertainty in estimating carbon emissions from boreal forest fires. J. Geophys. Res. 2004, 109, D14S08. [Google Scholar] [CrossRef]
- Ponomarev, E.; Yakimov, N.; Ponomareva, T.; Yakubailik, O.; Conard, S.G. Current Trend of Carbon Emissions from Wildfires in Siberia. Atmosphere 2021, 12, 559. [Google Scholar] [CrossRef]
- Walker, X.J.; Baltzer, J.L.; Cumming, S.G.; Day, N.J.; Ebert, C.; Goetz, S.; Johnstone, J.F.; Potter, S.; Rogers, B.M.; Schuur, E.A.G.; et al. Increasing wildfires threaten historic carbon sink of boreal forest soils. Nature 2019, 572, 520–523. [Google Scholar] [CrossRef]
- Veraverbeke, S.; Delcourt, C.J.F.; Kukavskaya, E.; Mack, M.; Walker, X.; Hessilt, T.; Rogers, B.; Scholten, R.C. Direct and longer-term carbon emissions from arctic-boreal fires: A short review of recent advances. Curr. Opin. Environ. Sci. Health 2021, 23, 100277. [Google Scholar] [CrossRef]
- Kukavskaya, E.A.; Soja, A.J.; Petkov, A.P.; Ponomarev, E.I.; Ivanova, G.A.; Conard, S.G. Fire emissions estimates in Siberia: Evaluation of uncertainties in area burned, land cover, and fuel consumption. Can. J. For. Res. 2013, 43, 493–506. [Google Scholar] [CrossRef]
- Kukavskaya, E.A.; Buryak, L.V.; Kalenskaya, O.P.; Zarubin, D.S. Transformation of the ground cover after surface fires and estimation of pyrogenic carbon emissions in the dark-coniferous forests of Central Siberia. Contemp. Probl. Ecol. 2017, 10, 62–70. [Google Scholar] [CrossRef]
- van der Werf, G.R.; Randerson, J.T.; Giglio, L.; van Leeuwen, T.T.; Chen, Y.; Rogers, B.M.; Mu, M.; van Marle, M.J.E.; Morton, D.C.; Collatz, G.J.; et al. Global fire emissions estimates during 1997–2016. Earth Syst. Sci. Data 2017, 9, 697–720. [Google Scholar] [CrossRef]
- Groisman, P.; Shugart, H.; Kicklighter, D.; Henebry, G.; Tchebakova, N.; Maksyutov, S.; Monier, E.; Gutman, G.; Gulev, S.; Qi, J.; et al. Northern Eurasia Future Initiative (NEFI): Facing the challenges and pathways of global change in the twenty-first century. Prog. Earth Planet. Sci. 2017, 4, 41. [Google Scholar] [CrossRef]
- Bowman, D.; Kolden, C.A.; Abatzoglou, J.T.; Johnston, F.H.; van der Werf, G.R.; Flannigan, M. Vegetation fires in the Anthropocene. Nat. Rev. Earth Environ. 2020, 1, 500–515. [Google Scholar] [CrossRef]
- Young, A.M.; Higuera, P.E.; Duffy, P.A.; Hu, F.S. Climatic thresholds shape northern high-latitude fire regimes and imply vulnerability to future climate change. Ecography 2017, 40, 606–617. [Google Scholar] [CrossRef]
- Shvidenko, A.Z.; Nilsson, S. Fire and the carbon budget of Russian forests. In Fire, Climate Change, and Carbon Cycling in the Boreal Forest; Kasischke, E.S., Stocks, B.J., Eds.; Springer: New York, NY, USA, 2000; pp. 289–311. [Google Scholar]
- Valendik, E.N.; Goldammer, J.G.; Kisilyakhov, Y.K.; Ivanova, G.A.; Verkhovets, S.V.; Bryukhanov, A.V.; Kosov, I.V.; Byambasuren, O.; the FIRESCAN Science Team. Prescribed Burning in Russia and Neighboring Temperate-Boreal Eurasia; Goldammer, J.G., Ed.; Kessel Publishing House: Remagen-Oberwinter, Germany, 2013; ISBN 9783941300712. [Google Scholar]
Figure 1.
Location of the study region. Logged and burned areas in the Angara region were evaluated based on satellite data during the 2001–2020 period. Dark dots represent the location of 168 sample sites for fuel-load sampling.
Figure 1.
Location of the study region. Logged and burned areas in the Angara region were evaluated based on satellite data during the 2001–2020 period. Dark dots represent the location of 168 sample sites for fuel-load sampling.

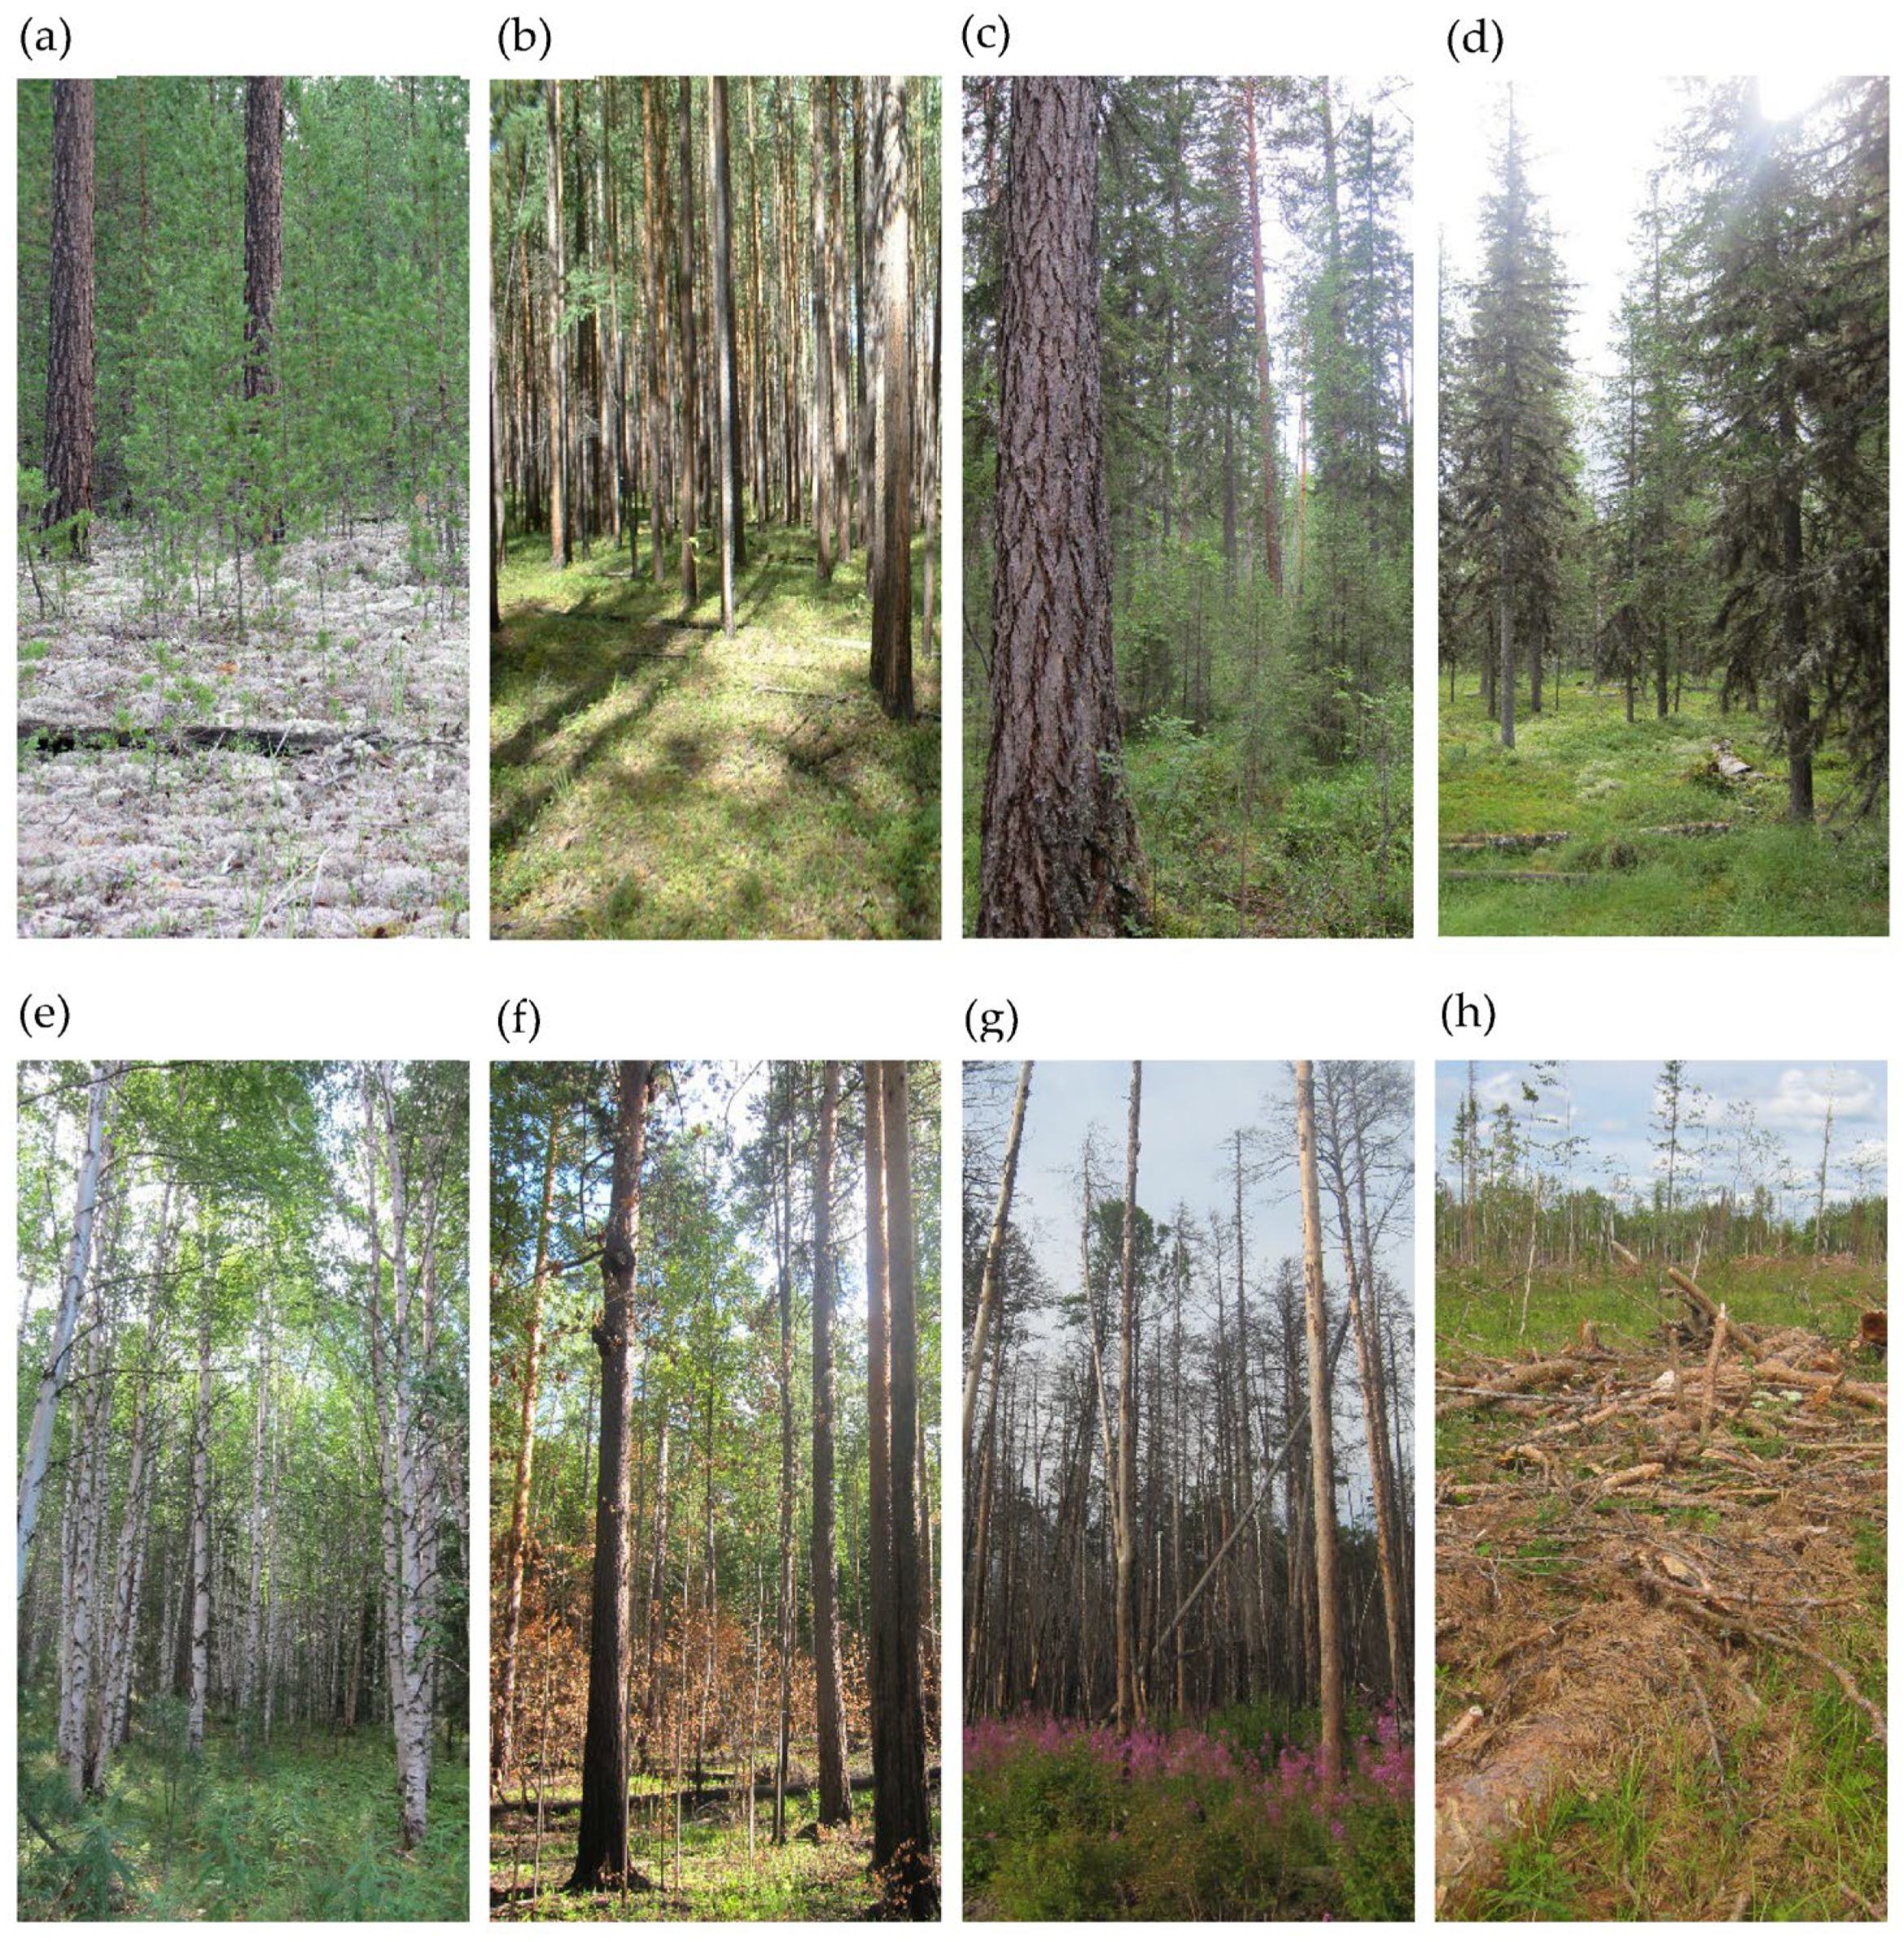
Figure 2.
Examples of the dominant forest types and disturbances in the Angara region: lichen Scots pine stand on dry soil (a); feather moss/small shrubs Scots pine stand on mesic soil (b); grass/feather moss larch stand with a dark conifer subcanopy layer on mesic soil (c); sphagnum/grass spruce stand on wet soil (d); grass birch stand on mesic soil (e); grass/litter Scots pine stand burned by low-severity fire (f); Chamaenerion Scots pine stand burned by high-severity fire (g); logged Scots pine stand (h).

Figure 3.
General flowchart of the methodology used for the development of annual fuel-load datasets.
Figure 3.
General flowchart of the methodology used for the development of annual fuel-load datasets.

Figure 4.
Surface and ground fuel loads in the Angara region in 2001 (a) and 2020 (b).

Figure 5.
Natural fire hazard in the Angara region in spring (a,b) and autumn (c,d) in 2001 (a,c) and 2020 (b,d). The 1st class corresponds to the highest fire hazard and the 5th class to the lowest.
Figure 5.
Natural fire hazard in the Angara region in spring (a,b) and autumn (c,d) in 2001 (a,c) and 2020 (b,d). The 1st class corresponds to the highest fire hazard and the 5th class to the lowest.

Figure 6.
Annual total carbon emissions from fires (a) and emissions per unit area (b) in the Angara region from 2001 to 2020.
Figure 6.
Annual total carbon emissions from fires (a) and emissions per unit area (b) in the Angara region from 2001 to 2020.

Figure 7.
Total carbon emissions from fires in the Angara region by dominant tree species and site type (forests/grasslands/clearcuts) burned over the fire season (April to October) for the 2001–2020 period. March and November are not shown on the figure due to the low contribution of emissions in these months (0.01% of the total amount).

Figure 8.
Annual carbon emissions from fires in the Angara region for the period from 2001 to 2020 by dominant tree species and site type: larch-dominated forest (a); Scots pine forests (b); spruce forest (c), fir forest (d); birch and aspen forests (e); logged sites (f); Siberian pine forest (g); grasslands and croplands (h). Significant increasing or decreasing trends of carbon emissions are added to the figures. Note that the Y-axes have different scales.


Disclaimer/Publisher’s Note: The statements, opinions and data contained in all publications are solely those of the individual author(s) and contributor(s) and not of MDPI and/or the editor(s). MDPI and/or the editor(s) disclaim responsibility for any injury to people or property resulting from any ideas, methods, instructions or products referred to in the content. |
© 2023 by the authors. Licensee MDPI, Basel, Switzerland. This article is an open access article distributed under the terms and conditions of the Creative Commons Attribution (CC BY) license (https://creativecommons.org/licenses/by/4.0/).
Share and Cite
MDPI and ACS Style
Kukavskaya, E.A.; Shvetsov, E.G.; Buryak, L.V.; Tretyakov, P.D.; Groisman, P.Y. Increasing Fuel Loads, Fire Hazard, and Carbon Emissions from Fires in Central Siberia. Fire 2023, 6, 63. https://doi.org/10.3390/fire6020063
AMA Style
Kukavskaya EA, Shvetsov EG, Buryak LV, Tretyakov PD, Groisman PY. Increasing Fuel Loads, Fire Hazard, and Carbon Emissions from Fires in Central Siberia. Fire. 2023; 6(2):63. https://doi.org/10.3390/fire6020063
Chicago/Turabian StyleKukavskaya, Elena A., Evgeny G. Shvetsov, Ludmila V. Buryak, Pavel D. Tretyakov, and Pavel Ya. Groisman. 2023. "Increasing Fuel Loads, Fire Hazard, and Carbon Emissions from Fires in Central Siberia" Fire 6, no. 2: 63. https://doi.org/10.3390/fire6020063