Measuring Initial Attack Suppression Effectiveness through Burn Probability


1
Parks Canada, Kootenay National Park Operations Centre, Radium Hot Springs, BC V0A 1M0, Canada
2
Northern Forestry Centre, Canadian Forest Service, Natural Resources Canada, Edmonton, AB T6H 3S5, Canada
3
USDA Forest Service, Pacific Northwest Research Station, Wenatchee Forestry Sciences Lab, Wenatchee, WA 98801, USA
4
Oak Ridge Institute for Science and Education (ORISE), Oak Ridge, TN 37830, USA
*
Author to whom correspondence should be addressed.
Fire 2019, 2(4), 60; https://doi.org/10.3390/fire2040060
Submission received: 3 November 2019
/
Revised: 27 November 2019
/
Accepted: 5 December 2019
/
Published: 7 December 2019
Abstract
:Most wildfires in North America are quickly extinguished during initial attack (IA), the first phase of suppression. While rates of success are high, it is not clear how much IA suppression reduces annual fire risk across landscapes. This study introduces a method of estimating IA effectiveness by pairing burn probability (BP) analysis with containment probability calculations based on initial fire intensity, spread rate, and crew response time. The method was demonstrated on a study area in Kootenay National Park, Canada by comparing burn probabilities with and without modeled IA suppression. Results produced landscape-level analyses of three variables: burn probability, suppression effectiveness, and conditional escape probability. Overall, IA reduced mean study area BP by 78% as compared to a no-suppression scenario, but the primary finding was marked spatial heterogeneity. IA was most effective in recently burned areas (86% reduction), whereas mature, contiguous fuels moderated its influence (50%). Suppression was least effective in the designated wildfire exclusion zone, suggesting supplementary management approaches may be appropriate. While the framework includes assumptions about IA containment, results offer new insight into emergent risk patterns and how management strategies alter them. Managers can adopt these methods to anticipate, quantify, and compare fine-scale policy outcomes.

1. Introduction
North American land management agencies invest more into wildfire suppression than ever before, yet damages are increasing [1]. The economic burden of wildfire is substantial, up to $347 billion in the United States [2]. Over the past 30 years, area burned has doubled while suppression spending tripled [3]. Suppression costs are not only monetary: Suppression has altered the distribution of vegetation and wildlife, exacerbated fire hazards [4,5], and killed dozens of wildfire fighters in Canada [6] and the United States [7]. However, it is not clear how much suppression activities reduce wildfire likelihood to communities or other highly-valued resources and assets.
The vast majority of wildfires are actioned by suppression crews—approximately 90% in Canada [8] and 99% in the United States [9,10]. The remainder generally occur in remote locations such as the Northern Boreal regions and are monitored to ensure they do not threaten resources and assets. The first phase of suppression is initial attack (IA)—aggressive containment operations within hours of discovery, while fires are small and require few resources [8,11]. Most wildfires in North America are extinguished during IA. Reported success rates vary between 83 and 99%, in large part due to differing agency definitions [12,13].
Wildfire risk is unevenly distributed across landscapes. This risk is a function of fire occurrence likelihood, intensity, and the susceptibility of valued resources and assets [14]. Fire occurrence likelihood, also known as burn probability, is the chance of a particular point on the landscape being impacted by fire over a given year, and varies according to ignition and spread patterns [15]. IA suppression reduces annual fire occurrence likelihood by limiting the spread of new ignitions.
Fires can be divided into three categories: (A) those that would remain small regardless of suppression, (B) those that can be prevented from growing large by IA, and (C) those that will grow large regardless of IA [16]. In full suppression jurisdictions, only category C fires survive to spread across landscapes. This category contains the fewest fires, but accounts for nearly all area burned and suppression costs [5,17]. Escaped fires typically overwhelm initial attack efforts with rapid growth and high intensity [18].
It is clear that IA suppression has substantial impacts on fire occurrence likelihood, but not how to measure it. In part, this is because conventional IA success rates group category A and B fires together. However, managers have long recognized that suppression is less successful where topography, fuels, and weather conditions are conducive to rapid fire growth. To the authors’ knowledge, the landscape-level risk implications of this variability have not been previously evaluated. This investigation was limited to the short-term effects of IA suppression as measured by annual fire occurrence likelihood, as this appears to be managers’ primary motivation [19]. Landscape impacts of fire suppression are estimated using a burn probability analysis, comparing fire occurrence likelihood with and without simulated initial attack suppression with a published small-fire containment model.
This approach improves on standard burn probability analyses in two ways. First, current models consider only large fires and implicitly assume future management policy and containment patterns will remain similar to the historical records used to parameterize them [15]. However, the location and frequency of present-day large fires has been altered by changes in the fire environment (i.e., land use, vegetative succession, and climate) and management response (i.e., detection networks, suppression tactics, and response policy) [20]. Modeling the process of small fire containment can help mitigate these concerns.
Secondly, existing analyses do little to inform decision-makers during fire response. While status quo suppression strategies are not supported by the scientific consensus [21,22], managers have no method to quantify or compare consequences of alternative response policies. In this absence, research shows that managers defer short-term risk through aggressive IA suppression at the cost of increasing subsequent fire hazard [23,24]. This study introduces suppression response as an independent variable, allowing assessments of hypothetical fire response policy changes.
This paper describes a simulation technique to estimate landscape-level risk implications of IA suppression and demonstrates it on a study area in Kootenay National Park, British Columbia, Canada. The study paired an existing burn probability tool, Burn-P3, with a small-fire containment model using published algorithms [18]. A study area in the Canadian Rockies is introduced and spatial burn probability distributions were compared with and without simulated IA suppression. Results provide insight into patterns of small fire containment and its consequences of interest to fire managers and researchers.
2. Materials and Methods
2.1. Study Area
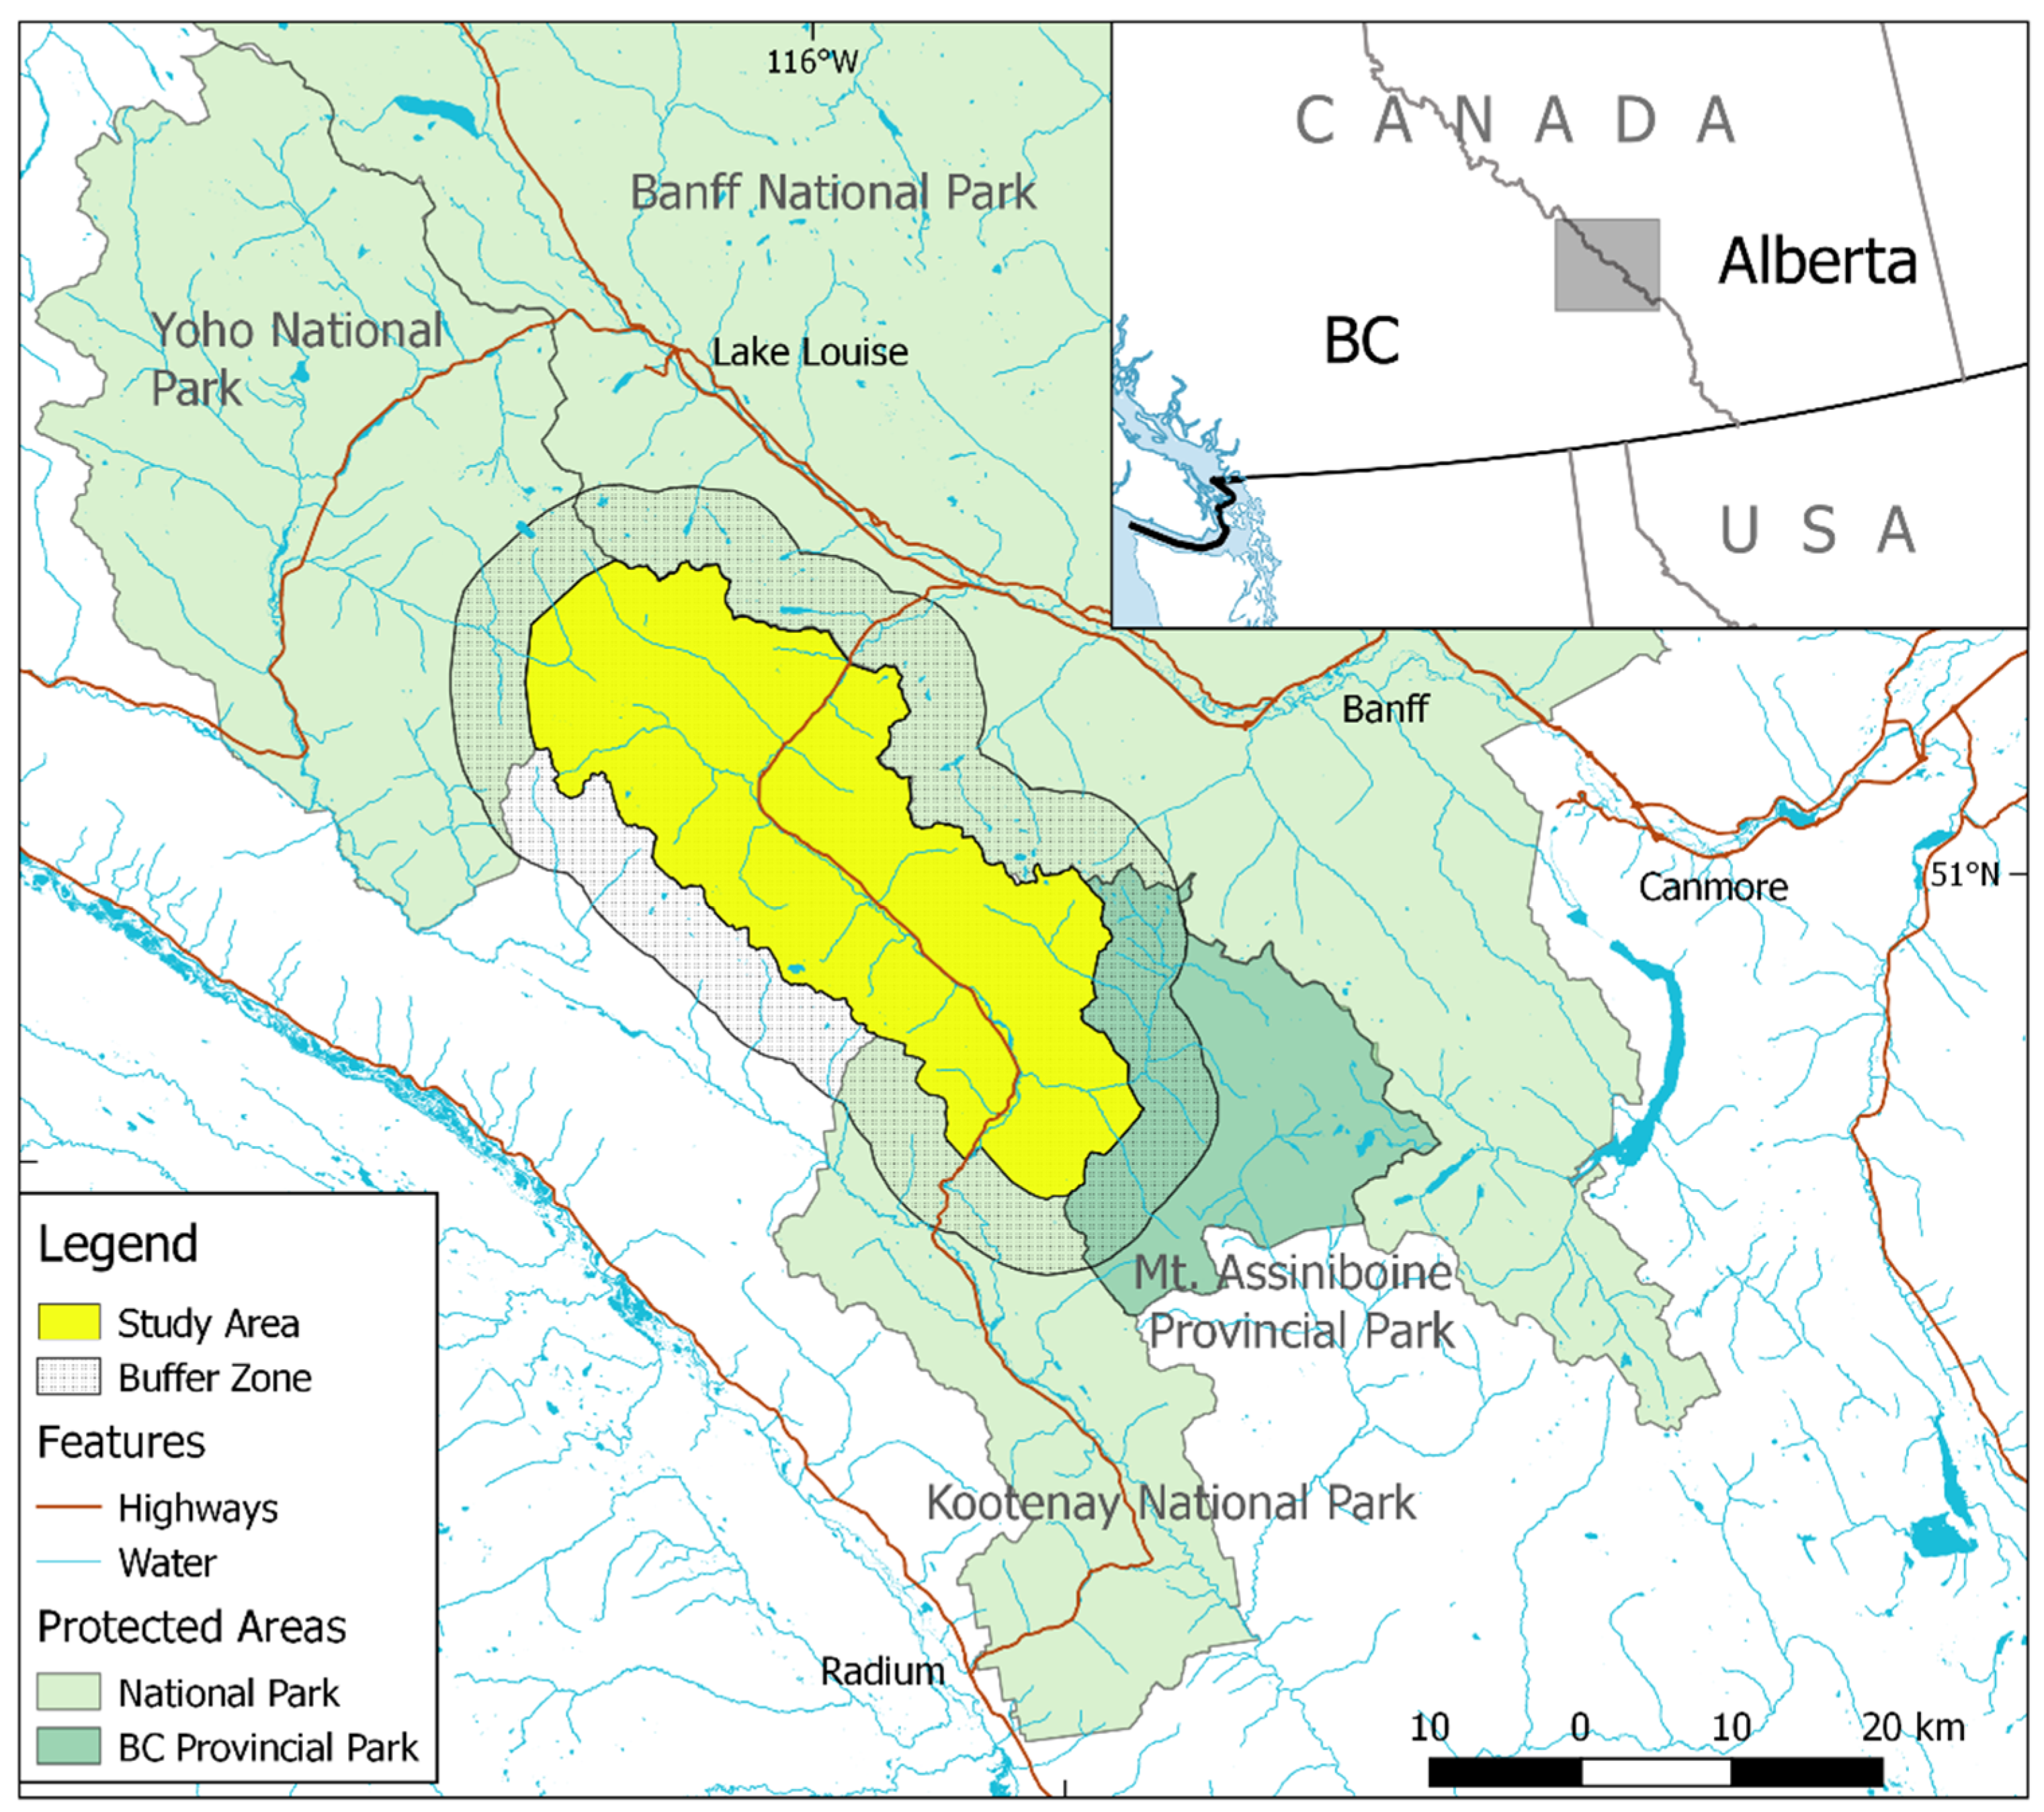
The study area is the Vermilion Valley of Kootenay National Park, part of a UNESCO World Heritage Site in the Canadian Rocky Mountains (Figure 1). The valley is a subalpine region of 75,192 hectares on the west side of the continental divide, between 1200 and 3400 m above sea level. High rocky peaks and complex terrain create a natural confined fire regime. Forests consist primarily of Engelmann spruce (Picea engelmannii), subalpine fir (Abies lasiocarpa), white spruce (Picea glauca), and lodgepole pine (Pinus contorta), transitioning to alpine meadows at upper elevations [25].
The majority of area burned is a result of large, infrequent, stand-replacing lightning fires that spread under extreme weather conditions [26]. Small, lower intensity surface fires are more frequent but do not consume large areas [25]. Three recent large fires typify the fire regime: Verdant Cr. (July 2017, 18,017 ha), Wardle (July 2018, 3800 ha), and Whitetail Cr. (July 2018, 1335 ha). In each case, lightning ignitions quickly overwhelmed IA crews and grew to over 100 ha on the day of discovery. In each, fire spread was substantially limited by landscape-level fuel breaks: rocky peaks, braided rivers, and avalanche paths.
The central challenge of fire management in Parks Canada is balancing the ecological integrity of fire-maintained ecosystems with the safety of people, infrastructure, and other values [27]. Landscapes are divided into management zones according to fire management strategy (Figure 2). Intensive zones are subject to suppression at all times, intermediate zones limit wildfire spread to defined perimeters, and extensive zones are managed with minimal intervention [28].
2.2. Modelling Approach
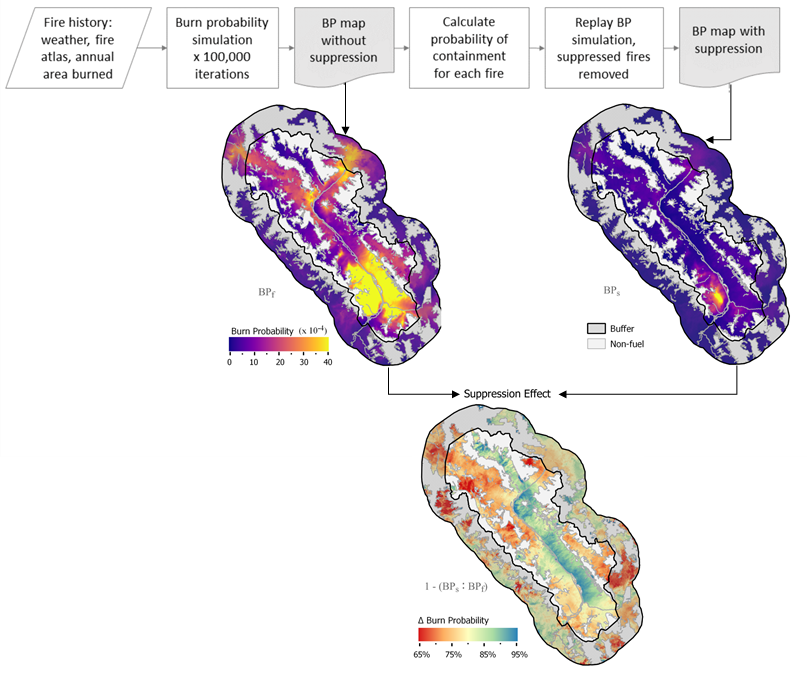
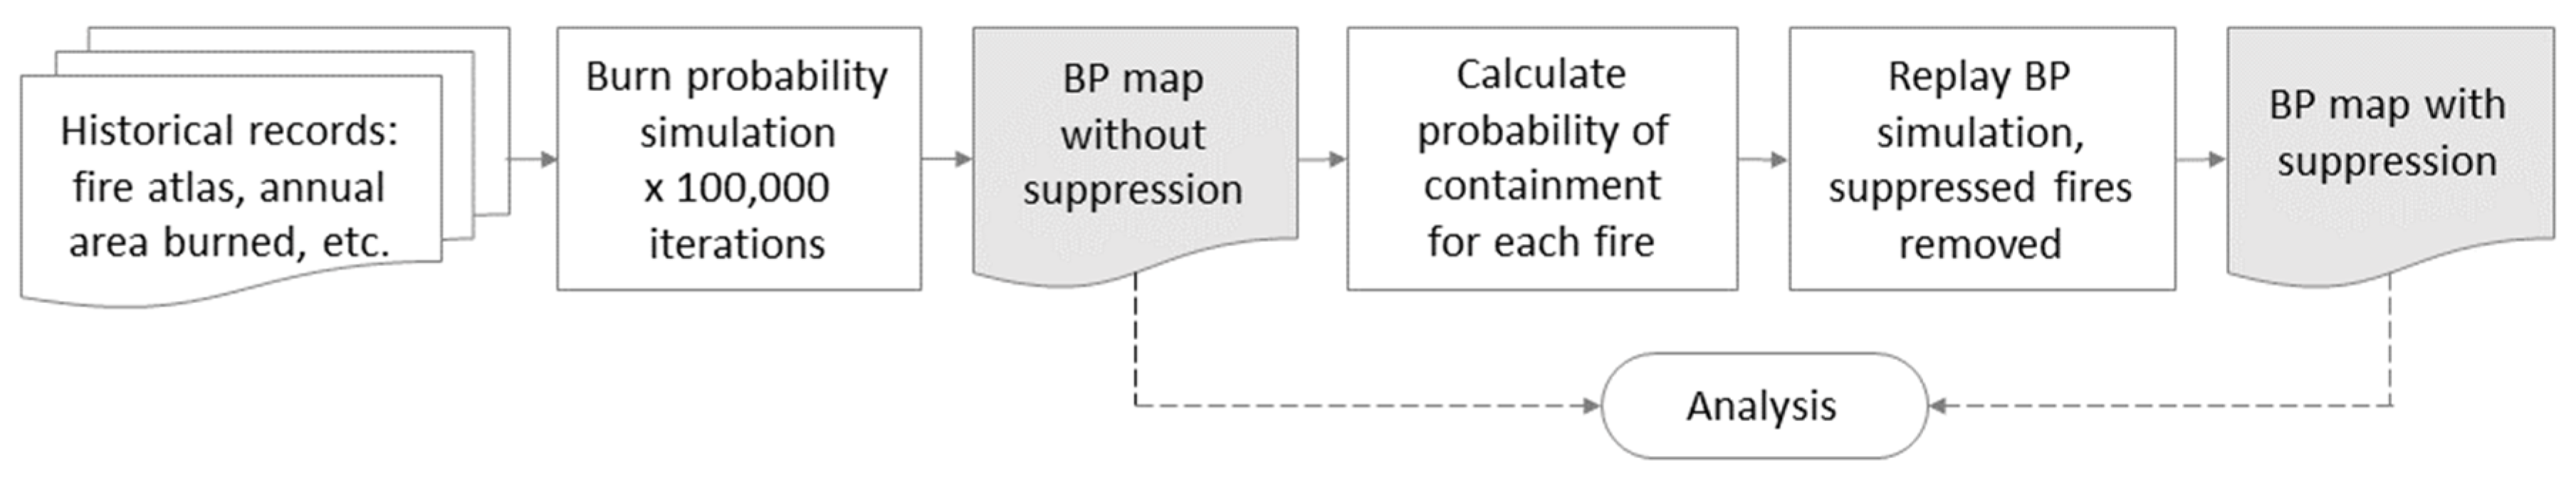
This study introduces a method for quantifying the risk implications of IA suppression using burn probability (BP). BP results are compared with and without the modeled effect of initial attack on fire growth. BP was estimated by combining stochastic ignitions and weather, a deterministic fire growth model, and a probability of containment algorithm based on initial fire behavior. Historical fire records were used to parameterize two novel model runs: one characterizing fire initiation and spread absent suppression, and a second adding simulated initial attack (Figure 3). Outputs were analyzed for spatial variation in burn probability reductions and probability of containment.
Burn probability models evaluate the probability that a fire will impact a point on the landscape over a given period of time, usually one year. Recent computational advances allow spatial BP models to analyze emergent patterns by simulating spatiotemporal interactions between ignitions, fuel, topography, weather, and fire behavior a large number of times [29]. Modified BP model inputs are used to evaluate proposed fuel modification projects [30], predict the impact of climate change [31], and evaluate large-fire suppression strategies [32].
Burn probability calculations were performed with the Canadian Burn-P3 (P3 = probability, prediction, and planning) model [33], conceptually similar to FSim (large-fire simulation system) in the United States [34] and PHOENIX in Australia [35]. Fire behavior simulation is performed by the Prometheus fire growth engine [36], based on the Fire Behavior Prediction (FBP) system developed by the Canadian Forest Service [37]. Burn-P3 repeatedly generates a single stochastic fire season, known as an iteration. This study simulated the stochastic interaction of fire behavior and suppression policy across 100,000 iterations. The number of days of active spread per fire was driven stochastically based on regional fire weather records [15]: 85% of fires have only a single spread day, and remaining fires with two (5%), 10 (5%), or 11 (5%) spread-event days. Each fire spread day is assumed to contain two hours of peak burning (crown fire) spread, if fuels allow for crown fire.
Initial attack is “the action taken to halt the spread or potential spread of a fire by the first fire fighting force to arrive at the fire” [38]. Canadian agencies define success as containment below 3 to 5 ha, substantially below the US threshold of 120 ha [13]. This study uses 5 ha as the criterion of IA success. During this early phase of suppression, usually the first 24 hours, outcomes tend to be binary: crews quickly contain fire spread or growth overwhelms them and continues unimpeded until additional resources can be mobilized.
The factors determining IA success are simpler than subsequent phases of suppression. Containment is highly correlated with fire size and intensity at the time of IA commencement [12,18]. By contrast, escaped fires span heterogeneous topography, fuels, weather, and operational tactics, and suppression occurs simultaneously in several locations over extended periods [13]. Large fire suppression is not modelled directly in Burn-P3.
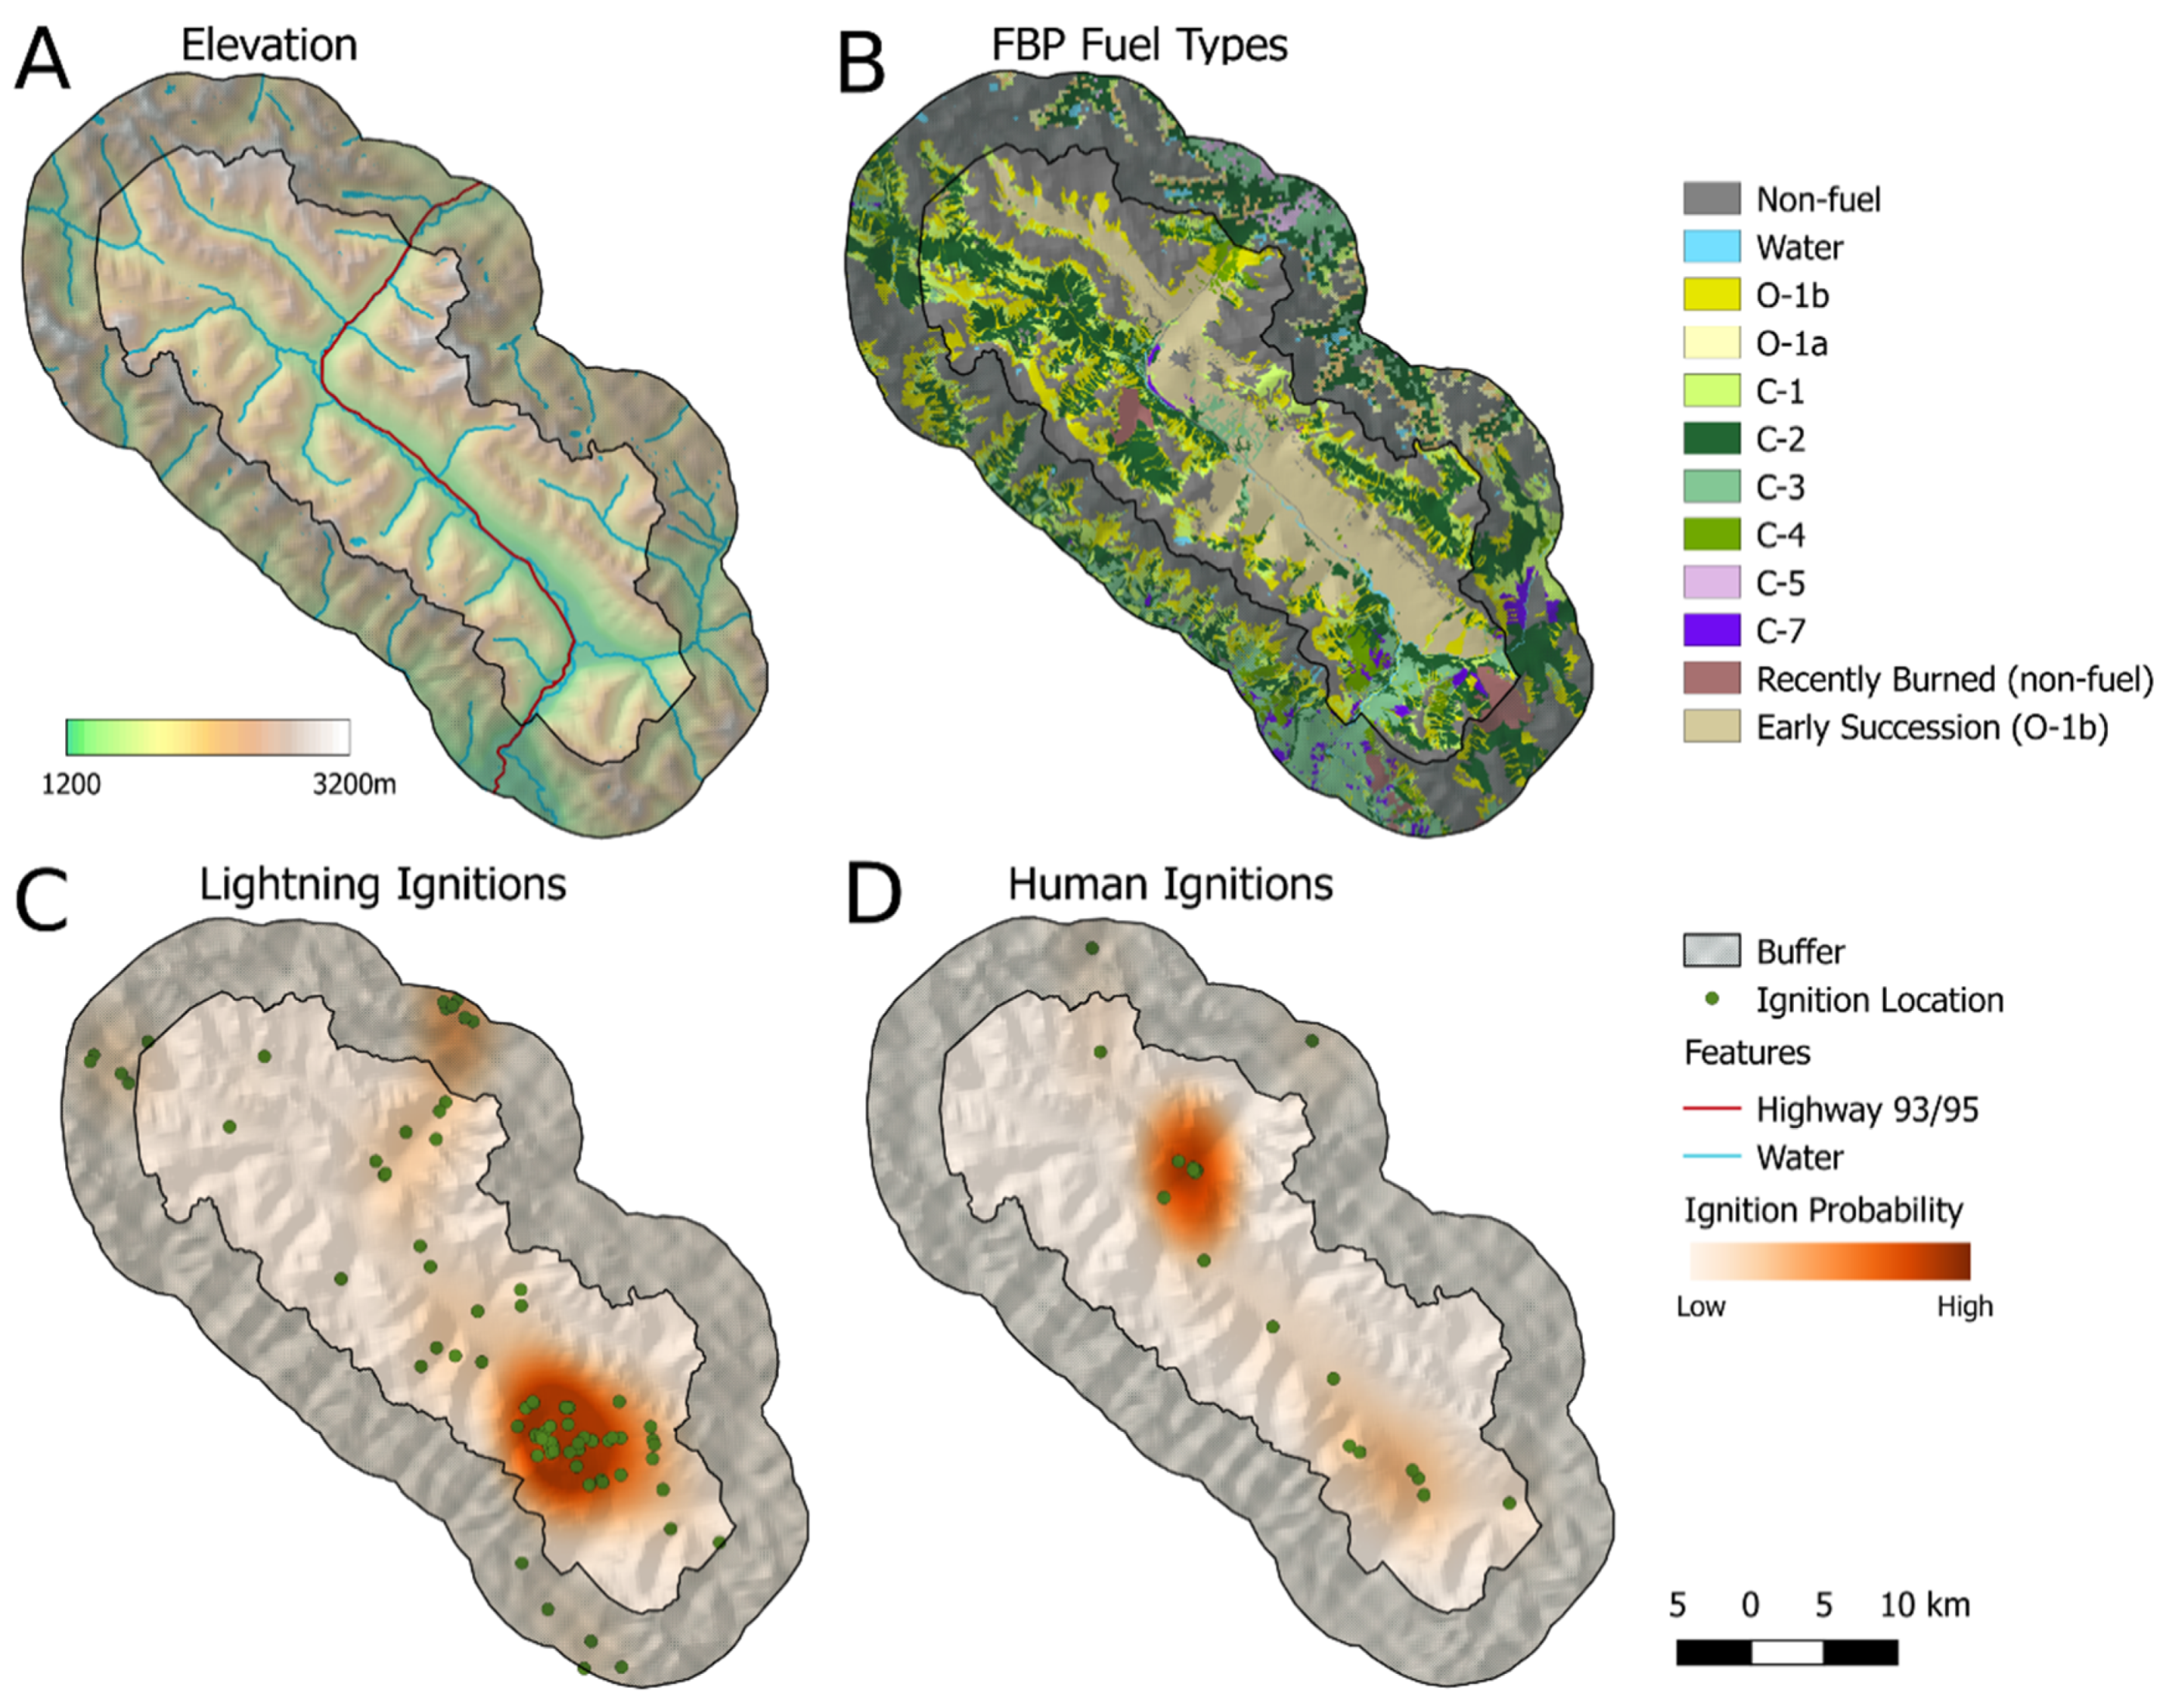
Burn-P3 relies on historical records to select the number of ignitions per iteration, cause, location, season, and fire weather (Figure 4). Fuels and other rasterized inputs were based on datasets provided by Parks Canada and the Canadian Forest Service and gridded at a 30 m resolution. The study fuel grid includes 12 of the 16 fuel types described in the Canadian Fire Behavior Prediction system [37]. Burn-P3 does not directly model spot fires, but this fine-scale fuel grid allows natural barriers such as cliff bands, rivers, and rock fields to hinder fire spread without preventing it. Landscape-level fuel breaks, such as the lower Vermilion River occasionally block spread completely, consistent with fire perimeters observed in 2017 and 2018. A 5 km buffer zone was added to permit fires to transition in and out of the study area.
Spatiotemporal ignition patterns were based on observed fire records from 1925 to 2015. Ignition patterns show pronounced clustering. As expected, human-caused ignitions follow linear features like roads and campgrounds, while lightning fires are guided by topography and weather patterns. While past ignition locations represent a small sample of potential future sites, spatial clustering plays a significant role in the observed fire regime. Standard kernel density estimation methods were applied to create a spatial probability surface that captures clustering effects and imposed minimum ignition probabilities to reflect the inherent uncertainty.
2.2.1. Scenario One: No Suppression
The first scenario approximated a free-burning fire regime. The Vermilion Valley has a fire atlas covering 90 years, roughly the period of organized suppression, and a dendrochronological study covering some 500 years. These datasets provided estimations of the historical range of variation of fire size and frequency used to calibrate the model [4].
Large fire simulation is usually achieved by parameterizing the model with selective historical records. Historical fires are reduced to those above a minimum size threshold and weather inputs to spread-conducive days. During simulation, Burn-P3 discards fires that do not to reach the specified minimum size. Including only spread-conducive weather is intended to correct overprediction during extended analysis periods [39].
This study deviated from established procedure and simulated a full range of fire sizes and weather. Weather records included days not conducive to significant fire growth and minimum fire size set to the smallest possible value: 0.09 ha, or one 30 m pixel. Including poor and moderate fire weather records produced a range of small- and medium-sized fires.
The primary challenge is untangling the influence of suppression from the historical fire atlas. Topography, fuel, weather, and ignition inputs allow the model to simulate how fires start and spread, but it is not known how large past fires would have grown in the absence of suppression. This presents an obstacle, as the main form of calibration in BP models is matching simulated fire size distributions to the fire atlas [40], usually achieved in Burn-P3 by manipulating fire spread duration [41]. Considerations of local suppression and fire history can provide some guidance.
Parks Canada fire history studies [25,42] reviewed fire reports between 1926 and 1988, concluding that large fires exclusively occurred under extreme fire weather conditions. Suppression acts primarily during moderate conditions, depriving new ignitions the opportunity to survive until fire weather improves. Consequently, suppression has had the greatest impact on small fires in the historical record and relatively little influence on large fires. This observation is consistent with Burn-P3′s working assumption that once a fire escapes initial attack, suppression activities do not significantly reduce spread [33].
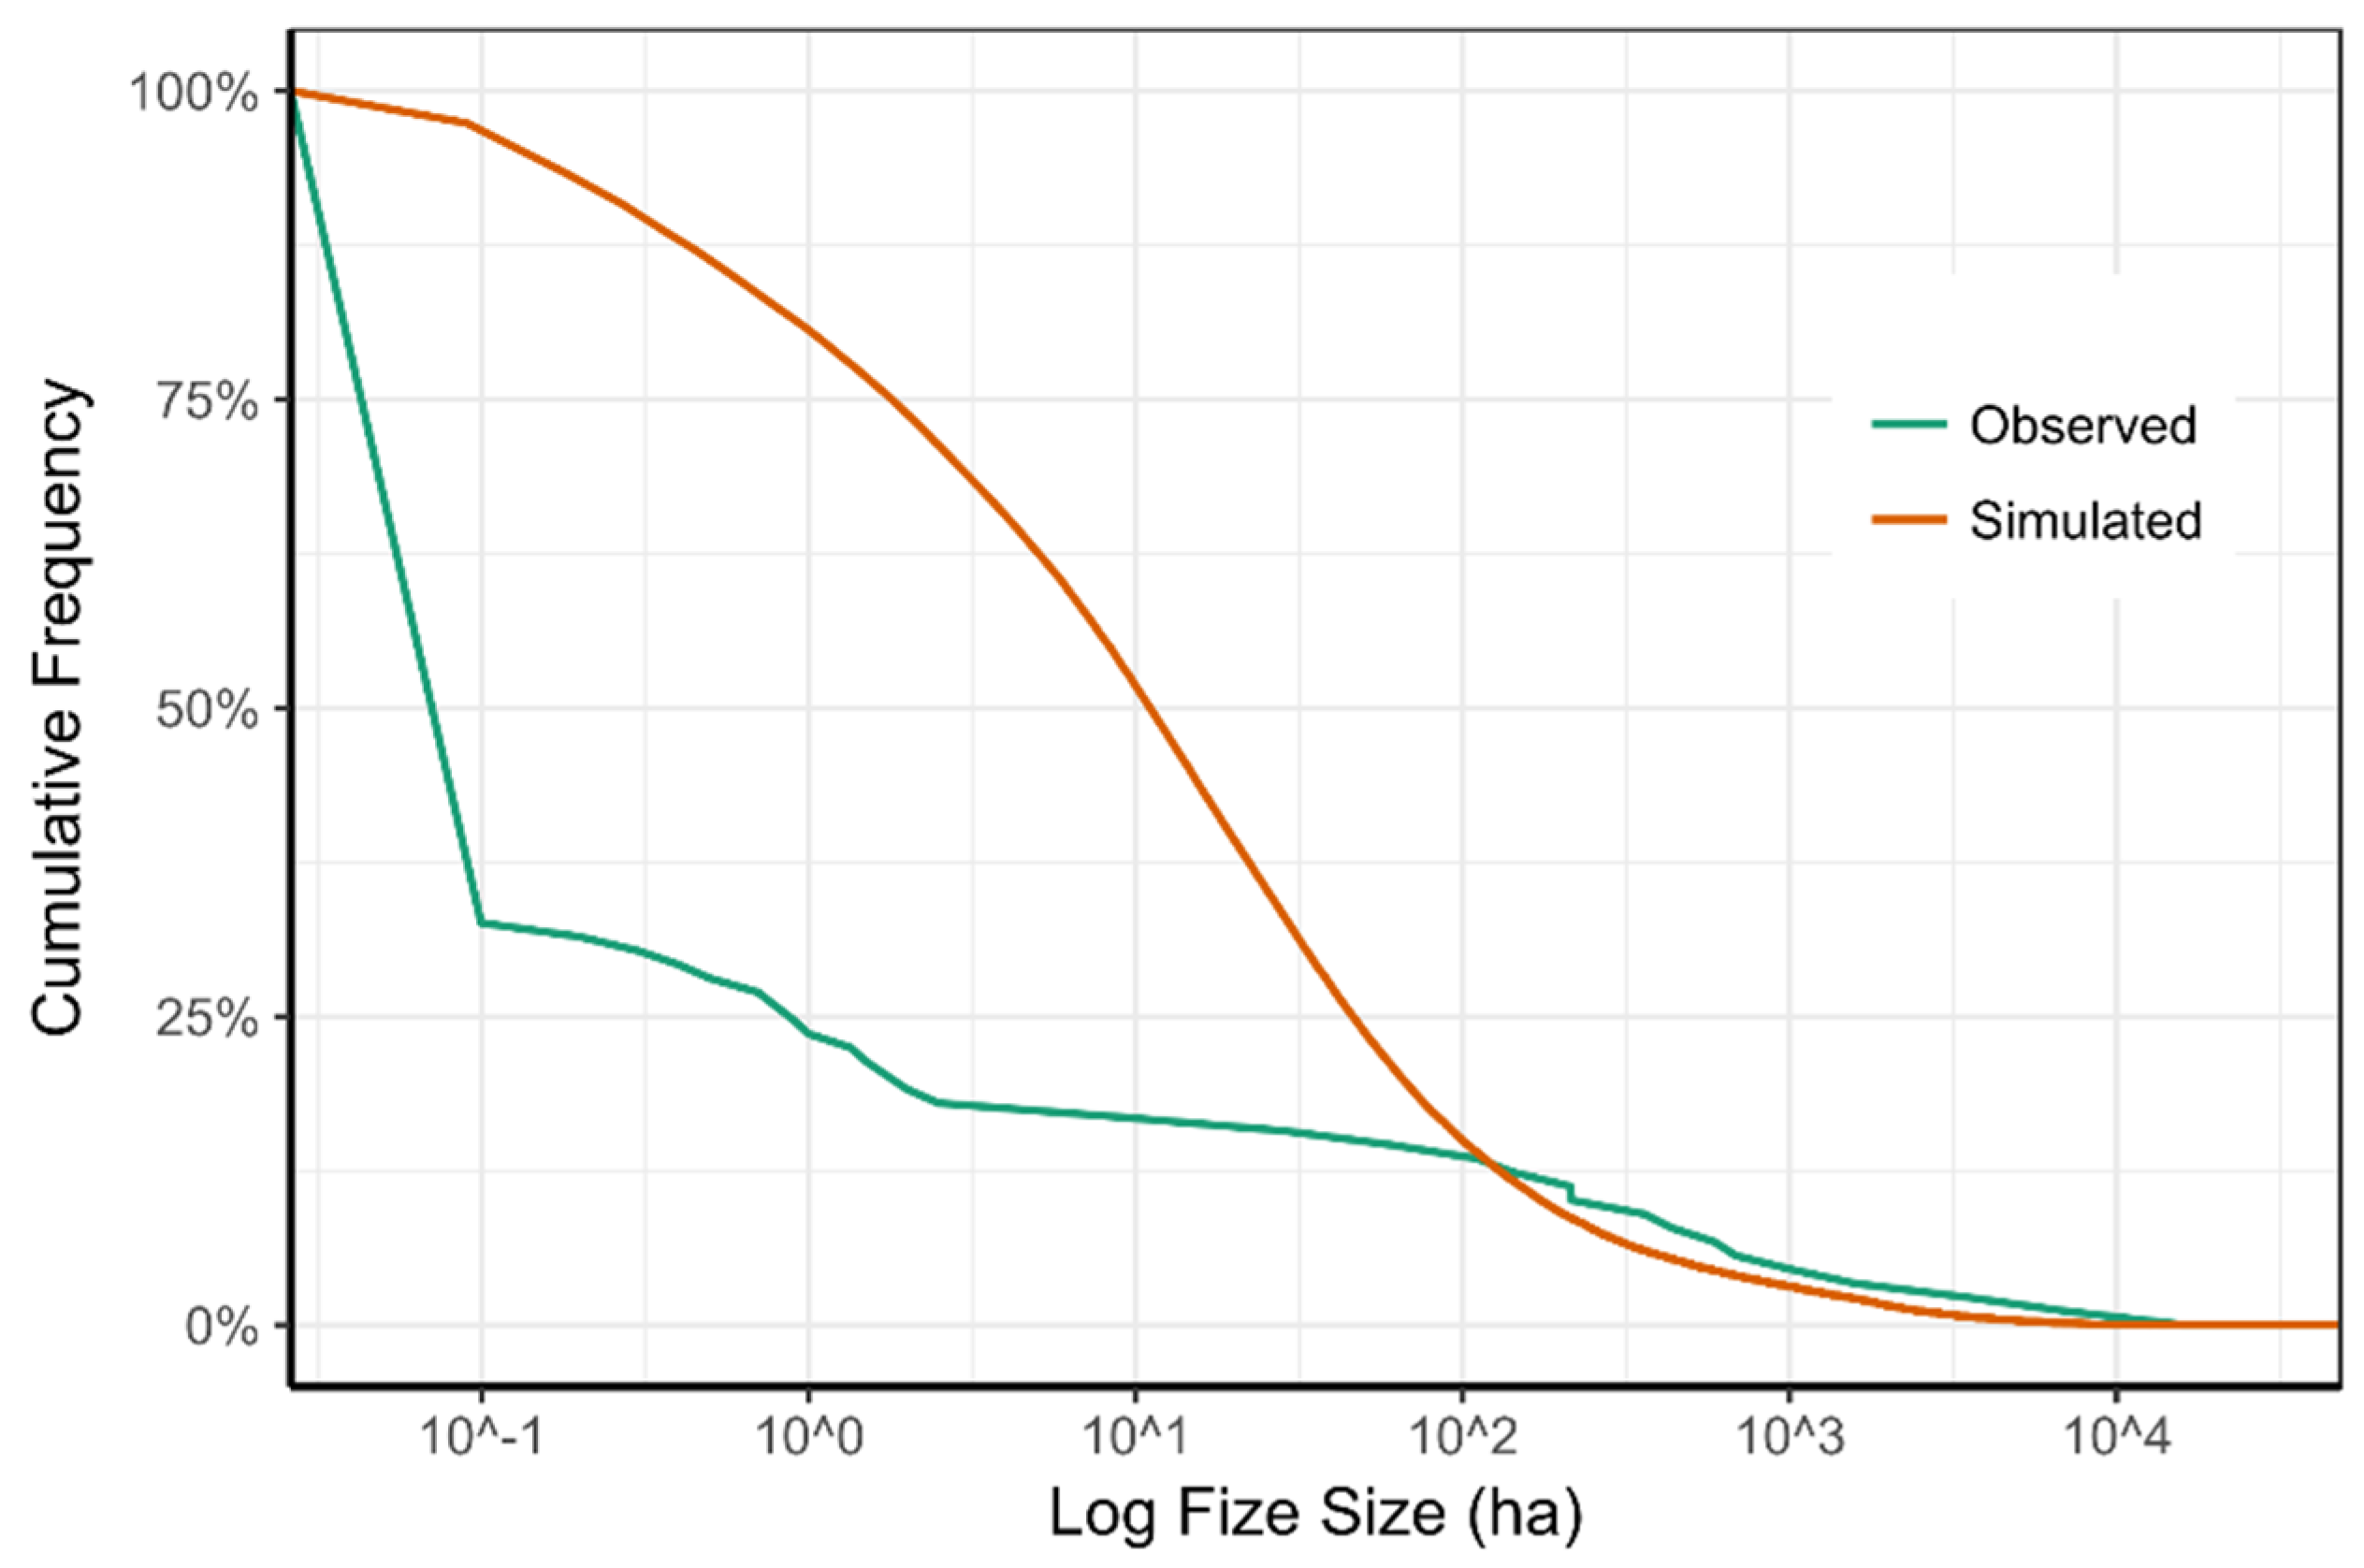
Were all else equal, simulated annual area burned under a no-suppression scenario should approach historical pre-suppression levels. This is a reasonable assumption where ignition regimes are lightning-dominated and land use change is limited. A time-since-fire study determined that average annual area burned in the study area over 220 years was 144 ha [25]. Accordingly, the following assumptions guided ‘no suppression’ calibration: (1) ignition frequency, spatial distribution, and fire weather were similar to historical records, (2) large historical fires (> 1000 ha) were unlikely to have been substantially altered by suppression, (3) most small fires (< 10 ha) burned under moderate fire conditions and would remain small, and (4) area burned across iterations would approximate pre-suppression levels. Spread duration was adjusted over a dozen model runs and the pattern that best fit these guidelines was selected (Figure 5).
2.2.2. Scenario Two: Initial Attack
In the second scenario, suppression was simulated by removing fires expected to be contained during IA operations. Model validity depends on reproducing the amount, characteristics, and variability of fires that escape IA. Each fire was assigned a probability of containment (POC) based on fire behavior during initial attack, and fires that met containment criteria were removed. Fires contained during IA contribute very little area burned [43]. Burn-P3 was rerun using the ‘replay list’ function, which replicates burning conditions from previous runs.
The likelihood of containing a fire during IA can be predicted from the size and intensity at IA commencement [18]. Fire intensity is the energy released by wildfire and is measured in kilowatts per meter. Fires escape initial attack by preventing control line establishment or breaching control lines; size and intensity are decisive factors in both means. Fires that have grown large and intense at the time of IA are rarely contained and small, smoldering fires rarely escape [18,42].
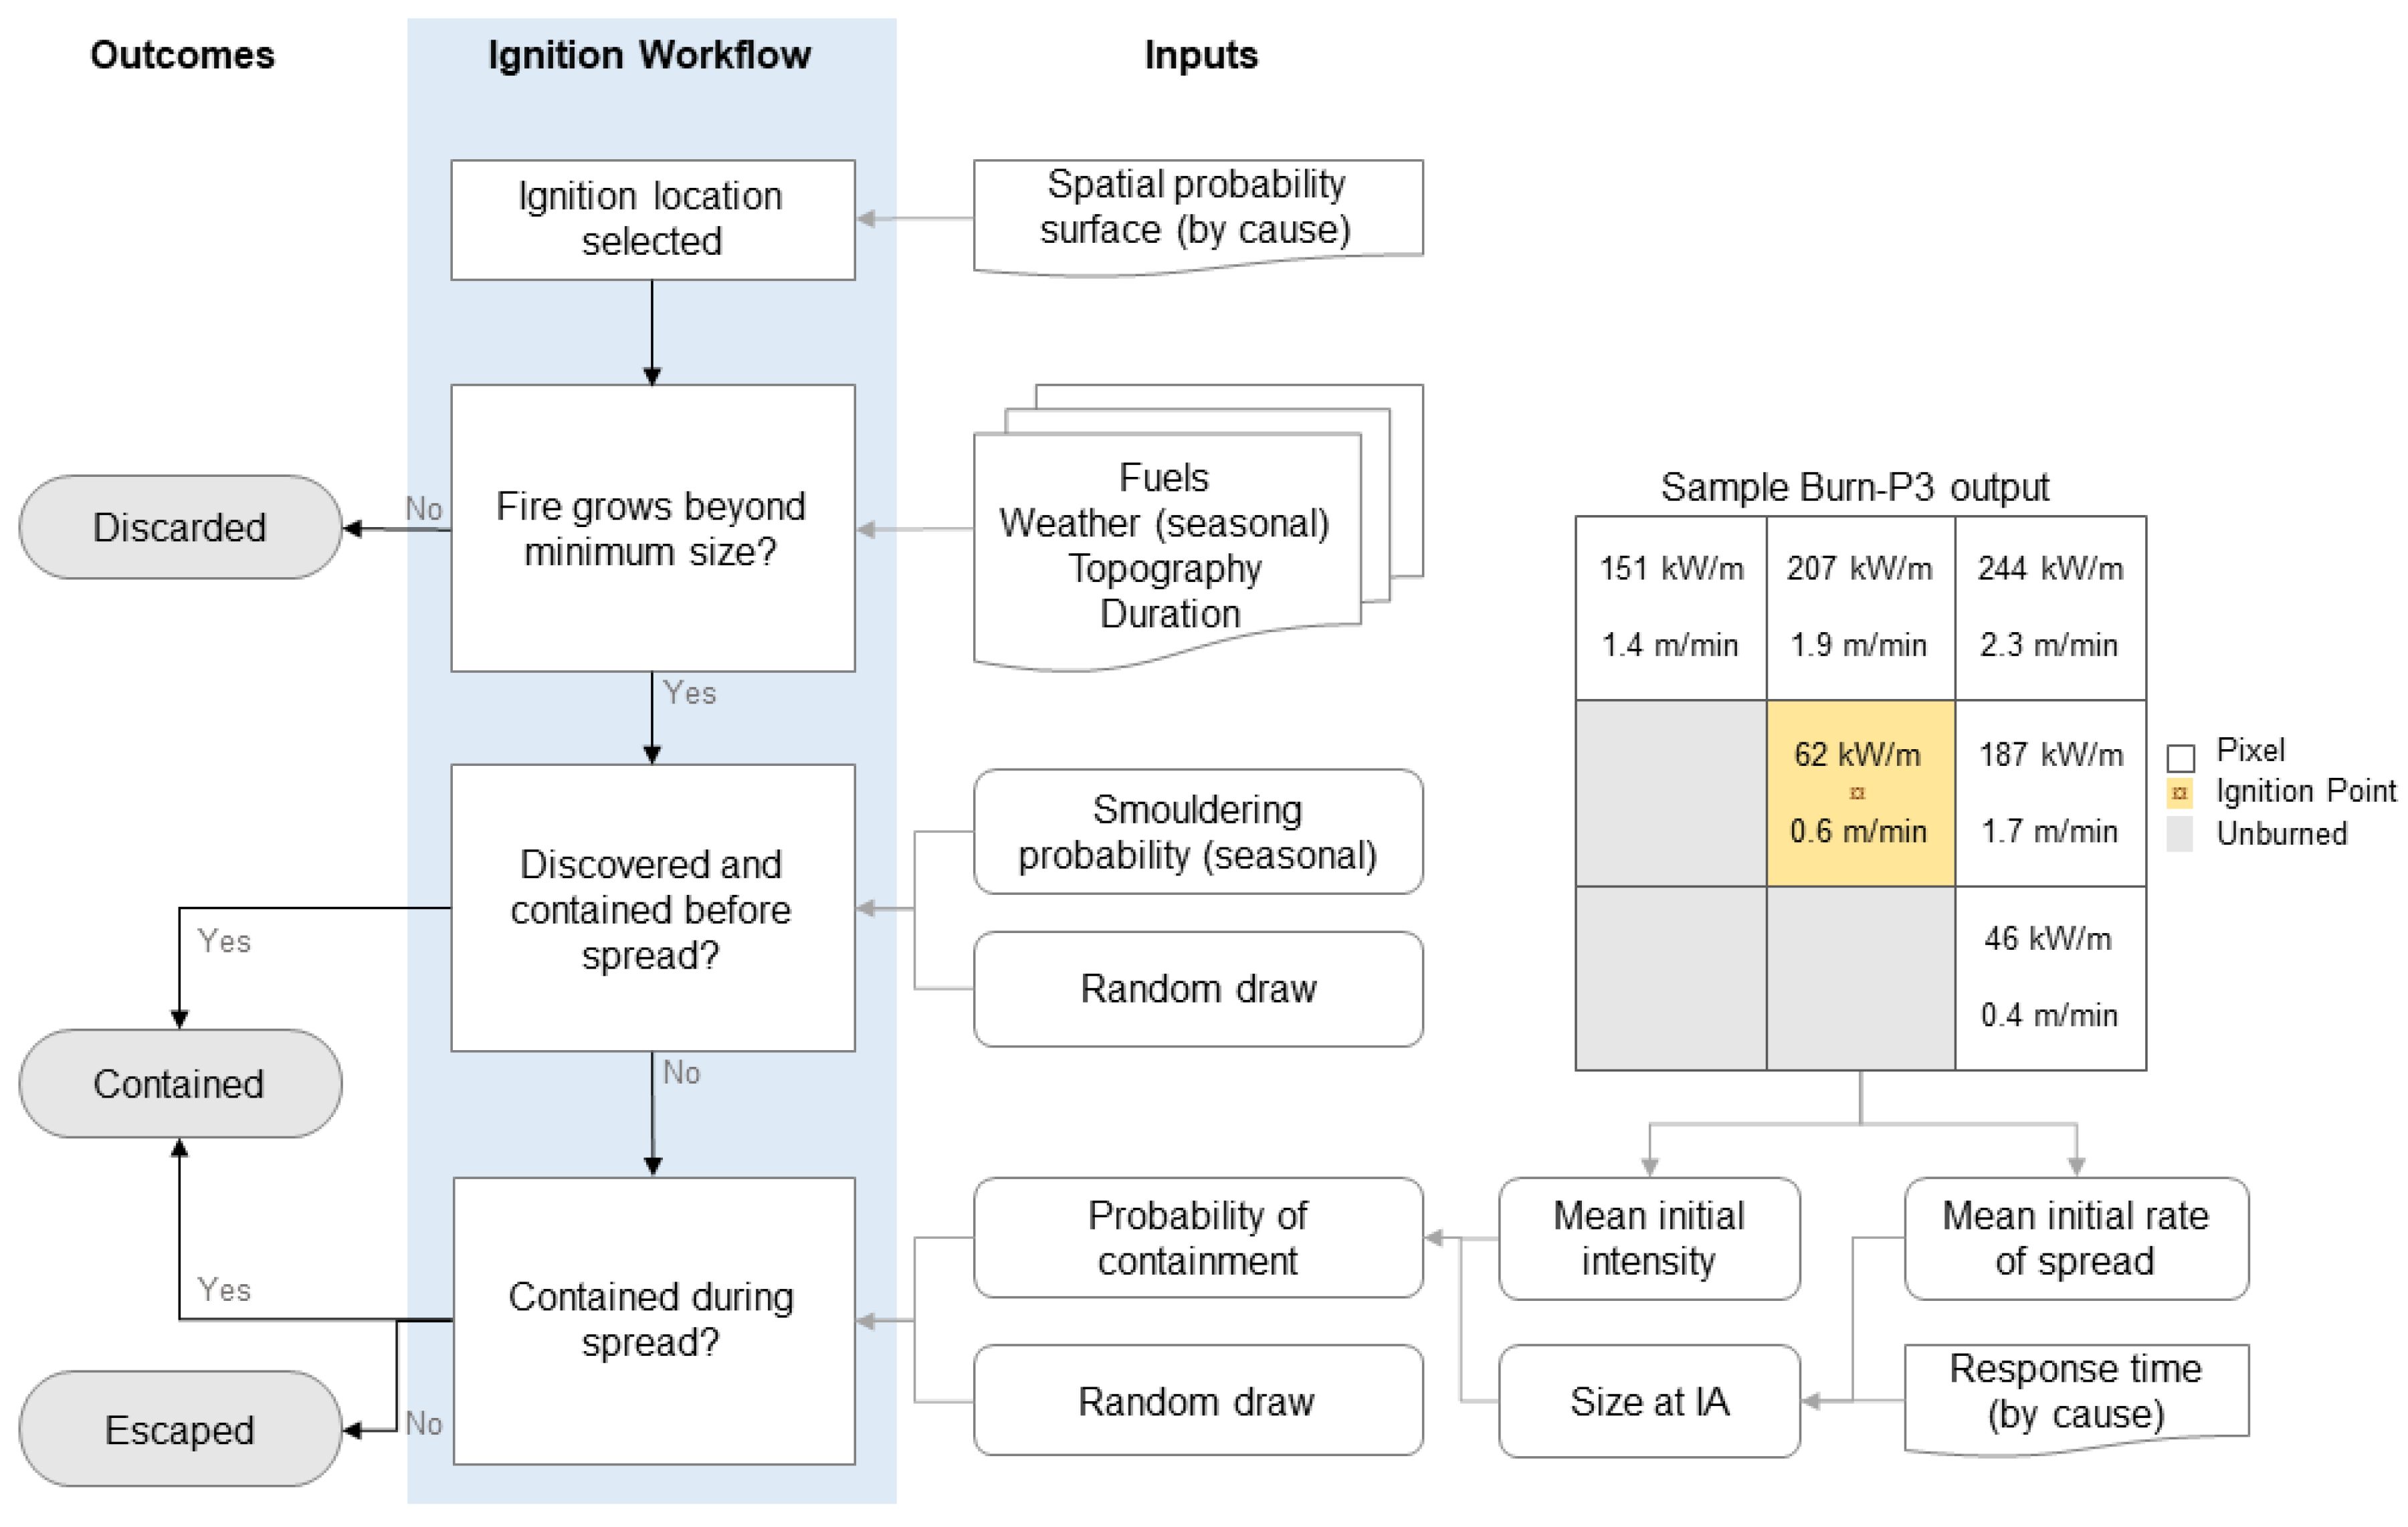
Initial attack containment is typically modelled as a probabilistic process [44]. This study employed an algorithm derived by [18] for predicting containment probability based on expert opinion interviews, assuming a medium-sized crew with helicopter support in Canadian boreal forests (Equation (1)). Following POC calculations, stochastic containment was simulated through random draws, enabling a representative portion of high-POC fires to escape and low-POC fires to be contained (Figure 6).
where POC = predicted probability of containment, size = size at initial attack (ha), and intensity = head fire intensity at initial attack (kW m−1).
Size and intensity at IA were estimated from BP model outputs. Burn-P3 provides fire intensity and spread rate outputs for each pixel of each fire. Initial intensity and spread rate were calculated by averaging values for pixels contiguous with the ignition point, accounting for fuel and topography variation in the 90 × 90 m (0.81 ha) area surrounding the ignition point. Any fire that failed to grow beyond 5 ha was considered contained.
Size at initial attack is the result of fire spread rate, discovery lag, and response time. Due to the study area’s modest size and rugged terrain, response times are driven more by complex networks of travel corridors and barriers than distance alone. Two initial attack fire crews are based 6 kilometers west of the Vermilion Valley. Vehicle travel times vary little across the study area, from 7 and 35 min by road or 3 to 17 min by helicopter. Travel networks are formed by slope, vegetation, waterways, and surface geology, and response times influenced by time of day, specialized access techniques (such as helicopter hover-exit and human external cargo), and concurrent ignitions. Attempts to predict response times with firefighter accessibility indices or travel friction analyses are in early stages of development and have not been validated [45,46]. However, human-caused fires cluster near roads and trails and average significantly lower response times than lightning-caused ignitions [12]. Parks Canada does not publish IA success rates but neighboring Alberta reports 83% success at containing boreal fires below 3 ha [12] and British Columbia reports 92% success with a 4-ha threshold [47]. Containment rates in the study area are expected to fall between these two.
Simulated response time changes predicted IA containment rates by changing fire size at the time of IA (Table 1). Calibrating results to expected containment rates, calculations used a fixed response time of 60 min for lightning fire and 30 min for human-caused fires. The containment algorithm predicted total study area containment rates of 87%, with most ignitions (59%) generating a POC greater than 90% (Figure 7). Adjustments were made for smoldering ignitions and the co-occurrence of lightning and precipitation.
2.2.3. Data Analysis
Results yielded three forms of spatial variability: burn probability, suppression effectiveness, and ignition containment. BP values were calculated by dividing the number of times a pixel burns by the number of iterations. ‘Suppression effect’ was coined to indicate the strength of IA suppression impacts, and is the BP ratio between scenarios:
where BPf is the free-burning BP, BPs is the suppressed BP, and i is each fuel pixel. The suppression effect metric indicates the relative contribution of likely-to-escape fires to BP, and could be considered suppression susceptibility.
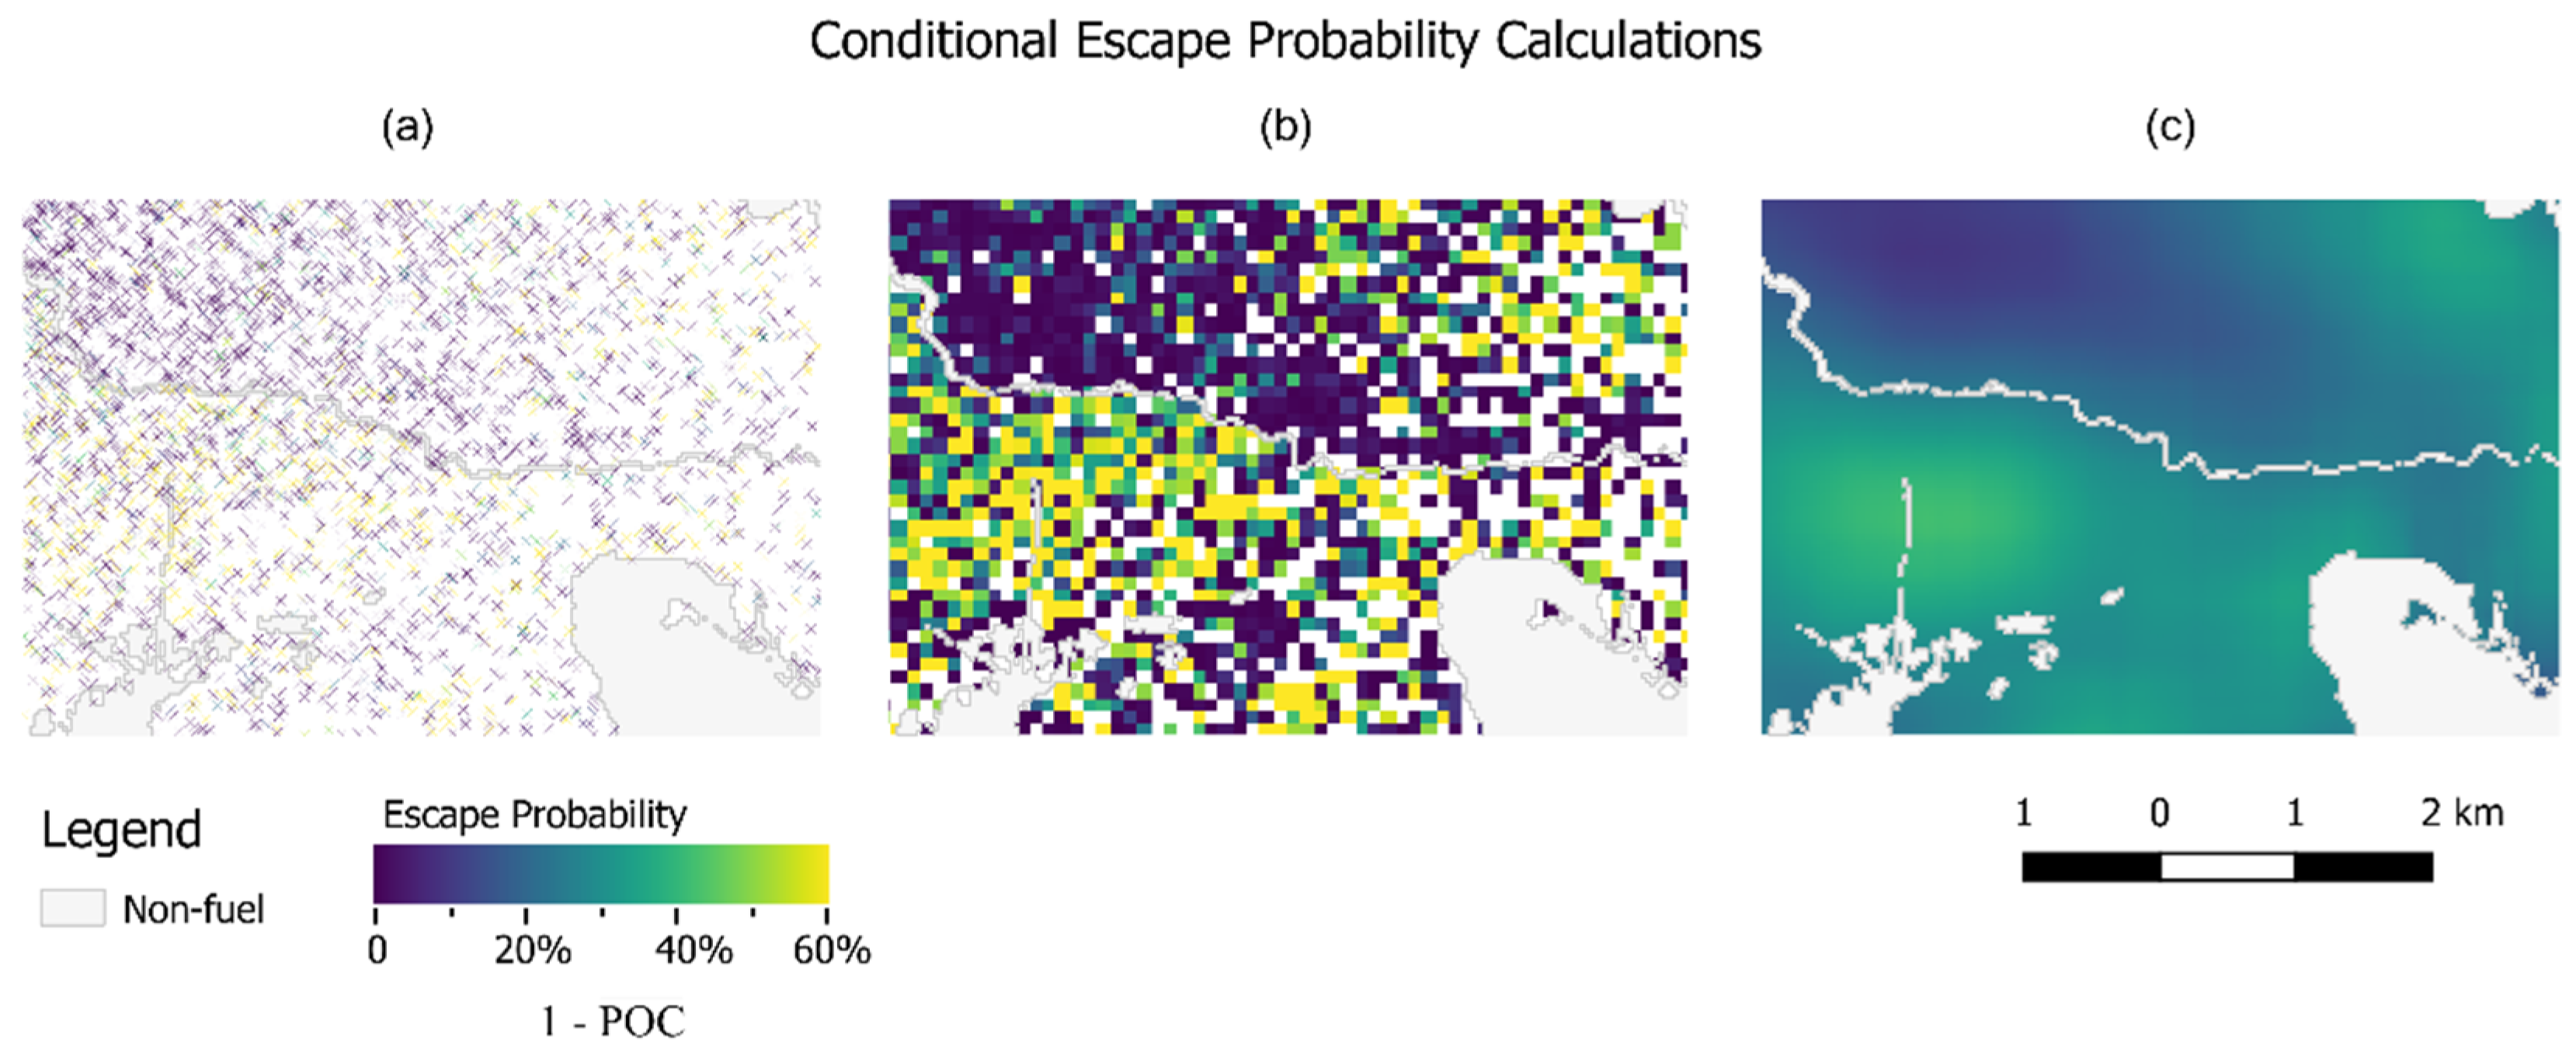
Finally, spatial heterogeneity in POC predictions anticipates future IA challenges. While proximate ignitions encounter different fire weather, similar fuel complexes and topography form clusters of high and low POC values. This study produced a conditional escape probability map intended for managers, created with GIS software and based on mean POC (Figure 8). Results are ‘conditional’ in that they pertain to the condition of a new ignition. The buffer zone was included, as there is no edge effect.
3. Results
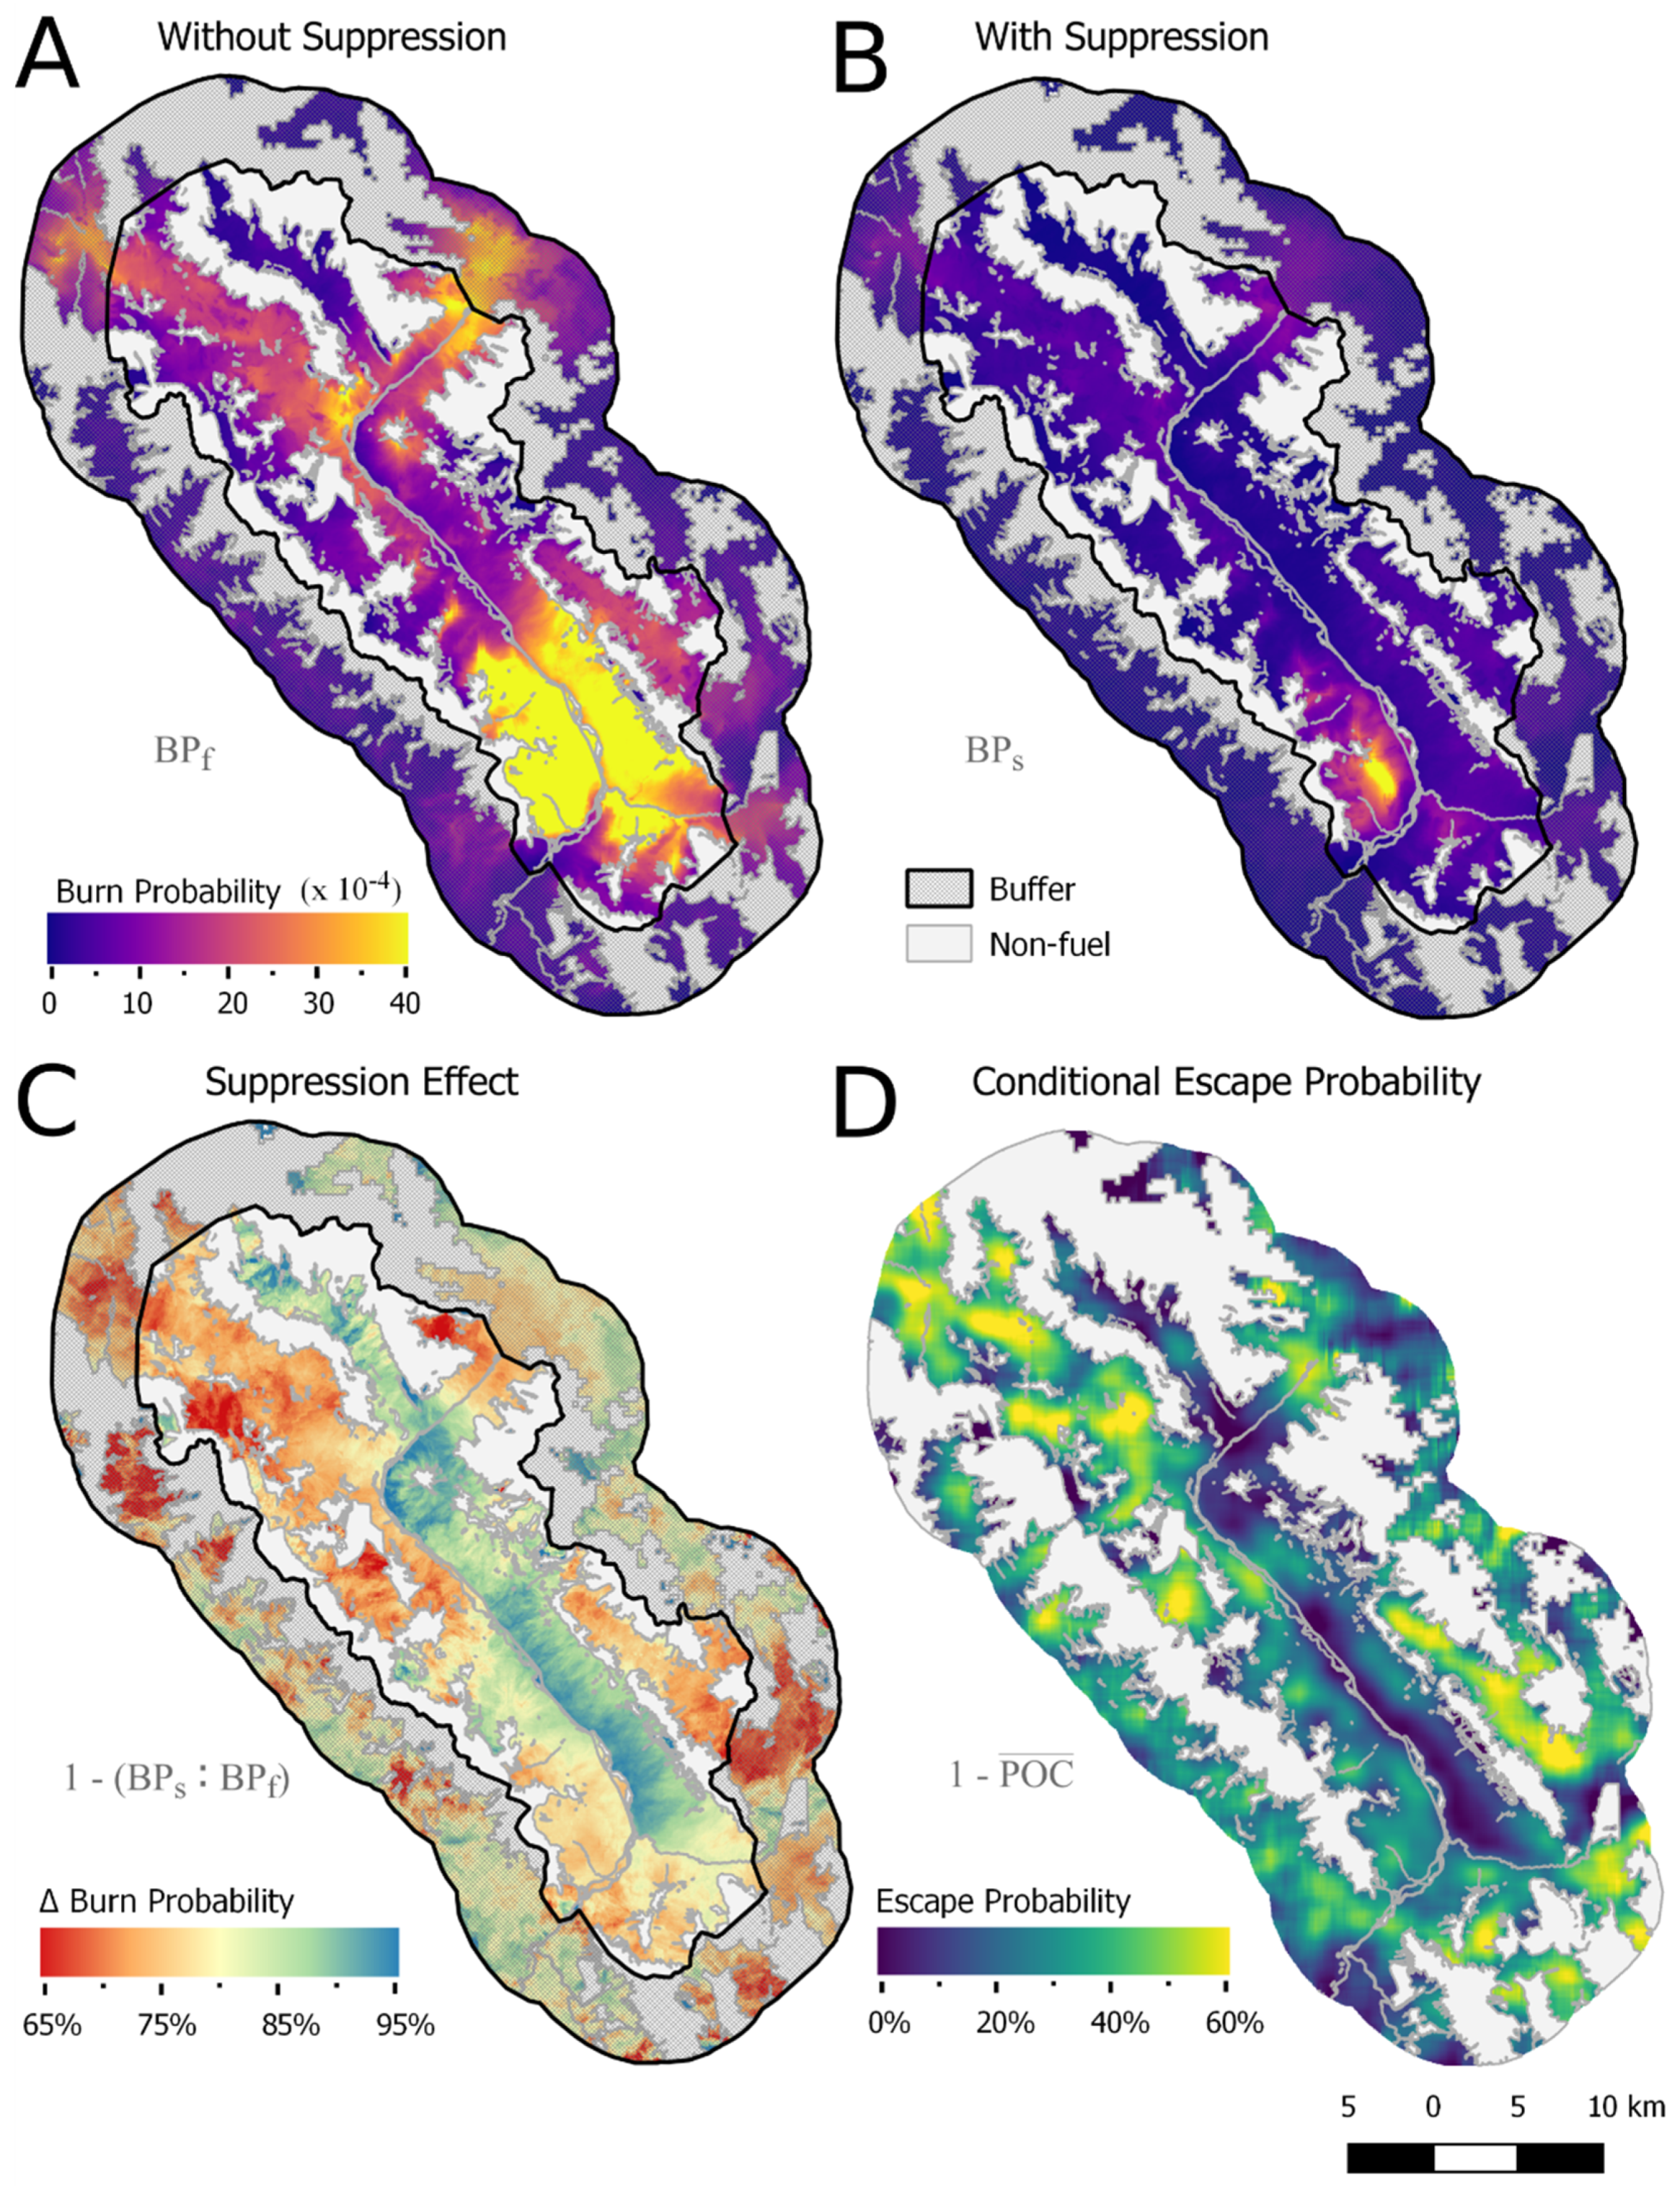
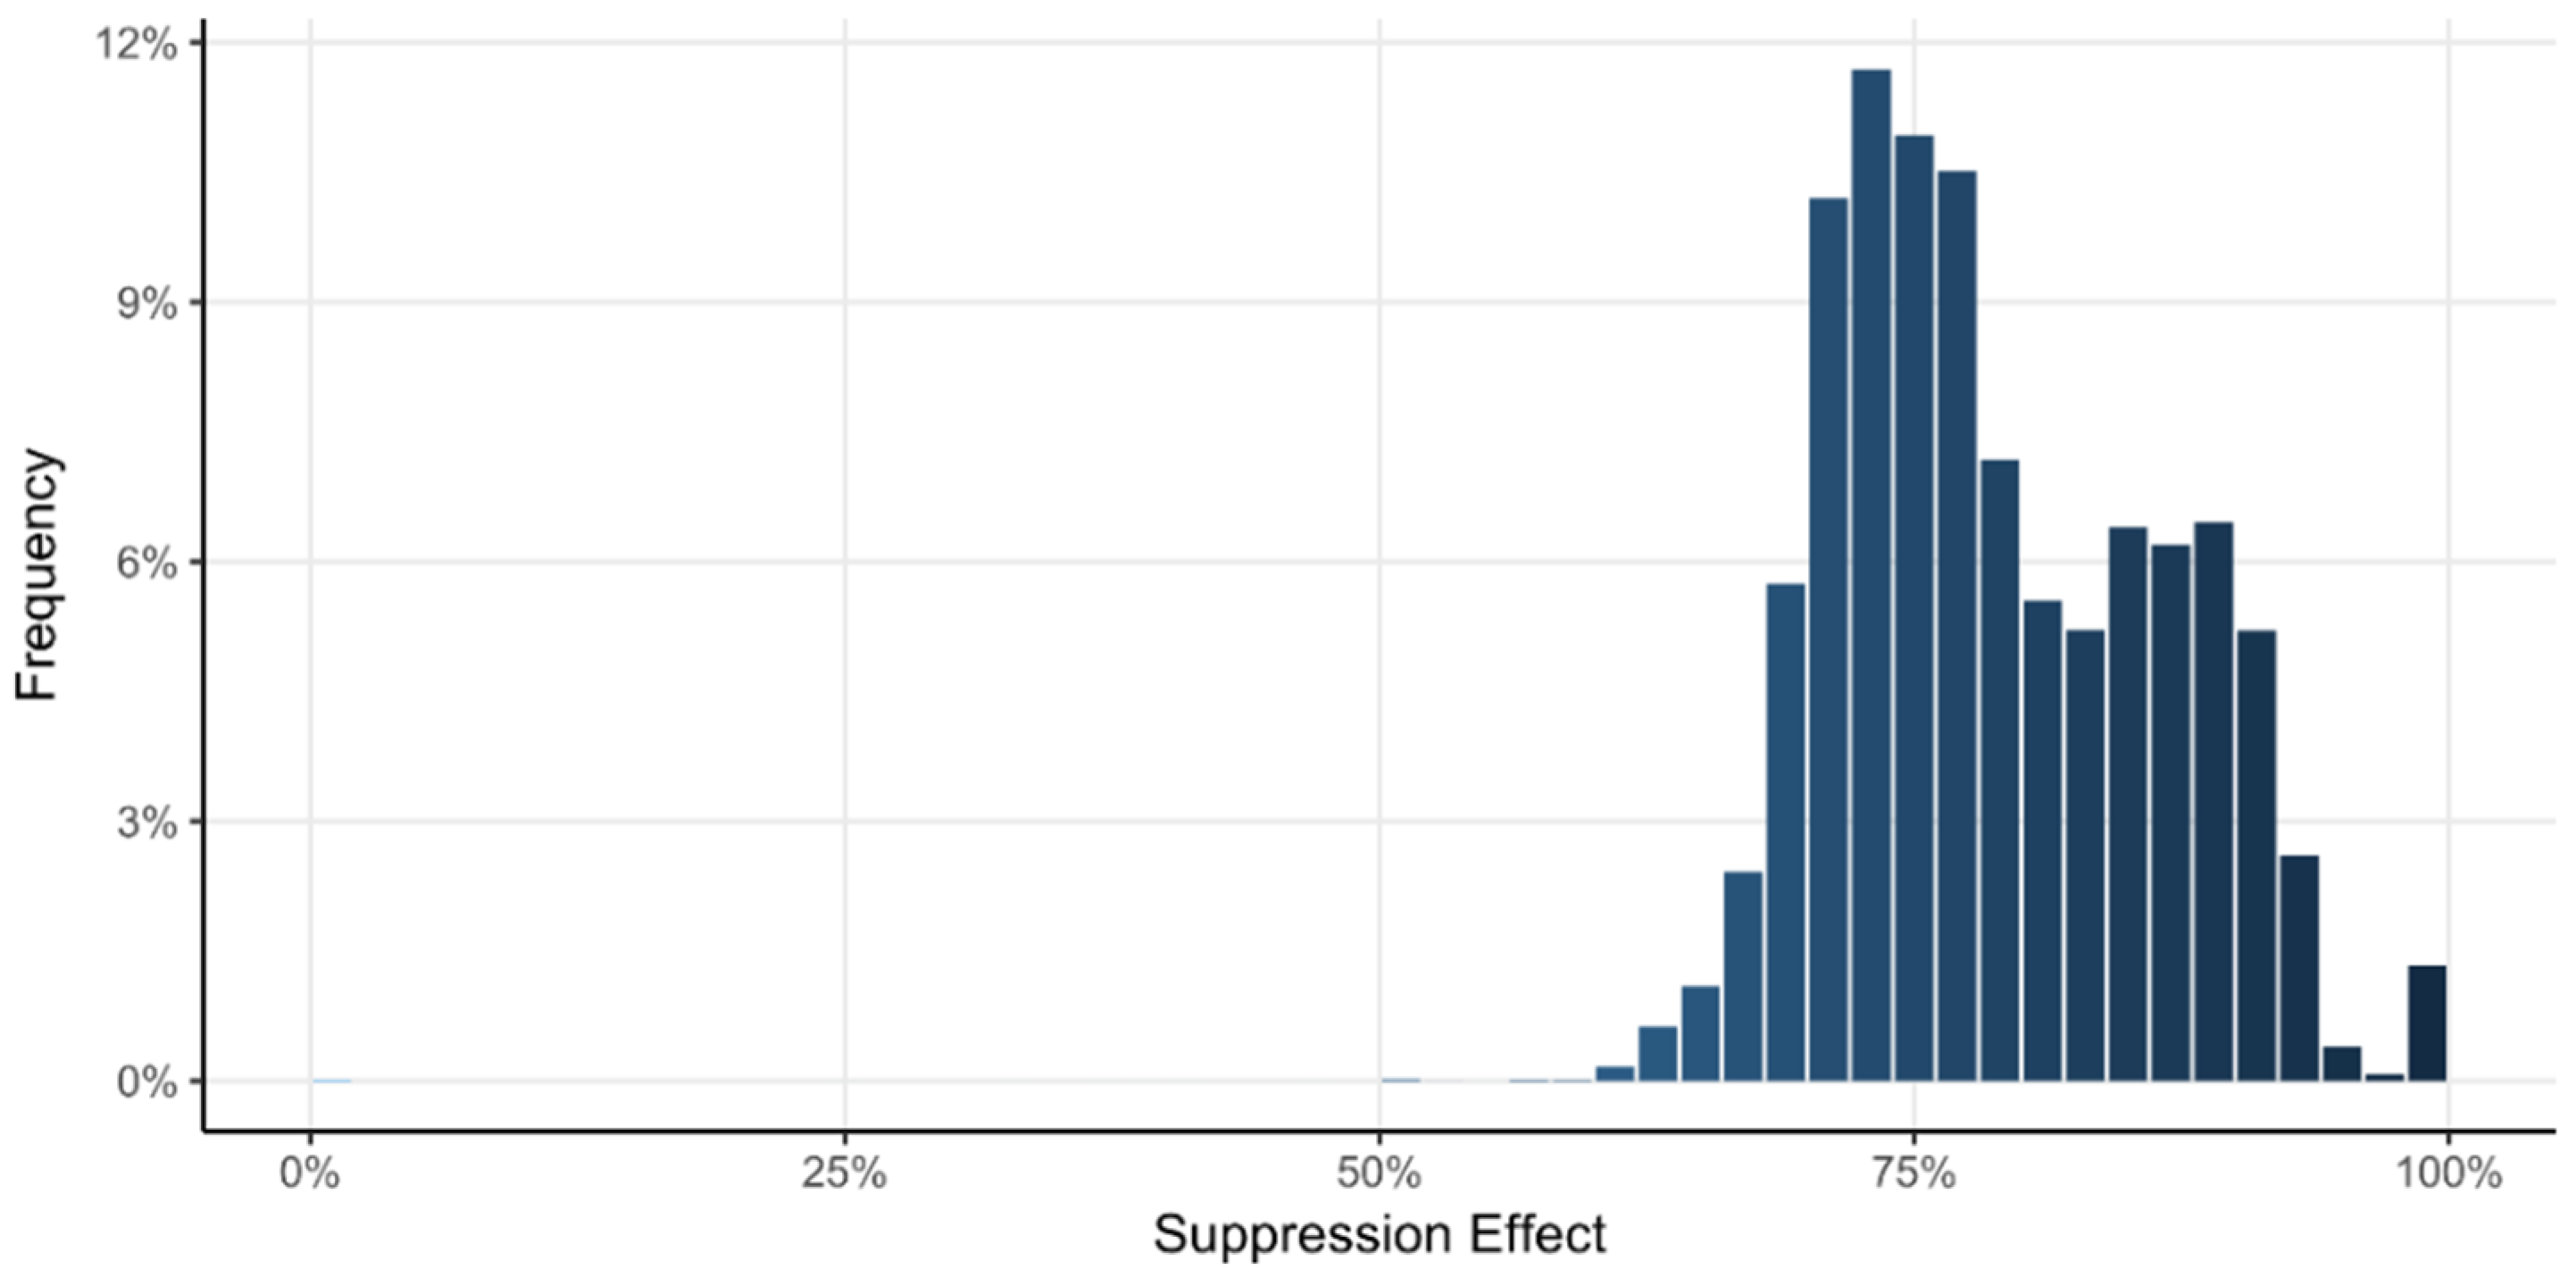
The study simulated 111,087 fires over 100,000 iterations of a single fire season, of which 14,701 (13%) were considered to have escaped initial attack (IA). All fuel in the study area burned at least once. Under the free-burning scenario, median fire size was 10.9 ha and the largest 21,794 ha. Simulated IA suppression reduced mean fuel pixel burn probability from 22 × 10−4 (1:450) to 5 × 10⁻⁴ (1:2,217; Figure 9). This was an average burn probability reduction per pixel of 79% due to suppression, with a standard deviation of 7.8% (Figure 10). High-BP areas were found at valley intersections, around river confluences and forested passes, while the lowest values were found in disconnected fuel pockets, such as river islands and alpine vegetation bounded by rock. The highest conditional escape probabilities were found near valley bottom in mature fuels, particularly in the Rockwall, Ottertail, and Verdant Management Zones (Figure 2).
Results varied considerably by fuel type and management zone (Table 2). The two most prevalent fuel types responded differently to suppression: C-2 (Boreal Spruce) fuels had a low suppression effect (73%) and probability of containment (59%), while early successional fuels were more receptive, with the highest suppression effect (86%) and an above average probability of containment (82%). Suppression was least effective in management zones where it is most required, and vice versa. The Bow Corridor Zone is a designated wildfire exclusion zone, but had the lowest suppression effect (72%), probability of containment (63%), and highest post-suppression BP (BPs = 7 × 10⁻⁴ or 1:1351). By contrast, the Vermilion Zone is most receptive to IA suppression, but least likely to require it.
4. Discussion
This study introduces a framework for estimating fine-scale risk outcomes of fire response. It assessed the influence of category B fires (ignitions that can be prevented from growing large by initial attack) on the study area by comparing burn probability model results with and without simulated fire suppression. Caution is warranted in interpreting results: Fire behavior simulations are inherently uncertain and the approach includes model- and study area-specific assumptions. This framework allows managers and researchers insights into landscape-level patterns of resistance and control currently inaccessible by other methods.
Results found suppression effectiveness and ignition containment rates varied considerably across the study area. Suppression was most effective in recently burned areas and least effective in contiguous, mature forest stands. This method avoided common methodological assumptions about large-fire occurrence. Results allowed the number and location of large fires to deviate from the recent past and respond to changes in vegetation and response policy.
The methods rely on several assumptions regarding IA containment. Small fire containment was based on initial fire intensity, spread rate, and ignition cause, and did not consider crew size or experience, proximity to water, detection networks, or variations in response time apart from cause. Area burned calibrations were informed by estimates from the pre-suppression era, made possible because land use, ignition patterns, and dominant vegetation have remained relatively consistent in the study area. The fuel typing system is limited in its ability to characterize some vegetative communities, such as alpine meadows and early seral montane conifers. Fuel typing in this study is also fixed; simulation modelling with fire and inbuilt forest succession under a mixed severity fire regime has been conducted in Mediterranean system [48], though initial attack suppression was not directly considered. Future work integrating both suppression and succession will dramatically improve the understanding of the system.
Findings on the relationship between disturbance history and management control are reinforced by a diverse cohort of empirical studies. Spread-resistance in younger fuels appears integral to landscape self-regulation [49], and remote sensing studies document fire-on-fire dampening effects up to 33 years later in comparable ecoregions [50,51]. Improved IA performance in younger stands was observed in boreal stands with time-since-fire values under 45 years [52]. Results contribute to mounting evidence that managed wildfires enhance the degree of control managers have over subsequent fires, producing a virtuous cycle [53].
Recent wildfires in the study area demonstrate how the framework can be applied in pre-fire planning. Shortly after modelling began, three lightning-caused fires escaped IA in or around the study area, consuming over 23,000 ha. Nearly all burned area corresponded with pixels in upper 90th percentile of BPf values. The largest, Verdant Cr. (18,017 ha), ignited in a region with no observed fire history but high conditional escape probability. In response, Parks Canada managers created a landscape-level fuel break through the management zone with lowest suppression effect and highest BPs in this analysis. A prescribed fire is planned for the same area, creating a long-term ‘capping unit’ to mitigate fire contagion into populated northern zones.
These developments suggest burn probability, suppression effect, and conditional escape probability analyses fill complementary niches in pre-fire planning. Burn probability provides an overall indictor of annual fire occurrence risk, suppression effect suggests the level of control managers have over that risk, and conditional escape probability anticipates containment challenges in regions with few recorded fires.
Perhaps the most urgent application is in evaluating alternatives to initial attack. Wildfire cannot be deferred indefinitely and allowing certain fires to burn under moderate weather can reduce subsequent hazard with limited short-term risk [54]. The principal innovation is introducing suppression response as an independent variable, allowing managers to evaluate hypothetical policies and compare consequences.
Although fire management agencies often encourage managed fire use, structural disincentives contribute to manager risk-aversion and aggressive initial attack operations [19,55]. Managers consider fire response decisions separately instead of within the context of many similar future decisions (narrow-framing vs broad-framing [56]), and vivid outcomes like wildfire destruction are systematically over-weighted [57]. Fortunately, prescriptive risk policies can correct manager biases, provide an improved sense of agency support, and maintain managerial discretion. Such policy-making requires expert judgement, but benefits from quantitative assessments of suppression effectiveness [53].
This framework can be applied to BP models and regions outside Burn-P3 and the Vermilion Valley. The core steps are simple: approximate a free-burning fire regime, simulate initial attack, and compare results. In practice, this is easier in some regions than others. BP models generally calibrate simulated fire size distributions to the historical record [40]. In the study area, land use, ignition patterns, and dominant vegetation patterns have remained relatively consistent, but may vary in other regions. The historical range of variation (particularly pre-suppression fire cycle) provides guidance but is challenging to apply where land use has been altered or anthropogenic ignitions significantly contributed to pre-suppression regimes.
Looking forward, the framework could be adapted to assess cumulative fire risk across years and decades. The complex interactions between managerial decision-making and self-regulating landscape disturbance patterns is a pressing issue in modern fire management [58]. Simulations could model vegetation successional pathways and investigate the effects of response policy on longer-term risk [54,59]. This strategy could provide a quantitative account of how managing wildfires without IA under moderate growth conditions introduces short-term threats but reduces long-term cumulative risk.
Author Contributions
Conceptualization, J.R. and D.K.T.; methodology, J.R.; writing—original draft preparation, J.R.; writing—review and editing, D.K.T. and N.P.; visualization, J.R.; supervision, D.K.T. and J.R.
Funding
This research received no external funding.
Acknowledgments
Many staff at Parks Canada and the Canadian Forest Service provided data for this study and provided feedback on earlier version of the manuscript.
Conflicts of Interest
The authors declare no conflict of interest.
References
- Stocks, B.J.; Martell, D.L. Forest fire management expenditures in Canada: 1970–2013. For. Chron. 2016, 92, 298–306. [Google Scholar] [CrossRef] [Green Version]
- Thomas, D.S.; Butry, D.T.; Gilbert, S.W.; Webb, D.H.; Fung, J.F. The Costs and Losses of Wildfires. Spec. Publ. NIST SP-1215 2017. [Google Scholar] [CrossRef]
- United States Forest Service. The Rising Cost of Wildfire Operations: Effects on the Forest Service’s Non-Fire Work; USDA Forest Service: Washington, DC, USA, 2015.
- Keane, R.E.; Hessburg, P.F.; Landres, P.B.; Swanson, F.J. The use of historical range and variability (HRV) in landscape management. For. Ecol. Manag. 2009, 258, 1025–1037. [Google Scholar] [CrossRef]
- Calkin, D.E.; Thompson, M.P.; Finney, M.A. Negative consequences of positive feedbacks in US wildfire management. For. Ecosyst. 2015, 2, 9. [Google Scholar] [CrossRef] [Green Version]
- Alexander, M.E.; Buxton-Carr, P. Wildland fire suppression related fatalities in Canada, 1941–2010: A preliminary report. In Proceedings of the 11th International Wildland Fire Safety Summit; International Association of Wildland Fire, Missoula, MT, USA, 4–8 April 2011. [Google Scholar]
- Butler, C.; Marsh, S.; Domitrovich, J.W.; Helmkamp, J. Wildland firefighter deaths in the United States: A comparison of existing surveillance systems. J. Occup. Environ. Hyg. 2017, 14, 258–270. [Google Scholar] [CrossRef] [Green Version]
- McGee, T.; McFarlane, B.; Tymstra, C. Chapter 3-Wildfire: A Canadian Perspective. In Wildfire Hazards, Risks and Disasters; Shroder, J.F., Paton, D., Eds.; Elsevier: Oxford, UK, 2015; pp. 35–58. ISBN 978-0-12-410434-1. [Google Scholar]
- Plucinski, M.P. Fighting Flames and Forging Firelines: Wildfire Suppression Effectiveness at the Fire Edge. Curr. For. Rep. 2019, 5, 1–19. [Google Scholar] [CrossRef]
- Pyne, S.J.; Andrews, P.L.; Laven, R.D. Introduction to Wildland Fire; John Wiley and Sons: New York, NY, USA, 1996; ISBN 0-471-54913-4. [Google Scholar]
- Brown, A.A.; Davis, K.P. Forest Fire: Control and Use, 2nd ed.; McGraw-Hill: New York, NY, USA, 1973; ISBN 978-0-07-008205-2. [Google Scholar]
- Arienti, M.C.; Cumming, S.G.; Boutin, S. Empirical models of forest fire initial attack success probabilities: The effects of fuels, anthropogenic linear features, fire weather, and management. Can. J. For. Res. 2006, 36, 3155–3166. [Google Scholar] [CrossRef]
- Finney, M.; Grenfell, I.C.; McHugh, C.W. Modeling Containment of Large Wildfires Using Generalized Linear Mixed-Model Analysis. For. Sci. 2009, 55, 249–255. [Google Scholar]
- Thompson, M.P.; Scott, J.; Kaiden, J.D.; Gilbertson-Day, J.W. A polygon-based modeling approach to assess exposure of resources and assets to wildfire. Nat. Hazards 2013, 67, 627–644. [Google Scholar] [CrossRef] [Green Version]
- Parisien, M.-A.; Walker, G.R.; Little, J.M.; Simpson, B.N.; Wang, X.; Perrakis, D.D.B. Considerations for modeling burn probability across landscapes with steep environmental gradients: An example from the Columbia Mountains, Canada. Nat. Hazards 2013, 66, 439–462. [Google Scholar] [CrossRef]
- Keating, E.G.; Morral, A.R.; Price, C.C.; Woods, D.; Norton, D.M.; Panis, C.; Saltzman, E.; Sanchez, R. Air Attack Against Wildfires: Understanding U.S. Forest Service Requirements for Large Aircraft; RAND Corporation: Santa Monica, CA, USA, 2012. [Google Scholar]
- Stocks, B.J.; Mason, J.A.; Todd, J.B.; Bosch, E.M.; Wotton, B.M.; Amiro, B.D.; Flannigan, M.D.; Hirsch, K.G.; Logan, K.A.; Martell, D.L.; et al. Large forest fires in Canada, 1959–1997. J. Geophys. Res. Atmos. 2002, 107, 5–12. [Google Scholar] [CrossRef]
- Hirsch, K.G.; Corey, P.N.; Martell, D.L. Using Expert Judgment to Model Initial Attack Fire Crew Effectiveness. For. Sci. 1998, 44, 539–549. [Google Scholar]
- Williamson, M.A. Factors in United States Forest Service district rangers’ decision to manage a fire for resource benefit. Int. J. Wildland Fire 2008, 16, 755–762. [Google Scholar] [CrossRef]
- Parisien, M.-A.; Moritz, M.A. Environmental controls on the distribution of wildfire at multiple spatial scales. Ecol. Monogr. 2009, 79, 127–154. [Google Scholar] [CrossRef]
- North, M.P.; Stephens, S.L.; Collins, B.M.; Agee, J.K.; Aplet, G.; Franklin, J.F.; Fulé, P.Z. Reform forest fire management. Science 2015, 349, 1280–1281. [Google Scholar] [CrossRef] [PubMed]
- Olson, R.L.; Bengston, D.N.; DeVaney, L.A.; Thompson, T.A.C. Wildland fire management futures: Insights from a foresight panel. Gen. Tech. Rep. NRS 152 Newtown Sq. PA US Dep. Agric. For. Serv. North. Res. Stn. 44 P 2015, 152, 1–44. [Google Scholar]
- Hand, M.S.; Wibbenmeyer, M.J.; Calkin, D.E.; Thompson, M.P. Risk Preferences, Probability Weighting, and Strategy Tradeoffs in Wildfire Management. Risk Anal. 2015, 35, 1876–1891. [Google Scholar] [CrossRef] [PubMed]
- Wilson, R.S.; Winter, P.L.; Maguire, L.A.; Ascher, T. Managing Wildfire Events: Risk-Based Decision Making Among a Group of Federal Fire Managers. Risk Anal. 2011, 31, 805–818. [Google Scholar] [CrossRef]
- Masters, A.M. Changes in forest fire frequency in Kootenay National Park, Canadian Rockies. Can. J. Bot. 1990, 68, 1763–1767. [Google Scholar] [CrossRef]
- Hallett, D.; Walker, R. Paleoecology and its application to fire and vegetation management in Kootenay National Park, British Columbia. J. Paleolimnol. 2000, 24, 401–414. [Google Scholar] [CrossRef]
- Walker, G.R.; Taylor, A. Achieving landscape fire management goals in the southern Canadian Rocky Mountains. In Proceedings of the 22nd Tall Timbers Fire Ecology Conference: Fire in Temperate, Boreal, and Montane Ecosystems, Kananaskis, AB, Canada, 15–18 October 2001. [Google Scholar]
- Arno, S.F.; Brown, J.K. Managing Fire in Our Forests–Time for a New Initiative. J. For. 1989, 87, 44–46. [Google Scholar]
- Miller, C.; Ager, A.A. A review of recent advances in risk analysis for wildfire management. Int. J. Wildland Fire 2013, 22, 1–14. [Google Scholar] [CrossRef] [Green Version]
- Miller, C.; Parisien, M.-A.; Ager, A.A.; Finney, M.A. Evaluating spatially-explicit burn probabilities for strategic fire management planning. In WIT Transactions on Ecology and the Environment: Modelling, Monitoring and Management of Forest Fires; WIT Press: Bellerica, MA, USA, 2008; pp. 245–252. [Google Scholar]
- Wang, X.; Parisien, M.-A.; Taylor, S.W.; Perrakis, D.D.B.; Little, J.; Flannigan, M.D. Future burn probability in south-central British Columbia. Int. J. Wildland Fire 2016, 25, 200–212. [Google Scholar] [CrossRef] [Green Version]
- Riley, K.L.; Thompson, M.P.; Scott, J.H.; Gilbertson-Day, J.W. A Model-Based Framework to Evaluate Alternative Wildfire Suppression Strategies. Resources 2018, 7, 4. [Google Scholar] [CrossRef] [Green Version]
- Parisien, M.-A.; Kafka, V.; Hirsch, K.G.; Todd, J.B.; Lavoie, S.G.; Maczek, P.D. Mapping Wildfire Susceptibility with the BURN-P3 Simulation Model; Natural Resources Canada, Canadian Forest Service, Northern Forestry Centre, Information Report NOR-X-405: Edmonton, AB, Canada, 2005; p. 36.
- Finney, M.A.; McHugh, C.W.; Grenfell, I.C.; Riley, K.L.; Short, K.C. A simulation of probabilistic wildfire risk components for the continental United States. Stoch. Environ. Res. Risk Assess. 2011, 25, 973–1000. [Google Scholar] [CrossRef] [Green Version]
- Tolhurst, K.; Shields, B.; Chong, D. Phoenix: Development and Application of a Bushfire Risk Management Tool. Aust. J. Emerg. Manag. 2008, 23, 47. [Google Scholar]
- Tymstra, C.; Bryce, R.W.; Wotton, B.M.; Taylor, S.W.; Armitage, O.B. Development and Structure of Prometheus: The Canadian Wildland Fire Growth Simulation Model; Natural Resources Canada, Canadian Forest Service, Northern Forestry Centre, Information Report NOR-X-417: Edmonton, AB, Canada, 2010; Volume 417, ISBN 978-1-100-14674-4.
- Stocks, B.J.; Lynham, T.J.; Lawson, B.D.; Alexander, M.E.; Wagner, C.E.V.; McAlpine, R.S.; Dubé, D.E. Canadian Forest Fire Danger Rating System: An Overview. For. Chron. 1989, 65, 258–265. [Google Scholar] [CrossRef] [Green Version]
- Merrill, D.F.; Alexander, M.E. Glossary of Forest Fire Management Terms; Canadian Committee on Forest Fire Management, National Research Council of Canada: Ottawa, ON, Canada, 1987.
- Podur, J.; Wotton, B.M. Defining fire spread event days for fire-growth modelling. Int. J. Wildland Fire 2011, 20, 497–507. [Google Scholar] [CrossRef] [Green Version]
- Parisien, M.-A.; Parks, S.A.; Miller, C.; Krawchuk, M.A.; Heathcott, M.; Moritz, M.A. Contributions of Ignitions, Fuels, and Weather to the Spatial Patterns of Burn Probability of a Boreal Landscape. Ecosystems 2011, 14, 1141–1155. [Google Scholar] [CrossRef]
- Beverly, J.L.; Herd, E.P.K.; Conner, J.C.R. Modeling fire susceptibility in west central Alberta, Canada. For. Ecol. Manag. 2009, 258, 1465–1478. [Google Scholar] [CrossRef]
- Kubian, R. Characterizing the Mixed-Severity Fire Regime of the Kootenay Valley, Kootenay National Park. Master’s Thesis, University of Victoria, Victoria, BC, Canada, 2013. [Google Scholar]
- Calkin, D.; Ager, A.; Thompson, M.; Finney, M.; Lee, D.; Quigley, T.; McHugh, C.; Riley, K.; Gilbertson-Day, J. A Comparative Risk Assessment Framework for Wildland Fire Management: The 2010 Cohesive Strategy Science Report; USDA Forest Service/UNL Faculty Publications: Washington, DC, USA, 2011.
- Mees, R.; Strauss, D.; Chase, R. Modeling Wildland Fire Containment with Uncertain Flame Length and Fireline Width. Int. J. Wildland Fire 1993, 3, 179–185. [Google Scholar] [CrossRef]
- Rodríguez y Silva, F.; Molina, J.R.; Rodríguez, J. The efficiency analysis of the fire control operations using Visual SEVEIF tool. In Advances in Forest Fire Research; Viegas, D.X., Ed.; Imprensa da Universidade de Coimbra: Coimbra, Portugal, 2014; pp. 1883–1894. [Google Scholar]
- O’Connor, C.D.; Calkin, D.E.; Thompson, M.P. An empirical machine learning method for predicting potential fire control locations for pre-fire planning and operational fire management. Int. J. Wildland Fire 2017, 26, 587–597. [Google Scholar]
- Taylor, S.W.; Carroll, A.L. Disturbance, forest age, and mountain pine beetle outbreak dynamics in BC: A historical perspective. In Mountain Pine Beetle Symposium: Challenges and Solutions; Information Report BC-X-399; Natural Resources Canada, Canadian Forest Service, Pacific Forestry Centre: Victoria, BC, Canada, 2004; p. 298. ISBN 978-0-662-38389-5. [Google Scholar]
- Millington, J.D.A.; Wainwright, J.; Perry, G.L.W.; Romero-Calcerrada, R.; Malamud, B.D. Modelling Mediterranean landscape succession-disturbance dynamics: A landscape fire-succession model. Environ. Model. Softw. 2009, 24, 1196–1208. [Google Scholar] [CrossRef]
- Erni, S.; Arseneault, D.; Parisien, M.-A. Stand Age Influence on Potential Wildfire Ignition and Spread in the Boreal Forest of Northeastern Canada. Ecosystems 2018, 21, 1471–1486. [Google Scholar] [CrossRef]
- Stevens-Rumann, C.S.; Prichard, S.J.; Strand, E.K.; Morgan, P. Prior wildfires influence burn severity of subsequent large fires. Can. J. For. Res. 2016, 46, 1375–1385. [Google Scholar] [CrossRef] [Green Version]
- Parks, S.A.; Parisien, M.-A.; Miller, C.; Holsinger, L.M.; Baggett, L.S. Fine-scale spatial climate variation and drought mediate the likelihood of reburning. Ecol. Appl. 2018, 28, 573–586. [Google Scholar] [CrossRef] [PubMed]
- Beverly, J.L. Time since prior wildfire affects subsequent fire containment in black spruce. Int. J. Wildland Fire 2017, 26, 919–929. [Google Scholar] [CrossRef]
- Thompson, M.P.; Freeborn, P.; Rieck, J.D.; Calkin, D.E.; Gilbertson-Day, J.W.; Cochrane, M.A.; Hand, M.S. Quantifying the influence of previously burned areas on suppression effectiveness and avoided exposure: A case study of the Las Conchas Fire. Int. J. Wildland Fire 2016, 25, 167–181. [Google Scholar] [CrossRef]
- Houtman, R.M.; Montgomery, C.A.; Gagnon, A.R.; Calkin, D.E.; Dietterich, T.G.; McGregor, S.; Crowley, M. Allowing a wildfire to burn: Estimating the effect on future fire suppression costs. Int. J. Wildland Fire 2013, 22, 871–882. [Google Scholar] [CrossRef]
- Doane, D.L.; O’Laughlin, J.; Morgan, P.; Miller, C. Barriers to wildland fire use: A preliminary problem analysis. Int. J. Wilderness 2006, 121, 36–38. [Google Scholar]
- Kahneman, D.; Lovallo, D. Timid Choices and Bold Forecasts: A Cognitive Perspective on Risk Taking. Manag. Sci. 1993, 39, 17–31. [Google Scholar] [CrossRef]
- Tversky, A.; Kahneman, D. Judgment under Uncertainty: Heuristics and Biases. Science 1974, 185, 1124–1131. [Google Scholar] [CrossRef] [PubMed]
- Thompson, M.P.; MacGregor, D.G.; Dunn, C.J.; Calkin, D.E.; Phipps, J. Rethinking the Wildland Fire Management System. J. For. 2018, 116, 382–390. [Google Scholar] [CrossRef] [Green Version]
- Miller, C. The hidden consequences of fire suppression. Park Sci. 2012, 28, 76–80. [Google Scholar]
Figure 1.
The Vermilion Valley of Kootenay National Park, British Columbia.

Figure 2.
Fire management zones of the Vermilion Valley.

Figure 3.
Project workflow. Model outputs in grey.

Figure 4.
Burn-P3 model inputs for study area and buffer zone. (A) elevation, highways and water features; (B) fuels; ignition probability surfaces calculated from lightning (C) and human (D) ignitions between 1925 and 2015. See Table 2 for a description of each fuel type (O-1b, C-1, etc.).
Figure 4.
Burn-P3 model inputs for study area and buffer zone. (A) elevation, highways and water features; (B) fuels; ignition probability surfaces calculated from lightning (C) and human (D) ignitions between 1925 and 2015. See Table 2 for a description of each fuel type (O-1b, C-1, etc.).

Figure 5.
Cumulative frequency plot with a logarithmic x-axis for observed fire size distributions from 1925 to 2015 (green), and 111,087 simulated fires (orange). The variation between lines is the hypothesized influence of initial attack (IA) suppression.
Figure 5.
Cumulative frequency plot with a logarithmic x-axis for observed fire size distributions from 1925 to 2015 (green), and 111,087 simulated fires (orange). The variation between lines is the hypothesized influence of initial attack (IA) suppression.

Figure 6.
Ignition workflow, showing the modelling process used to determine IA containment.

Figure 7.
Predicted size, intensity, and probability of containment during IA for simulated fires.

Figure 8.
A sample of escape probability calculations along the Simpson River. Panel (a) displays each simulated ignition, colored by probability of containment (POC); panel (b) calculates mean POC on a gridded raster overlay (100 m); panel (c) is the results of resampling.
Figure 8.
A sample of escape probability calculations along the Simpson River. Panel (a) displays each simulated ignition, colored by probability of containment (POC); panel (b) calculates mean POC on a gridded raster overlay (100 m); panel (c) is the results of resampling.

Figure 9.
(a) and (b) Burn probability maps with (BPs) and without (BPf) simulated IA suppression. (c) Suppression effect is the percent reduction in burn probability. (d) Escape probability is the mean probability of IA containment failure.
Figure 9.
(a) and (b) Burn probability maps with (BPs) and without (BPf) simulated IA suppression. (c) Suppression effect is the percent reduction in burn probability. (d) Escape probability is the mean probability of IA containment failure.

Figure 10.
Histogram of suppression effect for pixels containing fuel.


Table 1.
Predicted initial attack (IA) containment rates by response time and ignition cause.
| Response Time (min) | Human Ignitions Contained (%) | Lightning Ignitions Contained (%) |
|---|---|---|
| 15 | 96 | 95 |
| 30 | 92 | 91 |
| 60 | 86 | 85 |
| 120 | 81 | 79 |
Table 2.
Mean ignition and suppression rates by fuel type and management zone. BPf = Free-burning Burn Probability.
Table 2.
Mean ignition and suppression rates by fuel type and management zone. BPf = Free-burning Burn Probability.
| Results by Fuel Type | |||||
| Fuel Type | Description | Number of Ignitions | BPf (×10−4) | Suppression Effect (%) | POC (%) |
| C-1 | Spruce-Lichen Woodland | 5760 | 15 | 76 | 80 |
| C-2 | Boreal Spruce | 24,645 | 24 | 73 | 59 |
| C-3 | Mature Jack Pine | 8429 | 23 | 78 | 73 |
| C-4 | Immature Jack Pine | 5641 | 59 | 75 | 61 |
| C-5 | Red and White Pine | 806 | - | - | 92 |
| C-7 | Ponderosa Pine and Douglas Fir | 1565 | 30 | 80 | 84 |
| M-1/M-2 | Boreal Mixed Wood | 1260 | 8 | 75 | 69 |
| D-1 | Leafless Aspen | 26 | - | - | 93 |
| O-1a | Grass—Matted | 828 | 11 | 67 | 88 |
| O-1b | Grass—Standing | 14,036 | 18 | 77 | 76 |
| O-1b (Early Succession) | Burned 2003 | 48,091 | 23 | 86 | 82 |
| Results by Management Zone | |||||
| Management Strategy | Zone | Area (ha) | BPf (×10−4) | Suppression Effect (%) | POC (%) |
| Intensive | Bow Corridor | 3751 | 26 | 72 | 63 |
| Intermediate | Ottertail | 5557 | 16 | 73 | 63 |
| Rockwall | 14,755 | 14 | 72 | 64 | |
| Kootenay East | 5283 | 23 | 77 | 68 | |
| Extensive | Vermilion | 38,630 | 27 | 84 | 79 |
| Verdant | 7216 | 15 | 74 | 61 | |
| Total | 22 | 79 | 74 | ||
© 2019 by the authors. Licensee MDPI, Basel, Switzerland. This article is an open access article distributed under the terms and conditions of the Creative Commons Attribution (CC BY) license (http://creativecommons.org/licenses/by/4.0/).
Share and Cite
MDPI and ACS Style
Reimer, J.; Thompson, D.K.; Povak, N. Measuring Initial Attack Suppression Effectiveness through Burn Probability. Fire 2019, 2, 60. https://doi.org/10.3390/fire2040060
AMA Style
Reimer J, Thompson DK, Povak N. Measuring Initial Attack Suppression Effectiveness through Burn Probability. Fire. 2019; 2(4):60. https://doi.org/10.3390/fire2040060
Chicago/Turabian StyleReimer, Jonathan, Dan K. Thompson, and Nicholas Povak. 2019. "Measuring Initial Attack Suppression Effectiveness through Burn Probability" Fire 2, no. 4: 60. https://doi.org/10.3390/fire2040060