Article

Monitoring of the Wines’ Quality by Gas Chromatography: HSS-GC/FID Method Development, Validation, Verification, for Analysis of Volatile Compounds

1
Oenological Laboratory, Heroja Pinkija 49, 26300 Vrsac, Serbia
2
Faculty of Agriculture, University of Belgrade, Nemanjina 6, 11080 Belgrade, Serbia
3
Institute of General and Physical Chemistry, University of Belgrade, Studentski Trg 12, 11158 Belgrade, Serbia
*
Author to whom correspondence should be addressed.
Fermentation 2022, 8(2), 38; https://doi.org/10.3390/fermentation8020038
Submission received: 30 November 2021 / Revised: 22 December 2021 / Accepted: 12 January 2022 / Published: 18 January 2022
(This article belongs to the Section Fermentation for Food and Beverages)

Abstract

:
One of the most common techniques for wine analysis is gas chromatography coupled with the flame ionization detector and headspace autosampler (HSS-GC/FID) for the analysis of the volatile compounds in the wine samples. The main goal of this thesis was to develop the method for the analysis of volatiles (methanol, higher alcohols, and esters) in wine samples made of Cabernet Sauvignon and Merlot. Validation parameters were: r2 > 0.995; LOD (0.2–1.0 mg/L); CV (2.7–6.3%), and recovery (92–106%). Average contents of the methanol (198.0 mg/L and 150.5 mg/L), higher alcohols (398.5 mg/L and 335.8 mg/L), ethyl acetate (42.0 mg/L and 55.6 mg/L), and acetaldehyde (23.3 mg/L and 16.1 mg/L) were determined for Merlot and Cabernet Sauvignon, respectively. Based on the obtained results, it was concluded that the content of methanol is in direct connection with the type of grape used for preparation of the wine. It was also found that the duration of the maceration directly influenced the content of the methanol and higher alcohols. On the other hand, type of grape appeared not to have influence on the content of ethyl acetate and acetaldehyde in wines. The post hoc Tukey’s HSD test at 95% confidence limit showed significant differences between observed samples. Principal Component Analysis (PCA) was used for assessing the effect of different genotypes and extraction methods on wine samples. Using PCA of observed samples, the possible directions for improving the quality of product can be realized.

1. Introduction

Wine is one of the most popular alcoholic drinks all over the world. Its aroma is one of the most important characteristics of this drink [1,2,3]. It is recognized as a complex mixture with more than 800 identified volatile compounds which influence the quality of this beverage [4,5]. Generally, aroma represents the products of both biochemical and technological processes during the wine production [6]. Usually, different compounds are formed belonging to different classes according to their chemical structure: alcohols, terpenes, esters, acids, aldehydes, lactones, sulfur, and nitrogen compounds [7]. Some of them are already present in the grape and are accounted as primary aroma, while others are formed during the fermentation and aging by different technological and/or biochemical processes [8,9,10]. There are several reports which considered four esters, i.e., ethyl acetate, isoamyl acetate, ethyl hexanoate, and ethyl octanoate, as well as two alcohols, i.e., isobutyl and isoamyl alcohols, as the main contributors to the basic odor [11,12,13]. The concentration of these compounds may significantly vary depending on environmental conditions, cultural techniques, state of grape maturity, winemaking process, and aging techniques [1,14,15].
There are several analytical approaches for the analysis of volatile compounds in wines. Some of them include isolation and preconcentration of the targeted compounds [7]. Traditional approaches include liquid–liquid [16,17,18,19,20,21,22], solid–liquid [23], and dynamic headspace [24]. There are also modern approaches, such as solid phase extraction (SPE) and solid phase microextraction (SPME) [7,8]. Moreover, there are also techniques which are actually a combination of those previously-mentioned, e.g., headspace and solid phase microextraction (HS-SPME) and solid-phase dynamic extraction (SPDE) [25]. Taking the significance of the volatile compounds’ determination, especially aldehydes, esters, and alcohols, this study aimed to develop a rapid method for the determination of these compounds. Moreover, it is also important that the analytical method be simple, fast, precise, and accurate. To achieve this goal, an analytical method for HSS-GC/FID (headspace gas chromatography with flame ionization detector) was developed and validated for the analysis of acetaldehyde, methanol, higher alcohols, and esters. Moreover, several wine samples of different vintage, manufacturer, and grape variety were analyzed. Additionally, the principal component analysis (PCA) as a pattern recognition technique was applied to the experimental data (used as descriptors) to characterize and differentiate among the observed samples.

2. Materials and Methods

2.1. Chemicals and Reagents

Wines Cabernet Sauvignon, and Merlot (vintage in 2015–2016) are commercially available and were acquired from the store and made by different manufacturers (data are given in Table 1). Standards of acetaldehyde, methanol, isopropanol, n-propanol, ethyl acetate, 2-butanol, isobutanol, n-butanol, isoamyl alcohol, n-pentanol, and isoamyl acetate were acquired from Sigma Aldrich (Germany). All other chemical and reagents were of analytical purity grade.

2.2. HSS-GC/FID Method

All analyses were performed using gas chromatograph coupled with flame ionization detector (Agilent 7890A), and headspace autosampler (Agilent G1888A). The wine sample (1 mL) was transferred into 20 mL-vial for HS and crimped. The vial was then incubated at 100 °C for 10 min. After incubation, the gas phase was transferred into the inlet of the GC. The temperature of the inlet was 250 °C and the split was 100:1. The carrier gas was nitrogen (1 mL/min). Analysis was performed on a capillary DB-624 column (30 m × 0.32 mm, 1.80 µm). The oven program was as follows: initial temperature 40 °C (5 min), then 10 °C/min up to 150 °C, and immediately after 25 °C/min up to 200 °C (held for 2 min). The temperature of the flame in FID detector was 300 °C, while the flows of the nitrogen, air, and hydrogen were 25 mL/min, 400 mL/min, and 30 mL/min, respectively. Identification of the compounds was done by comparing the retention times of the unknown compounds with the retention times of the standards. Quantification was performed by crating the calibration curve for each analyzed compound. The final result was expressed as milligrams of the analyzed compound per liter of the wine sample (mg/L).

2.3. Method Validation

Before the analysis, a validation study of the method was conducted. In order to accomplish this, linearity, limit of detection (LOD), limit of quantitation (LOQ), accuracy, and precision were determined. For the linearity study, the concentration ranges for analytes are given in Table 1. The LOD and LOQ were determined by analyzing the standard solution with the lowest concentration in twelvefold. Parameters were calculated using following equations:
LOD = 3 SD
LOQ = 10 SD
where SD is standard deviation of the analyzed output. Accuracy and precision were determined form the analysis of the commercially available wine “Vranac” (made in 2020). Sample was spiked analyzed compounds in two concentration levels (Table 2). Analyses of the spiked samples were done in sextuplicate in two days. Uncertainty was calculated by the following equations:
U comb = U p 2 + U b 2 + U e 2
U = kU comb
where Ucomb is combined uncertainty, Up is uncertainty of precision, Ub is uncertainty of bias, Ue is uncertainty of analytical equipment, U is expanded uncertainty, and k is coverage factor. For confidence level of 95%, coverage factor k = 2.

2.4. Statistical Analysis

The data were processed statistically using the software package STATISTICA 10.0 (StatSoft Inc., Tulsa, OK, USA). All determinations were made in triplicates, and all data were averaged, expressed by mean ± standard deviation (SD). Analysis of variance (ANOVA) and Tukey’s HSD test for comparison of sample means were used to analyze variations of wine samples (Cabernet Sauvignon and Merlot, vintage 2015 and 2016). All observed samples were checked for variance equality (using Levene’s test) and normal distribution (using Shapiro–Wilk’s test). Principal component analysis was used to discover the possible correlations among measured parameters, and to classify objects into groups.

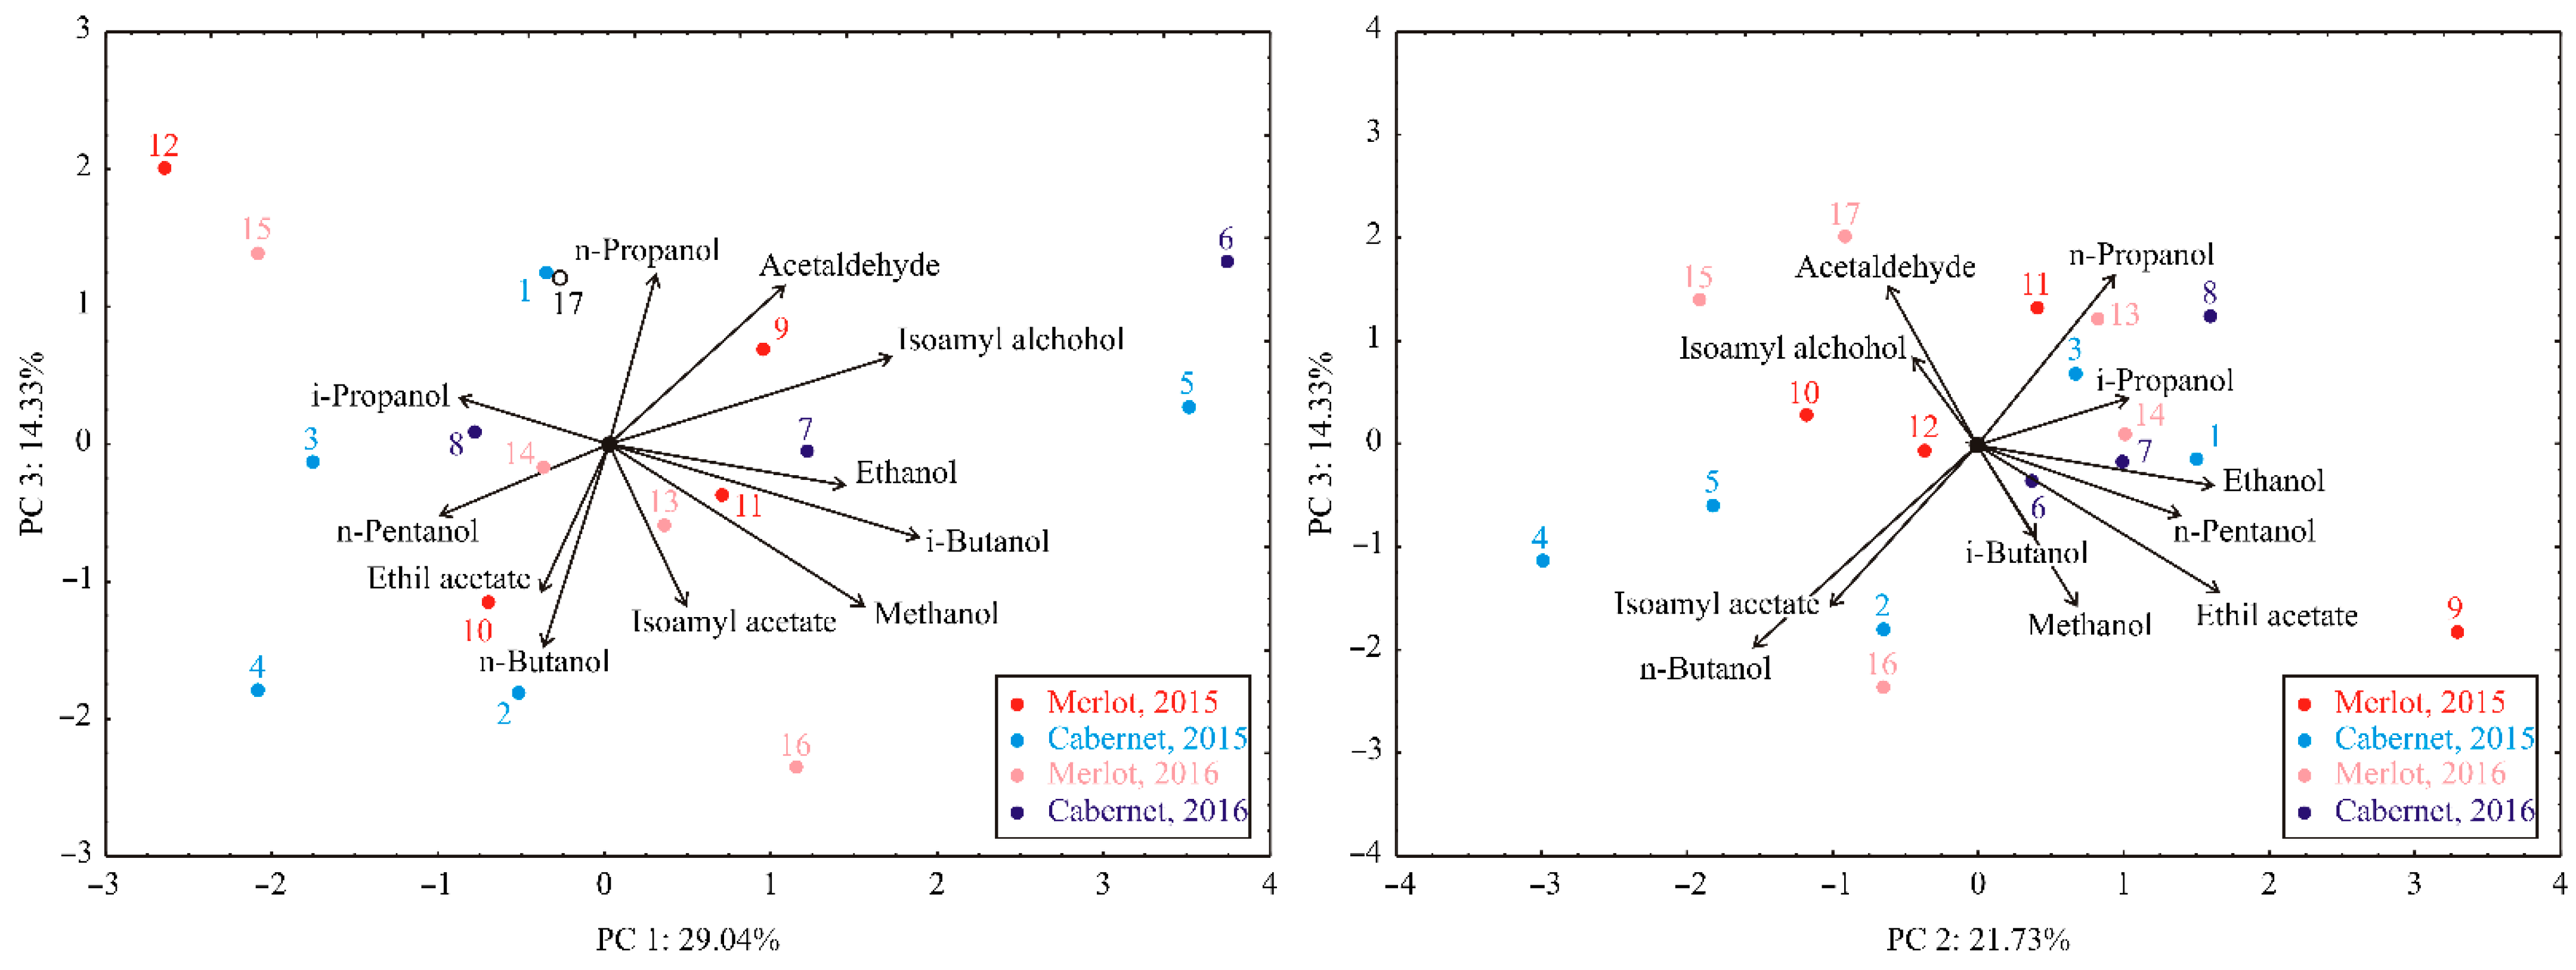
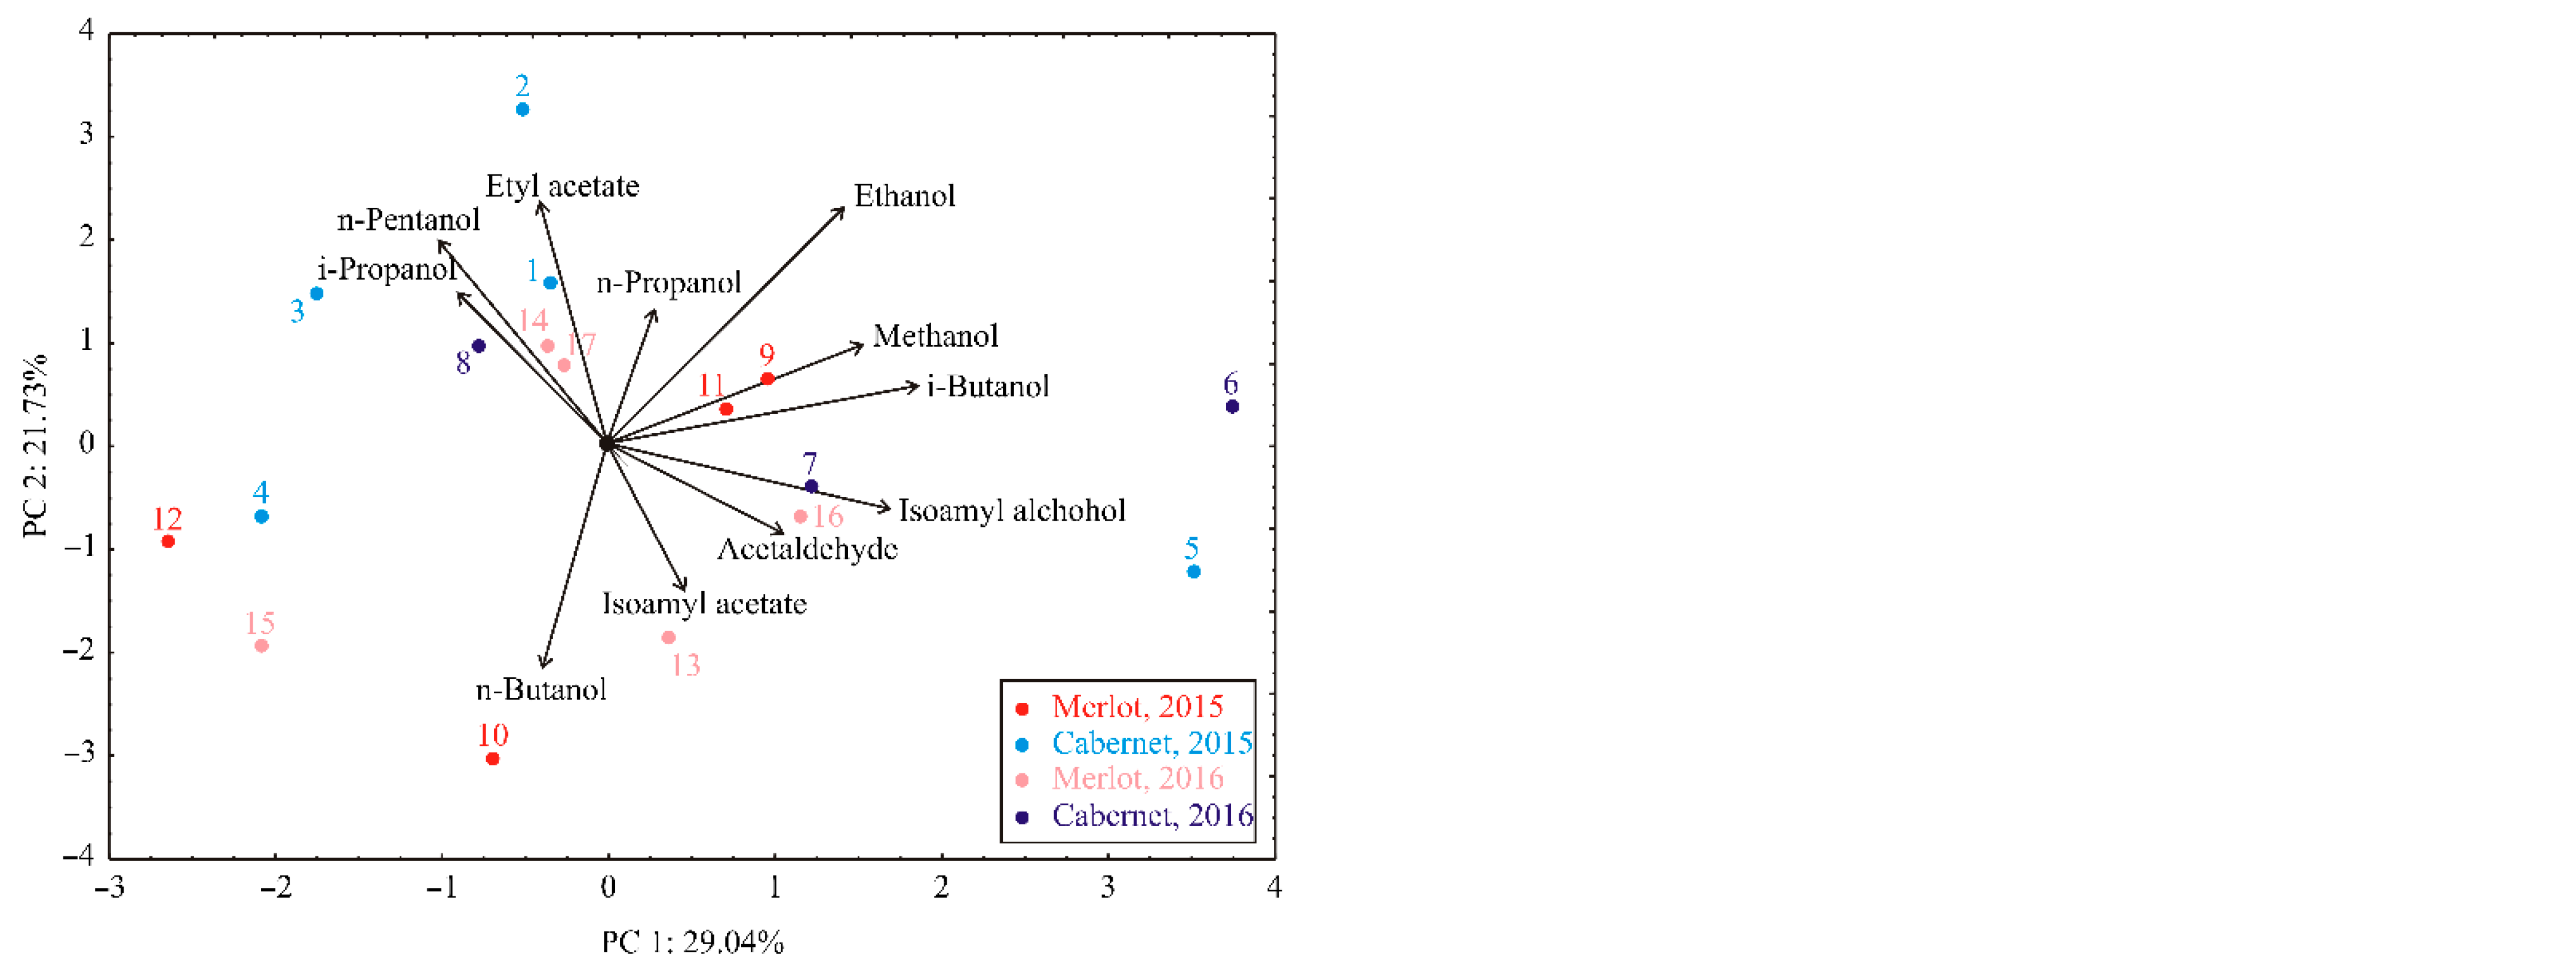
3. Results and Discussion

Validation Study

The validation study was composed of two parts. The first one was the creation of the calibration curves, determination of the linearity, LOD, and LOQ for each analyzed compound. Obtained results for linearity, LOD, and LOQ are given in Table 2.
The presented results showed that linearity was > 0.95 in all cases. The LOD was in the range of 0.20–1.01 mg/L, while LOQ ranged from 0.67 mg/L to 3.38 mg/L depending on the analyzed compound and concentration range used for the creation of the calibration curve. Initial data showed very good ability of the method for analysis of trace and higher levels of compounds in wine samples.
Table 3 shows validation parameters’ levels, e.g., accuracy, precision, uncertainty, inter-day (IP), and intra-day (InP) precisions for the tested method. Parameters were calculated and presented for two spike levels for each analyzed compound. Accuracy was in the range of 82–113%, precision was 2.94–6.90%, while uncertainty was in between 11.18% and 22.70%. Both IP and InP were lower than 7%, which indicates high precision of both method and analysts.
Results of the wine sample analysis are given in Table 4. All results are expressed as mean value obtained from triplicate analysis. Methanol concentration for Cabernet Sauvignon (vintage 2015) was in the range of 120.02–182.98 mg/L. Same grape variety vintaged in 2016 gave methanol concentrations in the range of 137.13–141.79 mg/L. On the other hand, Merlot vintaged in 2015 and 2016 contained methanol in the ranges of 195.40–242.84 mg/L and 65.92–253.45 mg/L.
Results showed that average content of higher alcohols were 398.50 mg/L and 335.80 mg/L for Merlot and Cabernet Sauvignon wines, respectively. 2-Butanol was not detected in any analyzed sample, while isopropanol was not detected in samples 4, 6, and 10. Concentration ranges of higher alcohols for Cabernet Sauvignon were 275.07–413.86 mg/L and 345.69–374.03 mg/L for vintage 2015 and 2016, respectively. In the case of Merlot, ranges were 250.73–549.49 mg/L and 197.72–421.34 mg/L for vintage 2015 and 2016, respectively. Results showed that principal higher alcohol was isoamyl alcohol, while n-pentanol and isopropanol were detected at levels near the limit of quantitation. It might be seen that both methanol and higher alcohols were at their lowest levels in Merlot Rose (Table 4). Methanol is created from the pectin which is present in the grape skin. Merlot wines contain higher percentage of skin and pomace than Cabernet Sauvignon. Therefore, the level of methanol should be higher in Merlot, which was actually the case. Low concentration of methanol in Merlot Rose may also be explained with shorter maceration where contact with skin was shorter, consequently leaving lower amounts of pectin available for production of methanol.
Two esters were selected as a representative of this class of compounds, i.e., ethyl acetate and isoamyl acetate. The content of isoamyl acetate was lower than the limit of detection (<0.47 mg/L) in most cases. Thus, it may be considering that all esters come from the content of ethyl acetate. The contents of ethyl acetate in Cabernet Sauvignon were in range of 41.06–71.17 mg/L and 48.99–63.13 mg/L for vintage 2015 and 2016, respectively. In the case of merlot wines, appropriate ranges were 33.35–121.09 mg/L and 33.84–53.05 mg/L for vintage 2015 and 2016, respectively. Acetaldehyde was selected as a representative compound for aldehydes. It was found in all samples (Table 4); however, results were too scattered, indicating that its concentration is not in correlation with the grape variety, but probably in connection with the preparation procedures. It might be also concluded that the duration of the maceration did not affect the content of acetaldehyde in analyzed wine samples.
The presence of these compounds was previously reported where the results were obtained with different analytical procedures and methods [4,6,7,8,13,26,27]. Miele et al. reported ethyl acetate in ranges of 25.1–32.8 mg/L and 32.8-37.5 mg/L for different clones of Merlot and Cabernet Sauvignon, respectively [27]. The same author reported that methanol concentration was higher in Merlot wines (233.3–255.5 mg/L) than in Cabernet Sauvignon wines (171.1–203.8 mg/L). Several research groups investigated the application of HS-SPME (headspace solid phase micro extraction) for analysis of the volatiles in wine samples [6,7,8,26]. They used different fibers for adsorption of the volatiles after evaporation from the samples. Despite the difference in experimental conditions and analyzed samples, numerous compounds were reported from different classes, e.g., alcohols, esters, acids, aldehydes, etc. Perez-Prieto et al. used ultrasonic extraction techniques in combination with liquid–liquid extraction for isolation of major volatiles from the red wines. They reported high levels of isoamyl acetate [13].
Beside the chemical profile, the principal component analysis of the analyzed samples was done (Table 5). Methanol content was positively correlated to ethanol and isobutanol content, statistically significant at p ≤ 0.05 level, and also to isoamyl alcohol content (statistically significant at p < 0.10 level). Ethanol content was positively correlated to isobutanol and negatively correlated to n-butanol content (statistically significant at p < 0.05 level). Isobutanol content was positively correlated to isoamyl alcohol content, statistically significant at p < 0.05 level, while isoamyl alcohol content was negatively correlated to n-pentanol content, statistically significant at p < 0.05 level.
The points shown in the PCA graphics, which are geometrically close to each other indicate the similarity of patterns that represent these points. The orientation of the vector describing the variable in factor space indicates an increasing trend of these variables, and the length of the vector is proportional to the square of the correlation values between the fitting value for the variable and the variable itself. The angles between corresponding variables indicate the degree of their correlations (small angles corresponding to high correlations).
The PCA of the presented data explained that the first three components accounted for 65.10% of the total variance (29.04, 21.73 and 14.33%, respectively) in the eleven variables factor space (higher alcohol content). Considering the map of the PCA performed on the data, the contents of acetaldehyde (which contributed 7.69% of total variance, based on correlations), methanol (16.57%), ethanol (14.14%), i-butanol (24.23%), and isoamyl alcohol content (20.09%) exhibited positive scores according to first principal component, whereas n-pentanol amount (7.27%), showed negative score values according to first principal component (Figure 1). The positive contribution to the second principal component calculation was observed for: ethanol (18.67% of total variance, based on correlations), isopropanol (7.70%), and n-pentanol content (14.08%), while negative scores on second principal component calculation was observed for n-butanol (8.7%) and isoamyl acetate content (7.54%).
Positive contribution to the third principal component was obtained for acetaldehyde (13.67% of total variance, based on correlations) and n-propanol content (15.46%), while negative influence was observed for methanol (13.16%), ethyl acetate (11.03%), n-butanol (20.77%) and isoamyl acetate content (13.07%).

4. Conclusions

A method for the analysis of the volatile compounds (methanol, higher alcohols, esters and acetaldehyde) was developed and successfully validated. After a validation study, the following parameters were obtained: r2 > 0.995; LOD = 0.2–1.0 mg/L; CV = 2.7–6.3%, and recovery = 92–106%.
The method was then applied for the analysis of Merlot and Cabernet Sauvignon wine samples vintaged in 2015 and 2016. Obtained results showed excellent suitability for these types of samples. The average content of the methanol in Merlot was 198.0 mg/L, while in Cabernet Sauvignon, it was 150.5 mg/L. Methanol content in Rose wine Merlot was only 65.9 mg/L. The average content of the higher alcohols was 398.5 mg/L, 335.8 mg/L, and 198.0 mg/L in Merlot, Cabernet Sauvignon, and Rose Merlot, respectively. Isoamyl alcohol was the principal higher alcohol making up the 80% and 77% of the total amount of higher alcohols in Merlot and Cabernet Sauvignon, respectively. The percentage of the n-propanol was the same, while in the case of isobutanol and n-butanol, it was approximately the same. The fraction of isopropanol, 2-butanol, and n-pentanol was below 1%. The content of the isoamyl acetate was below the limit of detection, while the average content of the ethyl acetate was 55.6 mg/L and 42.0 mg/L in Cabernet Sauvignon and Merlot, respectively. Acetaldehyde was also found in amounts of 16.1 mg/L and 23.3 mg/L in Cabernet Sauvignon and Merlot, respectively. Based on the results of the validation process, this method was proved to be precise and accurate, and in combination with the simple preparation, i.e., incubation in headspace vial, is more suitable and simpler when comparing to other available analytical methods (volumetric and spectrophotometric methods).
Based on the obtained results, it is concluded that the content of methanol is in direct connection with the type of grape used for the preparation of the wine. It was also found that the duration of the maceration directly influenced the content of the methanol and higher alcohols. On the other hand, the type of grape appeared not to have influence on the content of ethyl acetate and acetaldehyde in wines.

Author Contributions

Conceptualization, M.A., I.S.I. and S.Š (Saša Šorgić).; methodology, S.Š (Saša Šorgić).; software, L.P.; validation, S.Š (Saša Šorgić)., V.Č.; formal analysis, S.Š. (Saša Šorgić) and V.Č.; investigation, S.Š. (Saša Šorgić); resources, S.Š (Sabina Šaćirović)., I.S.I. and M.A.; data curation, S.Š. (Saša Šorgić), V.Č. and S.Š (Sabina Šaćirović).; writing—original draft preparation, S.Đ., S.Š. (Saša Šorgić) and L.P.; writing—review and editing, S.Đ., S.Š. (Saša Šorgić) and L.P.; visualization, S.Š. (Saša Šorgić), L.P. and S.Đ.; supervision, I.S.I. All authors have read and agreed to the published version of the manuscript.

Funding

The authors would like to thank the Ministry of Education, Science and Technological Development of Republic of Serbia (Grants No: 451-03-9/2021-14/200051 and 451-03-9/2021-14/200116) for financial support.

Institutional Review Board Statement

Not applicable.

Informed Consent Statement

Not applicable.

Data Availability Statement

Not applicable.

Conflicts of Interest

The authors declare no conflict of interest.

References

  1. Gómez-Míguez, M.J.; Gómez-Míguez, M.; Vicario, I.M.; Heredia, F.J. Assessment of colour and aroma in white wines vinifications: Effects of grape maturity and soil type. J. Food Eng. 2007, 79, 758–764. [Google Scholar] [CrossRef]
  2. Rocha, S.M.; Coutinho, P.; Coelho, E.; Barros, A.S.; Delgadillo, I.; Coimbra, M.A. Relationships between the varietal volatile composition of the musts and white wine aroma quality. A four year feasibility study. LWT Food Sci. Technol. 2010, 43, 1508–1516. [Google Scholar] [CrossRef]
  3. Zea, L.; Moyano, L.; Ruiz, M.J.; Medina, M. Odor Descriptors and Aromatic Series During the Oxidative Aging of Oloroso Sherry Wines. Int. J. Food Prop. 2013, 16, 1534–1542. [Google Scholar] [CrossRef]
  4. Gürbüz, O.; Rouseff, J.M.; Rouseff, R.L. Comparison of Aroma Volatiles in Commercial Merlot and Cabernet Sauvignon Wines Using Gas Chromatography−Olfactometry and Gas Chromatography−Mass Spectrometry. J. Agric. Food Chem. 2006, 54, 3990–3996. [Google Scholar] [CrossRef]
  5. Aznar, M.; López, R.; Cacho, J.F.; Ferreira, V. Identification and Quantification of Impact Odorants of Aged Red Wines from Rioja. GC−Olfactometry, Quantitative GC-MS, and Odor Evaluation of HPLC Fractions. J. Agric. Food Chem. 2001, 49, 2924–2929. [Google Scholar] [CrossRef] [PubMed]
  6. Tao, Y.; Li, H.; Wang, H.; Zhang, L. Volatile compounds of young Cabernet Sauvignon red wine from Changli County (China). J. Food Compos. Anal. 2008, 21, 689–694. [Google Scholar] [CrossRef]
  7. Arcari, S.G.; Caliari, V.; Sganzerla, M.; Godoy, H.T. Volatile composition of Merlot red wine and its contribution to the aroma: Optimization and validation of analytical method. Talanta 2017, 174, 752–766. [Google Scholar] [CrossRef] [PubMed]
  8. Torrens, J.; Riu-Aumatell, M.; Lopez-Tamames, E.; Buxaderas, S. Volatile Compounds of Red and White Wines by Headspace-Solid-Phase Microextraction Using Different Fibers. J. Chromatogr. Sci. 2004, 42, 310–316. [Google Scholar] [CrossRef] [PubMed] [Green Version]
  9. Rapp, A. Wine Aroma Substances from Gas Chromatographic Analysis. In Wine Analysis. Modern Methods of Plant Analysis; Linskens, H.F., Jackson, J.F., Eds.; Springer: Berlin, Germany, 1988; pp. 29–66. [Google Scholar]
  10. Jiang, B.; Xi, Z.; Luo, M.; Zhang, Z. Comparison on aroma compounds in Cabernet Sauvignon and Merlot wines from four wine grape-growing regions in China. Food Res. Int. 2013, 51, 482–489. [Google Scholar] [CrossRef]
  11. Ferreira, V.; Fernández, P.; Peña, C.; Escudero, A.; Cacho, J.F. Investigation on the role played by fermentation esters in the aroma of young Spanish wines by multivariate analysis. J. Sci. Food Agric. 1995, 67, 381–392. [Google Scholar] [CrossRef]
  12. Rapp, A.; Mandery, H. Wine aroma. Experientia 1986, 42, 873–884. [Google Scholar] [CrossRef]
  13. Pérez-Prieto, L.J.; López-Roca, J.M.; Gómez-Plaza, E. Differences in major volatile compounds of red wines according to storage length and storage conditions. J. Food Compos. Anal. 2003, 16, 697–705. [Google Scholar] [CrossRef]
  14. Chira, K.; Pacella, N.; Jourdes, M.; Teissedre, P.-L. Chemical and sensory evaluation of Bordeaux wines (Cabernet-Sauvignon and Merlot) and correlation with wine age. Food Chem. 2011, 126, 1971–1977. [Google Scholar] [CrossRef]
  15. Dennis, E.G.; Keyzers, R.A.; Kalua, C.M.; Maffei, S.M.; Nicholson, E.L.; Boss, P.K. Grape Contribution to Wine Aroma: Production of Hexyl Acetate, Octyl Acetate, and Benzyl Acetate during Yeast Fermentation Is Dependent upon Precursors in the Must. J. Agric. Food Chem. 2012, 60, 2638–2646. [Google Scholar] [CrossRef]
  16. Ferreira, V.; Rapp, A.; Cacho, J.F.; Hastrich, H.; Yavas, I. Fast and quantitative determination of wine flavor compounds using microextraction with Freon 113. J. Agric. Food Chem. 1993, 41, 1413–1420. [Google Scholar] [CrossRef]
  17. Villen, J.; Senorans, F.J.; Reglero, G.; Herraiz, M. Analysis of Wine Aroma by Direct Injection in Gas Chromatography without Previous Extraction. J. Agric. Food Chem. 1995, 43, 717–722. [Google Scholar] [CrossRef]
  18. Zhou, Y.; Riesen, R.; Gilpin, C.S. Comparison of Amberlite XAD-2/Freon 11 Extraction with Liquid/Liquid Extraction for the Determination of Wine Flavor Components. J. Agric. Food Chem. 1996, 44, 818–822. [Google Scholar] [CrossRef]
  19. Schneider, R.; Baumes, R.; Bayonove, C.; Razungles, A. Volatile Compounds Involved in the Aroma of Sweet Fortified Wines (Vins Doux Naturels) from Grenache Noir. J. Agric. Food Chem. 1998, 46, 3230–3237. [Google Scholar] [CrossRef]
  20. Aleixandre, J.L.; Lizama, V.; Alvarez, I.; García, M.J. Varietal Differentiation of Red Wines in the Valencian Region (Spain). J. Agric. Food Chem. 2002, 50, 751–755. [Google Scholar] [CrossRef]
  21. Ferreira, V.; Ortín, N.; Escudero, A.; López, R.; Cacho, J. Chemical Characterization of the Aroma of Grenache Rosé Wines: Aroma Extract Dilution Analysis, Quantitative Determination, and Sensory Reconstitution Studies. J. Agric. Food Chem. 2002, 50, 4048–4054. [Google Scholar] [CrossRef] [PubMed]
  22. Ortega-Heras, M.; González-SanJosé, M.; Beltrán, S. Aroma composition of wine studied by different extraction methods. Anal. Chim. Acta 2002, 458, 85–93. [Google Scholar] [CrossRef]
  23. Edwards, C.G.; Beelman, R.B. Extraction and analysis of volatile compounds in white wines using Amberlite XAD-2 resin and capillary gas chromatography. J. Agric. Food Chem. 1990, 38, 216–220. [Google Scholar] [CrossRef]
  24. Salinas, M.R.; Alonso, G.L.; Esteban-Infantes, F.J. Adsorption-Thermal Desorption Gas Chromatography Applied to the Determination of Wine Aromas. J. Agric. Food Chem. 1994, 42, 1328–1331. [Google Scholar] [CrossRef]
  25. Andujar-Ortiz, I.; Moreno-Arribas, M.V.; Martín-Álvarez, P.J.; Pozo-Bayón, M.A. Analytical performance of three commonly used extraction methods for the gas chromatography–mass spectrometry analysis of wine volatile compounds. J. Chromatogr. A 2009, 1216, 7351–7357. [Google Scholar] [CrossRef]
  26. Yue, T.-X.; Chi, M.; Song, C.-Z.; Liu, M.-Y.; Meng, J.-F.; Zhang, Z.-W.; Li, M.-H. Aroma Characterization of Cabernet Sauvignon Wine from the Plateau of Yunnan (China) with Different Altitudes Using SPME-GC/MS. Int. J. Food Prop. 2015, 18, 1584–1596. [Google Scholar] [CrossRef]
  27. Miele, A. Wine composition of Merlot and Cabernet Sauvignon vine clones under the environmental conditions of Serra Gaúcha, Brazil. Food Sci. Technol. 2021, 41, 116–122. [Google Scholar] [CrossRef]
Figure 1. PCA ordination of variables based on component correlations.
Fermentation 08 00038 g001aFermentation 08 00038 g001b
Table 1. Wine samples, grape variety, vintage, manufacturers, and country of origin.
Sample No.Grape VarietyVintageManufacturerCountry of Origin
1Cabernet Sauvignon2015Casa de CampoChile
2Cabernet Sauvignon2015Slovenska IstraSlovenia
3Cabernet Sauvignon2015Vipava 1894Slovenia
4Cabernet Sauvignon2015DivaSerbia
5Cabernet Sauvignon2015ImpresijaSerbia
6Cabernet Sauvignon2016DivaSerbia
7Cabernet Sauvignon2016ImpresijaSerbia
8Cabernet Sauvignon2016Garling CollectionMoldova
9Merlot2015Mačkov podrumSerbia
10Merlot2015Vipava 1894Slovenia
11Merlot2015Deželno vino PGOSlovenia
12Merlot2015ImpresijaSerbia
13Merlot2016Garling CollectionMoldova
14Merlot2016ImpresijaSerbia
15Merlot2016BelicaSlovenia
16Merlot2016Goriška BrdaSlovenia
17Merlot – Rose2016Tribus VillaSerbia
Table 2. Validation parameters for the analyzed compounds under investigation conditions.
CompoundLinearityRange (mg/L)Calibration CurvesLOD * (mg/L)LOQ ** (mg/L)
Methanol0.999015–450y = 0.96476x + 2.439100.872.89
Acetaldehyde0.99895–150y = 3.42297x + 8.346890.511.70
Isopropanol0.99815–150y = 2.33411x + 3.062091.013.38
n-Propanol0.99855–150y = 2.75796x + 1.188010.300.99
Ethyl acetate0.99905–150y = 3.81303x + 2.504480.822.75
2-Butanol0.99845–150y = 3.94784x + 2.418850.321.05
Isobutanol0.99865–150y = 4.95166x + 2.421750.200.67
n-Butanol0.99815–150y = 3.81662x + 0.300540.471.56
Isoamyl alcohol0.998510–300y = 4.98077x + 11.088970.702.34
n-Pentanol0.99825–150y = 5.02199x + 2.753380.270.90
Isoamyl acetate0.99522.5–75y = 6.30593x + 9.952250.471.57
* LOD-limit of detection, ** LOQ-limit of qualification.
Table 3. Accuracy, precision, uncertainty, inter-day, and intra-day precision of the method.
CompoundSpike Level (mg/L)Accuracy (%)Precision (CV a, %)U b (%)IP c (%)InP d (%)
Methanol75
150
87–103
90–98
3.77
2.94
11.18
16.30
4.95
3.00
4.89
2.88
Acetaldehyde25
50
89–101
88–100
4.71
3.82
17.11
17.57
4.12
3.72
4.06
3.80
Isopropanol25
50
91–113
85–108
6.88
6.90
16.59
16.24
6.84
6.93
6.81
6.74
n-Propanol25
50
94–107
89–105
4.36
5.40
11.74
16.38
4.00
5.46
4.08
5.25
Ethyl acetate25
50
90–101
90–102
4.28
4.03
14.67
13.59
4.07
3.33
4.22
3.41
2-Butanol25
50
89–107
82–99
6.29
5.74
13.07
21.38
5.94
5.46
5.84
5.70
Isobutanol25
50
88–103
92–102
4.72
3.79
16.46
13.56
3.82
3.32
4.44
3.27
n-Butanol25
50
88–105
88–104
5.72
5.99
13.56
17.31
5.24
6.05
5.22
5.92
Isoamyl alcohol50
100
89–104
89–105
5.70
5.11
16.14
15.50
5.74
4.97
5.52
4.96
n-Pentanol25
50
89–106
82–98
6.09
5.57
13.52
22.70
3.68
5.21
5.39
5.43
Isoamyl acetate12.5
25
92–106
95–110
5.73
4.26
13.41
18.67
4.76
4.02
4.76
4.07
a CV-coefficient of variation, b U-expanded uncertainty, c IP-inter-day precision, d InP-intra-day precision.
Table 4. Content of the volatiles in analyzed wines’ samples.
CompoundSample No./Content (mg/L)
123456
Methanol152.05 ± 7.55 e182.98 ± 9.42 g180.78 ± 9.02 g120.02 ± 6.06 c151.12 ± 7.51 e137.69 ± 6.77 d
Acetaldehyde7.22 ± 0.37 b6.37 ± 0.33 a12.14 ± 0.63 e17.00 ± 0.88 g31.82 ± 1.59 i13.55 ± 0.70 f
Isopropanol1.96 ± 0.10 e1.43 ± 0.07 c1.13 ± 0.05 bnd *1.62 ± 0.08 dnd
n-Propanol26.88 ± 1.35 e15.69 ± 0.78 b36.32 ± 1.79 g12.87 ± 0.65 a14.36 ± 0.72 b12.44 ± 0.63 a
Ethyl acetate71.17 ± 3.66 c52.18 ± 2.59 b60.01 ± 2.91 b41.06 ± 2.16 a52.97 ± 2.72 b48.99 ± 2.42 b
2-Butanolndndndndndnd
Isobutanol37.45 ± 1.93 c35.57 ± 1.74 c43.01 ± 2.06 d43.35 ± 2.10 d43.59 ± 2.13 d52.16 ± 2.71 d
n-Butanol4.15 ± 0.22 b18.42 ± 0.95 f4.01 ± 0.20 b13.37 ± 0.68 e13.04 ± 0.65 e3.56 ± 0.18 a
Isoamyl alcohol202.94 ± 10.43 b196.49 ± 9.66 b329.39 ± 15.69 d205.48 ± 10.05 b311.95 ± 15.03 d303.74 ± 15.89 d
n-Pentanol2.19 ± 0.11 b2.20 ± 0.11 bNdndnd2.13 ± 0.11 b
Isoamyl acetate0.20 ± 0.01 end0.29 ± 0.01 g0.42 ± 0.02 h0.49 ± 0.02 ind
HA275.57 ± 13.10 b269.8 ± 12.95 b413.86 ± 19.83 f275.07 ± 13.55 b384.47 ± 19.06 e374.03 ± 17.90 e
CompoundSample No./Content (mg/L)
789101112
Methanol141.79 ± 7.31 d137.13 ± 6.83 d227.47 ± 11.73 h242.84 ± 11.59 i237.72 ± 12.44 h195.40 ± 9.80 g
Acetaldehyde19.87 ± 0.95 h20.71 ± 1.08 h10.92 ± 0.55 d37.05 ± 1.83 j37.39 ± 1.95 j29.54 ± 1.51 i
Isopropanol1.86 ± 0.10 e1.65 ± 0.08 d1.38 ± 0.07 cnd1.25 ± 0.06 c1.37 ± 0.07 c
n-Propanol18.72 ± 0.94 c34.09 ± 1.64 g21.62 ± 1.08 d25.32 ± 1.22 e26.84 ± 1.39 e14.17 ± 0.71 b
Ethyl acetate63.13 ± 3.10 b55.18 ± 2.64 b121.09 ± 6.15 d33.35 ± 1.73 a39.82 ± 2.00 a55.32 ± 2.70 b
2-Butanolndndndndndnd
Isobutanol44.49 ± 2.32 d45.61 ± 2.23 d42.78 ± 2.06 d54.29 ± 2.74 d61.49 ± 3.20 e44.83 ± 2.30 d
n-Butanol4.15 ± 0.22 b4.05 ± 0.20 b4.07 ± 0.21 b7.05 ± 0.36 c3.99 ± 0.20 b4.34 ± 0.21 b
Isoamyl alcohol276.38 ± 14.41 c258.08 ± 12.50 c178.72 ± 8.82 b398.56 ± 20.11 e455.92 ± 23.72 f313.53 ± 15.81 d
n-Pentanol2.18 ± 0.11 b2.21 ± 0.11 b2.16 ± 0.11 bndndnd
Isoamyl acetate0.31 ± 0.02 gnd0.07 ± 0.00 c0.36 ± 0.02 gnd0.33 ± 0.01 g
HA347.69 ± 17.12 d345.69 ± 17.01 d250.73 ± 12.88 b485.22 ± 24.97 g549.49 ± 27.33 h378.24 ± 18.98 e
CompoundSample No./Content (mg/L)
1314151617
Methanol170.73 ± 8.69 f163.1 ± 8.12 f93.18 ± 4.73 b253.45 ± 12.22 i65.92 ± 3.37 a
Acetaldehyde18.79 ± 0.90 h16.91 ± 0.87 g8.75 ± 0.44 c12.29 ± 0.61 e38.41 ± 1.83 j
Isopropanol1.35 ± 0.07 c2.11 ± 0.10 e1.47 ± 0.08 c1.26 ± 0.06 c1.46 ± 0.08 c
n-Propanol30.19 ± 1.44 f19.21 ± 0.95 c25.58 ± 1.23 e24.69 ± 1.17 e22.34 ± 1.12 d
Ethyl acetate36.27 ± 1.82 a53.05 ± 2.54 b45.28 ± 2.29 a42.37 ± 2.16 a33.84 ± 1.75 a
2-Butanolndndndndnd
Isobutanol35.93 ± 1.83 c42.73 ± 2.06 d24.91 ± 1.20 b49.02 ± 2.57 d22.03 ± 1.15 a
n-Butanol4.72 ± 0.25 b4.15 ± 0.21 b9.69 ± 0.49 d13.29 ± 0.67 e4.00 ± 0.21 b
Isoamyl alcohol291.54 ± 14.92 d253.34 ± 12.69 c359.69 ± 18.52 d322.78 ± 16.27 d145.74 ± 7.10 a
n-Pentanol2.15 ± 0.11 b2.17 ± 0.10 bnd2.18 ± 0.11 b2.15 ± 0.11 b
Isoamyl acetate0.01 ± 0.02 b0.15 ± 0.00 d0.07 ± 0.00 c0.88 ± 0.04 j0.23 ± 0.01 f
HA365.88 ± 17.46 e323.71 ± 15.53 c421.34 ± 20.73 f413.22 ± 21.03 f197.72 ± 9.83 a
* Means values in the same column with different superscript are statistically different at p ≤ 0.05 level, according to post hoc Tukey-s HSD test. nd—not detected, HA—higher alcohols.
Table 5. Correlation matrix of higher alcohol content in wine samples.
MethanolEthanolIsopropanoln-
Propanol
Ethyl
Acetate
Isobutanoln-
Butanol
Isoamyl
Alcohol
n-
Pentanol
Isoamyl
Acetate
Acetaldehyde0.0600.218−0.150−0.053−0.4320.256−0.2410.342−0.3900.117
Methanol 0.669+−0.1290.1470.2020.704 +0.0610.458 **−0.1060.257
Ethanol −0.0720.1790.3170.741 +−0.527 *0.2990.171−0.086
Isopropanol 0.2390.306−0.379−0.152−0.2370.372−0.105
n-Propanol −0.017−0.039−0.3780.2470.031−0.153
Ethyl acetate 0.002−0.223−0.3920.272−0.172
Isobutanol −0.1340.589 *−0.2240.144
n-butanol −0.091−0.1540.377
Isoamyl alcohol −0.600 *0.089
n-pentanol −0.204
+ Correlated, statistically significant at p < 0.01 level; * Correlated, statistically significant at p < 0.05 level; ** Correlated, statistically significant at p < 0.10 level.
Publisher’s Note: MDPI stays neutral with regard to jurisdictional claims in published maps and institutional affiliations.

