Article

Using Macronutrient Distributions within Trees to Define a Branch Diameter Threshold for Biomass Harvest in Sugar Maple-Dominated Stands

by
Samuel Royer-Tardif
1,2,*,
Sylvain Delagrange
1,2,
Philippe Nolet
1,2 and
David Rivest
1,2
1
Département des sciences naturelles and Institut des sciences de la forêt tempérée (ISFORT), Université du Québec en Outaouais, 58 rue Principale, Ripon, QC J0V 1V0, Canada
2
Centre d’étude de la forêt, Université du Québec à Montréal, P.O. Box 8888, Centre-Ville Station, Montréal, QC H3C 3P8, Canada
*
Author to whom correspondence should be addressed.
Forests 2017, 8(2), 41; https://doi.org/10.3390/f8020041
Submission received: 31 December 2016 / Revised: 6 February 2017 / Accepted: 8 February 2017 / Published: 11 February 2017

Abstract

:
As the use of forest harvesting residues for energy production gains popularity, debate continues regarding the long-term sustainability of whole tree harvesting (WTH). This practice removes nutrient-rich twigs that only account for a small fraction of harvest residues, emphasising the need to develop nutrient-efficient alternatives to WTH. This study assessed N, P, K, Ca, and Mg distributions within sugar maple (Acer saccharum Marshall) and yellow birch (Betula alleghaniensis Britton) branches of various sizes in order to determine the branch diameter threshold that would represent the best compromise between the quantity of harvested biomass and nutrient losses that were generated. Quantities of nutrients that were exported with harvesting were then modelled at the stand level using different biomass harvest scenarios to explore what factors ultimately drove total quantities of nutrients exported with harvest. We found that the branch diameter threshold for biomass harvesting should be set at 2 cm for most nutrients in both tree species. An exception was Mg in yellow birch, for which the harvesting of branches larger than 10 cm would always generate larger nutrient export than gains in terms of biomass. At the stand scale, we provide evidence that the intensity of biomass harvest (i.e., the number of branch compartments harvested) is the principal factor responsible for the quantity of nutrient that is exported with harvesting.

1. Introduction

Interest is rising worldwide regarding the use of forest harvest residues (foliage, twigs, and branches, hereafter referred to as biomass) for energy production. These residues represent an abundant, readily available, and renewable resource that could reduce our dependency on fossil fuels [1]. Yet the sustainability of harvesting forest biomass has been questioned, since it may affect soil fertility, water quality, carbon balance, and biological diversity [2]. A possible decline in forest productivity, which would be caused by the removal of nutrient-rich biomass, likely represents the most important of these concerns [3,4].
Shade-tolerant hardwood forests of northeastern North America could be an attractive locale for the biomass industry due to the abundance of large branch residues (diameters as great as 10 cm), combined with their proximity to industrial facilities. Also, hardwood residues are denser than those of softwoods and provide more energy for the same volume of wood. Residue removal remains marginal in these temperate hardwood forests, but this practice could become more common as incentives for reducing the use of fossil fuels increase and as international markets for biomass develop.
Field studies assessing the sustainability of biomass harvest in shade-tolerant hardwood forests have been limited to comparing nutrient losses under whole-tree harvesting (WTH) and stem-only harvesting (SOH) scenarios. Worldwide reviews indicate that WTH may deplete soil nutrients and carbon pools, and impair long-term forest productivity [4,5], thereby bolstering arguments against biomass harvesting. Indeed, WTH is not a nutrient-efficient strategy for harvesting biomass, as it also removes nutrient-rich twigs and leaves that only represent a small fraction of tree biomass. There is thus a need to develop nutrient-efficient alternatives to WTH that would represent the best compromise between the quantity of harvested biomass and the quantity of nutrients that are lost. Because the concentrations of most tree nutrients have been shown to increase as branch diameter decreases [6,7], this compromise could be based upon the diameter of branches to be harvested. As such, tree branches could be harvested as long as their nutrient compositions do not differ significantly from that of the stem.
Despite an extensive body of literature on nutrient concentrations in stems and branches of North American tolerant hardwoods (reviewed in [8,9]), little is known about the distribution of their nutrients among branches of differing diameters. This relationship has been explored for different European hardwood species [10,11], thereby revealing an exponential decrease of most macronutrient concentrations with increasing roundwood diameter. However, these studies did not use nutrient contents to quantitatively define the branch diameter corresponding to the best compromise between biomass and nutrient exports. Based upon actual knowledge, we could expect a branch diameter threshold to vary according to the nutrient and the tree species being considered. Indeed, N and P are generally found in large concentrations within young shoots and foliage [12,13], whereas base cations such as Ca and Mg may be more evenly distributed within trees [12]. Also, sugar maple (Acer saccharum Marshall) and yellow birch (Betula alleghaniensis Britton), which are two dominant species in shade-tolerant hardwood forests, differ in their nutrient compositions. Base cations, in particular, are found in greater concentrations in sugar maple stems [8,14].
Although research efforts have focused upon biomass harvesting after clear-cutting, tolerant hardwood forests are mainly managed through partial cuts of various intensities and frequencies [15,16]. Different tree marking procedures that select the trees to be harvested could alter the nutrient efficiency of biomass harvesting, given that they determine the size of the trees to be felled during partial cuts and, therefore, total nutrient export. Yet it remains unclear as to the extent that factors related to harvesting practices (partial harvest and tree marking) may be important in determining the absolute amount of nutrients exported and if they matter more than do nutrient concentrations, thereby rendering a branch diameter threshold less valuable.
Here, we report on a study where N, P, K, Ca, and Mg distributions were measured within four tree compartments: stems (>10 cm in diameter); and large- (5–10 cm), medium- (2–5 cm), and small-diameter (<2 cm) branches. These elements were measured in 24 sugar maples and 24 yellow birches of various DBH (diameter at breast height, 1.3 m). We first explored, at the scale of individual trees, how each nutrient was distributed within branches of different diameters. We then used these results to model nutrient export under biomass harvesting scenarios that varied according to the intensity of biomass harvest, stand composition, and the marking procedure that was employed for tree selection. Our objectives were (1) to define a branch diameter threshold for biomass harvest; and (2) to evaluate how this threshold may vary according to the nutrient and the tree species considered. We also used a modelling approach to estimate, at the stand scale, the quantities of nutrients that should be exported with various intensities of biomass harvest (from SOH to WTH) and under different harvesting scenarios.
We expect the concentrations of N and P to vary more among branch size classes than base cations. Accordingly, we hypothesised that the branch diameter threshold would be more restrictive (larger branches) for N and P in comparison to the threshold for base cations.

2. Materials and Methods

2.1. Study Area and Stand Selection

The study area is part of the sugar maple-yellow birch bioclimatic domain of Quebec, Canada [17]. This domain also contains American beech (Fagus grandifolia Ehrh.), eastern hemlock (Tsuga canadensis [L.] Carr.), basswood (Tilia americana L.), and red oak (Quercus rubra L.) as principal tree species. It represents the northern limit of the eastern North American deciduous forest. Windthrow is the principal natural disturbance driving the dynamics of these forests. Sampling was conducted in two regions of southern Quebec, which consisted of the Laurentides (46°32’27” N, 75°41’38” W) and Outaouais (46°01’34” N, 75°20’05” W) administrative regions. Mean annual temperatures are 4.1 and 4.5 °C, and total annual precipitation is 997.2 and 1091.1 mm for the Laurentides and Outaouais regions, respectively [18]. The study area is located on the Grenville formation, with the Laurentides and Outaouais regions being characterised by mafic to ultramafic and sedimentary rocks, respectively. Soils were Humo-Ferric Podzols, which had developed over sandy loam glacial tills. Bulk pH ranged from 4.0 to 5.4 [19]. One uneven-aged (>70-years-old) sugar maple stand was selected in each region. Each stand had been partially harvested at least 15 years before tree sampling, which allowed sampling along a gradient of tree sizes. Relative basal area of yellow birch was ≥30% in each stand.

2.2. Tree Sampling and Compartment Measurements

Sampling was performed from November to December 2010, about one to two months after leaf fall. This period of the year is commonly prioritized for biomass harvesting to limit nutrient export associated with leaf removal. For each stand, each tree (without major branch loss) within a 1 ha plot was assigned to one of the following DBH (diameter at breast height, 1.3 m) classes: 14–18; 19–23; 24–29; and 30–35 cm. Three individuals per species were then randomly selected within each DBH class, yielding a total of 24 trees per stand (12 per species). Selected trees were cut as close as possible to the ground surface. Tree height and merchantable stem length (i.e., up to a diameter of 10 cm) were then measured. A stem disc section at stump height (<30 cm) was also collected for age determination by ring counting. Trees were then separated into four compartments, with all diameter measurements being taken over bark: (1) stem (diameter > 10 cm); (2) large branches (10–5 cm); (3) medium-size branches (5–2 cm); and (4) small branches (<2 cm).
Compartment size was determined according to its total dry mass (oven-dried at 50 °C). Branch compartments were weighed individually with an electronic scale (−150 kg ± 0.1 kg). Stem mass was calculated as the product of stem fresh volume and stem density. Stem fresh volume (V, m3) was determined as the volume of a truncated cone:
V = 1 3 π ( r 1 2 + r 1 r 2 + r 2 2 ) h
where r1 is diameter (cm) at stump height, r2 is the diameter at the end of the cone (10 cm), and h is stem length (m, between r1 and r2). Stem density (kg·m−3) was calculated as the weighted average of stem bark and stem wood densities, according to their respective proportions (on a dry-mass basis) in the stem compartment. These proportions were derived from the allometric equations that were provided by Lambert et al. [20] by (1) calculating stem bark and stem wood dry biomass corresponding to the tree measurements (DBH and height); (2) summing them to yield total stem biomass; and (3) computing the ratio of stem bark and stem wood to total stem biomass. The density of each stem constituent (bark and wood) was determined as the ratio of dry mass (dried at 50 °C to constant mass) over volume (determined by the water displacement method) on subsamples that were taken from a 10 centimetre-thick disc section that had been collected at breast height. Branches that were greater than 10 cm in diameter were cut at their insertion point on the stem, weighed directly on the electronic scale, and assigned to the stem compartment. All mass measurements that were taken in the field were corrected for moisture content using density (oven-dried mass over fresh volume; kg·m−3) of subsamples for each tree compartment.
We used the allometric equations of Lambert et al. [20] to validate our measurements of total tree mass. Validation could not be performed on stem and branch compartments alone, as the definition that was provided by the previous authors differed from our study. However, both methods yielded highly correlated results (R2 = 0.92 for sugar maple; R2 = 0.95 for yellow birch) for total tree mass. The biomass estimates in the present study were consistently higher than those reported using allometric equations, but never exceeded the variability predicted when including standard errors of the coefficients in the computation (see Figure S1 for more details). Table 1 presents average biomass of each tree compartment for both tree species and each of the four DBH classes.

2.3. Nutrient Content Analyses

Samples from each tree compartment (stem wood and stem bark from the 10 centimeter-thick stem disc at breast height or a bundle of randomly collected branches that weighed ~1 kg) were individually dried at 50 °C to constant dry mass and ground. Total N (Kjeldahl) and P concentrations were quantified following acid digestion (K2SO4, H2SO4, HgSO4) by continuous flow analysis (Technicon, Seal Analytical, Mequon, WI, USA). Total K, Ca, Mg, and Na concentrations were measured by inductively coupled plasma-atomic emission spectrometry (ICP-AES) after acid digestion (nitric acid, H2O2, HCl). Total nutrient content of each tree compartment was calculated as the product of compartment dry mass and nutrient concentration (µg/g). Average nutrient concentrations for the sampled compartments of each tree species are presented in Table 1. These values are consistent with those reported in the literature for sugar maple and yellow birch [8,14], with the exception of N, which falls within the upper range of reported values (see Table S1 for details).

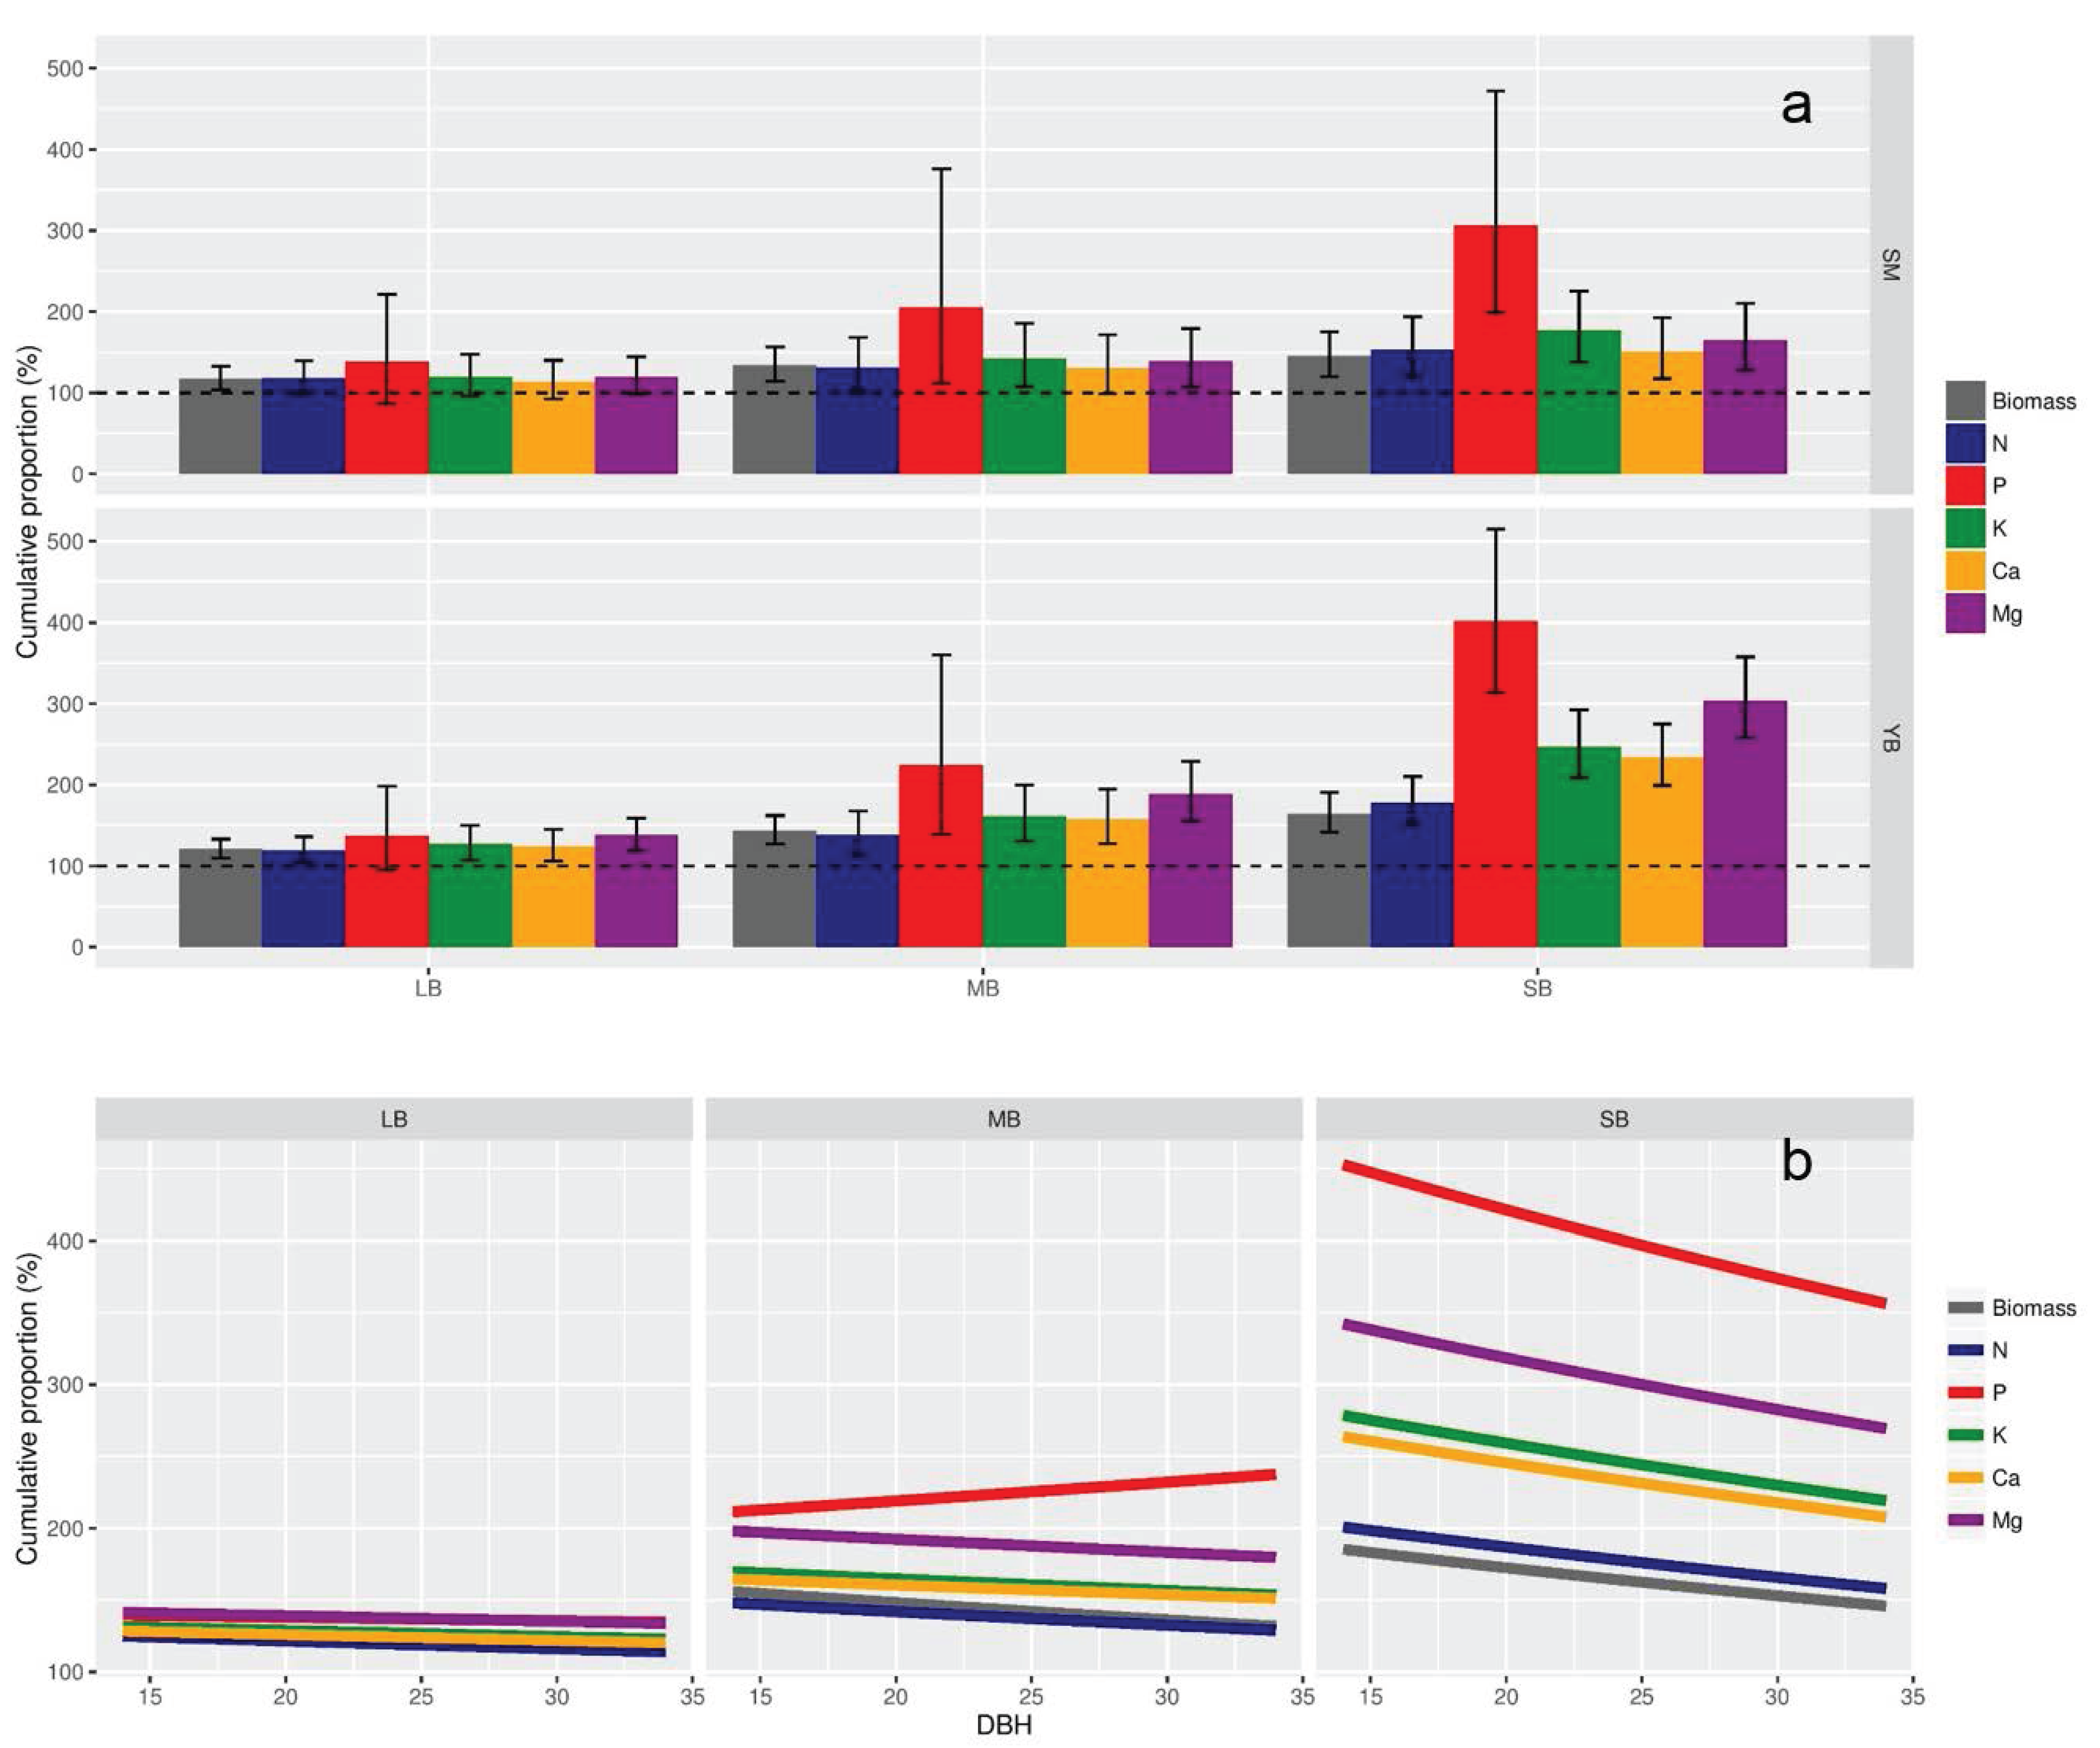
2.4. Cumulative Proportions of Nutrient and Biomass in Branch Compartments

The branch diameter threshold was defined as the minimal branch diameter where nutrient content was proportional to biomass content. This was done by expressing nutrient and biomass contents as the cumulative proportion (CP) in stem and branches relative to the content in the stem. This proportion was computed according to the following equation:
C P n j = Q n s t e m + i = L B j Q n j Q n s t e m × 100
where Qnstem is the quantity of nutrient n in the stem, Qnj is the quantity of nutrient n in the branch compartment j (LB, MB or SB), and i denotes the branch compartment, ranging from large branches (LB) to the small branches (SB). For example, the proportion of nitrogen present in medium branches (5–2 cm in diameter) was expressed as the total amount of nitrogen present in the stem, and the large and the medium branches, divided by the content present in the stem (in percent). This transformation yielded values over 100%, as the content in the stem was present in both the numerator and the denominator. These cumulative proportions provide an estimate of how much nutrient or biomass will be exported with branch harvesting relative to SOH. Cumulative proportions were further used in mixed-models to detect significant differences between nutrient and biomass proportions within each branch compartment. This procedure compared biomass and all nutrients on the same scale. Modelling the raw data could not account for the wide variability in the concentrations that were measured, even using alternative variable distributions or transformations.

2.5. Modelling Nutrient Removal with Harvest

Using the nutrient distributions from the 48 sampled trees, we modelled virtual pure sugar maple and mixed sugar maple-yellow birch stands to assess nutrient export with harvesting. These stands (1 ha in area) were composed of 680 virtual trees that were distributed along a DBH gradient: 12, 18, 24, 30, 36, and 40 cm. The number of virtual trees for each DBH class was 250, 170, 110, 70, 50, and 30, respectively. For mixed stands, tree density for each DBH class was equally distributed between sugar maple and yellow birch. A permutation procedure was used to create 1000 virtual stands of each type (pure or mixed). For each of the 680 virtual trees within a stand, this procedure assigned a total tree mass according to species-specific exponential regressions with tree DBH values that were extrapolated from our data (sugar mapletotalmass = 0.2603 × DBH2.2821, R2 = 0.97; yellow birchtotalmass = 0.2085 × DBH2.3579, R2 = 0.97). The permutation procedure then identified the six trees from our database with the closest DBH values (considering tree species), selected one of them randomly, and assigned its nutrient distribution among the compartments in the virtual tree. These steps were repeated 680 times to complete a virtual stand. This permutation procedure was preferred to averaging nutrient distributions across DBH classes because we wanted to preserve the variation that was observed in our dataset to build our modelled stands. Pure and mixed stands that were generated by this procedure are representative of uneven-aged hardwood stands in northeastern North-America, with respect to tree density and allocation among DBH classes.
Partial harvests in tolerant hardwood forests are performed either by diameter-limit or by selection cuts. Diameter-limit cuts select all trees above a specified DBH, generally harvesting between 25% and 35% of the stand basal area. Selective cuts select individual trees within all DBH classes to retain stand structure equal to that observed prior to the intervention [15]. For each virtual stand that was created, we simulated both selection and diameter-limit cuts with four different biomass harvest intensities: whole-tree harvesting (WTH); harvesting of all parts with a diameter >2 cm (stem + large and medium-size branches: SLMH); harvesting of all parts with a diameter >5 cm (stem + larges branches: SLH); and stem-only harvesting (SOH). A total of 16,000 stand harvests were thus computed in a factorial design: two stand compositions (pure maple or mixed maple-birch), two tree marking procedures (selection vs. diameter limit cutting), and four biomass harvest intensities (WTH, SLMH, SLH, and SOH). For each scenario, the partial harvest was performed at a rate of 30% of the stand basal area. All stand modelling was performed in R (v.3.2.3 [21], R Core Team, Vienna, Austria).

2.6. Statistical Analyses

Cumulative proportions of nutrient and biomass were compared and modelled as a function of tree size and tree species using linear mixed-effects models to account for the random effects of individual trees. A random effect of the region could not be estimated, given that only two regions were sampled. Model selection was performed in the R statistical environment (v.3.2.3 [21], R Core Team, Vienna, Austria) according to a ten-steps backward selection protocol [22]. The data from each compartment were modelled independently because of the many potential interactions when branch compartment was included as a factor, the failure of the resulting model to converge, and because of considerable variability among branch compartments that could not be modelled adequately. Each of the resulting three models was first fitted by generalized least squares, with only a fixed component including tree DBH (continuous), tree species (a factor with two levels), and branch parameter (a factor with six levels; branch biomass and the five nutrients), together with all possible two- and three-way interactions. This full fixed effect model was then compared using a likelihood ratio test with the full random effect model that also included a random intercept for each individual tree. Once the random structure was identified, a step-wise procedure, using likelihood ratio tests, was applied to retain only significant terms in the final model. Significant differences between the cumulative proportion of each nutrient and biomass were then assessed using treatment contrasts with biomass as the reference level. To respect normality assumptions, cumulative proportions had to be log-transformed, and heterogeneity was allowed between each combination of nutrient and tree species using a varIdent option (see Chapter 4 in [22]).
At the stand level, we compared the influence of harvest intensity, tree marking procedure, and stand composition in determining the quantity of nutrients that were exported by including all three factors and their resulting interactions in a three-way ANOVA. Due to the high number of permutations (n = 16,000), p-values were not indicative of variable importance in the model. Rather, we based our interpretation of the results on the proportion of the variance that was explained. This proportion was defined as the sums-of-squares that were associated with the term of interest, divided by the total sums-of-squares, and returned as a percentage. All terms exhibiting a proportion of variance that explained more than 1% were included for graphical interpretation. All statistical procedures were performed in R (v.3.2.3 [21]), with mixed-effects models computed in the nlme package [23]. Graphical analyses were performed with the ggplot2 package [24].

3. Results

3.1. Cumulative Proportion of Nutrients and Biomass at the Tree Scale

The mixed-model selection procedure yielded the same model structure for large and medium branches, i.e., including the interaction between branch parameter and tree species, as well as the interaction between branch parameter and tree DBH (Table 2 and Table S2). In the small branches model, however, this last interaction was not significant and was thus removed. For sugar maple, pairwise comparisons indicated that the cumulative proportions of the five nutrients were significantly higher than that of biomass in small branches (Table 2 and Figure 1a). The same pattern was observed for yellow birch with the exception of Mg, for which the cumulative proportion was also significantly higher than that of biomass in large and medium branches. Other significant comparisons indicated lower cumulative proportions of Mg in large branches and Ca in large and medium branches of sugar maple, and of N in yellow birch medium branches.
Apart from the interaction with tree species, the branch parameter term interacted with tree DBH in determining the cumulative proportions in large and medium branches, but not in small branches (Table 2 and Figure 1b). The cumulative proportion of all nutrients in branch compartments decreases with tree DBH, indicating that the stem represents a growing pool of nutrients as the size of the tree increases. P in medium branches is one exception, where its cumulative proportion slightly increased with DBH. However, this last slope was barely significant with a p-value of 0.0475 (Table S2).

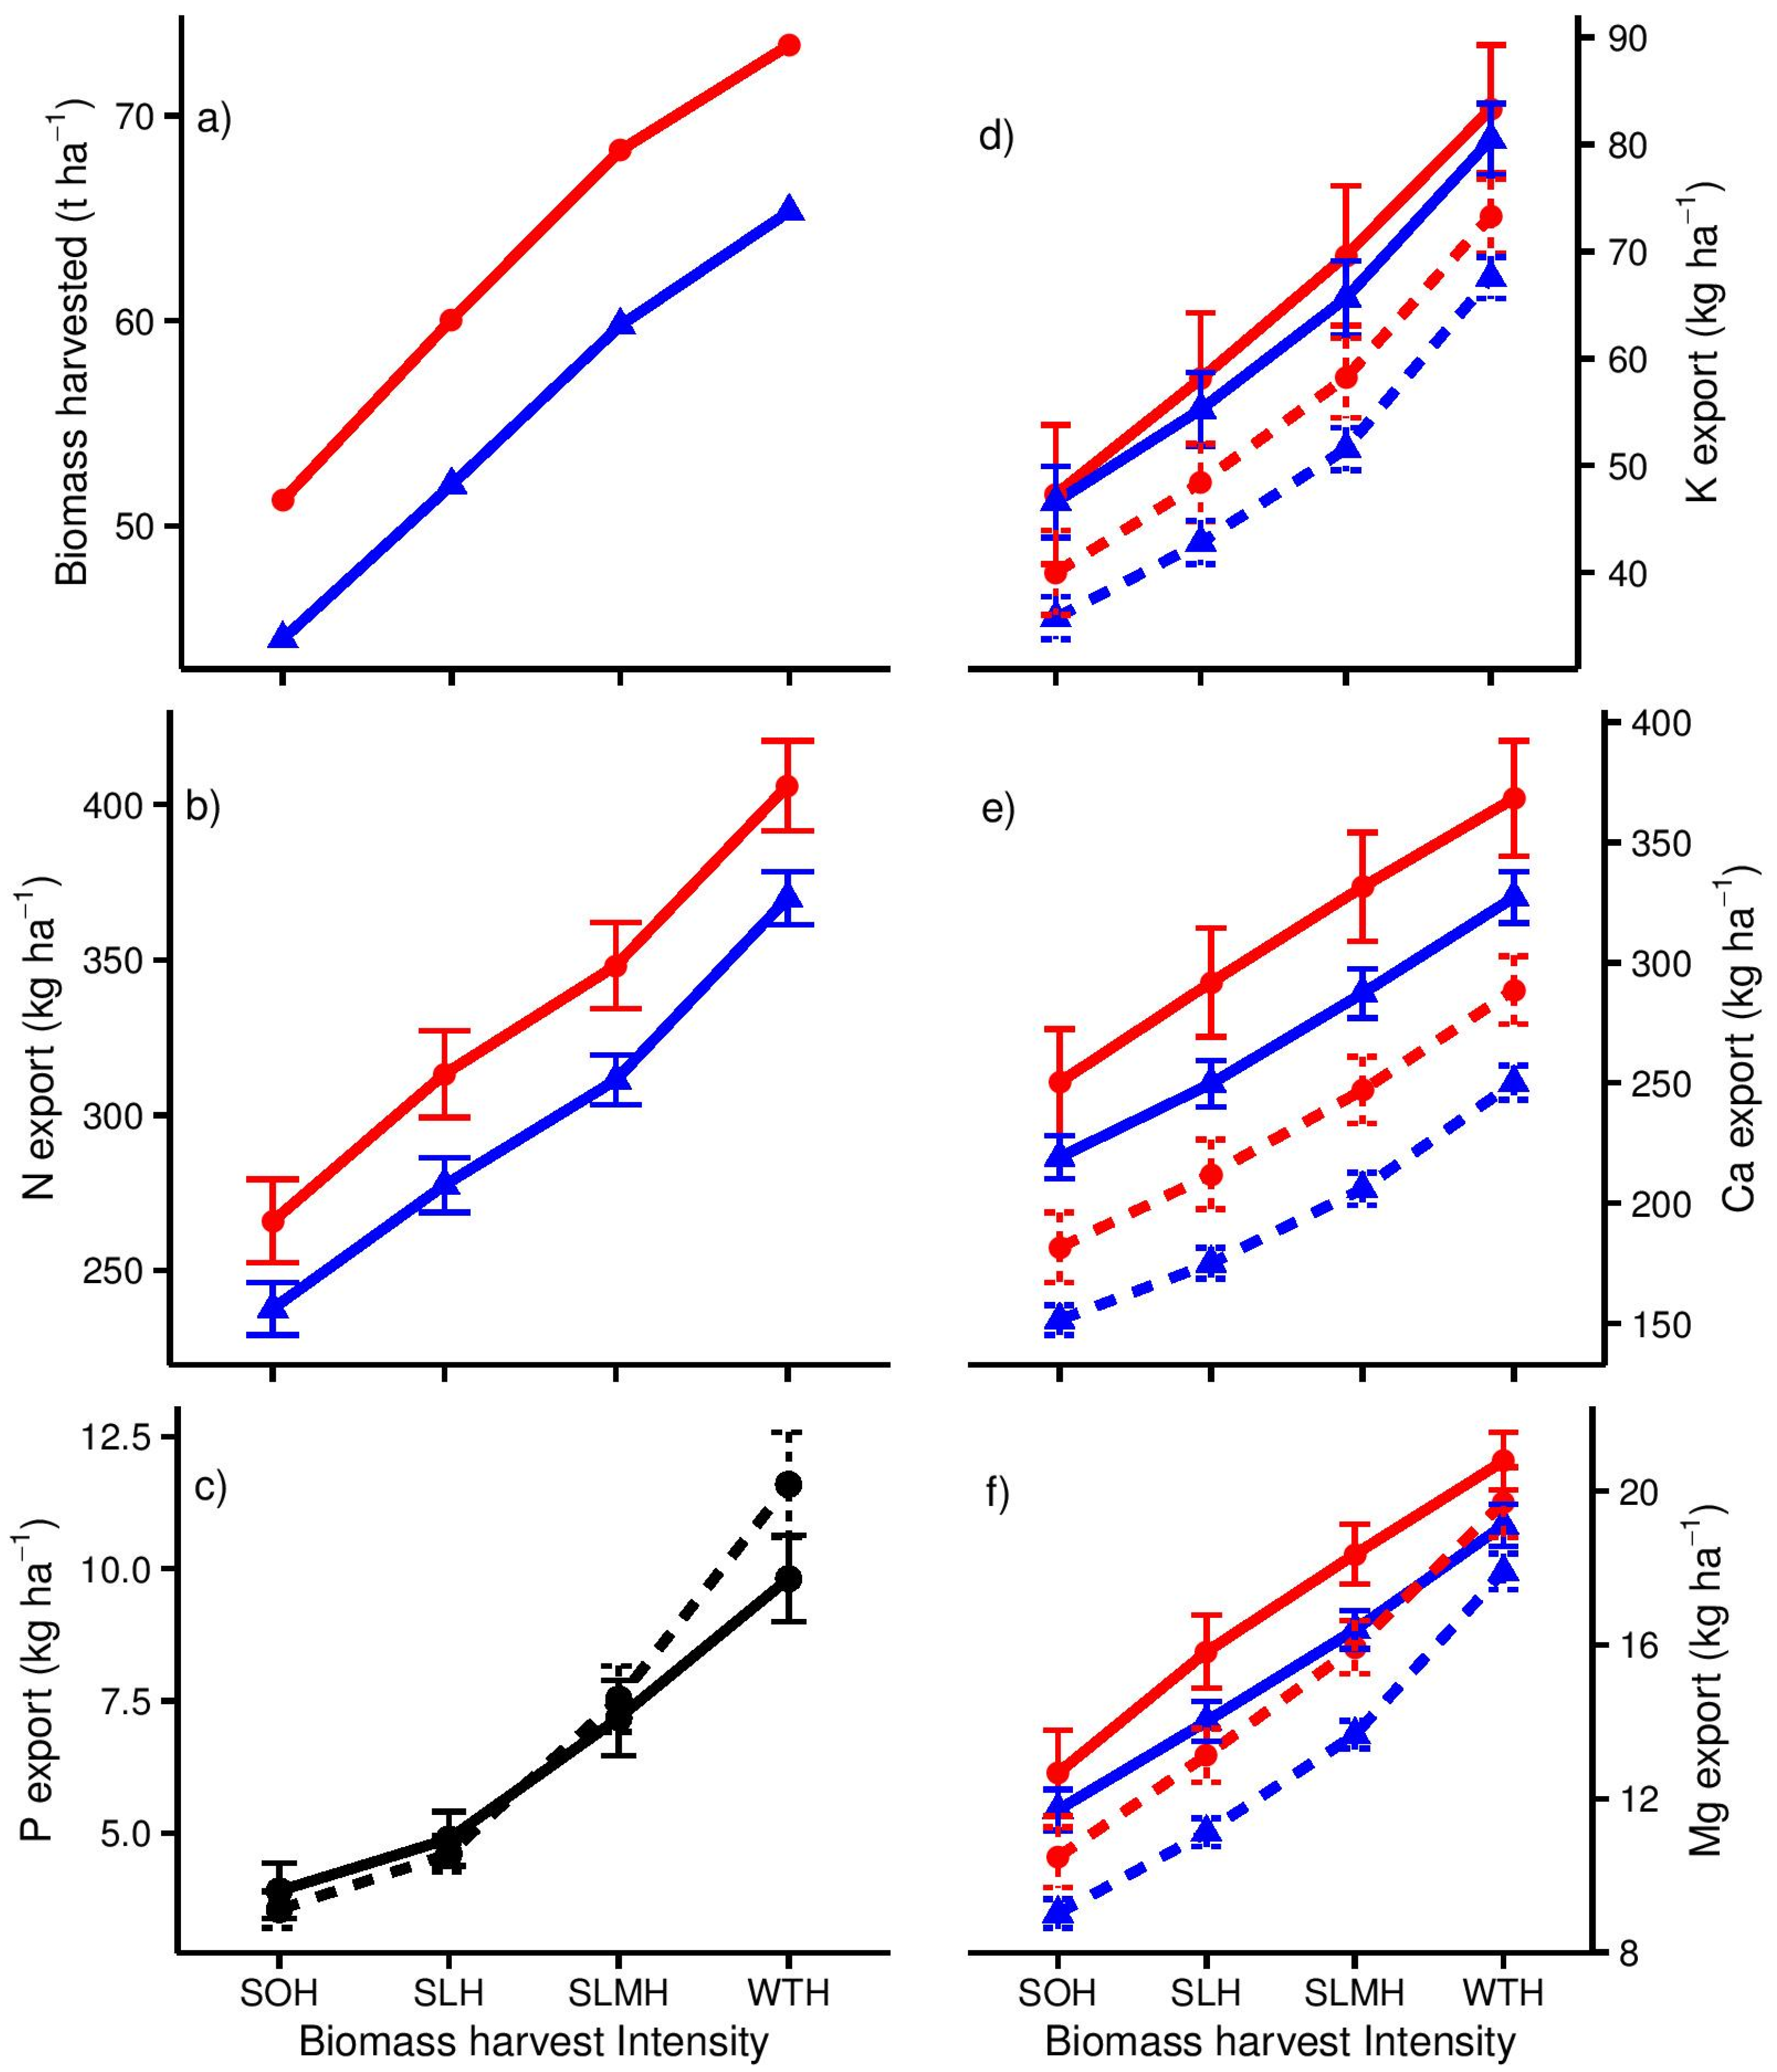
3.2. Nutrient Export with Different Biomass Harvest Scenarios

Biomass harvest intensity was the main factor determining the quantity of biomass and nutrients that were exported with harvest, as it explained more than 75% of the variation in N, P, K, and Mg export with harvest (Table 3). An exception was Ca, for which stand composition was almost equally as important in determining the amount exported. The biomass and N that were exported with harvest were also influenced by tree marking procedure, which respectively explained 18.73% and 10.08% of the variation in the two response variables. Phosphorus export was almost entirely determined by harvest intensity, but a small fraction (2.32%) was also related to stand composition. In addition to harvest intensity and stand composition, all three base cations (K, Ca, and Mg) were influenced by the tree marking procedure, but with only 2% to 10% of the variance explained by this last factor.
WTH increased N, K, Ca, and Mg export by 150% to 200% compared to SOH (Figure 2). In contrast, phosphorus export with WTH was more than three-fold higher than exports that were reported with SOH. This pattern is similar to that observed with cumulative proportions at the tree level. For all nutrients except P, diameter-limit cutting increased nutrient export as a result of the larger amount of biomass that was harvested with this method. Harvesting biomass in mixed stands yielded smaller amounts of exported base cations, but showed slightly more P that was exported with WTH.

4. Discussion

4.1. Defining a Branch Diameter Threshold Based on Nutrient Distribution at the Tree Scale

Our findings suggest that a branch diameter threshold, which was based upon the best compromise between the quantity of biomass that was harvested and nutrient exports, should be set at 2 cm for both tree species and all five nutrients. However, for Mg in yellow birch biomass, branches smaller than 10 cm should not be harvested if this nutrient is of concern for forest productivity. This last nutrient represented a greater cumulative proportion than biomass in all branch compartments from yellow birch. On average, a pattern similar to Mg was observed for P in medium branches of both tree species. However, large variation in branch P content prevented this nutrient from being differentiated from biomass cumulative proportion.
The total content of P in branch and stem compartments was more strongly correlated with its concentration (R2 = 0.64) than with the biomass of these compartments (R2 = 0.33). As a result, P was the nutrient exhibiting the greatest cumulative proportions within all branch compartments, especially small branches (300%–400%; Figure 1). High P content in tree branches has also been reported in a 70-year-old northern hardwood forest in New Hampshire [25]. Using data from this last study to compute the cumulative proportion of P in the whole tree (i.e., the ratio of WTH/SOH P export) yielded a value of 280% (see Table S3). Similarly, a review for Canadian tree species reported average P concentrations in branches that were two to three times greater than in stem bark [8].
The quantity of base cations (K, Ca, and Mg) that were contained in a compartment was more strongly related to the biomass of the compartment (K, R2 = 0.87; Ca, R2 = 0.86; Mg, R2 = 0.86) than to their tissue concentrations (K, R2 = 0.01, Ca, R2 = 0.13; Mg, R2 =0.04). As a result, the stem remains the principal pool of these nutrients, especially for sugar maple. These findings are consistent with those of Tremblay et al. [26], who reported that more base cations were stored in stems than branches and foliage combined in a sugar maple-dominated forest (data available in Table S3). However, for yellow birch, our results suggest that branches form a pool of base cations that is equally or more important than that for the stem. Such a discrepancy between tree species can be explained by lower base cation concentrations in stems of yellow birch compared to sugar maple. This pattern was observed not only in our data (Table 1), but also has been reported in the literature [14,27]. In addition, yellow birch tends to allocate more of its biomass to branches than to the stem in contrast to sugar maple, a pattern that was also observed in our data (Table 1) and from biomass estimates of general allometric equations [20]. Yang et al. [14] also provided evidence of greater Mg concentrations in yellow birch branches that were 0–3 cm in diameter compared to sugar maple. These reasons could possibly explain why a different branch diameter threshold (i.e., 10 cm diameter branches) was defined for Mg in yellow birch branches compared to sugar maple.
It was initially expected that N distributions within tree compartments would follow patterns similar to those of P, i.e., being principally related to its tissue concentration. As in the case for base cations, our results demonstrate that N content was more strongly related to compartment biomass (R2 = 0.97) than to its concentration (R2 = 0.03). Even if high N concentrations were found in small branches, large values were also observed in stem bark and wood, which would explain why large quantities of N were observed in stem compartments (Table S2). Other studies in temperate hardwood forests have also found that tree stems, especially stem bark and sapwood, may contain large quantities of N [9,28].

4.2. Estimating Nutrient Export with Harvest at the Stand Scale

The results of our modelling approach indicate that the importance of harvesting practices on nutrient export essentially depends upon the nutrient distribution within trees. Nutrients that are more concentrated within the branches, such as P, will be more strongly influenced by the intensity of biomass harvest than by any other variable. Conversely, nutrients that are more concentrated within the stem, such as Ca, are also determined by the tree marking procedure, which ultimately influenced the size of tree trunks that were harvested. Moreover, because Ca and other base cations were in greater concentrations within sugar maple stems, stand composition also had an influence on final export with harvest. However, it is worth mentioning that the statistical weight of stand composition may vary according to the species composing the stands. For example, this weight is likely to be greater in mixed hardwood-softwood forests due to larger differences in nutrient composition than between sugar maple and yellow birch [8].
Exports of P, K, Ca, and Mg that were predicted by our modelling approach fall within the upper range of values that have been previously reported in sugar maple-dominated forests, which were harvested by SOH and WTH. Our results for these nutrients correspond roughly to one-third of estimates from previous studies [25,26,29] that used clear-cut harvests, as opposed to our partial cutting approach (reported values from these references are provided in Table S3). Estimates of N exports with harvest were larger than those reported previously [25,29], as would be expected given the high N concentrations that were measured in our samples (see Table S1 for details). Yet, regardless of this discrepancy, our results are comparable to these previous studies regarding the ratio of nutrients that were removed with WTH vs. that removed with SOH (CP in Table S3). This similarity suggests that nutrient distributions within tree compartments are constant across mature stands that are dominated by sugar maple and that the branch diameter thresholds defined here are likely applicable in all of these forests. Conversely, the absolute quantity of nutrients that were exported with harvest is more difficult to generalise across these forests. The results from the modelling approach contained non-trivial variations in nutrient export (Figure 2b–f), despite the fact that our sampling only addresses a limited portion of the range in natural variability (i.e., 48 trees from two locations). Given that greater variability is expected to occur in nature, field experiments attempting to compare the total nutrient export that is associated with different harvesting treatments should plan to sample a large number of replicates. As such, expressing nutrient export as a proportion relative to stem content could be a more reliable tool for planning biomass harvests than nutrient content estimates.

4.3. Implications on Nutrient Pools and Future Forest Productivity

The quantity of Ca that is incorporated in living aboveground biomass has been shown to represent the major fraction of labile Ca in temperate hardwood forests [25,26,30]. Also, acid deposition has been linked to higher Ca leaching from temperate forest soils, thereby yielding negative Ca budgets [31,32,33]. This nutrient is considered to be the most likely to be depleted by harvest operations in the near future [30]. In mature SM-YB stands, annual Ca budgets have been estimated to range between 0.54 [34] and 6.38 kg·ha−1·year−1 [35]. Compared to these budgets, our estimates of Ca export with harvest suggest that Ca pools would be replenished within 48 to 571 years under WTH, and within 31 to 371 years under SOH (Table S4).
Several studies have also identified P as possibly limiting the productivity of temperate hardwood forests [36,37] and multiple sources of evidence indicate that WTH significantly reduces P soil pools [25,38,39]. Estimated P annual budgets in SM-YB forests are between 0.02 [25] and 0.10 kg·ha−1·year−1 [35]. In an exercise similar to that conducted with Ca, P pools would be replenished within 107–535 years after WTH, and 37–185 years after SOH (Table S4).
Considering a rotation length of 30 years between partial harvests, our results suggest that biomass harvest and conventional SOH could potentially deplete Ca and P pools. However, caution should be paid when interpreting changes in nutrient pools that are based on mass balance budgets, as these models do not always depict forest reality, even after careful on-site calibration [40]. Further, nutrient export with harvest may be overestimated in practice as residue removal, on average, only recovers 50% of available forest residues [41]. Nevertheless, our estimates are consistent with the perception that Ca and P forest pools may be depleted by WTH [38,40]. Further studies are required to fully understand the consequences of biomass harvesting on the cycling of nutrients in hardwood temperate forests.

5. Conclusions

To our knowledge, the present study is the first to assess nutrient export with different diameters of branches that are harvested in temperate hardwood forests dominated by sugar maple. In doing so, this study demonstrated that sugar maple and yellow birch branches smaller than 2 cm are rich in N, P, K, Ca, and Mg, while representing a small fraction of the tree biomass; as such, it may not be advantageous to harvest these branches. In contrast, for yellow birch, this threshold was identified at 10 cm for Mg, which is in greater concentration relative to the biomass in all branch compartments. In modelling different intensities of biomass harvest based upon these nutrient distributions, we found that the intensity of biomass harvest is the main factor regulating the quantity of nutrients that are exported, while stand composition and tree marking procedure are important mainly for Ca exports. In addition, our modelling approach revealed that even with a limited sample of the natural range of variability, the results were highly variable, rendering it difficult to accurately predict the total quantity of nutrients that were exported with harvest. Using the proportion of nutrients relative to the stem could be a more reliable approach, given that they exhibit less variability across studies.

Supplementary Materials

The following are available online at www.mdpi.com/1999-4907/8/2/41/S1, Figure S1: Linear regression between total tree biomass that was measured in this study and biomass estimated using equations based on tree DBH and height [20], Table S1: Comparison of nutrient concentrations reported in this study with those provided in Paré et al. [8] for sugar maple and yellow birch stem wood, bark, and branches, Table S2: Mixed model summary for each branch compartment, Table S3: Tree aboveground biomass and nutrient contents for different tolerant hardwood forests in eastern North America, Table S4: Comparison of average nutrient export estimated in this study with nutrient budgets and labile pools provided in the literature for similar sugar maple-dominated stands in northeastern North America.

Acknowledgments

This research was funded by the Ministère des Forêts, de la Faune et des Parcs of Quebec (formerly the Ministère des Ressources naturelles et de la Faune) through the Programme de Mise en Valeur des Ressources du Milieu Forestier, Volet I (closed program), with the collaboration of the Lauzon sawmill, Ressources Forestières (Thurso, QC). S. Royer-Tardif was supported by a postdoctoral scholarship from the CREATE Forest Complexity Modelling program of NSERC (Natural Sciences and Engineering Research Council of Canada). We also thank Régis Pouliot and Serge Raposo for conducting field sampling, Nadia Bergeron for preparing samples for chemical analyses, and Pascal Rochon for programming the modelling approach. We also acknowledge the valuable contribution of William F.J. Parsons for language revision. An anonymous reviewer is thanked for critically reading the manuscript and suggesting substantial improvements.

Author Contributions

S.D. and P.N. conceived, designed, and performed the experiments; S.R.-T. analyzed the data; S.D. and P.N. contributed reagents/materials/analysis tools; S.R-T., S.D., P.N., and D.R. wrote the paper.

Conflicts of Interest

The authors declare no conflict of interest. The founding sponsors had no role in the design of the study; in the collection, analyses, or interpretation of data; in the writing of the manuscript, and in the decision to publish the results.

References

  1. Paré, D.; Bernier, P.; Thiffault, E.; Titus, B.D. The potential of forest biomass as an energy supply for Canada. For. Chron. 2011, 87, 71–76. [Google Scholar] [CrossRef]
  2. Lattimore, B.; Smith, C.T.; Titus, B.D.; Stupak, I.; Egnell, G. Environmental factors in woodfuel production: Opportunities, risks, and criteria and indicators for sustainable practices. Biomass Bioenergy 2009, 33, 1321–1342. [Google Scholar] [CrossRef]
  3. Thiffault, E.; Hannam, K.D.; Pare, D.; Titus, B.D.; Hazlett, P.W.; Maynard, D.G.; Brais, S. Effects of forest biomass harvesting on soil productivity in boreal and temperate forests—A review. Environ. Rev. 2011, 19, 278–309. [Google Scholar] [CrossRef]
  4. Achat, D.L.; Deleuze, C.; Landmann, G.; Pousse, N.; Ranger, J.; Augusto, L. Quantifying consequences of removing harvesting residues on forest soils and tree growth—A meta-analysis. For. Ecol. Manag. 2015, 348, 124–141. [Google Scholar] [CrossRef]
  5. Achat, D.L.; Fortin, M.; Landmann, G.; Ringeval, B.; Augusto, L. Forest soil carbon is threatened by intensive biomass harvesting. Sci. Rep. 2015, 5, 10. [Google Scholar] [CrossRef] [PubMed]
  6. Fahey, T.J.; Hill, M.O.; Stevens, P.A.; Hornung, M.; Rowland, P. Nutrient accumulation in vegetation following conventional and whole-tree harvest of Sitka spruce plantations in North Wales. Forestry 1991, 64, 271–288. [Google Scholar] [CrossRef]
  7. Son, Y.; Gower, S.T. Nitrogen and phosphorus distribution for 5 plantation species in southwestern Wisconsin. For. Ecol. Manag. 1992, 53, 175–193. [Google Scholar] [CrossRef]
  8. Paré, D.; Bernier, P.; Lafleur, B.; Titus, B.D.; Thiffault, E.; Maynard, D.G.; Guo, X.J. Estimating stand-scale biomass, nutrient contents, and associated uncertainties for tree species of Canadian forests. Can. J. For. Res. 2013, 43, 599–608. [Google Scholar] [CrossRef]
  9. Martin, A.R.; Gezahegn, S.; Thomas, S.C. Variation in carbon and nitrogen concentration among major woody tissue types in temperate trees. Can. J. For. Res. 2015, 45, 744–757. [Google Scholar] [CrossRef]
  10. Andre, F.; Ponette, Q. Comparison of biomass and nutrient content between oak (Quercus petraea) and hornbeam (Carpinus betulus) trees in a coppice-with-standards stand in Chimay (Belgium). Ann. For. Sci. 2003, 60, 489–502. [Google Scholar] [CrossRef]
  11. Wernsdorfer, H.; Jonard, M.; Genet, A.; Legout, A.; Nys, C.; Saint-Andre, L.; Ponette, Q. Modelling of nutrient concentrations in roundwood based on diameter and tissue proportion: Evidence for an additional site-age effect in the case of Fagus sylvatica. For. Ecol. Manag. 2014, 330, 192–204. [Google Scholar] [CrossRef]
  12. Larcher, W. Physiological Plant Ecology: Ecophysiology and Stress Physiology of Functional Groups, 4th ed.; Springer: Berlin, Germany, 1995; p. 506. [Google Scholar]
  13. Aber, J.D.; Melillo, J.M. Terrestrial Ecosystems, 2nd ed.; Harcourt Academic Press: New York, NY, USA, 2001; p. 556. [Google Scholar]
  14. Yang, Y.; Yanai, R.D.; Fatemi, F.R.; Levine, C.R.; Lilly, P.J.; Briggs, R.D. Sources of variability in tissue chemistry in northern hardwood species. Can. J. For. Res. 2016, 46, 285–296. [Google Scholar] [CrossRef]
  15. Nyland, R.D. Selection system and its application to uneven-aged northern hardwoods. In Managing Northern Hardwoods: Proceedings of a Silvicultural Symposium, 23–25 June 1986, State University of New York, College of Environmental Science and Forestry, Syracuse, New York; Nyland, R.D., Ed.; SUNY College of Environmental Science and Forestry: New York, NY, USA, 1987; pp. 49–80. [Google Scholar]
  16. Nolet, P.; Doyon, F.; Messier, C. A new silvicultural approach to the management of uneven-aged northern hardwoods: Frequent low-intensity harvesting. Forestry 2014, 87, 39–48. [Google Scholar] [CrossRef]
  17. Robitaille, A.; Saucier, J.-P. Paysages Régionaux du Québec Méridional; Publications du Québec: Sainte-Foy, QC, Canada, 1998; p. 213. [Google Scholar]
  18. Environment Canada. Canadian Climate Normals: 1981–2010 Climate Normals & Averages. Available online: http://climate.weather.gc.ca/climate_normals/index_e.html (accessed on 4 December 2016).
  19. Lajoie, P.G. Étude Pédologique des comtés de Gatineau et Pontiac, Québec; Service des recherches, Ministère de l’Agriculture du Canada, Ministère de l’Agriculture du Québec et Collège Macdonald, Université McGill: Montréal, QC, Canada, 1962. [Google Scholar]
  20. Lambert, M.C.; Ung, C.H.; Raulier, F. Canadian national tree aboveground biomass equations. Can. J. For. Res. 2005, 35, 1996–2018. [Google Scholar] [CrossRef]
  21. R Core Team. R: A Language and Environment for Statistical Computing; R Core Team: Vienna, Austria, 2016. [Google Scholar]
  22. Zuur, A.F. Mixed Effects Models and Extensions in Ecology with R; Springer: New York, NY, USA, 2009; p. 574. [Google Scholar]
  23. Pinheiro, J.; Bates, D.; DebRoy, S.; Sarkar, D.; Team, R.C. Nlme: Linear and Nonlinear Mixed Effects Models, R Package Version 3.1-128; 2016. Available online: http://CRAN.R-project.org/package=nlme (accessed on 21 October 2016).
  24. Wickham, H. Ggplot2: Elegant Graphics for Data Analysis; Springer: New York, NY, USA, 2009. [Google Scholar]
  25. Yanai, R.D. The effect of whole-tree harvest on phosphorus cycling in a northern hardwood forest. For. Ecol. Manag. 1998, 104, 281–295. [Google Scholar] [CrossRef]
  26. Tremblay, S.; Ouimet, R.; Houle, D.; Duchesne, L. Base cation distribution and requirement of three common forest ecosystems in eastern Canada based on site-specific and general allometric equations. Can. J. For. Res. 2012, 42, 1796–1809. [Google Scholar] [CrossRef]
  27. Arthur, M.A.; Siccama, T.G.; Yanai, R.D. Calcium and magnesium in wood of northern hardwood forest species: Relations to site characteristics. Can. J. For. Res. 1999, 29, 339–346. [Google Scholar] [CrossRef]
  28. Park, B.B.; Yanai, R.D. Nutrient concentrations in roots, leaves and wood of seedling and mature sugar maple and American beech at two contrasting sites. For. Ecol. Manag. 2009, 258, 1153–1160. [Google Scholar] [CrossRef]
  29. Vadeboncoeur, M.A.; Hamburg, S.P.; Yanai, R.D.; Blum, J.D. Rates of sustainable forest harvest depend on rotation length and weathering of soil minerals. For. Ecol. Manag. 2014, 318, 194–205. [Google Scholar] [CrossRef]
  30. Watmough, S.A.; Dillon, P.J. Base cation and nitrogen budgets for seven forested catchments in central Ontario, 1983–1999. For. Ecol. Manag. 2003, 177, 155–177. [Google Scholar] [CrossRef]
  31. Federer, C.A.; Hornbeck, J.W.; Tritton, L.M.; Martin, C.W.; Pierce, R.S.; Smith, C.T. Long-term depletion of calcium and other nutrients in eastern United States forests. Environ. Manag. 1989, 13, 593–601. [Google Scholar] [CrossRef]
  32. Houle, D.; Paquin, R.; Camire, C.; Ouimet, R.; Duchesne, L. Response of the Lake Clair watershed (Duchesnay, Quebec) to changes in precipitation chemistry (1988–1994). Can. J. For. Res. 1997, 27, 1813–1821. [Google Scholar] [CrossRef]
  33. Watmough, S.A.; Aherne, J.; Alewell, C.; Arp, P.; Bailey, S.; Clair, T.; Dillon, P.; Duchesne, L.; Eimers, C.; Fernandez, I.; et al. Sulphate, nitrogen and base cation budgets at 21 forested catchments in Canada, the United States and Europe. Environ. Monit. Assess. 2005, 109, 1–36. [Google Scholar] [PubMed]
  34. Ouimet, R.; Duchesne, L. Base cation mineral weathering and total release rates from soils in three calibrated forest watersheds on the Canadian Boreal Shield. Can. J. Soil Sci. 2005, 85, 245–260. [Google Scholar] [CrossRef]
  35. Phillips, T.; Watmough, S.A. A nutrient budget for a selection harvest: Implications for long-term sustainability. Can. J. For. Res. 2012, 42, 2064–2077. [Google Scholar] [CrossRef]
  36. Gradowski, T.; Thomas, S.C. Phosphorus limitation of sugar maple growth in central Ontario. For. Ecol. Manag. 2006, 226, 104–109. [Google Scholar] [CrossRef]
  37. Vadeboncoeur, M.A. Meta-analysis of fertilization experiments indicates multiple limiting nutrients in northeastern deciduous forests. Can. J. For. Res. 2010, 40, 1766–1780. [Google Scholar] [CrossRef]
  38. Akselsson, C.; Westling, O.; Alveteg, M.; Thelin, G.; Fransson, A.M.; Hellsten, S. The influence of N load and harvest intensity on the risk of P limitation in Swedish forest soils. Sci. Total Environ. 2008, 404, 284–289. [Google Scholar] [CrossRef] [PubMed]
  39. Vanguelova, E.; Pitman, R.; Luiro, J.; Helmisaari, H.S. Long term effects of whole tree harvesting on soil carbon and nutrient sustainability in the UK. Biogeochemistry 2010, 101, 43–59. [Google Scholar] [CrossRef]
  40. Zetterberg, T.; Olsson, B.A.; Löfgren, S.; Hyvönen, R.; Brandtberg, P.-O. Long-term soil calcium depletion after conventional and whole-tree harvest. For. Ecol. Manag. 2016, 369, 102–115. [Google Scholar] [CrossRef]
  41. Thiffault, E.; Bechard, A.; Pare, D.; Allen, D. Recovery rate of harvest residues for bioenergy in boreal and temperate forests: A review. Wiley Interdiscip. Rev. Energy Environ. 2015, 4, 429–451. [Google Scholar] [CrossRef]
Figure 1. Cumulative proportion of nutrients and biomass within each of the branch compartments that were defined in the present study: large branches (LB; 10–5 cm), medium branches (MB; 5–2 cm), and small branches (SB; <2 cm). Values correspond to the parameters from the fixed part of the model with their associated standard errors. The upper panel illustrates the interaction between the branch parameter and tree species for an average-sized tree (DBH = 24 cm). The lower panel reports the interaction between branch parameter and tree DBH. SM = Sugar maple, YB = Yellow birch.
Forests 08 00041 g001
Figure 2. Average mass per unit area (kg·ha−1) of exported biomass and nutrients as a function of biomass harvest intensity, stand composition, and tree marking procedure. Only variables explaining more than 1% in the variation of nutrient export are presented in this figure. Red lines correspond to diameter-limit cutting, blue lines represent selective cutting, solid lines are for pure sugar maple stands, and dashed lines correspond to mixed sugar maple-yellow birch stands. The black line for P correspond to the values averaged over both tree marking procedure. SOH = stem only harvesting, SLH = stem + large branch harvesting, SLMH = stem, large + medium branch harvesting, WTH = whole tree harvesting. Error bars correspond to standard deviations.
Forests 08 00041 g002
Table 1. Biomass estimates and measured nutrient concentrations for each branch and stem compartment that was defined in this study. Biomass values are presented per DBH (diameter at breast height, 1.3 m) class. The stem compartment was separated into stem bark and stem wood. For further analysis and interpretation, branches with a diameter larger than 10 cm were included in the stem compartment. Values in parentheses are standard deviation. SM = sugar maple, YB = yellow birch.
Tree SpeciesCompartmentBiomass (kg)
12–17 cm18–23 cm24–29 cm30–35 cm
SMStem bark11 (1.4)21.1 (3.6)43.8 (11.7)64.3 (15.9)
Stem wood63.8 (8.2)127.4 (23)286.9 (79.4)442.9 (113.1)
Branches > 10 cm7.0 (0.6)11.0 (1.4)13.9 (1.6)14.1 (0.7)
Large branches22.8 (8.5)21.3 (8.9)41.3 (13.4)94.4 (41)
Medium branches14.6 (4.1)28.1 (8.4)50.4 (14.5)78.2 (14.6)
Small branches14.3 (3.9)18.9 (5.2)36.2 (11.6)44.7 (13)
YBStem bark6.8 (2.9)17.9 (4.2)37.7 (5.1)58.9 (10)
Stem wood53.6 (22.4)137 (31.7)282.3 (38.9)432.5 (73.8)
Branches > 10 cm5.6 (1.6)9.5 (1.5)13.0 (1.7)14.5 (1.7)
Large branches20.3 (6.2)29.9 (14.4)56.3 (34.6)72.3 (16.1)
Medium branches18.3 (6.9)39.1 (9.3)61.3 (12.2)86.8 (28.3)
Small branches18.9 (5.1)39.4 (7.9)57.2 (10.3)65.9 (14)
Tree SpeciesCompartmentNutrient Concentration (mg/kg)
NPKCaMg
SMStem bark9833 (961)153 (64)3396 (857)27,500 (4054)855 (157)
Stem wood4849 (681)75 (57)742 (323)1425 (606)182 (54)
Large branches5330 (633)146 (96)1114 (286)3775 (1382)280 (71)
Medium branches4107 (1578)309 (235)1373 (210)4713 (1492)306 (65)
Small branches9890 (3448)638 (405)3017 (369)8296 (1201)559 (117)
YBStem bark10,301 (947)107 (65)1304 (359)10,784 (3968)355 (94)
Stem wood4747 (734)93 (62)478 (138)748 (239)117 (36)
Large branches4923 (940)126 (88)718 (280)2243 (1475)255 (72)
Medium branches4355 (1633)335 (268)823 (145)2704 (1054)308 (53)
Small branches10,612 (4518)671 (392)2204 (329)6333 (1903)743 (158)
Table 2. Output from the tree selection models for the cumulative nutrient and biomass proportions in each branch compartment. The significance of each term (main effects and interactions) in the selected model is presented on the left-hand side of the table. Note that the term branch parameter (BP) included biomass and thus had six levels. Pairwise comparisons of each nutrient with biomass (the reference level) are provided on the right-hand side of the table. These last comparisons were repeated for sugar maple and yellow birch, given that the branch parameter x tree species interaction (BP:sp) was significant for each model. sp = tree species, numDF = numerator degrees-of-freedom, denDF = denominator degrees-of-freedom.
Branch CompartmentMain Effects and InteractionsPairwise Comparisons with Biomass Proportion
TermnumDFdenDFF-Valuep-ValueNutrientSugar MapleYellow birch
t-Valuep-Valuet-Valuep-Value
Large branches (LB)(Intercept)1225133,196.560.0000N−1.4730.1420−2.1900.0296
BP52259.370.0000P0.5000.61780.4340.6647
DBH1456.690.0130K−1.2210.2235−0.2810.7792
sp1452.040.1604Ca−3.0550.0025−1.0810.2810
BP:DBH52253.420.0054Mg−2.4270.01602.4770.0140
BP:sp52258.400.0000
Medium branches (MB)(Intercept)122591,335.320.0000N−1.5770.1162−1.9700.0501
BP522537.490.0000P0.4880.62620.5910.5550
DBH1457.630.0083K−0.5400.58990.7870.4323
sp1458.640.0052Ca−2.8680.0045−0.0810.9353
BP:DBH52252.960.0131Mg−1.3160.18954.3690.0000
BP:sp522517.330.0000
Small branches (SB)(Intercept)123064,708.900.0000N2.8250.00513.0810.0023
BP523097.830.0000P7.4970.00008.6760.0000
DBH14520.480.0000K9.6410.000013.4490.0000
sp14515.700.0003Ca2.7260.00697.9620.0000
BP:sp523037.680.0000Mg7.7810.000015.2410.0000
Table 3. Output from the six models applied on nutrient export with biomass harvest from the virtual stands. For each nutrient, the table presents the sum of squares, the proportion of the variance explained (%), and the F value related to each term included in the models. Values in bold indicate the terms selected for graphical exploration that explained more than 1% of the variance.
Terms in the ModelDfBiomassNP
Variance ExplainedF-ValueVariance ExplainedF-ValueVariance ExplainedF-Value
Intensity380.391,007,52185.24111,459.5791.9896,438.34
Composition10.028550.14554.640.451407.89
Marking118.73704,36210.0839,521.460.0121.79
Intensity: Composition30.1519290.32422.602.322437.55
Intensity: Marking30.1316860.11140.740.12126.88
Composition: Marking10.1348500.03104.350.0011.02
Intensity: Composition: Marking30.01800.0110.230.0438.76
Residuals15,9840.43 4.07 5.08
Terms in the ModelDfKCaMg
Variance ExplainedF-ValueVariance ExplainedF-ValueVariance ExplainedF-Value
Intensity374.6948,739.9043.9839,680.2278.75110,919.35
Composition114.5728,523.5039.88107,947.9510.1542,897.88
Marking11.983869.759.8826,734.006.1826,133.32
Intensity: Composition30.21134.860.19174.580.851190.45
Intensity: Marking30.1280.590.14124.860.23321.99
Composition: Marking10.26508.560.0240.660.04175.67
Intensity: Composition: Marking30.002.360.003.300.0114.84
Residuals15,9848.17 5.91 3.78

